
Effects of timing of food intake and fat/carbohydrate ratio on insulin sensitivity and preconditioning against renal ischemia reperfusion injury by calorie restriction
Abstract
BACKGROUND:
Dietary restriction (DR) improves lifespan, metabolic fitness and resilience in many organisms, but the role of dietary macronutrient composition and timing of food intake in specific benefits remains unclear.
OBJECTIVE:
We sought to compare the effects of two isocaloric DR regimes differing in the timing of food intake - every other day (EOD) fasting/feeding vs. daily calorie restriction (CR) – at two different fat/carbohydrate ratios on two well-established DR benefits, improved glucose homeostasis and protection from renal ischemia reperfusion injury in mice. We hypothesized that both EOD fasting and isocaloric CR would result in similar improvements in glucose homeostasis and stress resistance independent of macronutrient composition.
METHODS:
Six groups of mice were fed either semi-purified low-fat diet (LFD, 10% calories from fat) or high-fat diet (HFD, 60% calories from fat) and randomized into one of three dietary regimens: 1) ad libitum (AL), 2) EOD feeding/fasting, or 3) pair-fed daily to the average daily EOD intake within LFD or HFD feeding group resulting in daily CR. After 6 weeks, the following assessments were made: fasting blood glucose, glucose and insulin tolerance, and resistance to bilateral renal ischemia reperfusion injury using serum urea as a marker of renal function. Within the EOD group, the effects of prior day feeding (EODfed vs. EODfast) were also assessed.
RESULTS:
EOD mice ate ∼20–25% less food over time than AL mice on the corresponding LFD or HFD. EOD and CR mice displayed changes in body weight, fasting blood glucose levels and glucose tolerance commensurate with total calorie intake. No significant differences were observed in circulating IGF-1 levels. Insulin sensitivity improved independent of fat/carbohydrate ratio on daily CR and EODfast regimens, but not EODfed. HFD increased susceptibility to renal ischemia reperfusion in AL mice, while CR and EOD regimens gave significant protection independent of dietary fat content or fed or fasted day in the EOD group.
CONCLUSIONS:
Reduced food intake protects mice against renal ischemia reperfusion injury within 6 weeks independent of timing of food intake (CR, EODfast, EODfed) or fat content of diet (10% vs. 60%). Neither circulating IGF-1 levels (unchanged) nor whole-body insulin sensitivity (improved upon daily CR and EODfast but not EODfed) correlated with protection, so are unlikely to be involved mechanistically.
1Introduction
Dietary restriction (DR), defined as a reduction in total calories or other macronutrients without malnutrition, extends lifespan and healthspan in organisms from yeast to primates [1] and has emerged as a potential intervention to treat metabolic alterations due to overnutrition [2]. DR was first shown to extend the lifespan of rats in 1935 [3]. Since then, longevity benefits of DR have been demonstrated in multiple organisms, including a lifespan extension of up to three-fold in yeast and worms, two-fold in flies, and 60 percent in mice [4].
DR regimens vary widely, but can be binned into two general classes: those fed on an ad libitum (AL) basis, and those in which access to food is restricted. Examples of the former include methionine restriction [5] and protein dilution [6] in which benefits occur without enforced food restriction. Examples of the latter include calorie restriction (CR) and every-other-day (EOD) feeding/fasting. CR is most often expressed as a percentage of food eaten by an AL group, with a feeding schedule typically involving once daily or thrice weekly food allotments. In EOD fasting, 24hr water-only fasting alternates with 24hr AL feeding; however, because animals typically don’t eat twice the normal daily AL intake, the result over time is typically a restriction of overall calorie intake. EOD and CR regimens involving enforced food restriction are also sometimes referred to as intermittent fasting, as they involve extended periods of fasting between meals.
Although DR does not extend lifespan in all species or under all conditions, it does reliably improve markers of healthspan across evolutionary boundaries, including in non-human primates and in humans [7]. For example, in overweight humans, EOD fasting reduces markers of oxidative stress and inflammation [8], while in non-obese adults, CR improves insulin sensitivity and blood pressure [9]. Importantly, CR, EOD fasting and even short-term fasting also improve resistance to acute stressors in animal models, including neuronal excitotoxicity, ischemia reperfusion injury to multiple organs, and genotoxicity of certain chemotherapeutic agents [10–13].
Due to the variety of different DR regimens that can extend longevity, improve metabolic fitness and increase stress resistance, determining which factors within these regimens are important for efficacy across the range of pleiotropic DR benefits remains challenging. Here we focused on the potential roles of dietary macronutrient composition and meal frequency by comparing the effects of two extremes of fat/carbohydrate ratio on glucose homeostasis and stress resistance induced by isocaloric EOD or CR regimens differing only in the timing of food intake. We hypothesized that both EOD fasting and isocaloric CR would result in similar improvements in glucose homeostasis and stress resistance independent of macronutrient composition.
2Materials and methods
2.1Mice
Eight-week-old male B6D2F1 mice were purchased from the Jackson Laboratory. Animals were kept under standard laboratory conditions and allowed free access to water and food except as noted. All experiments were performed with the approval of the appropriate institutional animal care and use committee.
Fig.1
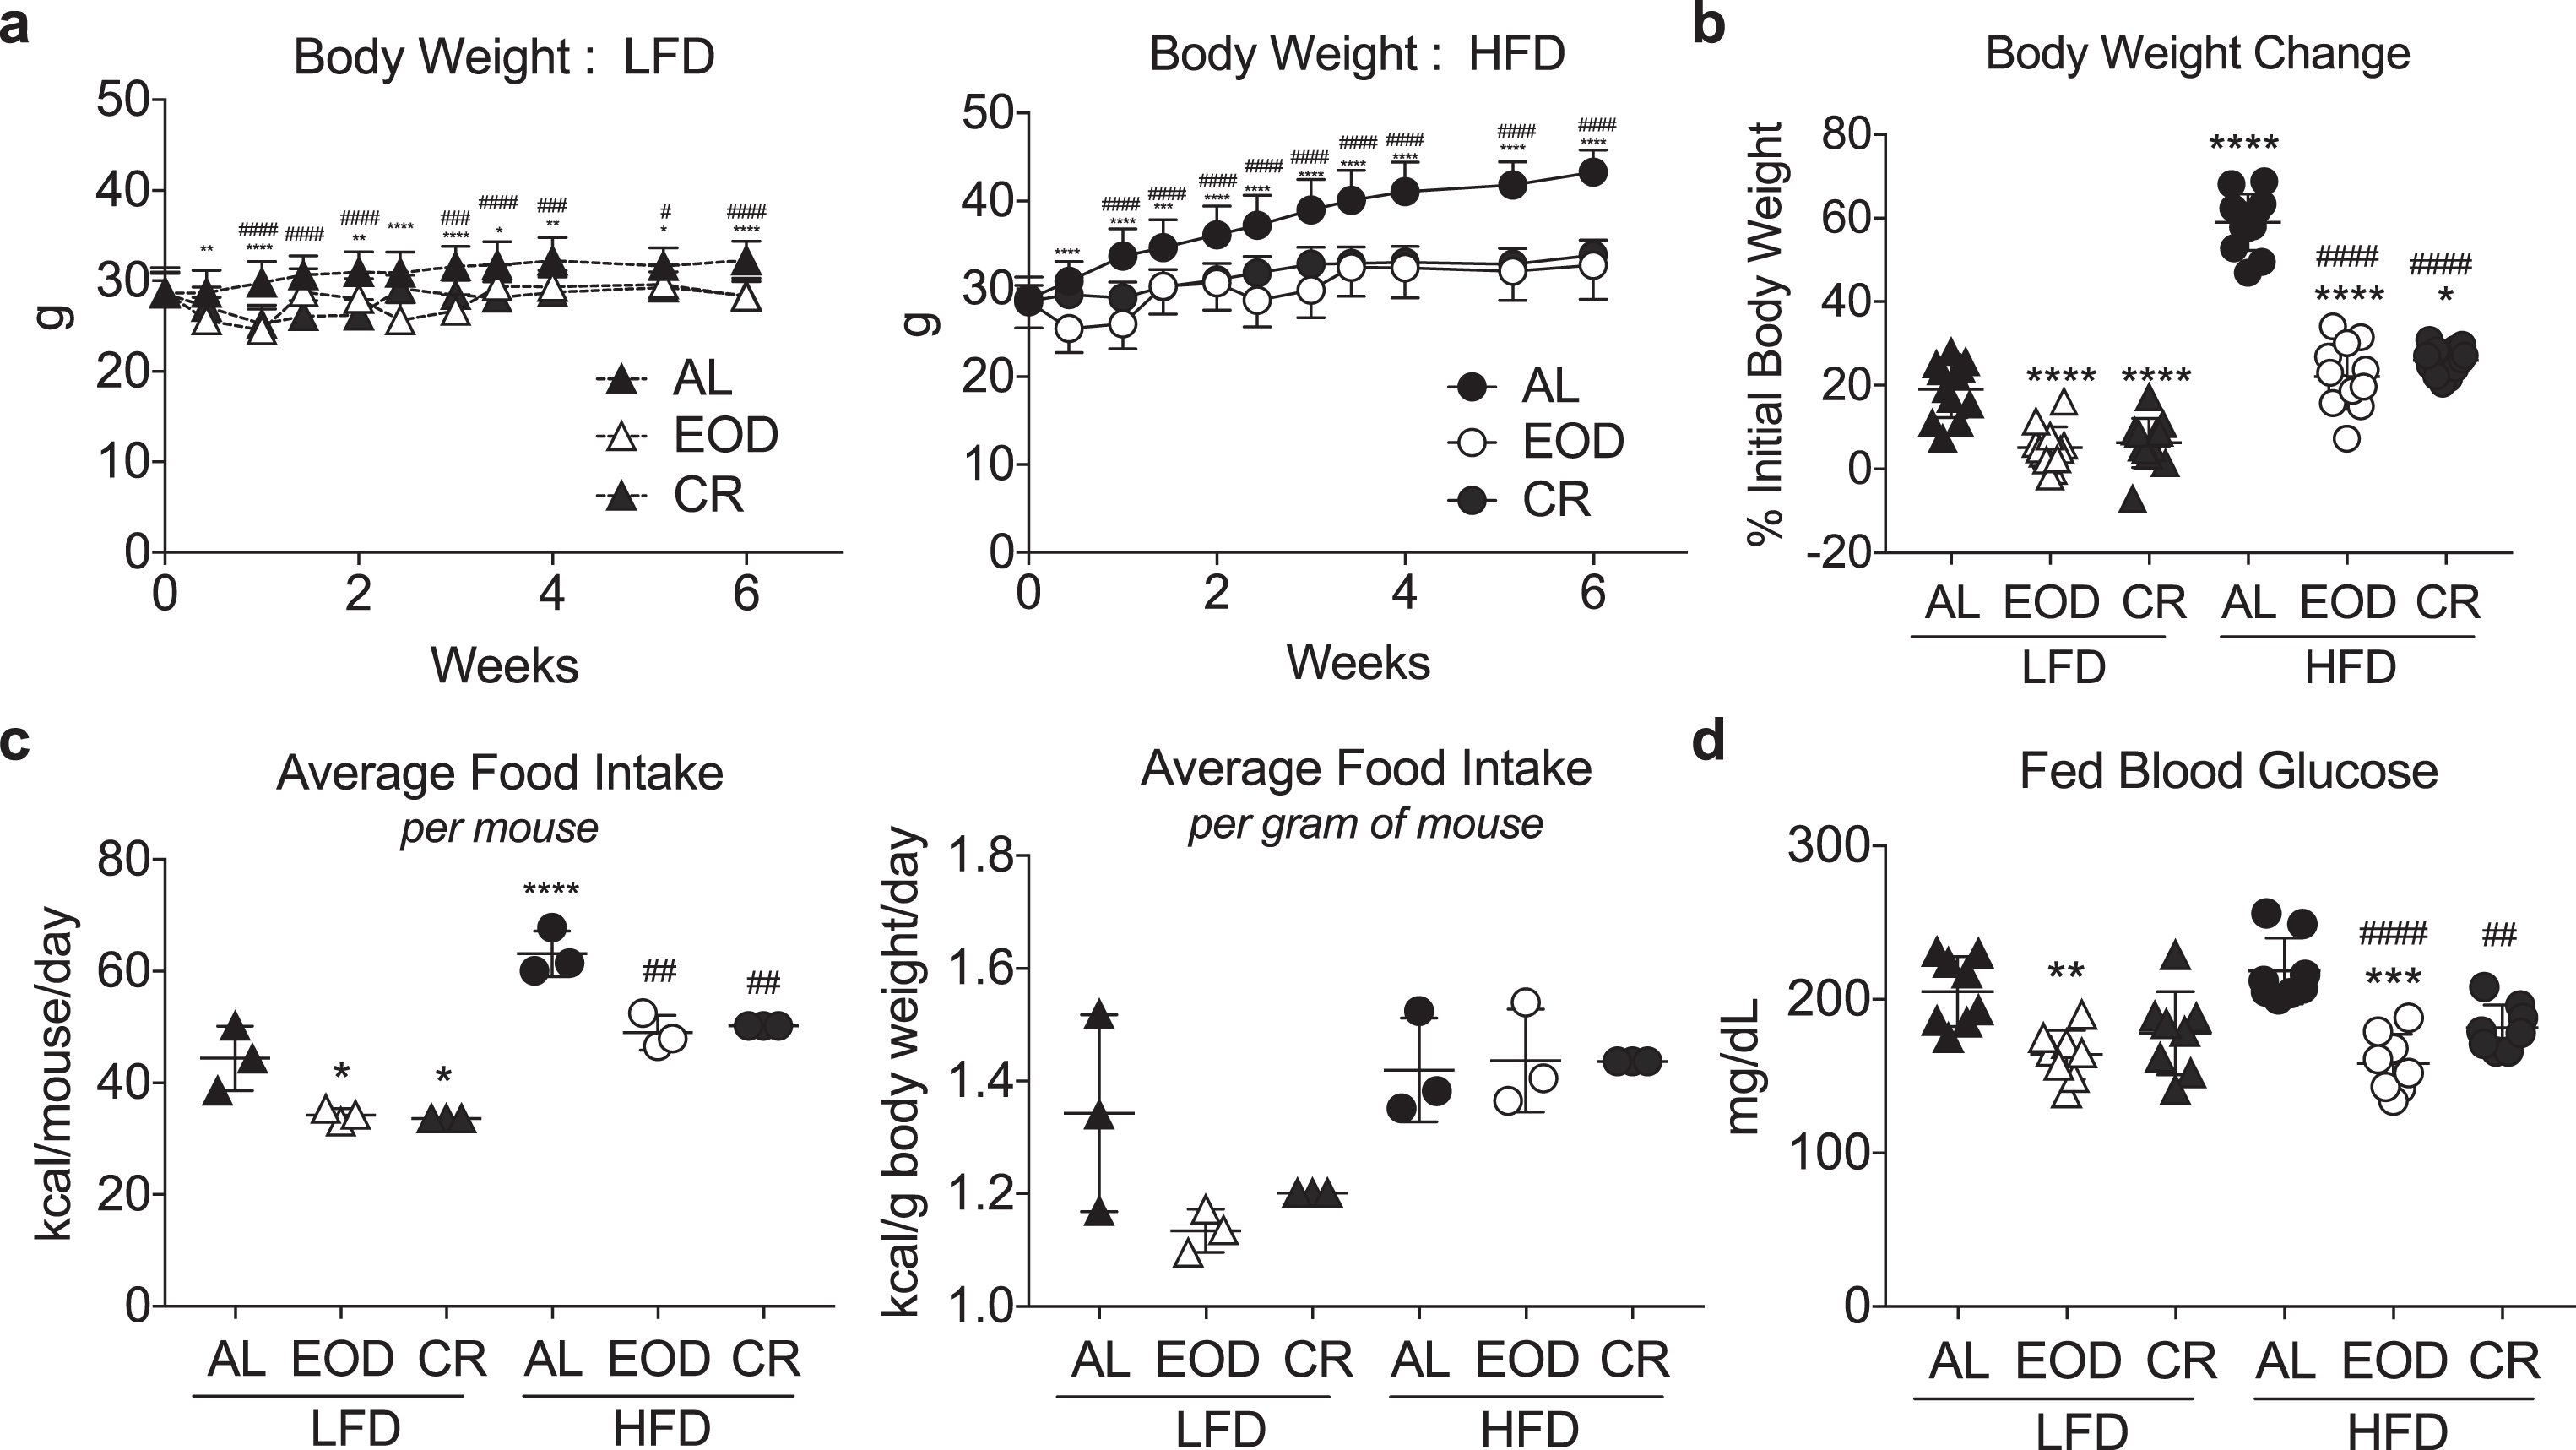
Modulation of body weight and blood glucose with different intermittent fasting regimens and diets. (a) Time-dependent changes in body weight over 6 weeks of the indicated dietary regimen (AL, EOD or CR) on LFD (left) or HFD (right). Asterisk: AL vs. EOD; pound sign: AL vs. CR within diet group using repeated measures two-way ANOVA with a Dunnett’s post-hoc test. (b) Final body weight expressed as a percent change of initial body weight. (c) Average food intake in kcal/mouse/day (left) or kcal/gram of mouse body weight/day over the course of 6 weeks of dietary intervention. Each symbol represents a separate cage of 4 animals. (d) Fed blood glucose levels following 6 weeks on the indicated diet, and after a fed day in the EOD groups. (b-d) Asterisk: comparison of all groups to AL LFD; pound sign: comparison of HFD groups to AL HFD using one-way ANOVA with a Sidak’s post-hoc test; */#P < 0.05, **/# #P < 0.01, ***/# # #P < 0.001, ****/# # # #P < 0.0001. All data are expressed as mean±SD.
2.2Diets
Fig.2
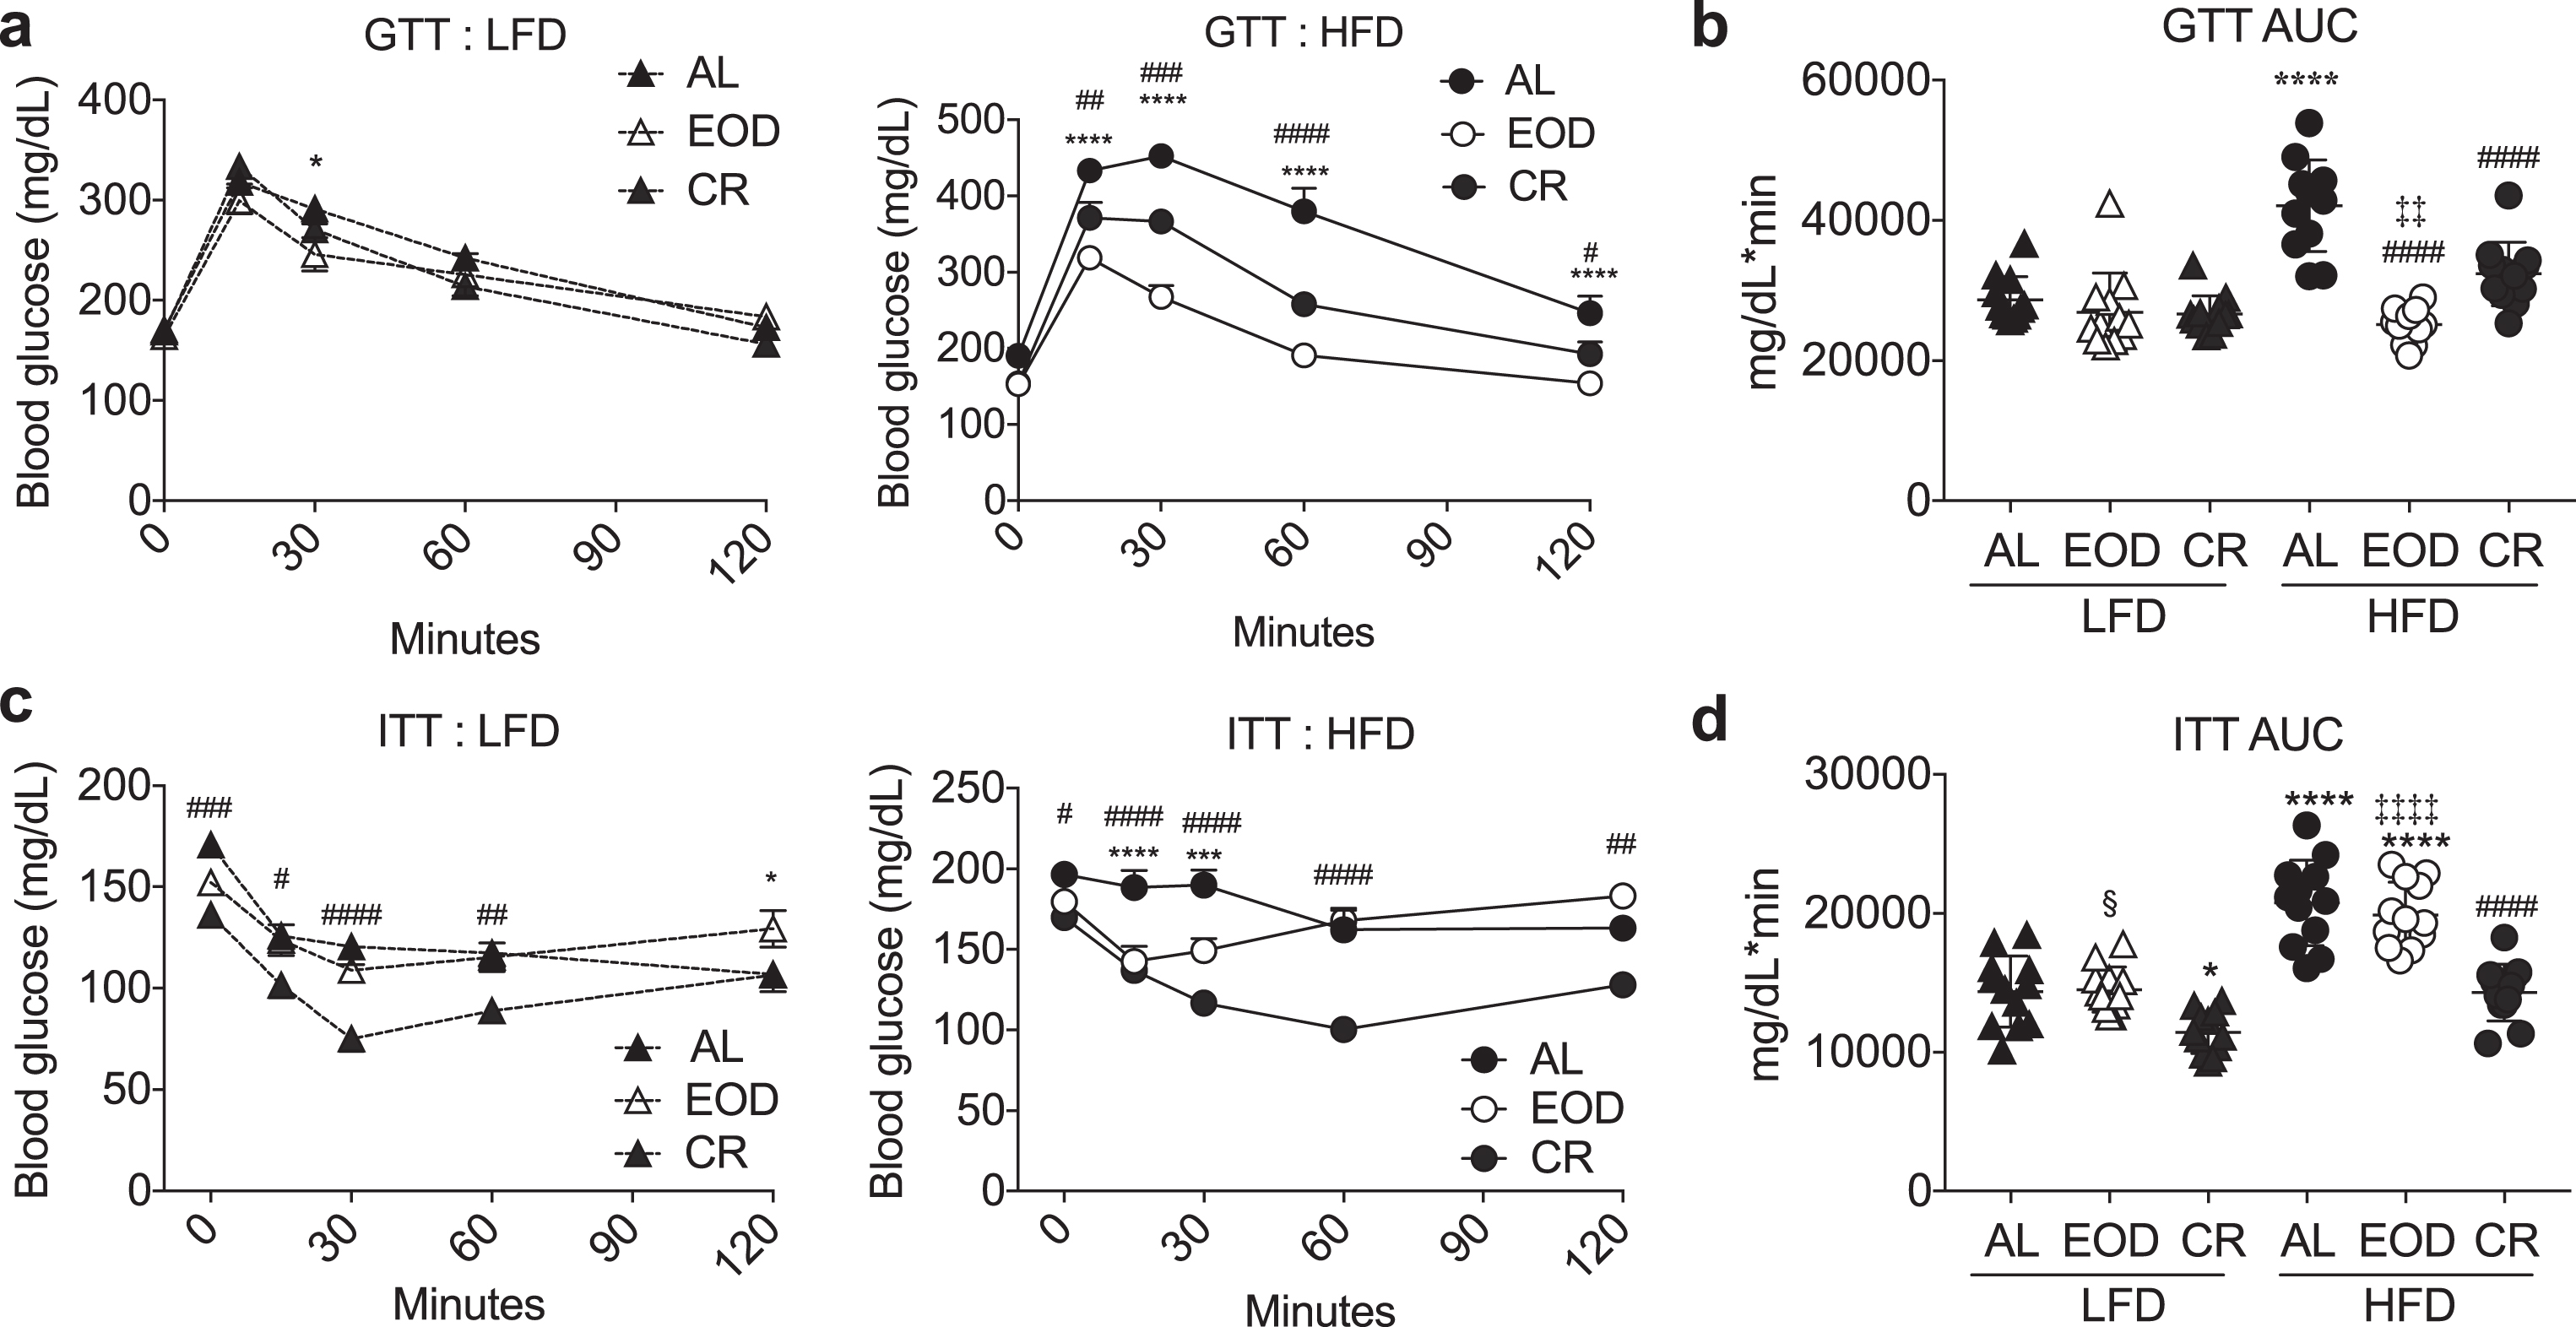
Effects of intermittent fasting on glucose homeostasis. (a-d) Glucose tolerance test. Time-dependent changes in blood glucose (a: LFD left, HFD right) and AUC (b) following a bolus injection of glucose into animals on the indicated diets for 6 weeks. (c, d) Insulin tolerance test. Time-dependent changes in blood glucose (c: LFD left, HFD right) and AUC (d) following a bolus injection of insulin to animals on the indicated diets for 6 weeks. (a, c) Asterisk: AL vs. EOD; pound sign: AL vs. CR within diet group using repeated measures two-way ANOVA with a Dunnett’s post-hoc test. (b, d) Asterisks: comparison of all groups to AL LFD; pound sign: comparison of HFD groups to AL HFD; double cross: comparison between EOD and CR within HFD; squiggle: comparison between EOD and CR within LFD using one-way ANOVA with a Sidak’s post-hoc test; */#/§P < 0.05, **/# #/‡‡P < 0.01, ***/# # #P < 0.001, ****/# # # #/‡‡‡‡P < 0.0001. All data are expressed as mean±SD.
Semi-purified diets were purchased from Research Diets (New Brunswick, NJ, USA) including high fat diet (HFD; D12492, 60% calories from fat (soybean oil, lard), 20% from protein (casein) and 20% from carbohydrate (corn starch, maltodextrin 10, sucrose) and low-fat diet (LFD) with the same semi-purified ingredients in the ratio of 10% fat, 20% protein, 70% carbohydrate (D12450B). The two diets (HFD, LFD) were provided according to one of three feeding paradigms: 1.) ad libitum (AL); 2.) on an every-other-day (EOD) basis; or 3.) under daily calorie restriction (CR) by pair-feeding to the average daily calorie intake of the EOD group within LFD or HFD, resulting in a total of six dietary intervention groups. Mice on EOD or daily CR regimens were fed or fasted as appropriate before lights off at approximately 6PM daily. Fasting was performed by transferring mice to a clean cage without food for up to three days; all mice had unlimited access to water at all times.
2.3Blood glucose determination, glucose and insulin tolerance tests
Glucose and insulin tolerance tests were performed after a 4–5 h fast by intraperitoneal injection of 0.5 units insulin/kg (ITT; Insulin (Humalog) diluted 7.6 uL into a total of 10 mL of PBS) or 2 mg/kg glucose (GTT). Blood glucose was measured before and after from tail blood at indicated time points using the OneTouch glucose monitoring system (Lifescan, Milpitas, CA, USA).
2.4Renal ischemia reperfusion injury
Mice were anesthetized by isoflurane inhalation, and body temperature was maintained on a water-circulating heat pad until recovery from anesthesia. After a midline abdominal incision, the left renal pedicle was localized and the renal artery and vein were occluded for 25 min with an atraumatic microvascular clamp (Roboz). The procedure was repeated immediately on the right kidney. After inspection for signs of ischemia (purple color in kidney), the incision was covered with PBS-soaked cotton and the animal was placed under a heating pad and an aluminum foil blanket to maintain body temperature. After release of the clamp, restoration of blood flow was confirmed by return of the ischemic organ to normal color. Animals were then placed in clean cages and allowed ad libitum access to a complete LFD diet after surgery. Serum urea and creatinine levels were measured from blood drawn prior to surgery or on the indicated day after surgery with QuantiChrom assay kits (BioAssay Systems) based on the improved Jung and Jaffe methods, respectively.
2.5IGF-1 determination
Serum IGF-1 levels were determined by enzyme-linked immunosorbent assay (R&D Systems) according to manufacturer’s instructions.
2.6Statistics
Data are expressed as mean±SD. Statistical analyses were performed in GraphPad Prism. Longitudinal data including body weight, GTT, ITT and serum urea after ischemia reperfusion injury were analyzed by repeated measures two-way ANOVA with Dunnett’s post-hoc test within HFD or LFD; area under the curve data were used subsequently for analysis by Student’s T test or one-way ANOVA with Sidak’s post-hoc test.
3Results
3.1Modulation of body weight and blood glucose with different intermittent fasting regimens and diets
Male B6D2F1 hybrids were fed a LFD or HFD, either ad libitum (AL) or on one of two different DR regimens: EOD fasting/feeding or daily CR. The latter was pair-fed to the average daily food intake of the corresponding EOD diet group in order to isolate the effects of differential timing of food intake. Over a 6 week period, mice subjected to DR (EOD/CR) gained significantly less weight than their AL counterparts (Fig. 1a-b). Relative weight gain was largely a reflection of food consumption. In mice fed AL, those on a HFD consumed significantly more calories per mouse (Fig. 1c, left), and a trend toward more calories per g body weight (Fig. 1c, right). EOD mice given AL access on alternating days also ate more calories of the HFD than LFD, accounting for differences in weights between diet groups. However, relative to their AL counterparts, EOD mice ate significantly less calories over time, thus mitigating weight gain. Daily pair feeding to the average EOD kcal/gram of mouse basis within LFD and HFD groups resulted in similar changes in body weight as EOD in the corresponding CR groups (Fig. 1b).
Fig.3
Effects of intermittent fasting on resistance to renal ischemia reperfusion injury. (a-b) Serum urea over the first 14 days (a) and AUC (b) following renal ischemia reperfusion injury in mice preconditioned for 6 weeks on the indicated diet and returned to AL LFD after surgery. (a) Asterisk: AL vs. EOD; pound sign: AL vs. CR within diet group using repeated measures two-way ANOVA with a Dunnett’s post-hoc test. (b) Asterisks: comparison of all groups to AL LFD; pound sign: comparison of HFD groups to AL HFD; double cross: comparison between EOD and CR within HFD using one-way ANOVA with a Sidak’s post-hoc test; #/‡P < 0.05, **/# #P < 0.01, ***/# # #P < 0.001, ***/# # # #P < 0.0001. All data are expressed as mean±SD.
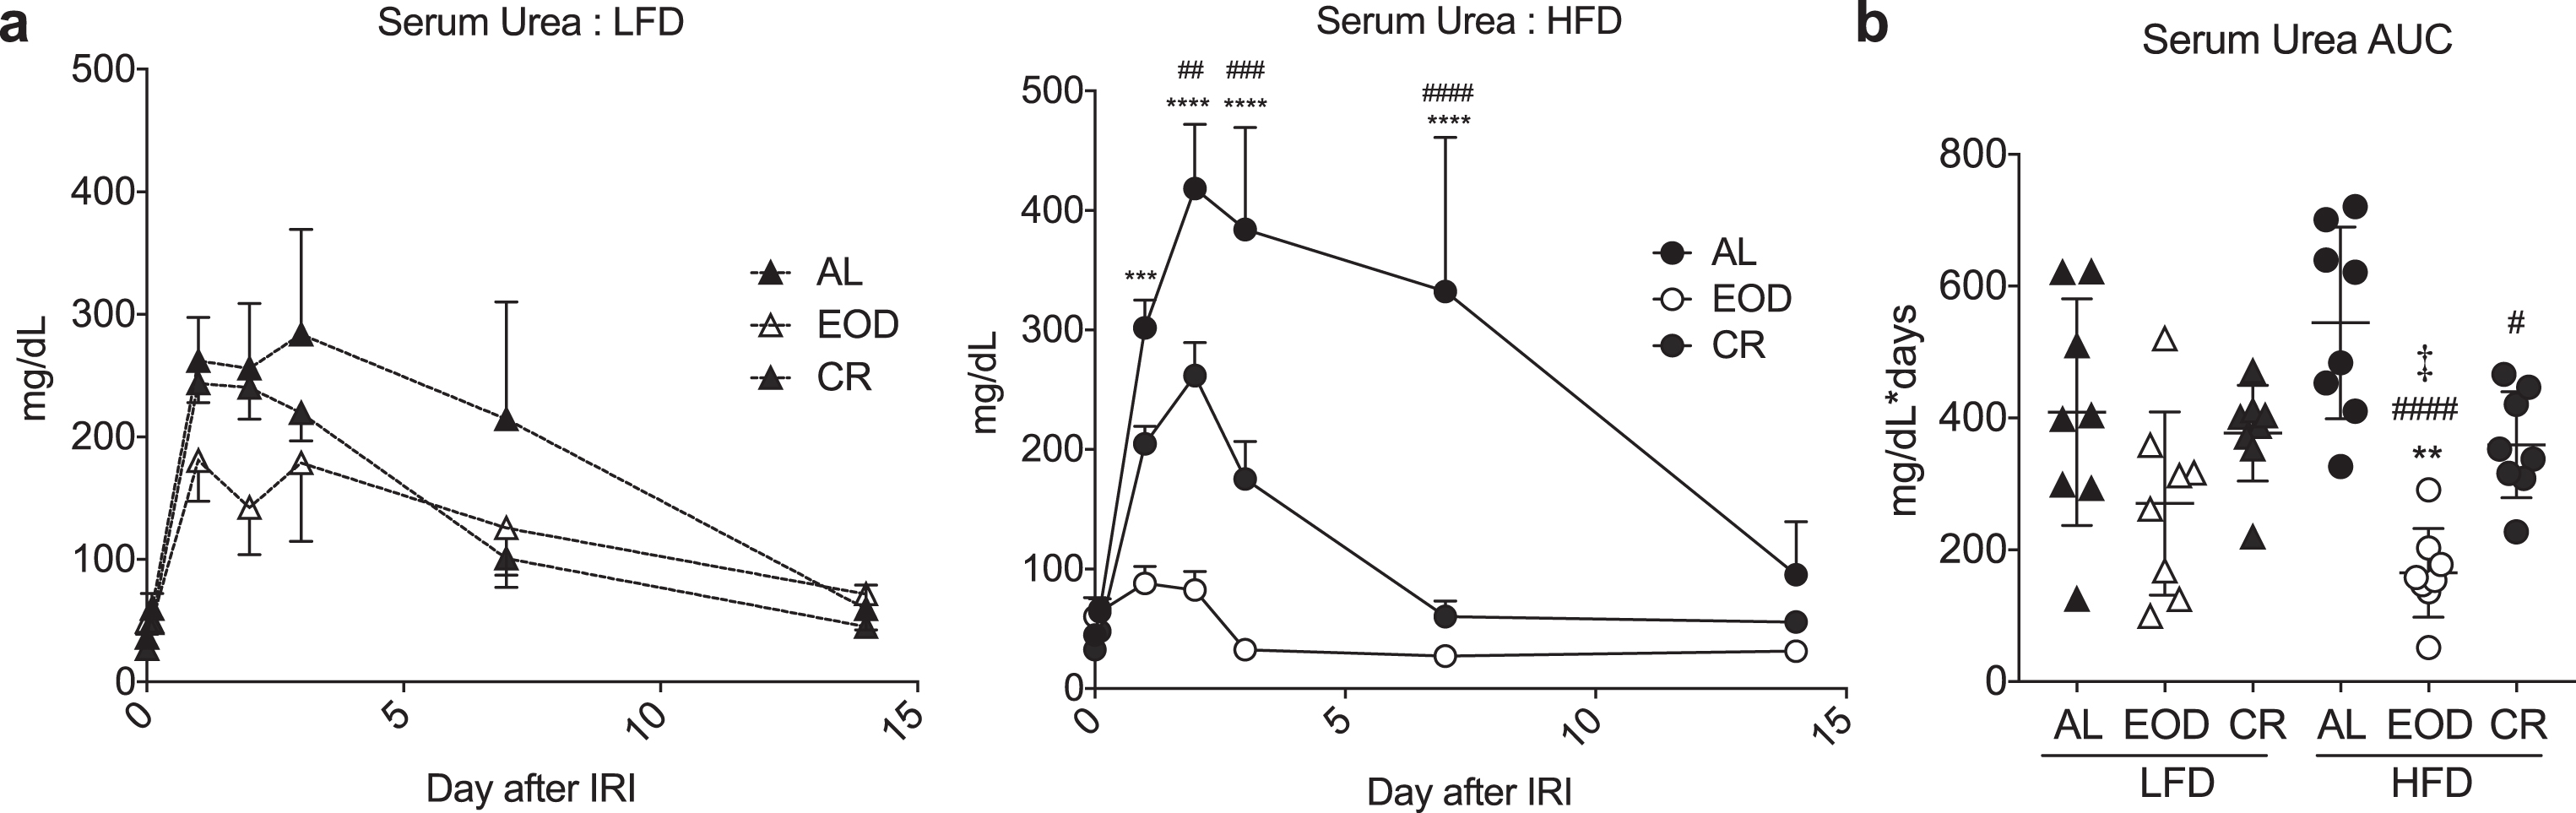
Fig.4
Effects of EOD fed or fasted day on glucose homeostasis. (a) Time-dependent changes in body weight over 6 weeks of the indicated dietary regimen on LFD (left) or HFD (right). Asterisk: AL vs. EOD; pound sign: AL vs. CR within diet group using repeated measures two-way ANOVA with a Dunnett’s post-hoc test. (b) Final body weight expressed as a percent change of initial body weight. Asterisk: comparison of all groups to AL LFD; pound sign: comparison of HFD groups to AL HFD using one-way ANOVA with a Sidak’s post-hoc test; (c) Fasted blood glucose following the indicated dietary interventions, with EOD groups assessed after fed or fasting days as indicated. (d, e) Insulin tolerance test. Time-dependent changes in blood glucose (d: LFD left, HFD right) and AUC (e) following a bolus injection of insulin to animals on the indicated diets for 6 weeks. (d) Asterisk: AL vs. EODfed; pound sign: AL vs. EODfast; squiggle: AL vs. CR, using repeated measures two-way ANOVA within diet with a Dunnett’s post-hoc test. (c, e) Asterisk: comparison of all groups to AL LFD; pound sign: comparison of HFD groups to AL HFD; squiggle: comparison between EOD groups and CR within LFD; double cross: comparison between EOD groups and CR within HFD using one-way ANOVA with a Sidak’s post-hoc test; */#/‡/§P < 0.05, **/# #/‡‡/§§P < 0.01, ***/# # #/‡‡‡/§§§P < 0.001, ****/# # # #/‡‡‡‡/§§§§P < 0.0001. All data are expressed as mean±SD.
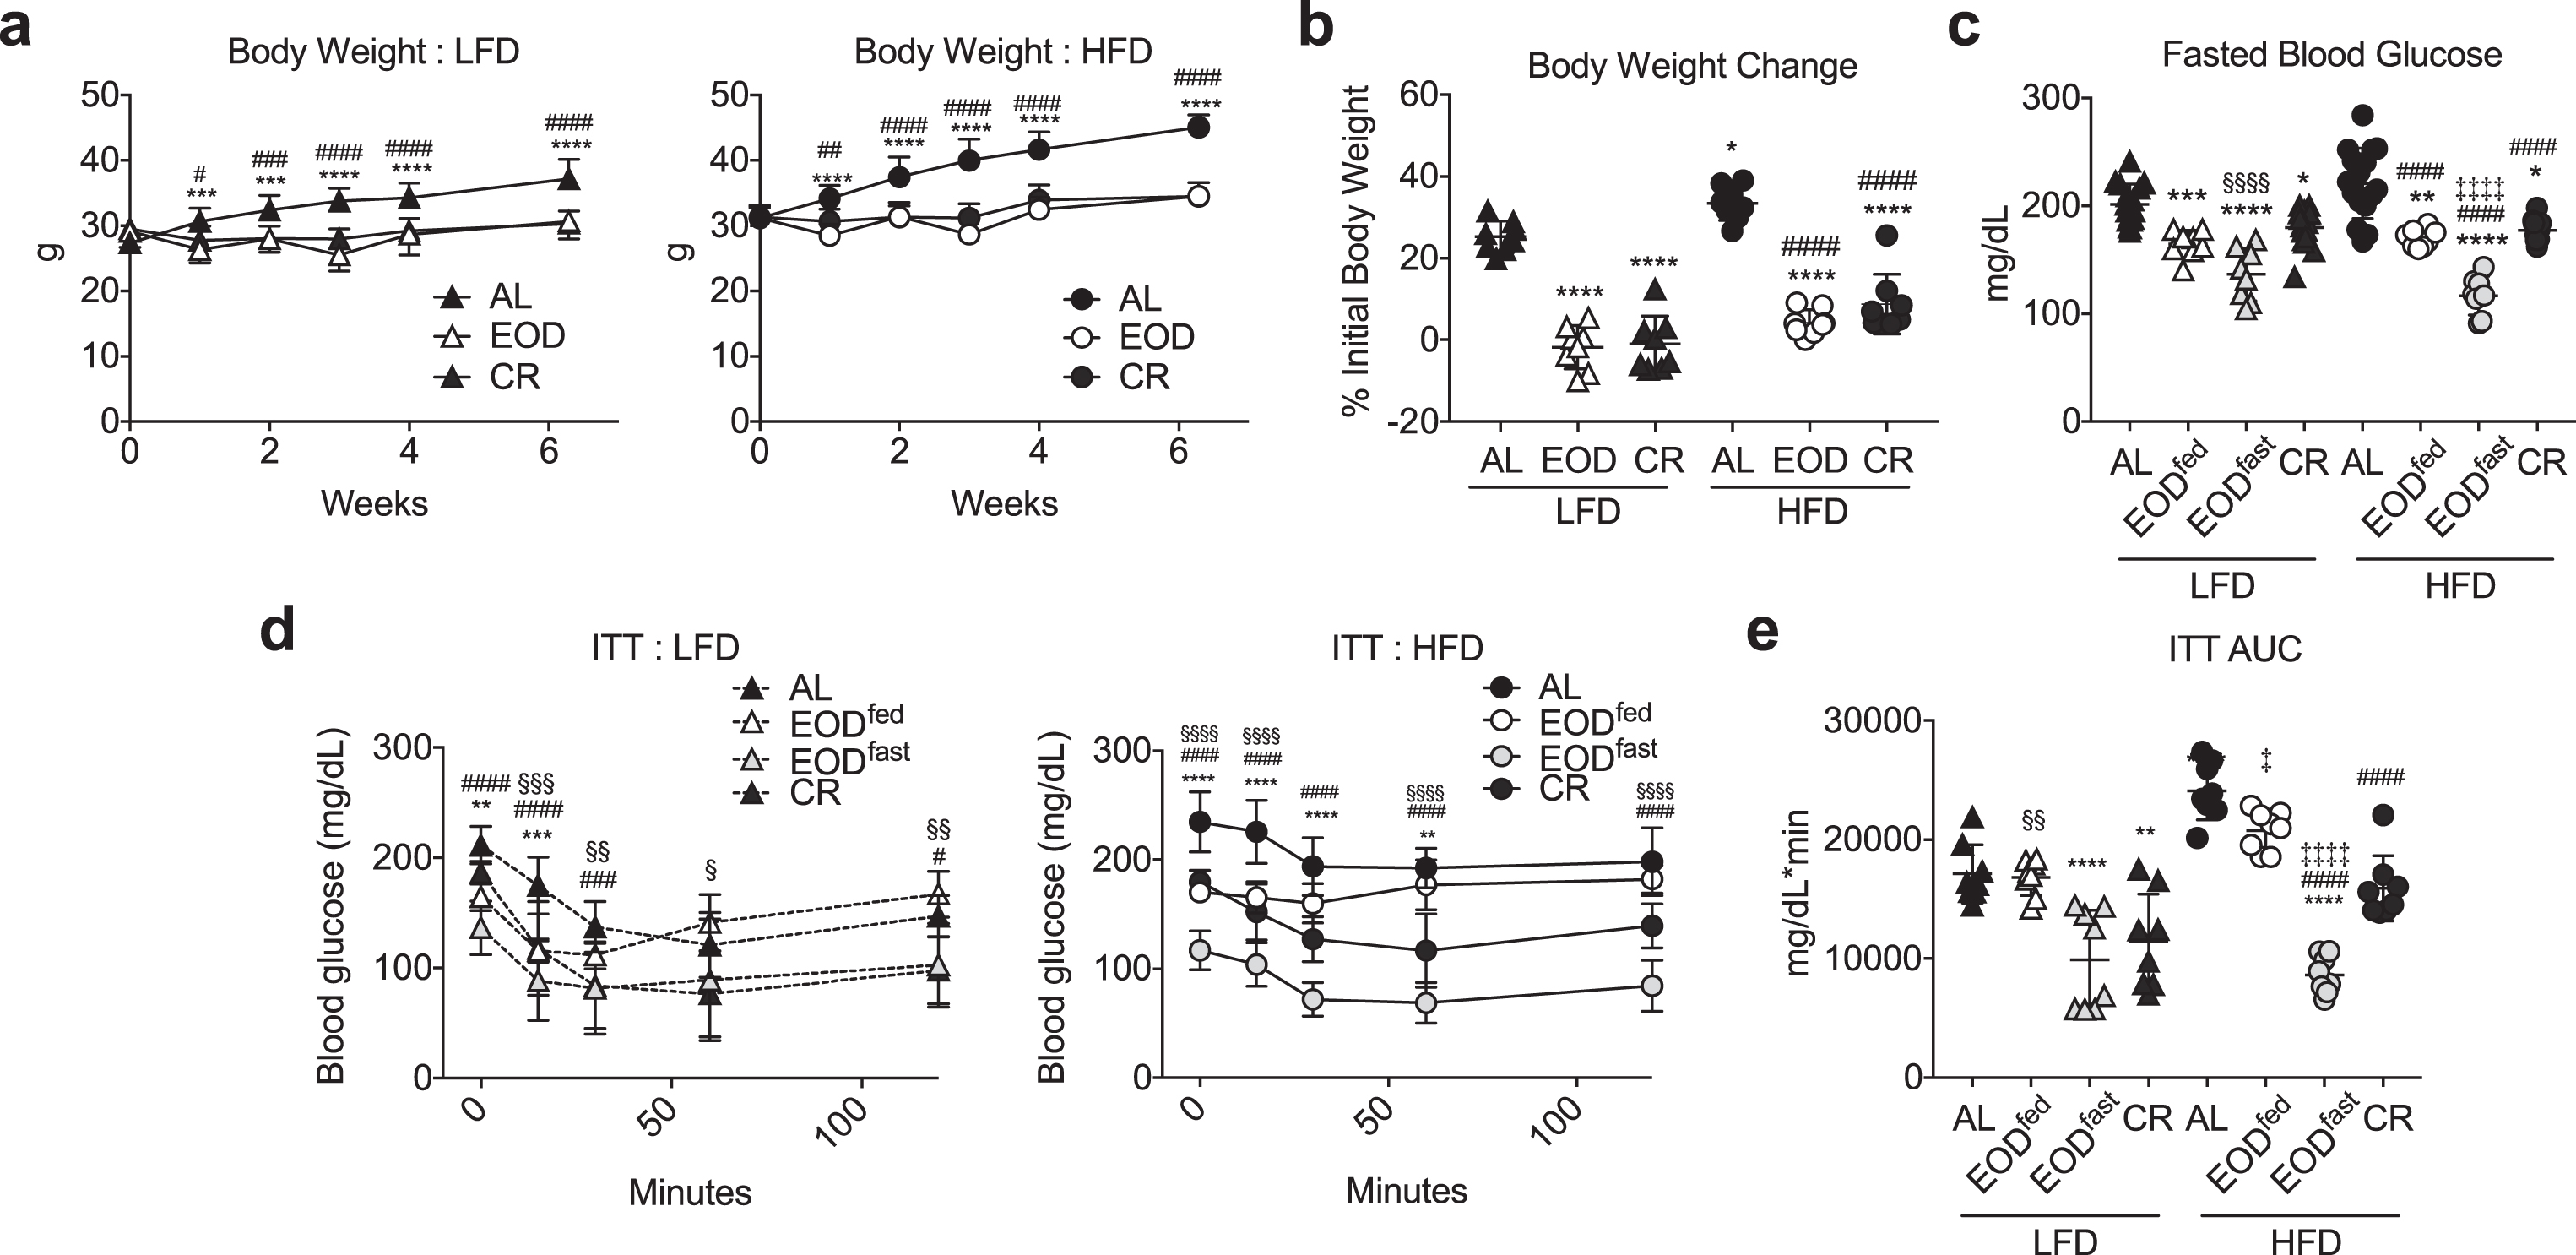
Fig.5
Effects of EOD fed or fasted day on susceptibility to renal ischemia reperfusion injury. (a-c) Serum urea over the first 2 days following renal ischemia reperfusion injury in mice preconditioned for 6 weeks on the indicated diet and feeding regimen. (a) Daily serum urea in the indicated diet groups (LFD, left; HFD, right). Asterisk: AL vs. EODfed; pound sign: AL vs. EODfast; squiggle: AL vs. CR using repeated measures two-way ANOVA within diet with a Dunnett’s post-hoc test. (b) Area under the curve (AUC) of serum urea from (a). (c) Serum creatinine on day 2 after surgery. (b, c) Asterisk: comparison of all groups to AL LFD; pound sign: comparison of HFD groups to AL HFD using one-way ANOVA with a Sidak’s post-hoc test. */#/‡/§P < 0.05, **/# #/‡‡/§§P < 0.01, ***/# # #/‡‡‡/§§§P < 0.001, ****/# # # #/‡‡‡‡/§§§§P < 0.0001. All data are expressed as mean±SD.
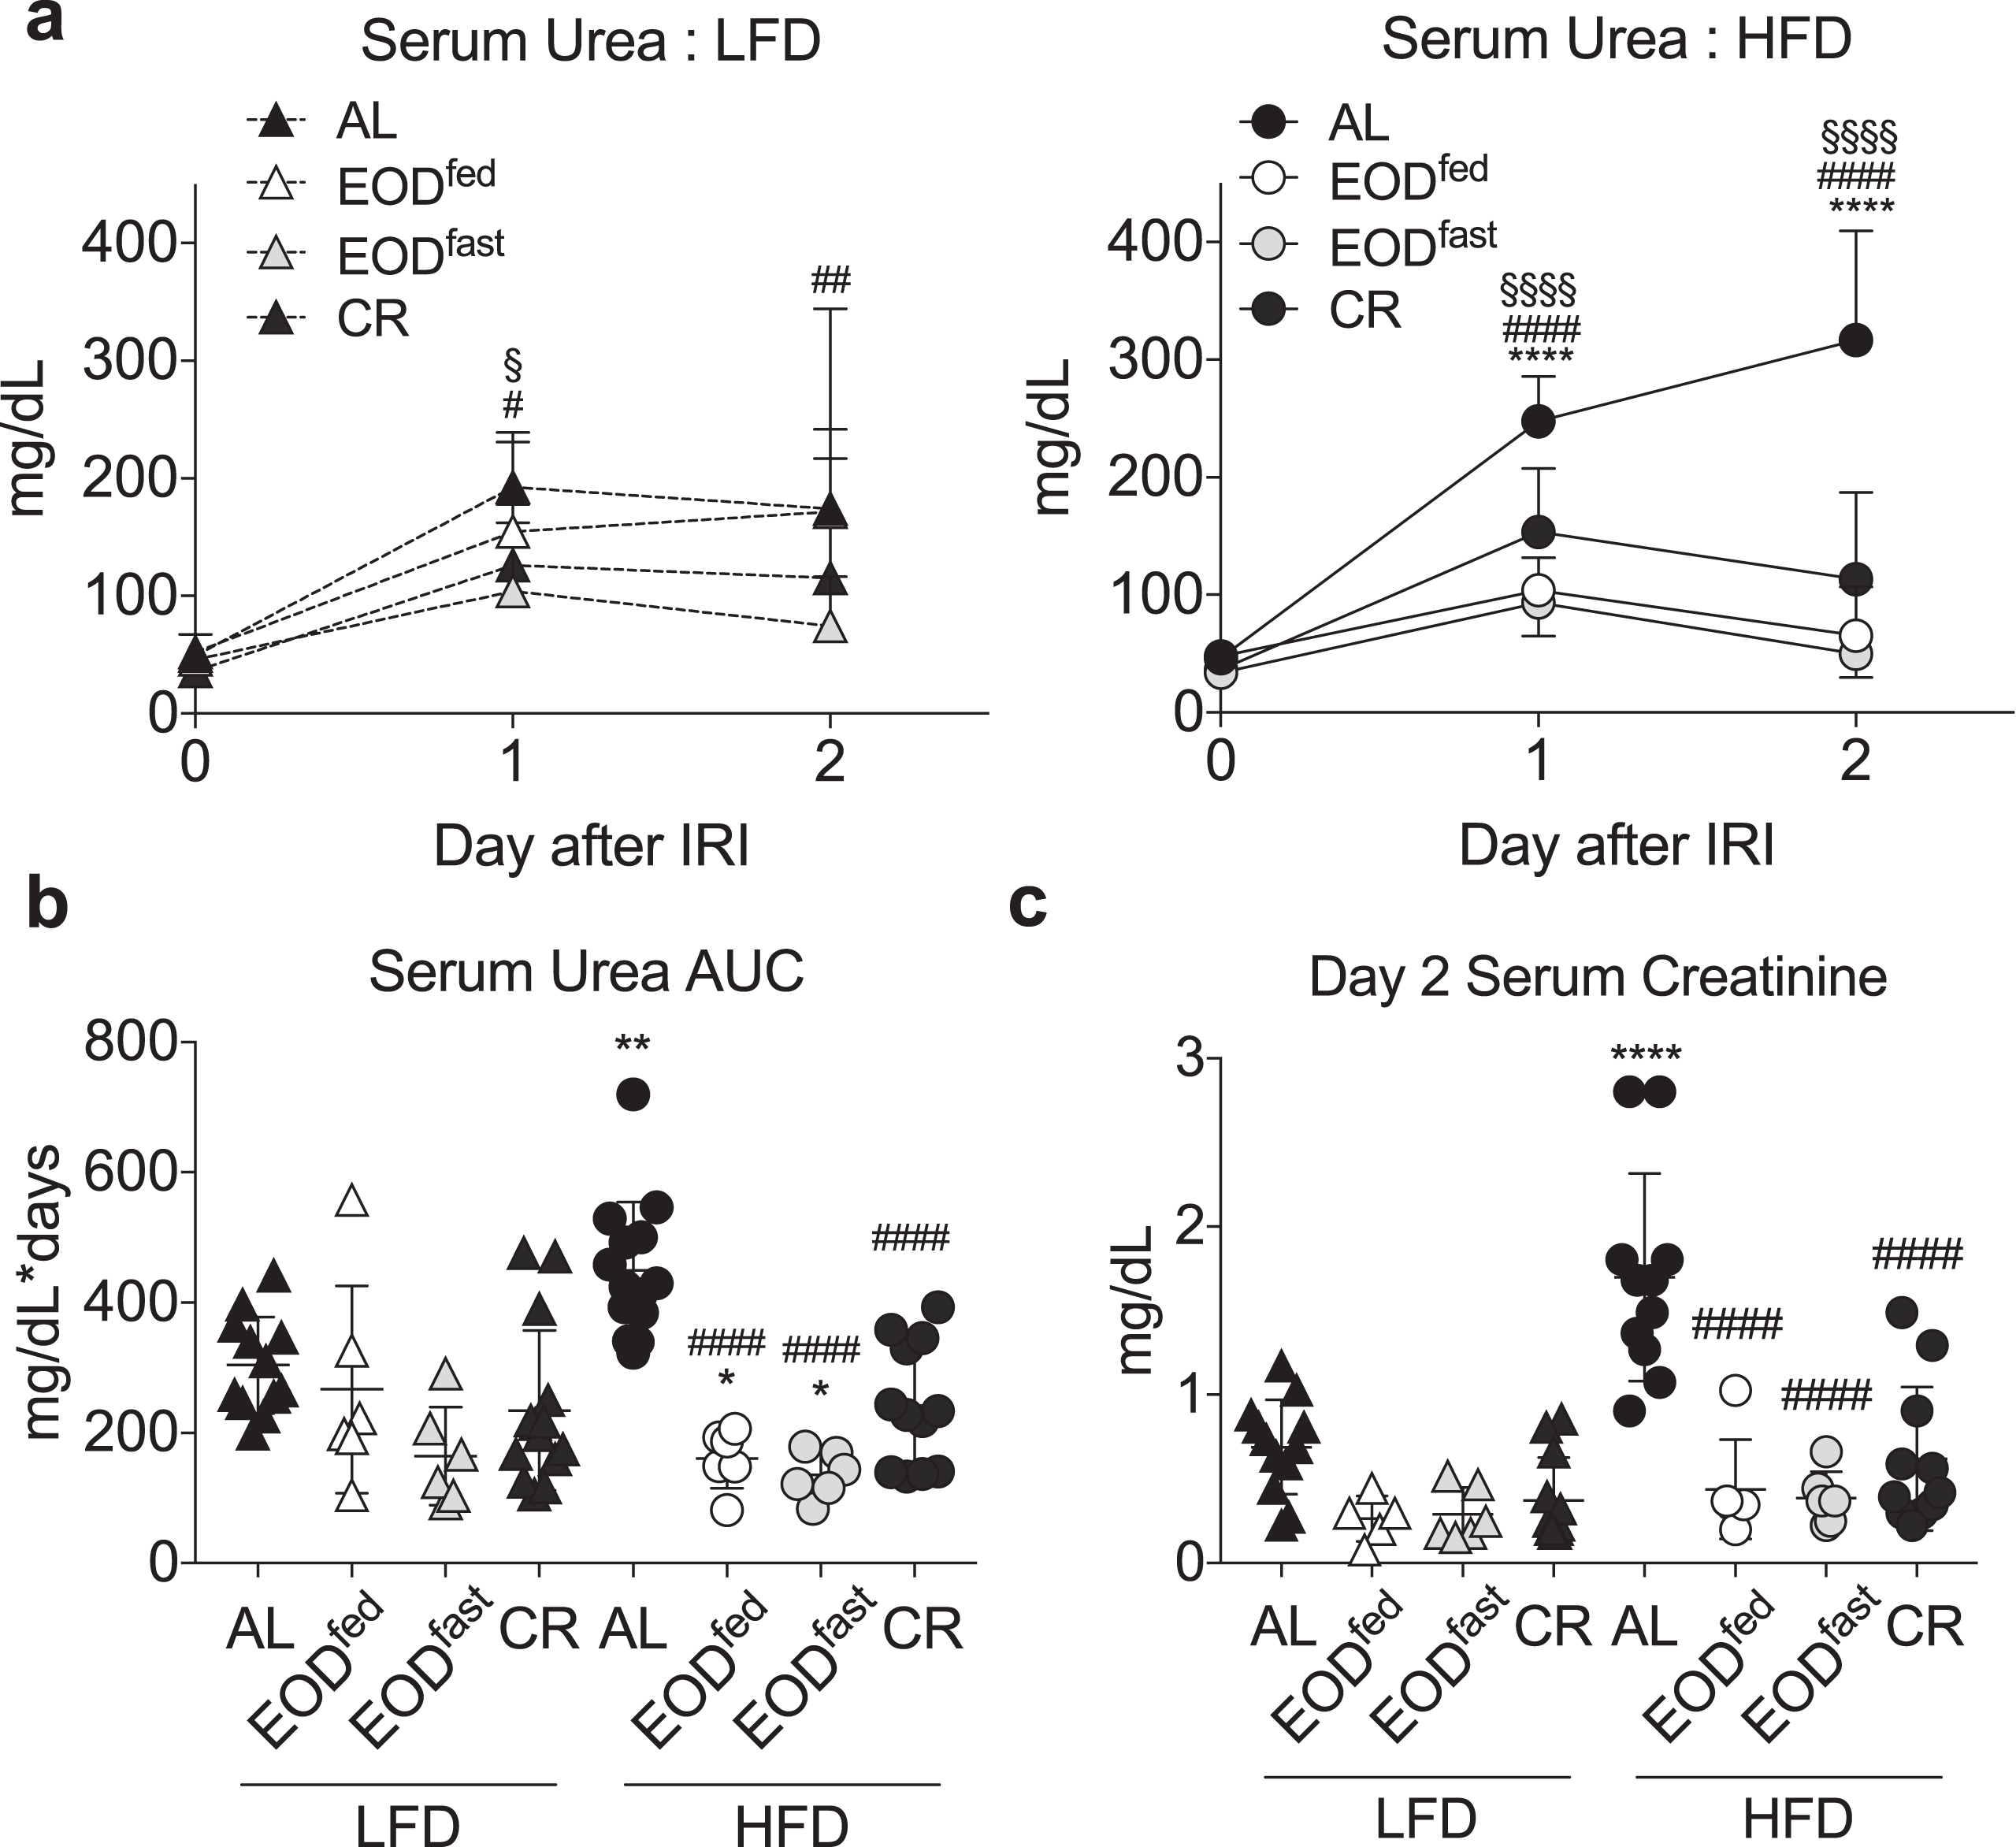
Fig.6
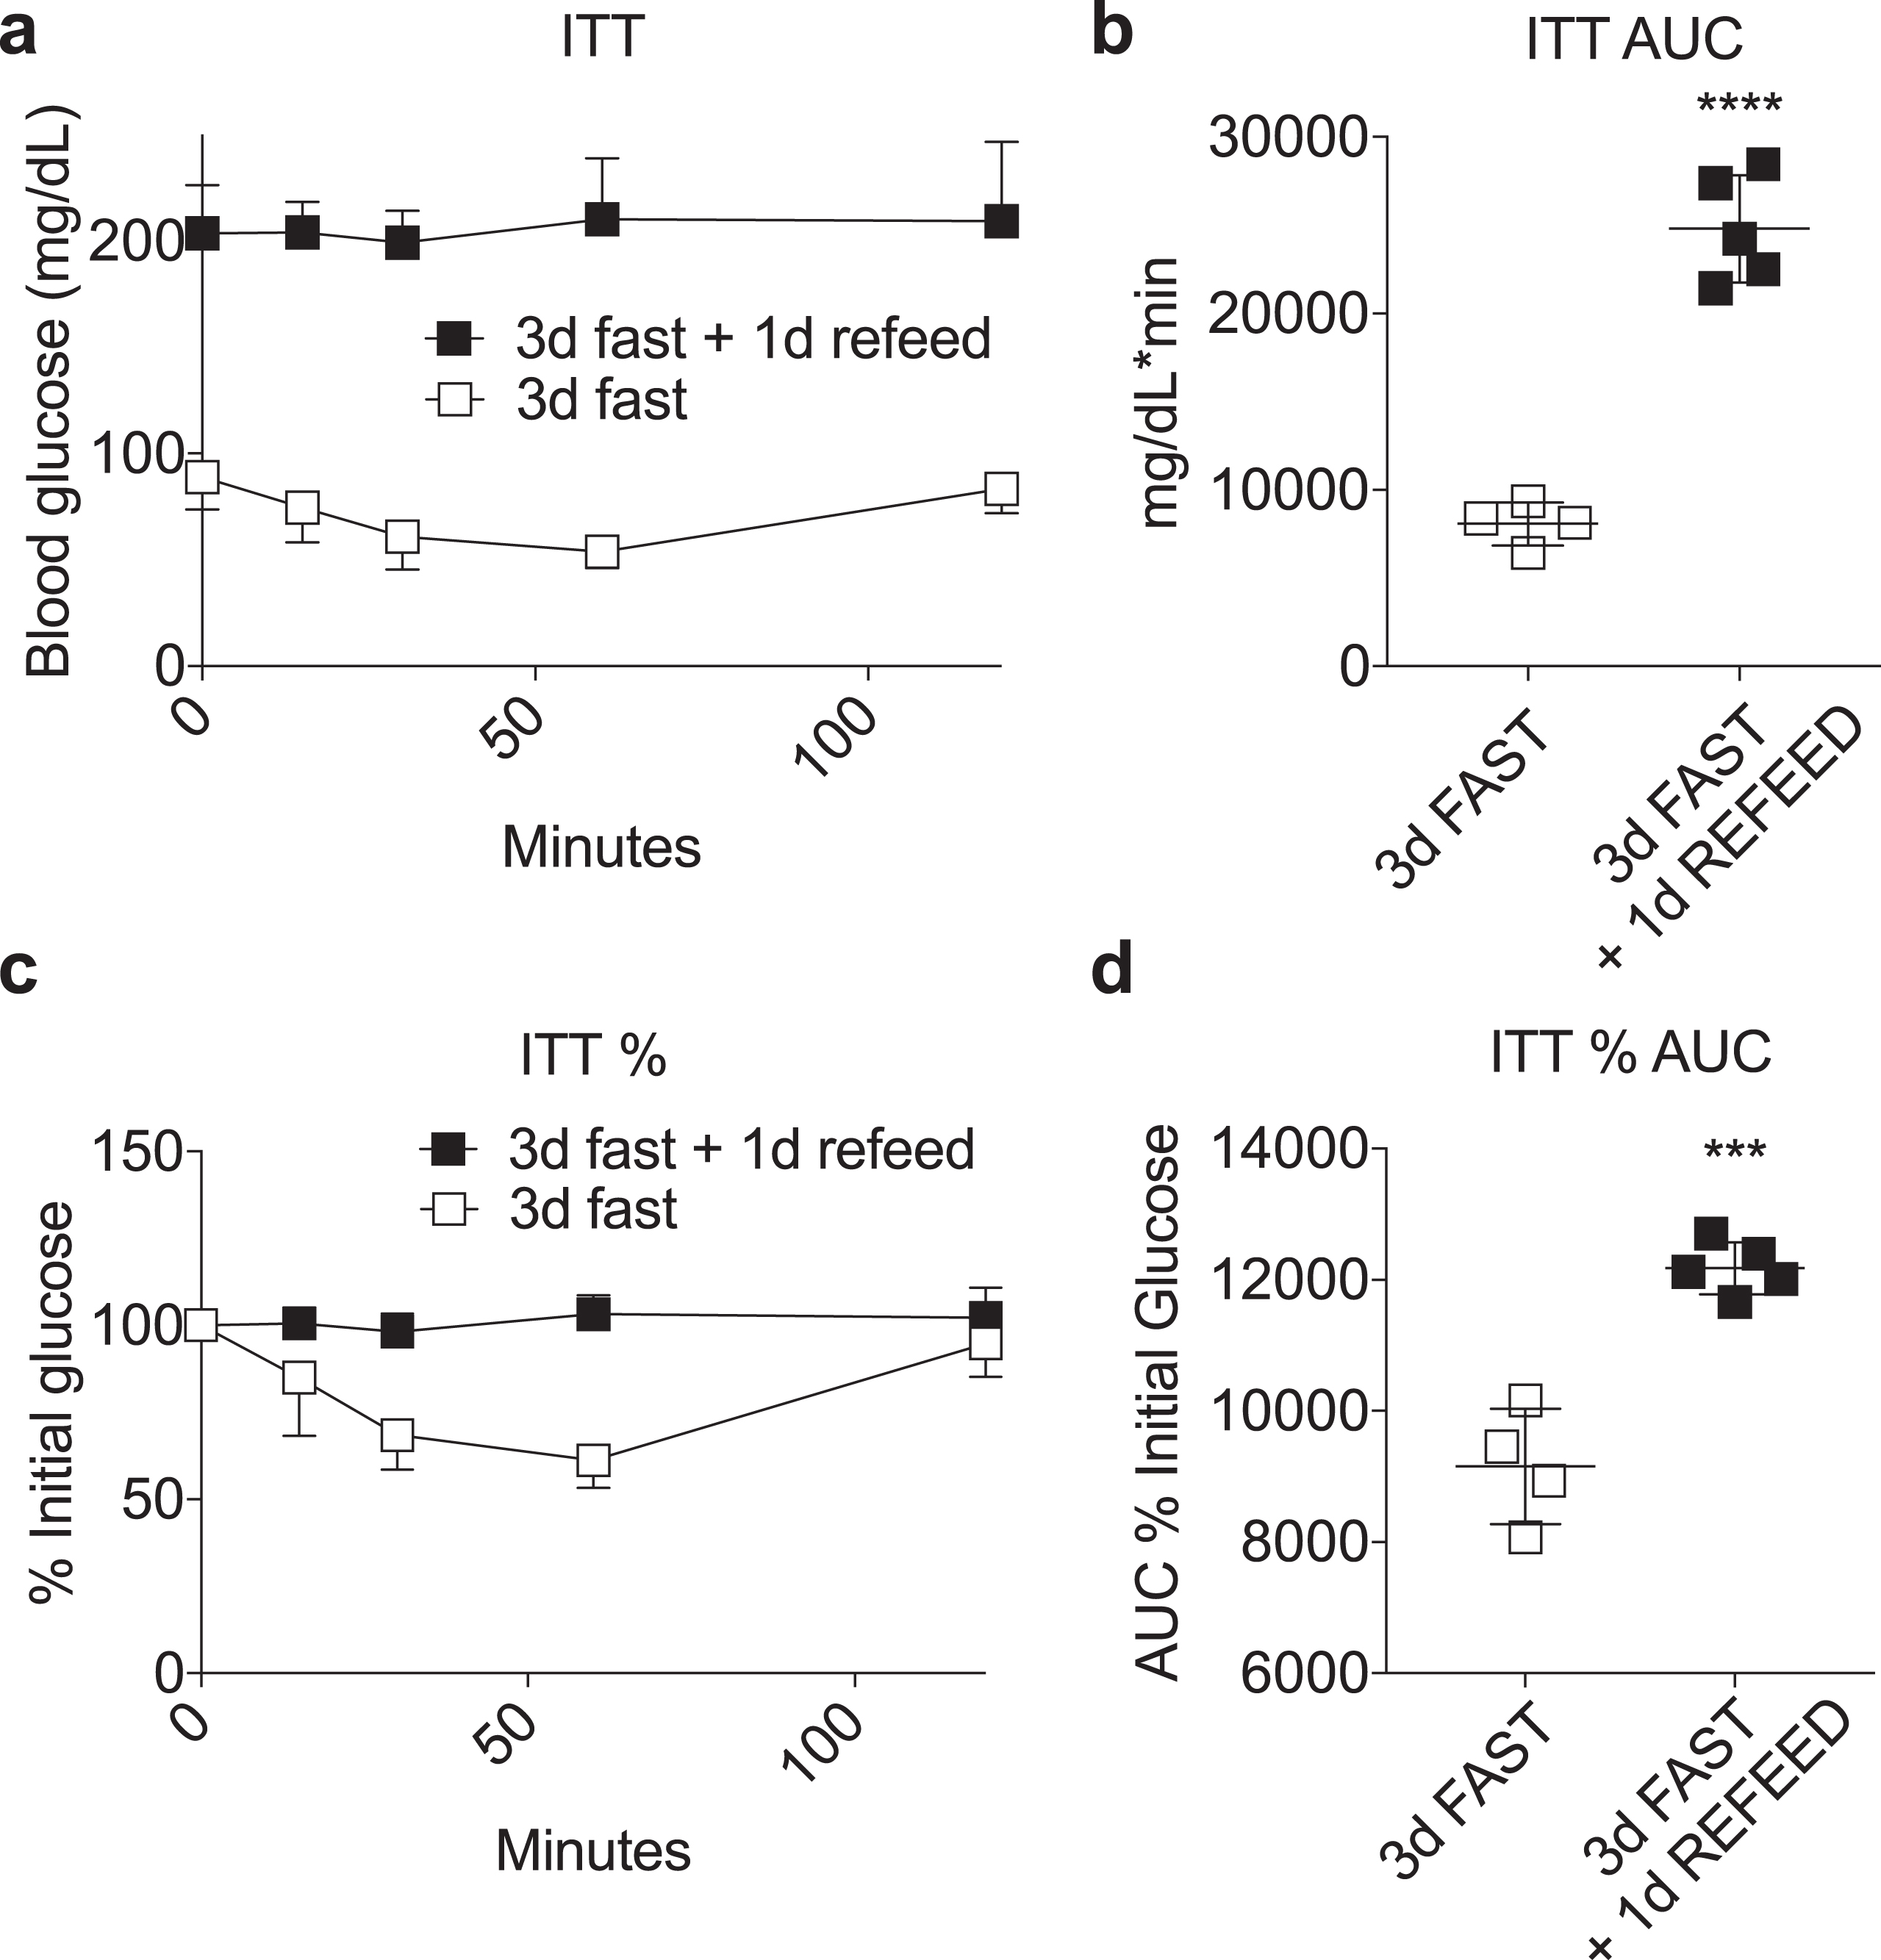
Loss of fasting-induced insulin sensitivity upon refeeding. (a-d) Insulin tolerance test performed in mice fasted for 3 days with or without one day of AL refeeding on a complete LFD. Time-dependent changes in blood glucose (a, c) and area under the curve (AUC) (b, d) calculated as absolute blood glucose (a, b) or % initial blood glucose (c, d) following a bolus injection of insulin. Asterisk: Student’s T test; ***P < 0.001, ****P < 0.0001. All data are expressed as mean±SD.
After 6 weeks on the respective diets, fed blood glucose levels in both HFD and LFD EOD groups were significantly reduced compared to their AL counterparts, while in the CR groups only those on HFD showed a significant difference (Fig. 1d). Interestingly, EOD blood glucose levels were reduced despite being performed after a fed day in which they eat nearly twice as much as the respective AL groups.
3.2Effects of intermittent fasting on glucose homeostasis
We next performed glucose and insulin tolerance tests (GTT, ITT respectively) to evaluate glucose homeostasis among the 6 groups (Fig. 2). Six weeks of HFD feeding on an AL basis significantly worsened glucose and insulin tolerance calculated as area under the curve (AUC) of glucose excursion relative to the LFD AL group. On a LFD, neither EOD nor CR deviated significantly from the AL group (with the exception of CR which slightly but significantly improved ITT). Interestingly, while CR significantly mitigated glucose and insulin intolerance observed in the HFD AL group, EOD improved GTT with a larger effect size than CR, but had no such beneficial effect on ITT.
3.3Effects of intermittent fasting on resistance to renal ischemia reperfusion injury
Next, we used susceptibility to renal ischemia reperfusion injury as a surrogate measure of diet-induced stress resistance following 6 weeks on the indicated diet. Immediately after recovery from surgery, all mice were given AL access to the LFD, and serum urea measured over a 2 week period as a marker of kidney recovery (Fig. 3). CR and EOD regimens particularly on the HFD were protected against renal ischemic injury relative to the HFD AL group, which tended to do the worst. Interestingly, the EOD HFD group in particular had the lowest deviation in serum urea consistent with best outcome. In summary, these data suggest that both EOD fasting and CR regimens are protective against renal ischemia reperfusion injury at two different fat/carbohydrate ratios.
Reduced IGF-1 levels have been proposed as a mechanism by which fasting protects against chemotherapeutic/genotoxic stress in mice [13, 14]. Here, we found no significant changes in circulating IGF-1 levels as a function of diet. On a LFD, circulating IGF-1 values in ng/mL were 659.8±250.2, 533.9±120.8, and 695.2±235.1 in mice fed AL, EOD, and CR regimens, respectively. Similarly, on a HFD, AL, EOD, and CR IGF-1 values were 736.2±238.3, 690.3±323.9, and 723.2±266.7, respectively.
3.4Effects of EOD fed or fasted day on glucose homeostasis
Improved insulin sensitivity is tightly linked and potentially causally related to both extended longevity [15, 16] and increased stress resistance [17, 18] in multiple rodent models, but was apparently dissociated from EOD-mediated protection from ischemic injury (comparing Fig. 2c and d with Fig. 3). We next hypothesized that the feeding state, which differs considerably between fed and fasted day in the EOD model, could transiently affect whole body insulin sensitivity without impacting stress resistance.
To test this, we repeated the above experiment but included analysis of EOD groups after fasted days as well as fed days as in the previous experimental design. Over a 6 week period, the effects of CR and EOD vs. AL on body weight were maintained within HFD and LFD groups, with the HFD groups gaining more weight than corresponding LFD groups (Fig. 4a, b) as observed previously (Fig. 1). Fasting blood glucose levels were also lower in the restricted groups relative to the AL group within each diet (Fig. 4c). Interestingly, fasting glucose levels within each diet were lowest in the EOD group following a fasting day (EODfast), but the same in EODfed and CR mice despite the EODfed mice having consumed approximately twice the amount of food in the previous 24 hr period as the CR group.
ITT revealed that the insulin intolerance observed in EODfed mice (resembling AL in both diet groups) as seen previously (Fig. 2) was markedly improved in EODfast mice following a fasted day, equaling or surpassing ITT AUC in CR LFD and HFD groups, respectfully (Fig. 4d, e). In summary, these data suggest that refeeding in the EOD paradigm results in substantial daily shifts in whole-body insulin sensitivity, resembling AL after a fed day and CR after a fasted day, while CR results in daily improved insulin sensitivity.
3.5Effects of EOD fed or fasted day on susceptibility to renal ischemia reperfusion injury
We next tested whether feeding state in the EOD paradigm affected resistance to ischemic injury. Over the course of the first 2 days following surgery, HFD AL animals exhibited significantly higher serum urea AUC (Fig. 5a-b) and higher Day 2 serum creatinine (Fig. 5c) than LFD AL animals. Within the LFD groups, there was a trend toward lower urea AUC in the EODfast mice, and a trend toward lower creatinine in both EOD groups, relative to LFD AL animals. Similar trends were seen in the HFD groups, except with bigger relative differences due to the poor outcome of the HFD AL control. In conclusion, EOD was protective independent of feeding state in the EOD paradigm, in contrast to whole-body insulin sensitivity.
3.6Loss of fasting-induced insulin sensitivity upon refeeding
Previously, we showed that preconditioning survival benefits afforded by a 3 day water-only fast against renal ischemia reperfusion injury were maintained for up to 4 days after refeeding [12]. To further probe the potential relationship between whole body insulin sensitivity and protection from renal IRI upon refeeding, we performed an ITT in mice fasted for 3 days with or without one day of refeeding, where survival benefits against renal IRI were previously shown to be completely intact [12]. As shown in Fig. 6, refeeding for one day had a highly significant negative effect on insulin sensitivity, consistent with data contained herein on the lack of correlation between whole body insulin sensitivity and diet-induced stress resistance.
4Discussion
Previous studies have shown that intermittent fasting regimens differ in their efficacy depending on the experimental endpoint. For example, EOD feeding/fasting improves the timing of onset of neoplastic disease like CR but without reducing aging rate [19], while EOD fasting is superior to CR with respect to neuronal stress resistance independent of changes in body weight [20]. Here, a comparison of EOD fasting to daily CR differing only in the timing of food intake found equal efficacy towards metabolic improvement (attenuated weight gain, fasting blood glucose, glucose tolerance) and increased stress resistance (protection from the sterile inflammatory stress of renal ischemia reperfusion injury).
We also found that these benefits occurred similarly on diets at two extremes of fat/carbohydrate ratios. Interestingly, while fat/carbohydrate ratio profoundly affected outcomes between AL groups, absolute measures of glucose homeostasis and stress resistance were similar between DR groups independent of diet. This was unexpected in part because HFD EOD/CR groups ate more calories than LFD EOD/CR groups. On the other hand, it is consistent with findings in flies [21] as well as mice [22–25] and rats [26] that benefits of dietary restriction can occur independently of fat/carbohydrate ratios. Thus, while benefits were clearly related to reduced food intake, they were not directly related to calorie intake in the form of fat or carbohydrate per se.
Energy restriction is thought to be the primary driver behind benefits of DR regimens in which access to food is restricted, including CR and EOD fasting regimens used here. However, an alternate explanation is time spent in the fasted state, which is typically extended in daily CR regimens because animals are hungry and eat their entire food allotment before the next is given. Indeed, intermittent fasting has been shown to impart metabolic benefits independent of the composition of the diet, and without overall reduced calorie intake [27–29], consistent with the idea that the time spent in the fasted state can itself be a major driver of benefits. A limitation of this study is that we did not measure the time spent in the fasted state in either CR or EOD groups. Thus, while we can conclude that neither the pattern of food intake nor the fat/carbohydrate ratio changed the pattern of benefits, we can’t make specific claims about the contribution of time spent in the fasted state.
In terms of underlying molecular mechanisms of protection, decreased serum IGF-1 is a consistent biomarker of DR in rodents and humans with an established connection to delayed aging in model organisms and humans [30]. While some prior studies have noted a decline in IGF-1 in mice and humans subjected to intermittent fasting [31, 32], others have found increases [20], or no changes [33], in accordance with our results. These differences may be partially due to the length of the fasting period, since decreased IGF-1 has been demonstrated to be responsible for the effect of prolonged fasting on protection from genotoxic stress [14] and stem cell regeneration [34]. Nonetheless, our results suggest that IGF-1 is unlikely to play a role in the beneficial effects of intermittent fasting regimens observed here.
Improved insulin sensitivity is another evolutionary conserved aspect of DR that has been proposed to play a causal role in its beneficial effects [15–18, 32, 33, 35–37]. Previously we found that reduced insulin signaling concomitant with improved insulin sensitivity prior to hepatic ischemia reperfusion injury potentiates improved anti-apoptotic survival signaling in part through the insulin receptor after reperfusion [17]. Here, while insulin sensitivity was improved by daily CR, it fluctuated dramatically between fed and fasted EOD groups as well as upon one day of refeeding after a 3 day fast, and thus failed to correlate with measures of protection from ischemic injury. Taken together, these data suggest a mechanism of protection that is independent of the acute fasting response or feeding state per se. While recent work points to a potential role of endogenous H2S production in the protection from surgical stress [38], or alteration of the microbiome to induce browning of white adipose tissue with resulting metabolic improvements [39], future studies are required to shed light on molecular mechanisms underpinning these beneficial effects.
In conclusion, our study provides evidence that both CR and EOD fasting can protect from renal ischemia injury in mice independent of fat/carbohydrate ratio, and that protection correlates with certain metabolic parameters including body weight and fasting glucose, but is separable from whole-body insulin sensitivity at the time of surgery. Given the numerous benefits of these dietary regimes, they warrant future testing for pre-surgical use in humans.
5Contributions
WP, TC and JRM designed and performed the experiments. JSR and JRM analyzed the data and wrote the paper. JRM provided funding.
Acknowledgments
This work was funded in part by grants from NIH (AG-036712 and DK-090629), Ellison Medical Foundation, and American Federation for Aging Research to JRM.
References
[1] | Fontana L , Partridge L . Promoting Health and Longevity through Diet: From Model Organisms to Humans. Cell. (2015) ;161: (1):106–18. |
[2] | Heilbronn LK , Jonge L de , Frisard MI , DeLany JP , Larson-Meyer DE , Rood J et al., Effect of 6-Month Calorie Restriction on Biomarkers of Longevity, Metabolic Adaptation, and Oxidative Stress in Overweight Individuals: A Randomized Controlled Trial. JAMA. (2006) ;295: (13):1539–48. |
[3] | McCay CM , Crowell MF , Maynard LA . The Effect of Retarded Growth Upon the Length of Life Span and Upon the Ultimate Body Size One Figure. J Nutr. (1935) ;10: (1):63–79. |
[4] | Fontana L , Partridge L , Longo VD . Extending Healthy Life Span—From Yeast to Humans. Science. (2010) ;328: (5976):321–6. |
[5] | Miller RA , Buehner G , Chang Y , Harper JM , Sigler R , Smith-Wheelock M . Methionine-deficient diet extends mouse lifespan, slows immune and lens aging, alters glucose, T4, IGF-I and insulin levels, and increases hepatocyte MIF levels and stress resistance. Aging Cell. (2005) ;4: (3):119–25. |
[6] | Maida A , Zota A , Sjøberg KA , Schumacher J , Sijmonsma TP , Pfenninger A et al., A liver stress-endocrine nexus promotes metabolic integrity during dietary protein dilution. J Clin Invest. (2016) ;126: (9):3263–78. |
[7] | Fontana L , Partridge L . Promoting Health and Longevity through Diet: From Model Organisms to Humans. Cell. (2015) ;161: (1):106–18. |
[8] | Johnson JB , Summer W , Cutler RG , Martin B , Hyun D-H , Dixit VD et al., Alternate day calorie restriction improves clinical findings and reduces markers of oxidative stress and inflammation in overweight adults with moderate asthma. Free Radic Biol Med. (2007) ;42: (5):665–74. |
[9] | Ravussin E , Redman LM , Rochon J , Das SK , Fontana L , Kraus WE et al., A 2-Year Randomized Controlled Trial of Human Caloric Restriction: Feasibility and Effects on Predictors of Health Span and Longevity. J Gerontol A Biol Sci Med Sci. (2015) ;70: (9):1097–104. |
[10] | Godar RJ , Ma X , Liu H , Murphy JT , Weinheimer CJ , Kovacs A et al., Repetitive stimulation of autophagy-lysosome machinery by intermittent fasting preconditions the myocardium to ischemia-reperfusion injury. Autophagy. (2015) ;11: (9):1537–60. |
[11] | Katare RG , Kakinuma Y , Arikawa M , Yamasaki F , Sato T . Chronic intermittent fasting improves the survival following large myocardial ischemia by activation of BDNF/VEGF/PI3K signaling pathway. J Mol Cell Cardiol. (2009) ;46: (3):405–12. |
[12] | Mitchell JR , Verweij M , Brand K , van de Ven M , Goemaere N , van den Engel S et al., Short-term dietary restriction and fasting precondition against ischemia reperfusion injury in mice. Aging Cell. (2010) ;9: (1):40–53. |
[13] | Raffaghello L , Lee C , Safdie FM , Wei M , Madia F , Bianchi G et al., Starvation-dependent differential stress resistance protects normal but not cancer cells against high-dose chemotherapy. Proc Natl Acad Sci. (2008) ;105: (24):8215–20. |
[14] | Lee C , Safdie FM , Raffaghello L , Wei M , Madia F , Parrella E et al., Reduced Levels of IGF-I Mediate Differential Protection of Normal and Cancer Cells in Response to Fasting and Improve Chemotherapeutic Index. Cancer Res. (2010) ;70: (4):1564–72. |
[15] | Blüher M , Kahn BB , Kahn CR . Extended longevity in mice lacking the insulin receptor in adipose tissue. Science. (2003) ;299: (5606):572–4. |
[16] | Harrison DE , Strong R , Sharp ZD , Nelson JF , Astle CM , Flurkey K et al., Rapamycin fed late in life extends lifespan in genetically heterogeneous mice. Nature. (2009) ;460: (7253):392–5. |
[17] | Harputlugil E , Hine C , Vargas D , Robertson L , Manning BD , Mitchell JR . The TSC Complex Is Required for the Benefits of Dietary Protein Restriction on Stress Resistance In Vivo. Cell Rep. (2014) ;8: (4):1160–70. |
[18] | Papadakis M , Hadley G , Xilouri M , Hoyte LC , Nagel S , McMenamin MM et al., Tsc1 (hamartin) confers neuroprotection against ischemia by inducing autophagy. Nat Med. (2013) ;19: (3):351–7. |
[19] | Xie K , Neff F , Markert A , Rozman J , Aguilar-Pimentel JA , Amarie OV et al., Every-other-day feeding extends lifespan but fails to delay many symptoms of aging in mice. Nat Commun. (2017) ;8: (1):155. |
[20] | Anson RM , Guo Z , Cabo R de , Iyun T , Rios M , Hagepanos A et al., Intermittent fasting dissociates beneficial effects of dietary restriction on glucose metabolism and neuronal resistance to injury from calorie intake. Proc Natl Acad Sci. (2003) ;100: (10):6216–20. |
[21] | Grandison RC , Piper MDW , Partridge L . Amino-acid imbalance explains extension of lifespan by dietary restriction in Drosophila. Nature. (2009) ;462: (7276):1061–4. |
[22] | Varady KA , Hudak CS , Hellerstein MK . Modified alternate-day fasting and cardioprotection: Relation to adipose tissue dynamics and dietary fat intake. Metabolism. (2009) ;58: (6):803–11. |
[23] | Solon-Biet SM , McMahon AC , Ballard JWO , Ruohonen K , Wu LE , Cogger VC et al., The Ratio of Macronutrients, Not Caloric Intake, Dictates Cardiometabolic Health, Aging, and Longevity in Ad Libitum-Fed Mice. Cell Metab. (2014) ;19: (3):418–30. |
[24] | Komatsu T , Chiba T , Yamaza H , Yamashita K , Shimada A , Hoshiyama Y et al., Manipulation of caloric content but not diet composition, attenuates the deficit in learning and memory of senescence-accelerated mouse strain P8. Exp Gerontol. (2008) ;43: (4):339–46. |
[25] | Fernandes G , Yunis EJ , Good RA . Influence of diet on survival of mice. Proc Natl Acad Sci. (1976) ;73: (4):1279–83. |
[26] | Iwasaki K , Gleiser CA , Masoro EJ , McMahan CA , Seo EJ , Yu BP . Influence of the restriction of individual dietary components on longevity and age-related disease of Fischer rats: The fat component and the mineral component. J Gerontol. (1988) ;43: (1):B13–21. |
[27] | Hatori M , Vollmers C , Zarrinpar A , DiTacchio L , Bushong EA , Gill S et al., Time-Restricted Feeding without Reducing Caloric Intake Prevents Metabolic Diseases in Mice Fed a High-Fat Diet. Cell Metab. (2012) ;15: (6):848–60. |
[28] | Eckel-Mahan KL , Patel VR , de Mateo S , Orozco-Solis R , Ceglia NJ , Sahar S et al., Reprogramming of the Circadian Clock by Nutritional Challenge. Cell. (2013) ;155: (7):1464–78. |
[29] | Chaix A , Zarrinpar A , Miu P , Panda S . Time-Restricted Feeding Is a Preventative and Therapeutic Intervention against Diverse Nutritional Challenges. Cell Metab. (2014) ;20: (6):991–1005. |
[30] | Junnila RK , List EO , Berryman DE , Murrey JW , Kopchick JJ . The GH/IGF-1 axis in ageing and longevity. Nat Rev Endocrinol. (2013) ;9: (6):366–76. |
[31] | Moro T , Tinsley G , Bianco A , Marcolin G , Pacelli QF , Battaglia G et al., Effects of eight weeks of time-restricted feeding (16/8) on basal metabolism, maximal strength, body composition, inflammation, and cardiovascular risk factors in resistance-trained males. J Transl Med. (2016) ;14: :290. |
[32] | Varady KA , Roohk DJ , Hellerstein MK . Dose effects of modified alternate-day fasting regimens on in vivo cell proliferation and plasma insulin-like growth factor-1 in mice. J Appl Physiol. (2007) ;103: (2):547–51. |
[33] | Harvie MN , Pegington M , Mattson MP , Frystyk J , Dillon B , Evans G et al., The effects of intermittent or continuous energy restriction on weight loss and metabolic disease risk markers: A randomized trial in young overweight women. Int J Obes. (2010) ;35: (5):ijo2010171. |
[34] | Cheng C-W , Villani V , Buono R , Wei M , Kumar S , Yilmaz OH et al., Fasting-Mimicking Diet Promotes Ngn3-Driven β-Cell Regeneration to Reverse Diabetes. Cell. (2017) ;168: (5):775–788.e12. |
[35] | Masoro EJ , McCarter RJ , Katz MS , McMahan CA . Dietary restriction alters characteristics of glucose fuel use. J Gerontol. (1992) ;47: (6):B202–208. |
[36] | Kalant N , Stewart J , Kaplan R . Effect of diet restriction on glucose metabolism and insulin responsiveness in aging rats. Mech Ageing Dev. (1988) ;46: (1-3):89–104. |
[37] | Wang ZQ , Bell-Farrow AD , Sonntag W , Cefalu WT . Effect of age and caloric restriction on insulin receptor binding and glucose transporter levels in aging rats. Exp Gerontol. (1997) ;32: (6):671–84. |
[38] | Hine C , Harputlugil E , Zhang Y , Ruckenstuhl C , Lee BC , Brace L et al., Endogenous hydrogen sulfide production is essential for dietary restriction benefits. Cell. (2015) ;160: (1-2):132–44. |
[39] | Li G , Xie C , Lu S , Nichols RG , Tian Y , Li L et al., Intermittent Fasting Promotes White Adipose Browning and Decreases Obesity by Shaping the Gut Microbiota. Cell Metab. (2017) ;26: (4):672–685.e4. |


