
Ratios of soluble and insoluble dietary fibers on satiety and energy intake in overweight pre- and postmenopausal women1
Abstract
BACKGROUND: Fibers’ properties impact different mechanisms involved in satiety and energy intake regulation and metabolic outcomes.
OBJECTIVE: Evaluate the effect of fiber types and menopausal status on satiety and metabolic responses in overweight women.
METHODS: In a randomized within-subjects design, 19 overweight/obese women [9 premenopausal and 10 postmenopausal] consumed 3 preloads that varied by fiber content and source: 1) 3:1 ratio of soluble:insoluble fiber (SF), 2) 1:3 ratio of soluble:insoluble fiber (IF), 3) no fiber control (NFC). Subjective satiety, cholecystokinin (CCK), glucose, insulin, and triglyceride (TG) were measured for 3 h post-preload followed by in-lab ad libitum test meal and 32 hour food intake monitoring.
RESULTS: Significant preload, time and preload by menopausal status interaction was apparent for hunger and fullness (p < 0.05 for both) with SF preload predominantly more satiating in postmenopausal women. CCK and insulin were significantly lower after SF preload (p < 0.0001 for both). Post-preload glucose responses differed by menopausal status: postmenopausal women distinguished between fiber types unlike premenopausal women (p = 0.02). TG was significantly elevated after the IF preload compared to NFC and SF (p = 0.007 and p = 0.008, respectively).
CONCLUSIONS: Customized/personalized dietary recommendations for women during their premenopausal and postmenopausal years can help maximize metabolic and appetite control.
Abbreviations
CCK | Cholecystokinin |
SF | Soluble Fiber |
IF | Insoluble Fiber |
NFC | No Fiber Control |
AA | African American |
CA | Caucasian |
1Introduction
Obesity is associated with a number of adverse health outcomes and enormous economic costs causing it to rank as one of the leading public health issues in the United States and Westernizedcountries. Obesity occurs at all ages, but its prevalence is highest between those aged 40–59 y and is more common in women than in men in the United States [1]. For women, the natural onset of menopause occurs during this time period and adds to the increased risk of weight gain. As hormone levels fluctuate and estrogen concentrations decrease, changes in appetite and body weight become more apparent [2]. Previous work in our laboratory in younger healthy weight men and women has consistently shown sexual dimorphic outcomes on appetite regulating processes in response to meals varying in macronutrient content, nutrient accessability, and fiber content [3–6]. Women appear to be more sensitive than men to intestinal-phase mechanisms of satiety, suggesting that customization of dietary strategies for women and men may be requisite to maximize their anti-obesity benefits. Likewise, changes that occur in women as they move from premenopausal (PreM) status to post-menopausal (PostM) status may impact their responses to dietary strategies aimed to control appetite and reduce weight gain. Singh and colleagues have previously shown that estrogen may play a role in nutrient absorption within the small intestine by demonstrating that estrogen treated ovariectomized rats reduced the increased glucose absorption observed in the ovariectomized non-estrogen treated animals [7]. Other studies investigating menopausal effect on expected fiber health benefits in human models have observed significant differences in serum lipid responses relative to menopausal status after chronic psyllium fiber supplementation [8]. However, there is a limited understanding of how dietary manipulations may influence appetite-associated mechanisms among women at different stagesin life.
Dietary fiber has been the subject of increasing attention for its effects on multiple mechanisms related to obesity prevention. Fibers are a broad category of plant components having different physiological benefits depending on their chemical structures and characteristic physical properties (eg., viscosity, water holding capacity, bile acid binding ability, fermentability) [9]. Increasing dietary fiber intake may help reduce weight gain and promote weight loss by decreasing the energy density of the diet. Fibers may also influence gastrointestinal processing of energy-yielding nutrients and augment the release of neuro-endocrine responses involved in satiety and food intake regulation [3, 10–12]. The water holding capacity plus the viscous nature of certain polysaccharides slows the rate of digestion and absorption of macronutrients [13] and can amplify hormone release during the alimentary period, impacting metabolic and regulatory pathways of food intake regulation.
In contrast to viscous fibers, insoluble fibers provide bulk to the diet and increase the rate of transit through the small bowel. In a study of overweight PreM women, the addition of insoluble fibers to a meal to lower the glycemic index of the meal resulted in favorable glycemic responses. However, the meal with added insoluble fiber was less effective in suppressing hunger and stimulating CCK than the energy-, volume- and available carbohydrate- matched low fiber, high glycemic meal [14]. These data indicate that optimizing diets with fiber to have beneficial effects on both appetite regulating systems as well as metabolic outcomes requires further study.
Therefore, the main objective of the present study was to evaluate the effect of mixed fiber types on satiety and metabolic responses in overweight women when included in a high carbohydrate meal. Further, we were interested in testing the influence of menopausal status on study outcomes to determine if the effects of the fiber intervention would differ among women who were PreM or PostM. Our working hypothesis was that a meal with a greater proportion of soluble viscous type fibers would beneficially impact satiety and metabolic variables of interest in both PreM and PostM women compared to a meal predominately high in insoluble typefibers.
2Subjects and methods
The Human Subjects Research Committee of the University of California, Davis, and the Illinois Institute of Technology (IIT), Chicago, Illinois approved the study. The study was conducted at IIT at the Clinical Nutrition Research Center in Chicago, Illinois in accordance with the Helsinki Declaration of 1975 as revised in 1983. All subjects signed a written informed consent form before any study-related procedures were performed.
2.1Subjects
Participants were recruited through flyers and online media outlets in the Chicago area. Eligible subjects were overweight or obese (BMI 25–37 kg/m2 inclusive), generally healthy, adult (18–67 years of age) women. All women were regular breakfast eaters and did not have allergies to foods served during the study. Exclusion criteria included smoking, blood glucose concentrations≥110 mg/dL, depression level over 50 (determined by Zung’s score [15]), excessive exercise pattern, unstable body weight (change of 2 kg in last 2 months), taking medication(s), dietary supplements or surgeries that affect body weight, appetite or regular digestion. Twenty-three women met study criteria and were invited to participate in the study. Twenty subjects completed the study and one subject was excluded from analysis due to non-compliance with study protocol. The final analysis includes nineteen women(n = 19).
2.2Study design
The study was a single-blind, 3-arm, 6-sequence randomized cross-over design utilizing the preload paradigm. Three study-specific preload breakfast meals were prepared. Each preload meal contained two muffins, a semi-solid shake and water. The meals were matched for energy (∼570 kcal /2386 kJ) and macronutrient composition (% of energy); 63%, 24% and 13% of carbohydrates, fat and protein, respectively. Meals differed based on fiber content and ratios of soluble to insoluble fiber: 1) no added fiber control (NFC); 2) high soluble:insoluble fiber combination (SF, 12.0 g total fiber, 3:1 ratio of psyllium husk:cellulose); or 3) a low soluble:insoluble fiber combination (IF, 11.4 g total fiber, 1:3 psyllium husk:cellulose). Total weight of the meals was 600 g with an energy density of ∼1 kcal/g. Dry matter:water weight ratio was 0.3. Preload nutritional information is given in Table 1.
Table 1
Nutrient Composition of Study Day Preload Meals
| Nutrient | SF1 | IF2 | NFC |
| Energy (kcal) | 580 | 573 | 560 |
| Carbohydrates (g) | 88 | 89 | 90 |
| Fat (g) | 15 | 16 | 15 |
| Protein (g) | 18 | 19 | 19 |
| Soluble fiber (g) | 9 | 3 | 0 |
| Insoluble fiber (g) | 3 | 8 | 0 |
| Water (g) | 459 | 454 | 476 |
1SF: 12.0 g total fiber, 3:1 ratio of psyllium husk:cellulose. 2IF: 11.4 g total fiber, 1:3 psyllium husk:cellulose.
2.3Procedures
Subjects visited the study facility on 3 different occasions, 1-month apart for in-lab testing. PreM women were studied during the follicular phase of their cycle (between days 6–13) and PostM women were allowed to come at their convenience once per month. In preparation of their study visit, subjects kept detailed 24 h scale-weighed food records 3 days before (d – 3), the day before (d – 1), the day of (d 0) and the day after (d + 1) each test session. The study food records were analyzed to confirm pre-study intake and explore changes in food intake following each test meal relative to usual food intake. The Food Processor SQL (Esha Research, Salem, OR) software version 10.7.0 was used to assess energy and nutrient intake.
On the day of each study session, subjects arrived to the laboratory after an overnight fast. Subjects were scheduled to arrive to the clinic 30 minutes prior to their usual breakfast time.
Upon subjects’ arrival, body weight, blood glucose, hunger level (using 100 mm visual analog scale) and food records were checked to ensure compliance with the study protocol [i.e. change in weight < 2.0 kg, normal fasting blood glucose, and hunger level within 10% of first study visit]. After confirmed compliance, women met with a registered nurse for catheter placement in the non-dominant arm. Initial fasting and subsequent blood samples were collected through the catheter. In addition to blood sampling, subjects also completed visual analog scales (VAS). VAS were used to assess hunger, fullness, desire to eat, prospective consumption and overall acceptability of meals as performed previously in our laboratory [3, 6, 14]. Blood samples and VAS recordings were collected before (0 time) and after each breakfast preload at 20, 40, 60, 90, 120, 150 and 180 min after preload ingestion. After the 180 min assessments, subjects were offered a pasta and salad lunch, which consisted of a tray of pre-weighed pasta, pasta sauce, lettuce greens, carrot, tomato, salad dressing, dinner rolls, butter, cookies, salt, pepper, parmesan cheese and water. Subjects were allowed to eat and drink as much as they wanted of any of the lunch items.
Blood samples were collected in EDTA coated vacutainer tubes after adding aprotinin (protease inhibitor, Fisher Scientific, USA) and then immediately cooled in ice. Plasma was obtained by centrifugation at 2000 x g for 15 min at 4°C. Two 1 mL aliquots of plasma (containing aprotinin) were frozen at – 80°C for determination of CCK concentrations by radioimmunoassay (RIA). Plasma CCK was measured by commercial RIA kits purchased from Immuno-Biological Laboratories, Inc., Minneapolis, MN (kit number RB 302) at the University of California, Davis. The kit uses a highly specific and selective antibody for the bioactive CCK in plasma [16] and has been used previously in our lab [3, 6, 14]. The lowest detectable concentration is 0.3 pmol/L. Cross reactivity with unsulphated CCK is negligible (<0.01%). The inter-assay coefficient of variation for this study was 0.9% at 1.7 pmol/L and 2.3% at 10.9 pmol/L. The intra-assay variation was 2.2%. Laboratory analysis was performed in batches according to the Standardization Program of the US Centers for Disease Control and Prevention, and the National Heart Lung and Blood Institute. Plasma glucose was analyzed using the 2300 STAT Plus (YSI, Inc., the Yellow Springs, OH, USA). Triglyceride was measured using standardized enzyme-based assay kits (Randox, Antrim, UK). Insulin was measured using the AlphaLISA method (Perkin Elmer, Waltham, MA). All assay protocols were performed as per the manufacturer’s instruction with appropriate quality controls as applicable.
2.4Statistical analysis
Data were analyzed by repeated measures analysis of variance RM-ANOVA using PC-SAS (version 9.3; SAS Institute Inc, Cary, NC) MIXED procedure with preload, time, menopausal status as main factors and subject as the blocking variable. Ethnicity was included in the model as a covariate when appropriate. Test meal intake was assessed by difference from pre-weighed food vs post-weighed food on each subjects’ tray. Energy and macronutrient intake among subjects were compared across treatments. Compensatory changes in food intake after test meals was assessed by analyzing the subjects’ food records after leaving the laboratory until midnight of the following day (i.e. post-study food records). Total intake on study days, including the energy from preloads and test meals, as well as the day after each study day (day+1) was compared with usual intake defined by mean energy intake on non-study days (days –3 and –1, respectively). Data analyzed from the VAS were first normalized to subjects’ own fasting/baseline value to account for relative baseline variability among subjects. Significant differences among treatment means were analyzed by Tukey’s honestly significant test for appropriate comparisons. Data are shown as means±standard error or standard deviation (as indicated in Figure legends) or least square mean (LSM)±standard error of the mean (SEM) as an estimate of the post-preload response. Differences between treatments means or LSM were considered statistically significant with p values of less than or equal to 0.05. P values between 0.05–0.1 were considered marginally significant and worthy of mention.
3Results
3.1Subject characteristics
Nineteen (n = 19) women completed the study with mean±SD age of 46±15 years and a BMI of 29.2±3.2 kg/m2. Nine (n = 9) women were PreM and 10 women were PostM (n = 10). Age and BMI of PreM and PostM women were 33.6±12 and 56.4±5.4 years and 29.0±2.6 and 29.1±3.7 kg/m2, respectively.
3.2Subjective satiety
Visual Analog Scales (VAS) were used to determine the preload associated changes in subjective measures of satiety and motivation to eat. A significant preload, time and preload by menopausal status interaction was apparent for hunger (p = 0.02, p < 0.0001, p = 0.003, respectively) and fullness (p = 0.001 p < 0.0001, p = 0.006, respectively). In general, adding fiber to a meal increased fullness compared to the NFC, however, suppression of hunger was greatest with the higher ratio of soluble fiber compared to the meal with higher insoluble ration of fiber (p = 0.004) (Table 2).
Table 2
Subjective Satiety for All, Post Menopausal (PostM) and Pre Menopausal (PreM) Women1
| Hunger2 | Fullness3 | Desire to eat4 | Prospective Consumption5 | |
| All women (n = 19) | ||||
| NFC | –29.6±4.7a,b | 29.9±4.4a | –29.1±4.4 | –26.3±3.2 |
| SF | –33.7±4.7a | 36.4±4.4b | –33.6±4.4 | –26.4±3.2 |
| IF | –26.5±4.7b | 40.4±4.4b | –31.4±4.4 | –28.9±3.2 |
| PostM Women (n = 10) | ||||
| NFC | –33.2±6.6a | 27.8±6.2a | –32.4±6.2 | –27.4±4.5 |
| SF | –35.0±6.6a | 42.4±6.1b | –36.4±6.2 | –29.5±4.5 |
| IF | –21.8±6.6b | 38.2±6.1b | –31.0±6.2 | –31.2±4.6 |
| PreM Women (n = 9) | ||||
| NFC | –26.0±6.6 | 31.9±6.1a | –25.8±6.2 | –25.2±4.6 |
| SF | –32.4±6.6 | 30.4±6.2a | –30.9±6.2 | –23.4±4.6 |
| IF | –31.2±6.6 | 42.6±6.1b | –31.7±6.2 | –26.6±4.6 |
1Values represent the subjects change from baseline for each variable as least square means (LSM) ± standard error of the mean (SEM). 2Mean baseline hunger (n = 18) for NFC, SF, IF: 53.7±6.2, 59.4±6.2, 53.2±6.2, respectively. 3Mean baseline fullness (n = 18) for NFC, SF, IF: 29.1±6.6, 24.1±6.6, 17.6±6.5, respectively. 4Mean baseline desire to eat (n = 18) for NFC, SF, IF: 54.6±6.5, 64.3±6.3, 60.2±6.4, respectively. 5Mean baseline prospective consumption (n = 18) for NFC, SF, IF:48.9±5.6, 51.8±5.6, 56.4±5.6, respectively. Values with different letters are significantly different (p < 0.05).
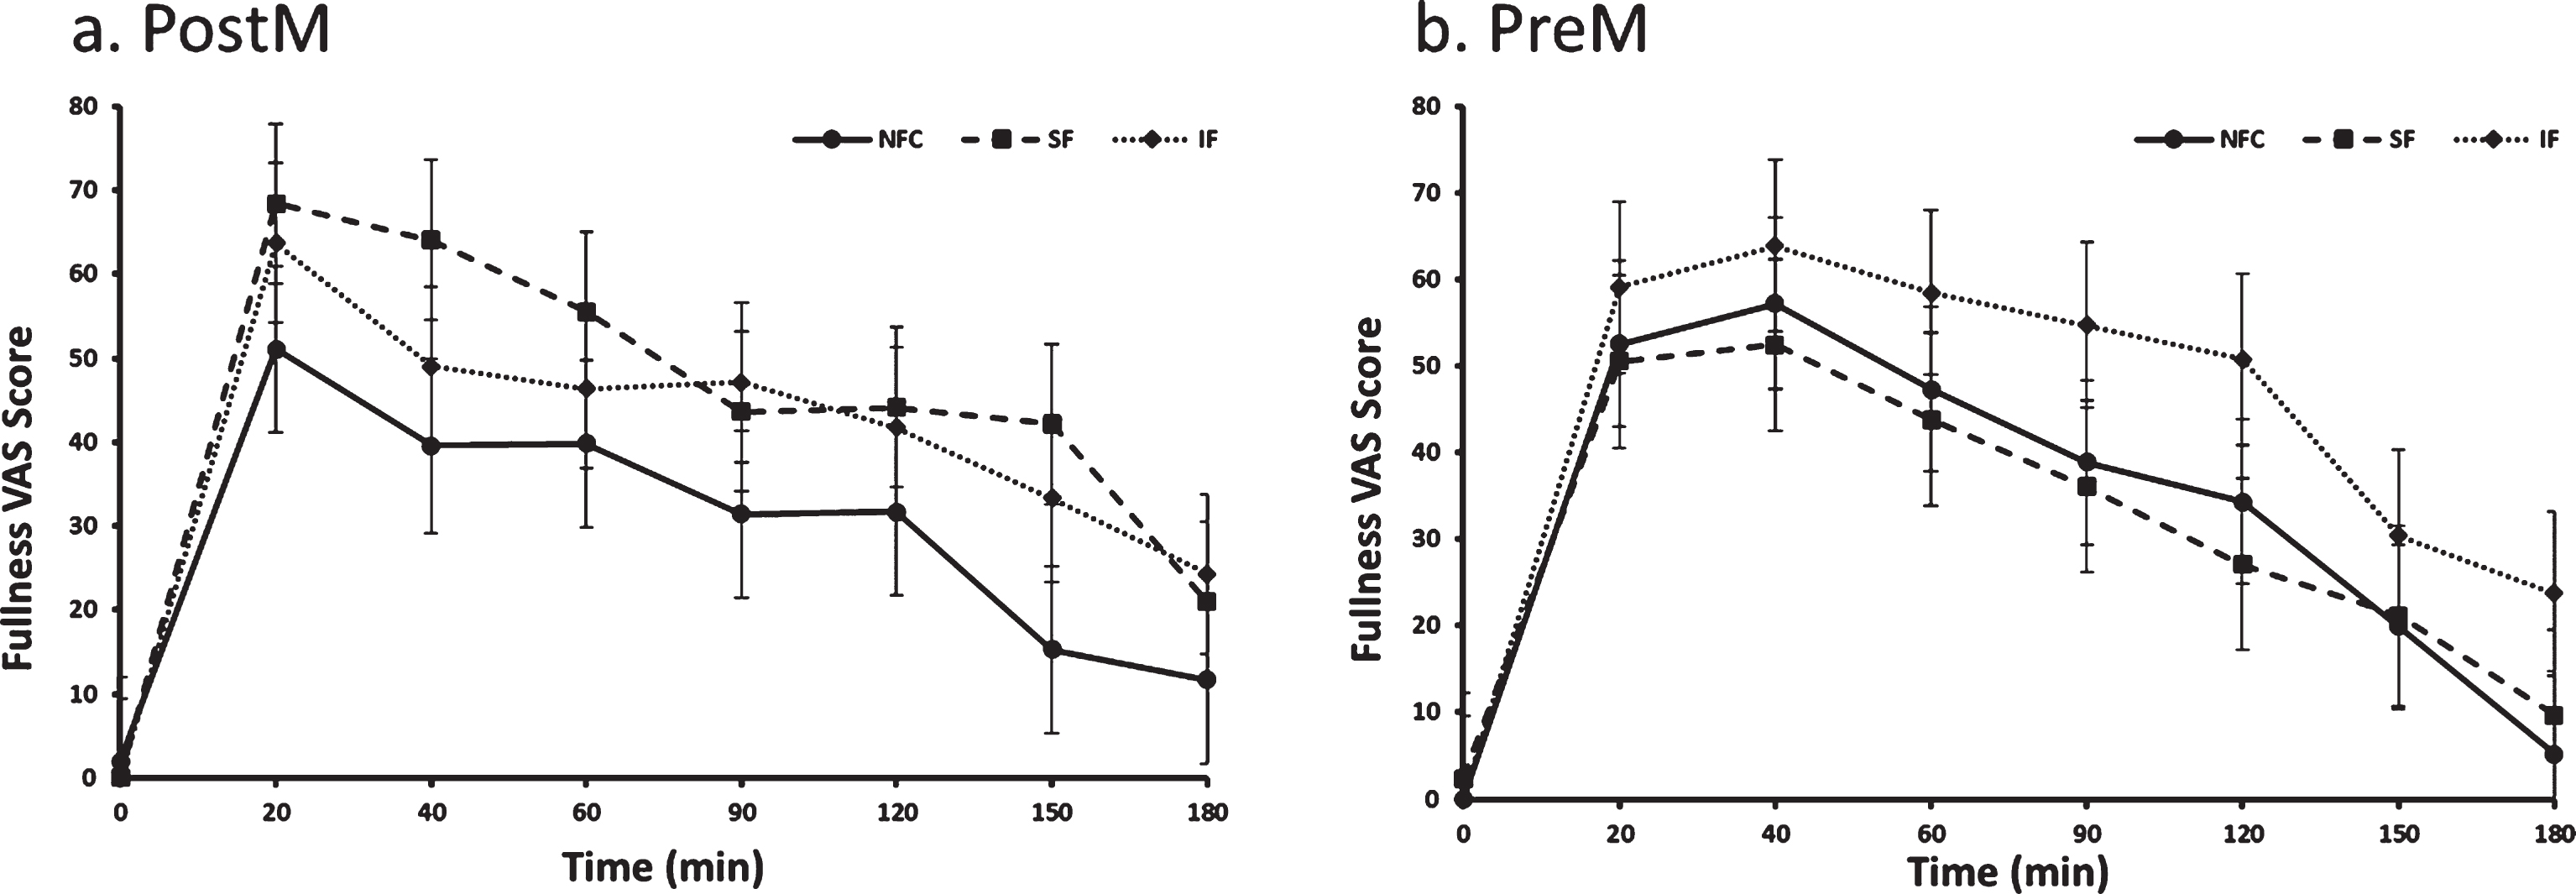
The preload by menopausal status interaction indicated a difference in response to preloads depending on whether women were PostM or PreM. For the PostM women, the SF suppressed hunger more than the IF meal (p = 0.0002), but was not different than NFC (Table 2 and Fig. 1a, p > 0.05). In PreM women, hunger suppression did not differ by preload (Table 2 and Fig. 1b). For fullness, PostM women did not differentiate between fiber containing preloads; however, both fiber preload meals (SF and IF) induced greater feelings of fullness compared to the NFC meal (Table 2 and Fig. 2a, p = 0.0004, p = 0.01, respectively). Among PreM women, greater feelings of fullness were reported after the IF preload compared to the SF and NFC preload (Table 2 and Fig. 2b, p = 0.004, 0.008, respectively). No significant differences were observed between preloads, menopausal state, or preload by menopausal state for desire to eat and propective consumption(Table 2).
Fig. 1a and b.
Hunger variation in Postmenopausal (PostM, n = 10) and Premenopausal (PreM, n = 9) women after NFC-No Fiber Control, IF-Insoluble Fiber, SF-Soluble Fiber meals. Values are the means±SEM at each time point. Different letters at the same time point denotes significant difference, p < 0.05.
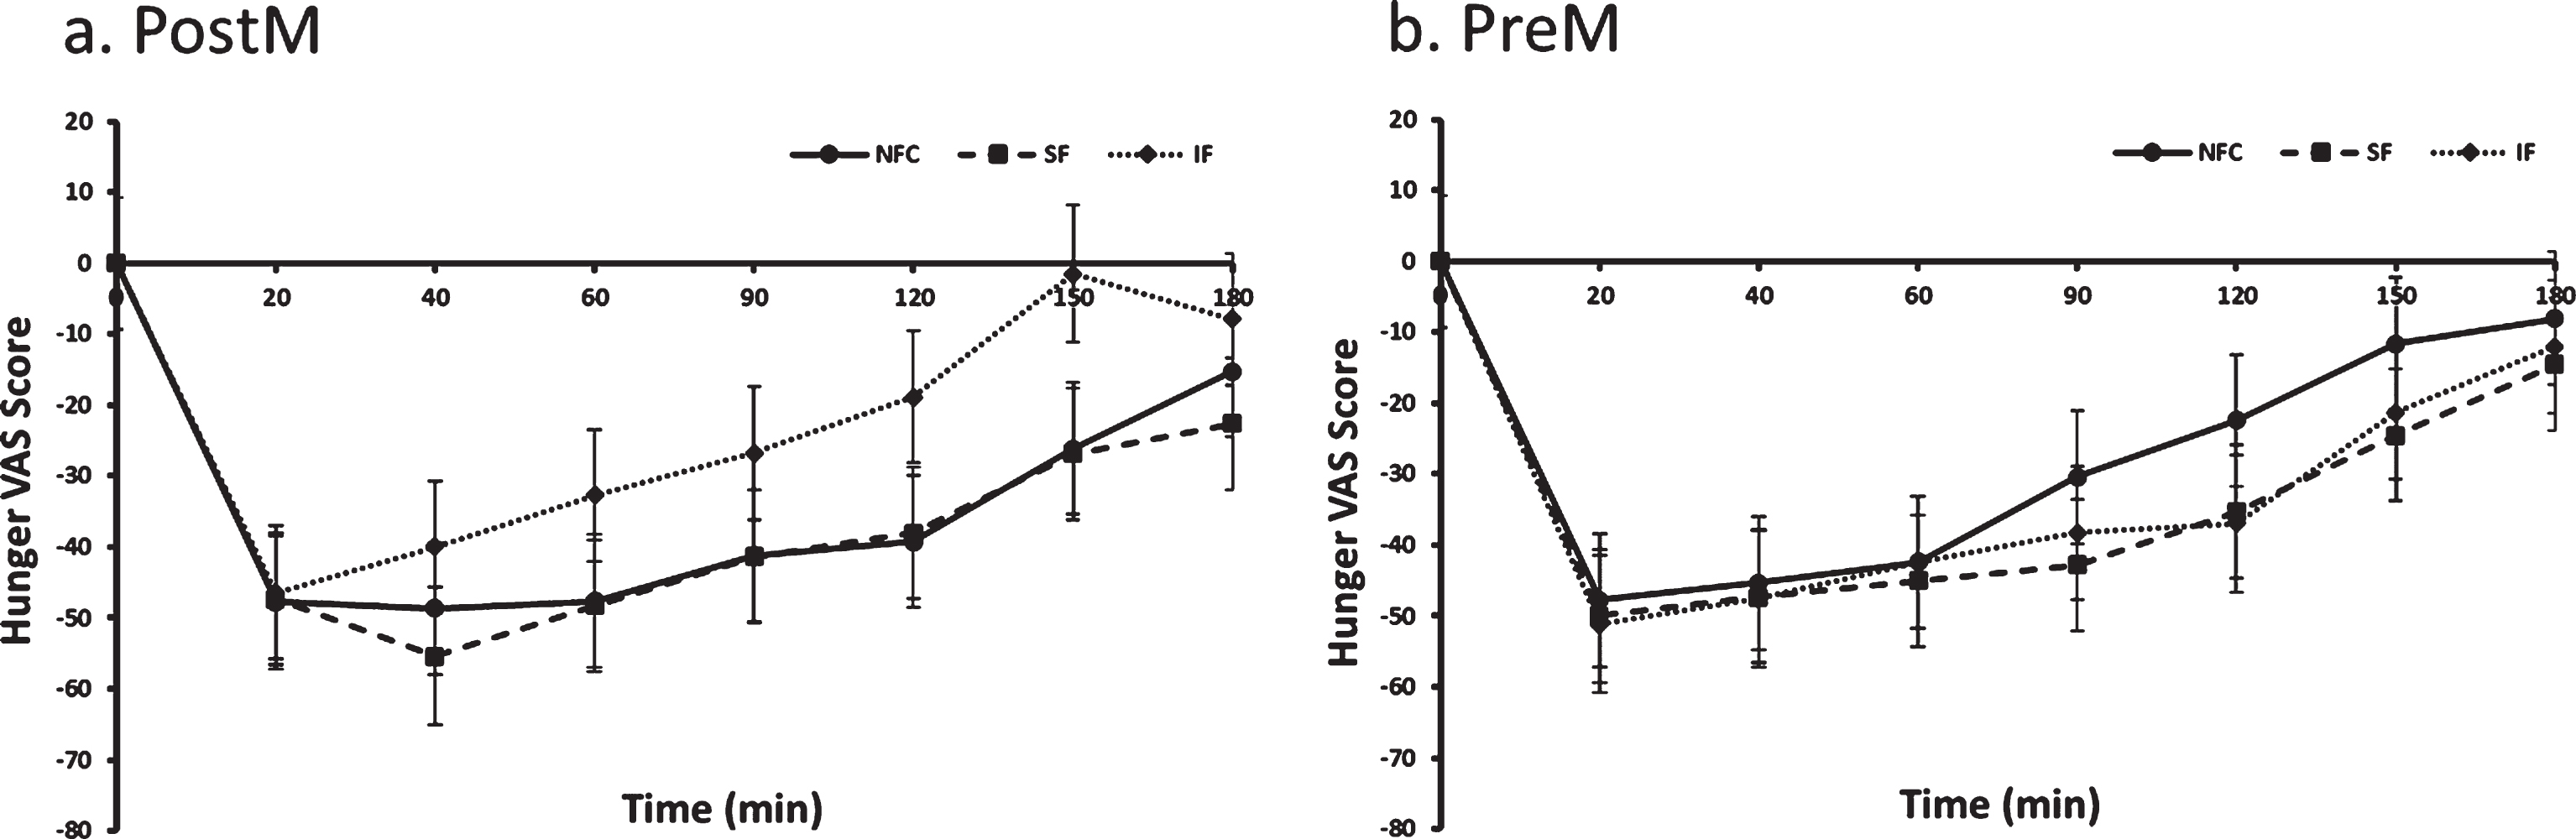
Fig. 2a and b.
Fullness variation in Postmenopausal (PostM, n = 10) and Premenopausal (PreM, n = 9) women after NFC-No Fiber Control, IF-Insoluble Fiber, SF-Soluble Fiber meals. Values are the means±SEM at each time point. Different letters at the same time point denotes significant difference, p < 0.05.
3.3Food intake: Test meal intake, Post-study intake and Usual intake
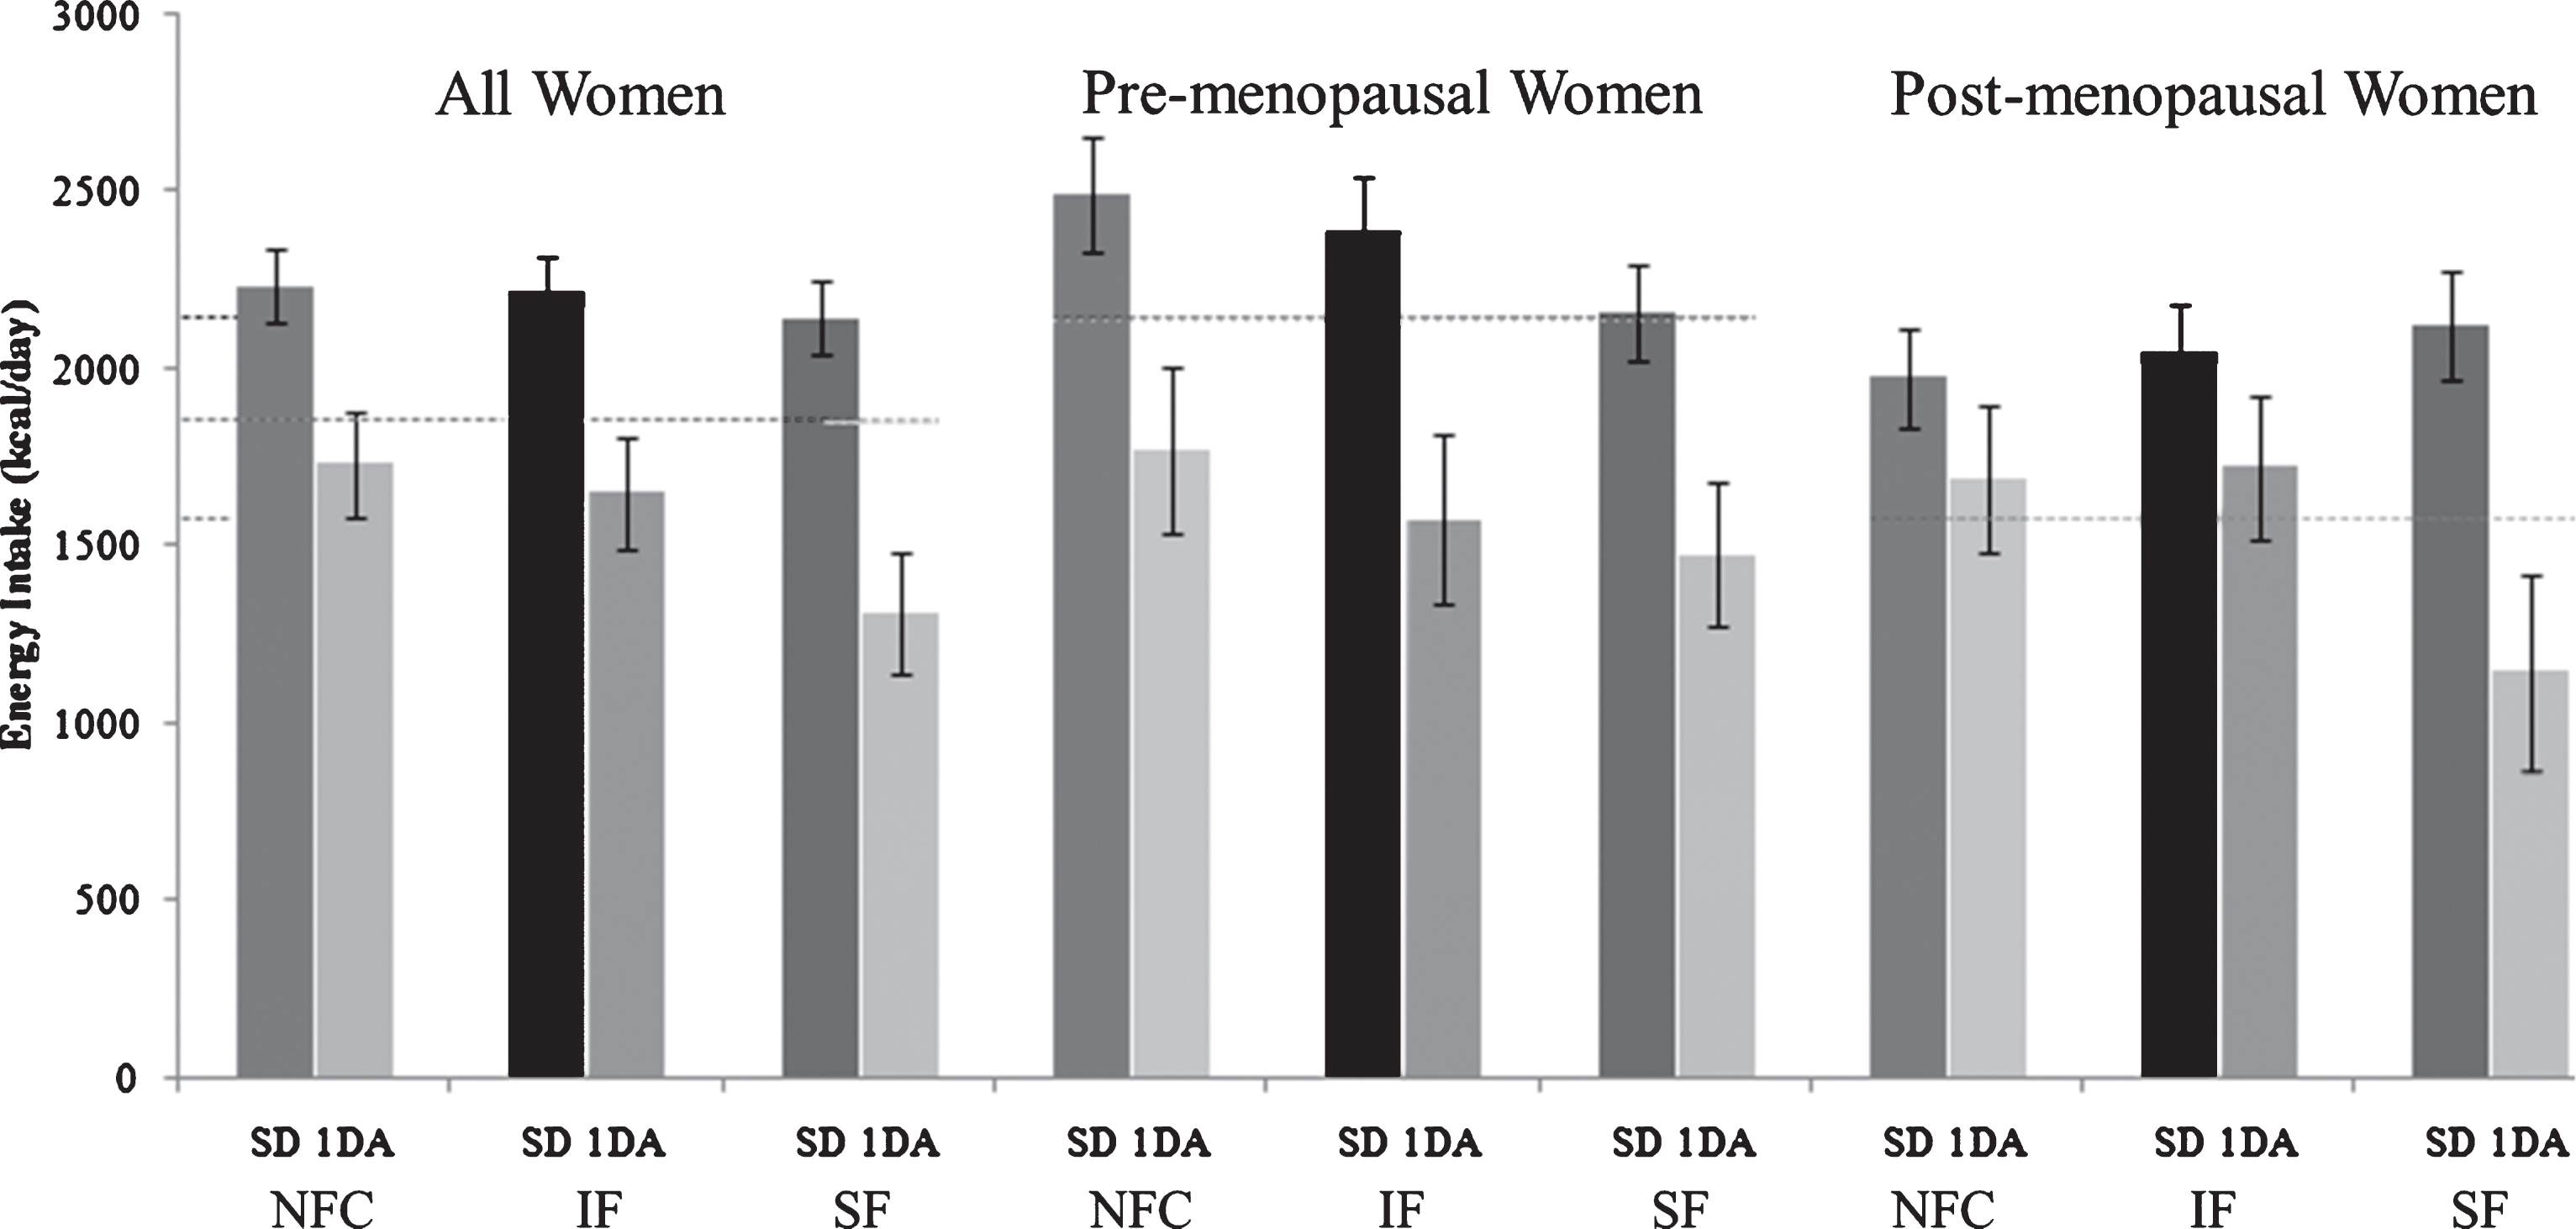
Test meal energy intake 3 h after the NFC or fiber preloads (SF or IF) were not different (NFC; 841±39 kcal [3520±163 kJ], IF; 943±39 kcal [3947±163 kJ], SF; 883±39 kcal [3696±163 kJ], p = 0.095). Assessment of energy intake on study days after subjects left the study site (Day 0) and the study day after (Day+1) are shown in Fig. 3. Energy intake on day+1 were: NFC; 1762±122 kcal [7375±557 kJ], IF; 1675±133 kcal [7011±557 kJ], SF; 1417±137 kcal [5931±573 kJ], p = 0.055). Background diets were monitored using scale-weighed food records collected 3 and 1 day before each study session (Days – 3 and – 1) to assess consistency in eating patterns leading into each visit and to provide a general assessment of background dietary intake. Subjects consumed approximately 1859 kcal/d ± 161 of which ∼32%, 15%, 53% kcal were from fat, protein and carbohydrate, respectively. As a group, PreM women consumed approximately 35% more energy than PostM women; however, energy distribution among macronutrients did not differ between groups. Fiber intake of subjects was ∼10 g/1000 kcal and did not differ among sub-groups (data not shown).
Fig.3
Energy intake on study day (including preload and test meal) and one day after with respect to NFC, IF and SF meals. (NFC-No Fiber Control, IF-Insoluble Fiber, SF-Soluble Fiber, SD-Study Day, 1 DA- One Day After).
3.4Cholecystokinin (CCK) resposne to preloads
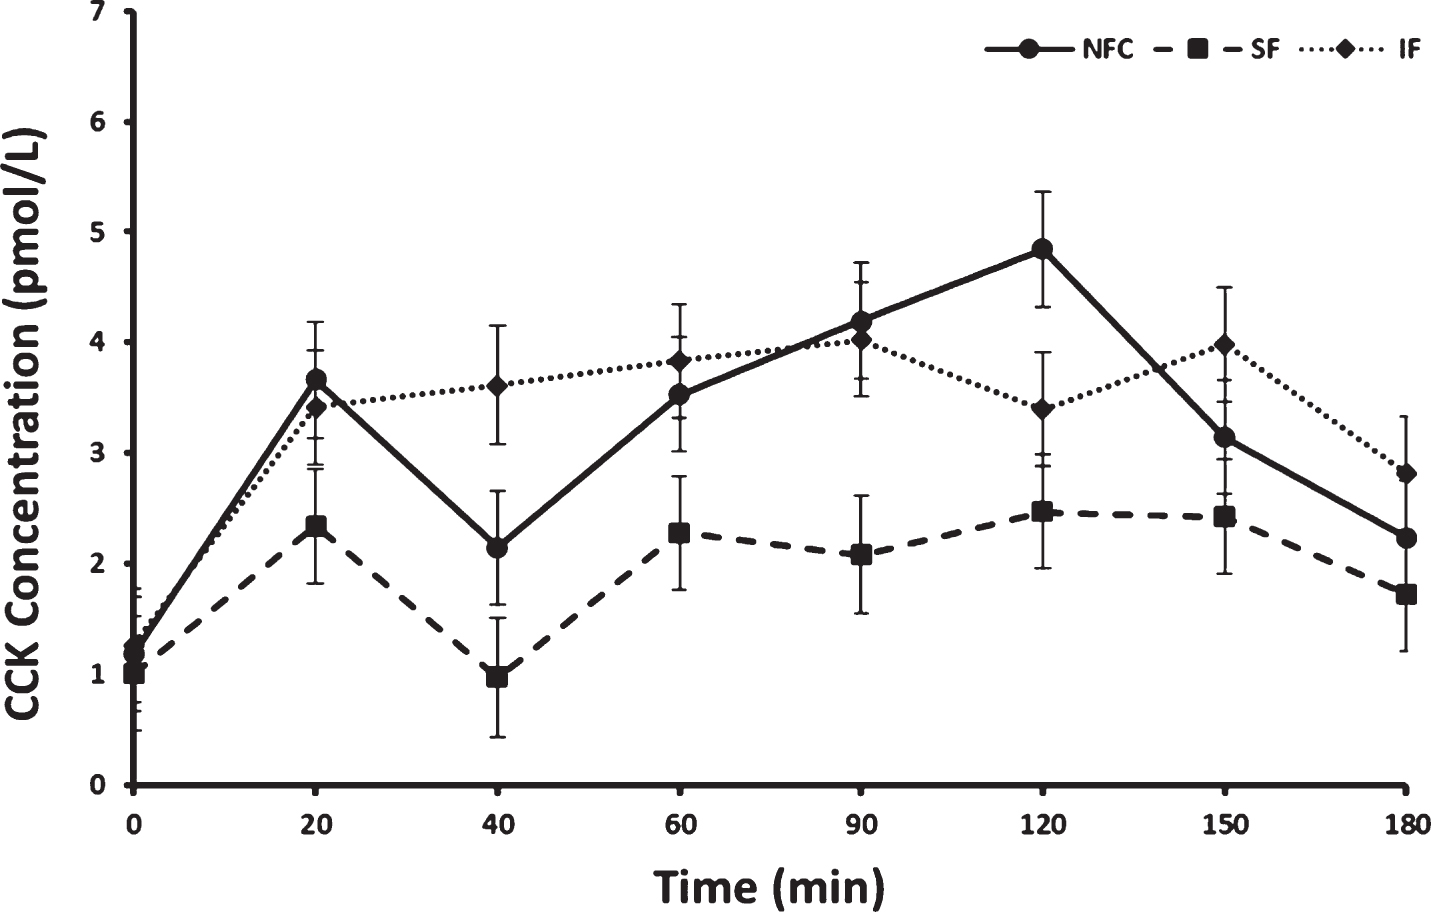
Fasting concentrations of CCK did not differ prior to consuming preloads. Postprandial CCK responses differed by preload and time (p < 0.0001 and p < 0.0001, respectively). No interaction between menopausal status or menopausal status by preload was apparent (p > 0.05 for both). Overall, CCK increased significantly from baseline after all meals (p < 0.0001); however, the overall postprandial response was lowest after the SF preload. This response after SF preload was significantly different from the IF and NFC preload responses [LSM±SEM; SF, 1.92±0.27 pmol/L, NFC, 3.12±0.27 pmol/L, (SF vs NFC p < 0.0001) and IF, 3.30±0.27 pmol/L, (SF vs IF p < 0.0001), Fig. 4]. No significant difference in CCK concentrations was observed between NFC and IF preload meals.
Fig.4
Cholecystokinin (CCK) variation in response to consumption of NFC-No Fiber Control, IF-Insoluble Fiber, SF-Soluble Fiber meals in all women (n = 17). Values are the means±SEM at each time point. Different letters at the same time point denotes significant difference, p < 0.05.
3.5Glucose responses to preloads
Postprandial glucose differed by time, menstrual status and menstrual status by preload interaction (p < 0.0001, p = 0.02 and p = 0.04, respectively). In general, PostM had a mean higher glucose response to preloads compared to PreM women (100.8±3.0 and 89.8±2.3, respectively, p = 0.02). Among the PostM women, the NFC and the SF preloads produced lower postprandial glycemia than the meal with the IF (NFC vs IF, p = 0.006 and SF vs IF, p = 0.005, Fig. 5a), Alternatively, no significant differences among preloads were apparent among the PreM women (p > 0.05, Fig. 5b).
Fig. 5a and b
Variation of glucose responses to NFC-No Fiber Control, IF-Insoluble Fiber, SF-Soluble Fiber meals in Postmenopausal (PostM, n = 10) and Premenopausal (PreM, n = 9) women (Fig. 6a and b, respectively). Values are the means±SEM at each time point. Different letters at the same time point denotes significant difference, p < 0.05.
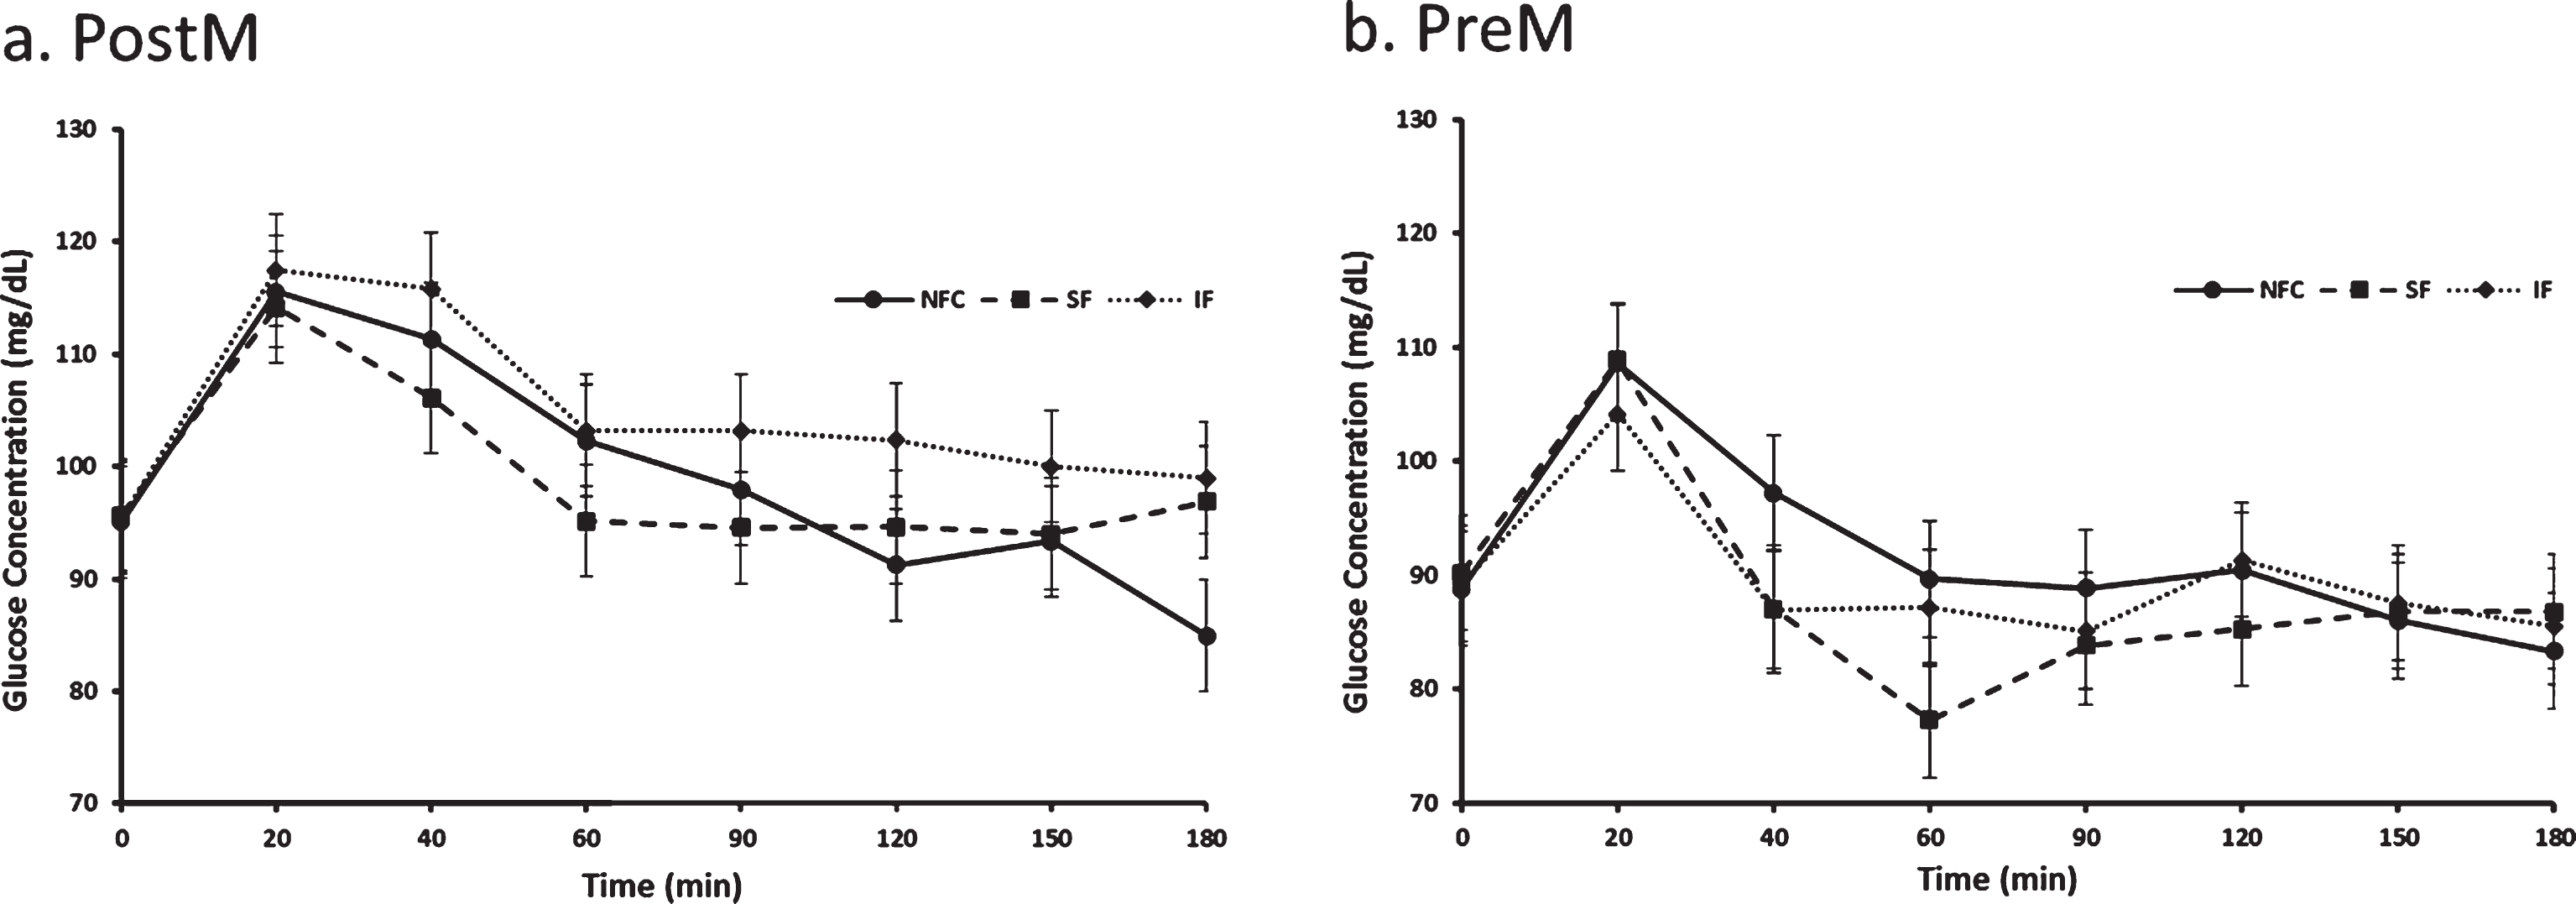
Fig. 6a and b.
Variation of insulin responses to NFC-No Fiber Control, IF-Insoluble Fiber, SF-Soluble Fiber meals in Postmenopausal (PostM, n = 10) and Premenopausal (PreM, n = 9) women (Figs. 7a and b, respectively). Values are the means±SEM at each time point. Different letters at the same time point denotes significant difference, p < 0.05.
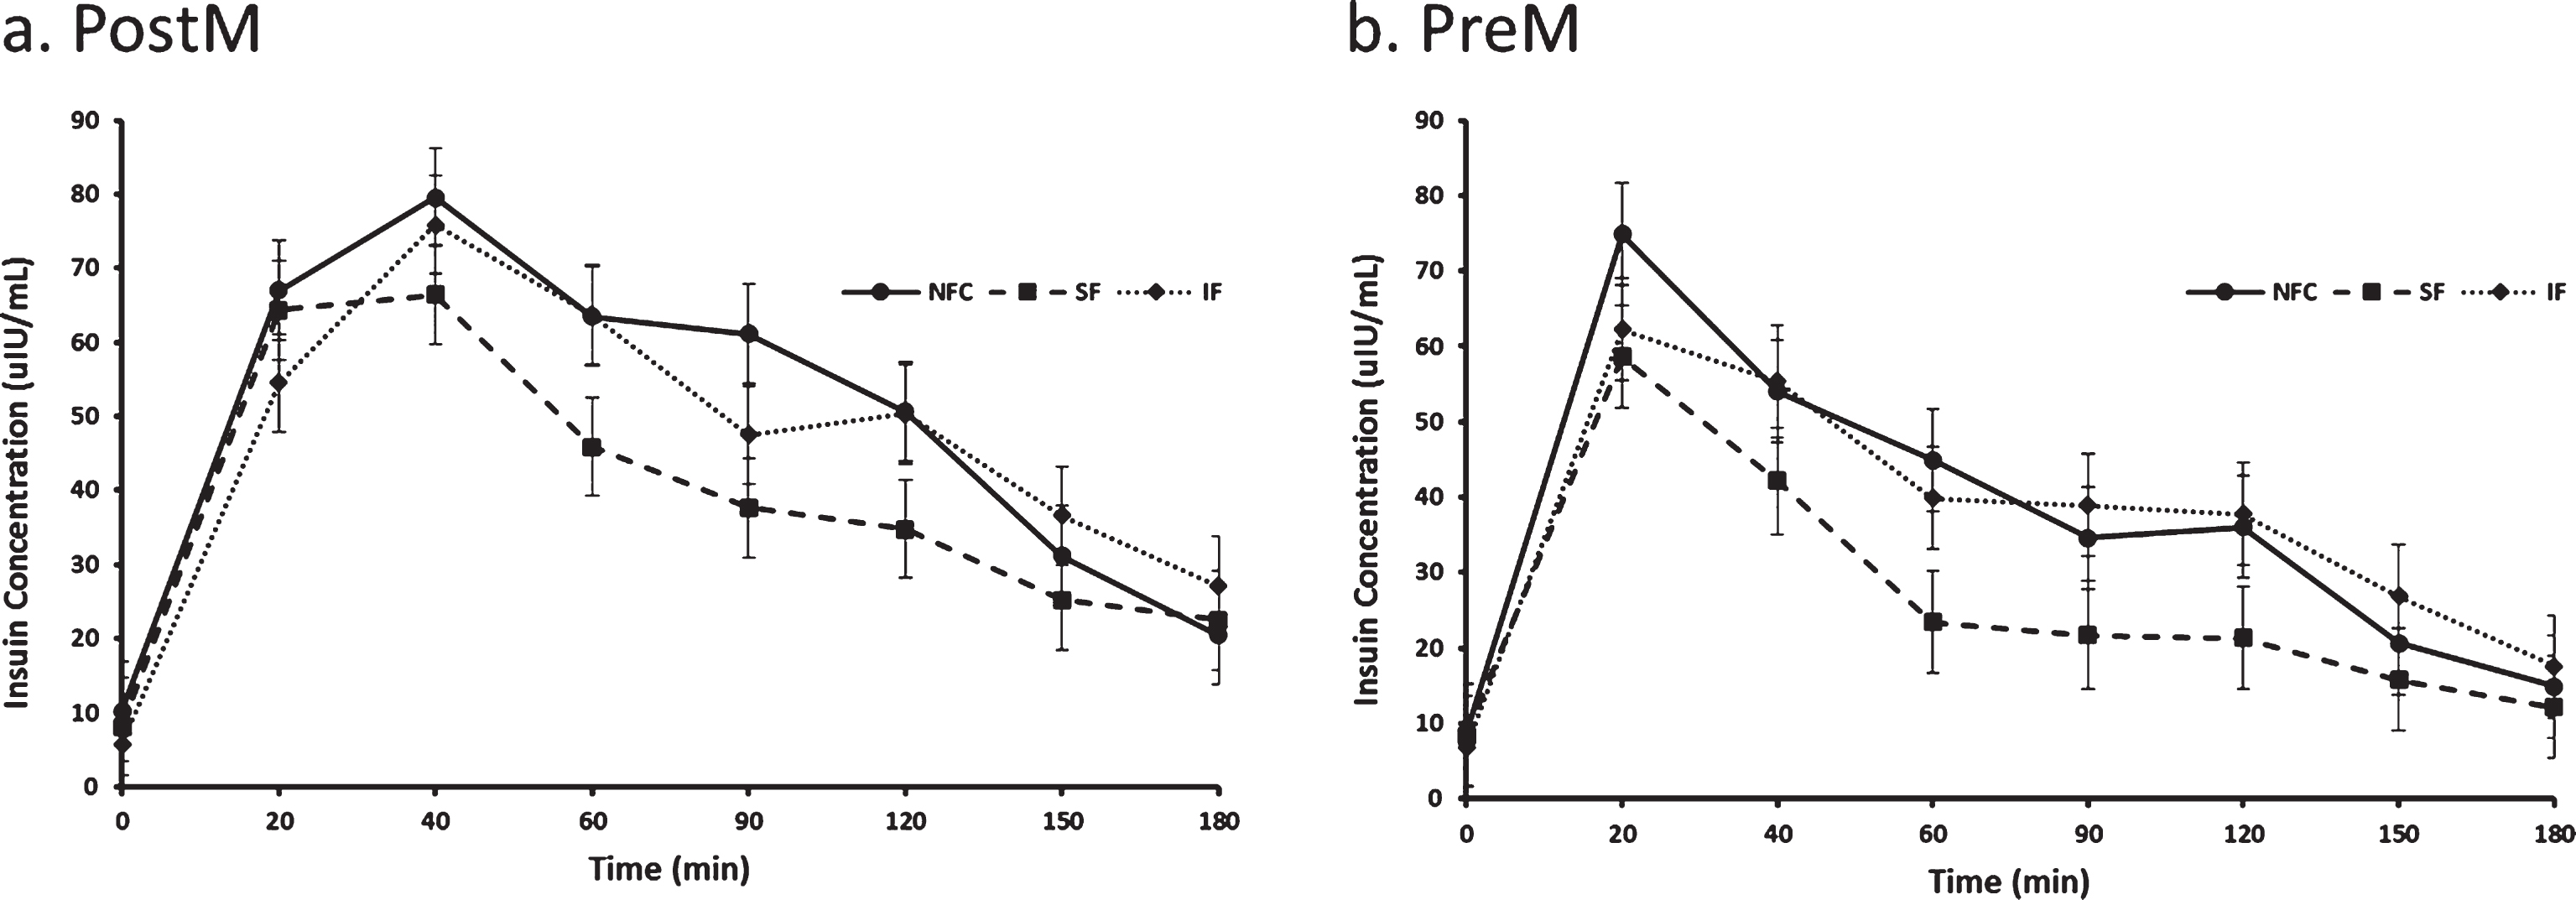
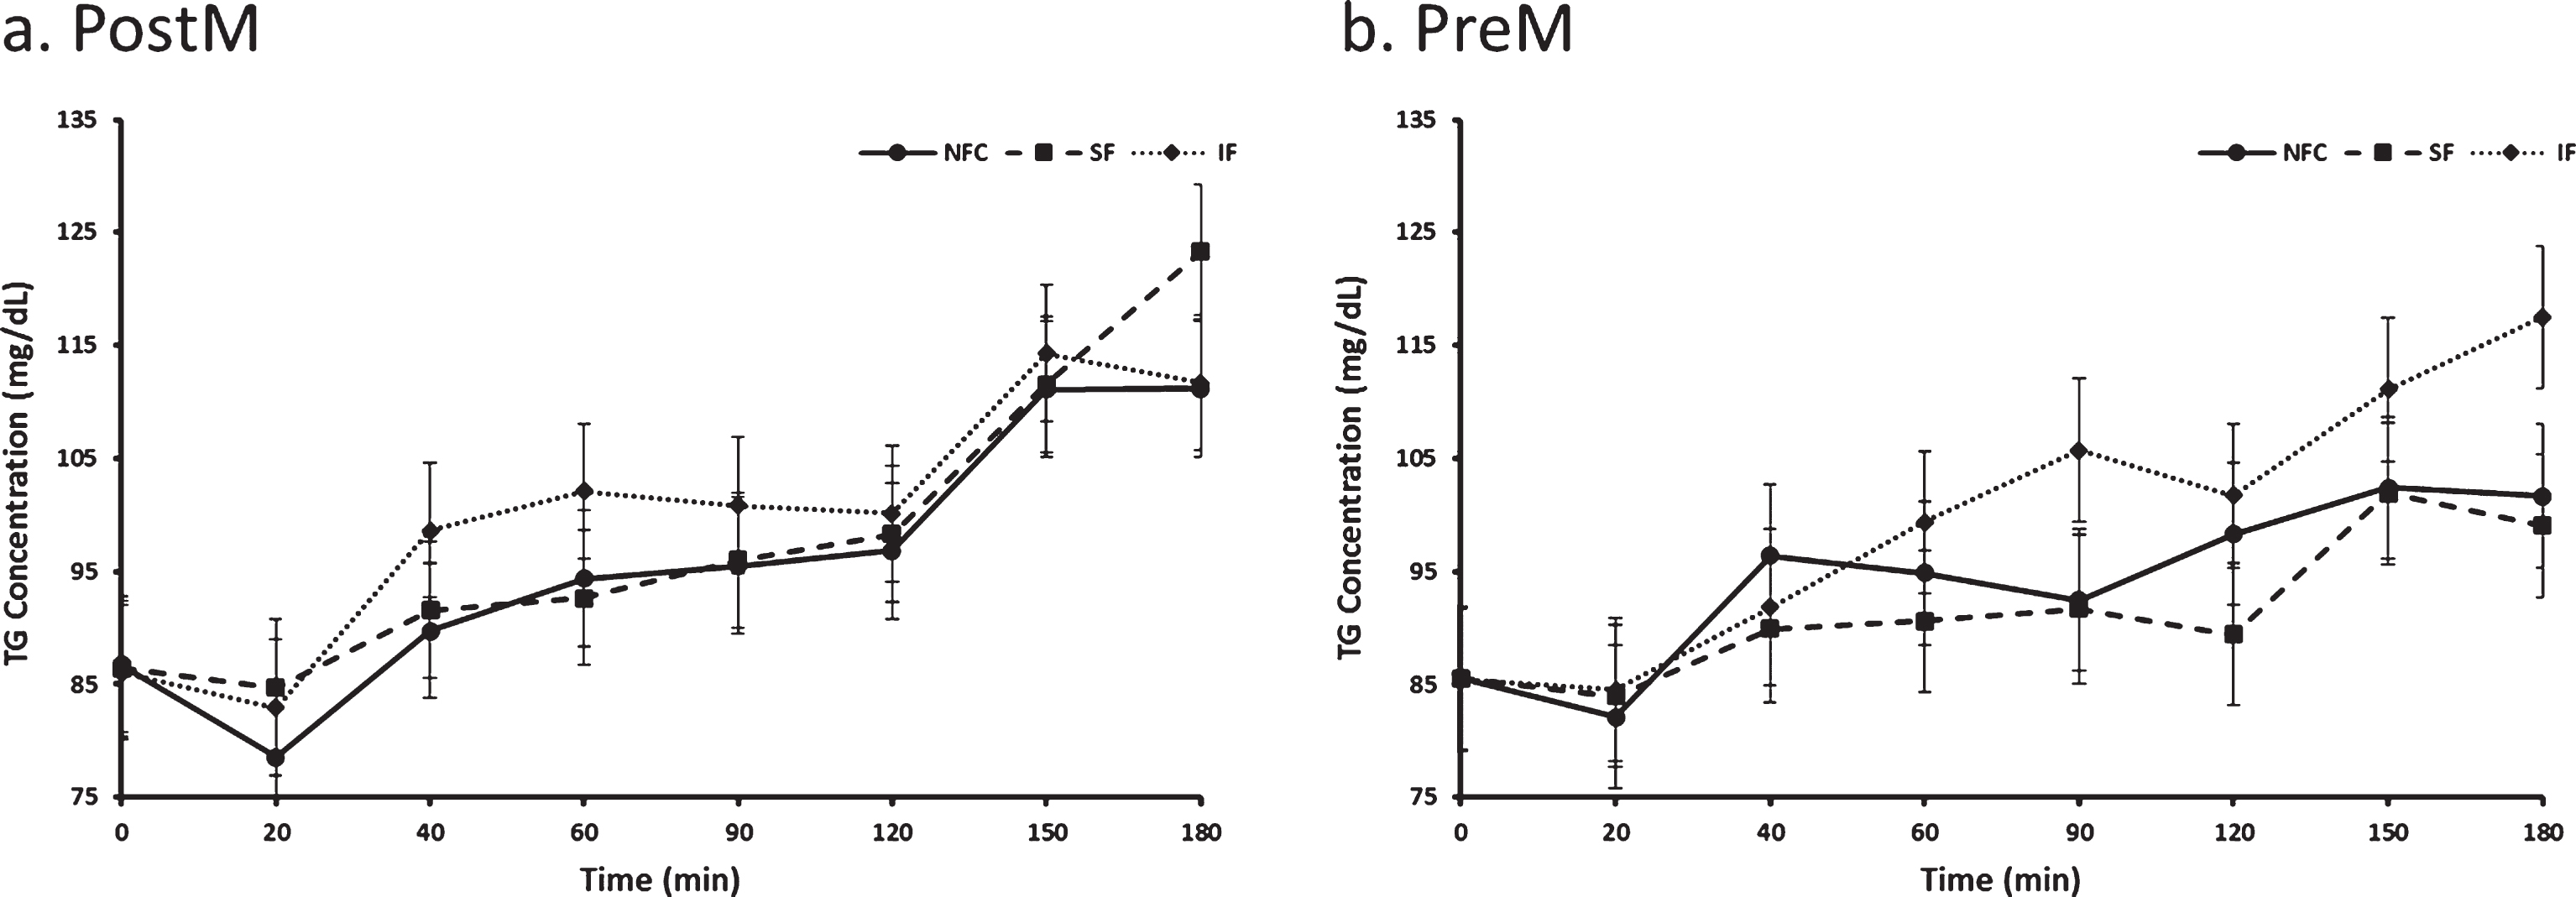
Fig. 7a and b.
Variation of triglyceride responses to NFC-No Fiber Control, IF-Insoluble Fiber, SF-Soluble Fiber meals in Postmenopausal (PostM, n = 10) and Premenopausal (PreM, n = 9) women (Figs. 8a and b, respectively). Values are the means±SEM at each time point. Different letters at the same time point denotes significant difference, p < 0.05.
3.6Insulin responses to preloads
Postprandial insulin differed by preload, time and menstural status (p < 0.0001, p < 0.0001 and p = 0.04, respectively). Insulin reseponses were lowest after the SF preload (31.78±3.00μIU/mL) compared to the IF (40.41±3.00μIU/mL) and NFC (42.03±3.00μIU/mL) preloads (p < 0.0001 for both, Fig. 6). Irrespective of the preload, PreM women had significantly lower postprandial insulin concentrations compared to PostM women (32.39±3.63μIU/mL, 43.76±3.81μIU/mL respectively, p = 0.04).
3.7Triglyceride responses to preloads
Postprandial triglyceride differed by preload and time (p = 0.0090 and p < 0.0001, respectively). Triglyeride response was highest after IF preload (99.6 mg/dl) compared to SF (94.8 mg/dl) and NFC (94.9 mg/dl) preload (p = 0.0073 and p = 0.0081, respectively). No difference was seen between NFC and SF preloads (p > 0.05). Menopausal status did not significantly affect postprandial triglyceride response (p > 0.05, Fig. 7).
4Discussion
The purpose of the study was to evaluate the effect of fiber type on satiety and metabolic responses in overweight women with the aim of maximizing the positive outcomes for both appetite and metabolic control. Furthermore, we were interested in understanding the influence of menopausal status on study outcomes to determine if guidance in fiber intake may differ amongst women who were PreM versus PostM. The soluble and insoluble fiber, psyllium husk and cellulose, used in the present investigation were chosen due to their common use in food product settings and natural presence in plant based foods [17, 18]. Across all fiber treatments, no more than 12 g of total fiber was added to maintain fiber amounts within recommened intake levels [19]. In general we found that adding ∼12 g of fiber to a breakfast preload meal increased sensations of fullness for all women; however, among the PreM women, the IF was more filling than the SF and NFC preload. PostM women did not differentiate between fibers on fullness ratings. In contrast, hunger suppression was greatest after the SF preload compared to the IF preload in all women and these fiber-specific differences on hunger suppression were most apparent in the PostM women. CCK, a satiety peptide, did not predict the responses in subjective satiety observed in women, suggesting alternative mechanisms are likely at work. Insulin responses were lower in all women after the SF meal and did not differ by menopausal status. Interestingly, glycemic responses were not different by preloads in the PreM women despite lower insulin after the SF meal. This may suggest enhanced insulin sensitivity with the SF preload since less insulin was required to achieve the same glycemic response. Among PostM women who had higher and more variable glycemia, the IF meal resulted in elevated postprandial glycemia compared to both the SF and NFC preloads. The reason for this latter finding is not entirely clear; particularly since insulin was elevated in the IF condition similar to the NFC condition. One possibility is that glucose dropped nearly 10 mg/dL after the NFC preload between the 150 minute time point and the 180 timepoint, whereas after the fiber preloads, glycemia was stable.
Numerous studies have examined the glycemic effect of soluble and insoluble fibers, including psyllium husk and cellulose. Psyllium husk has primarily been investigated in people with diabetes and consistently shown to lower glucose with similar results observed in nondiabetic populations [20–22]. A meta-analysis conducted by Gibb et al. [23] reported psyllium fiber improves glycemic control proportional to the loss in glycemic control. Among the non-diabetic individuals exhibiting euglycemia, psyllium fiber had little effect except for reductions in peak glucose and insulin, whereas the greatest improvement in glycemic control was observed in those people being treated for T2DM [23]. In a study of women 30–48 y old, adding 10.5 g psyllium husk to a glucose drink reduced the glucose and insulin area under the curve by ∼11% and 36%, respectively [24]. However, adding about a tenth of the dose (1.7 g psyllium husk) to a pasta meal did not impact glycemic responses compared to a pasta meal without psyllium husk [25]. Our study tested a breakfast preload delivering ∼12 g fiber of which either 3 g or ∼9 g was from psyllium husk. The higher psyllium husk preload (i.e. SF) reduced postprandial glycemia, supporting the need for higher doses of psyllium to impart a glucose lowering effect. However, our data also revealed differences in glycemic response relative to menopausal status. The glucose lowering effect of SF was evident in the PostM women but not the PreM women which is consistent with findings of the Gibb et al. meta-analyses. The PostM women in the present study exhibited higher glycemia than the PreM women and, accordingly, achieved greater benefit from the SF meal compared to the PreM women. In contrast, menopausal status did not influence postprandial insulin responses to preload meals. The SF preload significantly reduced postprandial insulin in both PreM and PostM women. This result is consistent with other studies reporting decreased insulin responses with soluble fibers compared to a control in mixed and female only populations [23, 26]. Overall, our data support adding higher ratios of viscous type soluble fibers to insoluble fiber meals or meal products can impart favorable glycemic and insulinemic responses in adult PreM and PostM women.
In addition to glycemic control, fibers have been the subject of multiple acute and long-term appetite and food intake studies. Accordingly, several reviews have been written to gain a better understanding of the type and amount of fibers needed to maximize satiety and control appetite and food intake [10, 27–29]. In general, comparisons of fibers vs a control have shown relevantly reduced appetite in ∼40% of the published studies [29, 30]. The most effective fibers appear to be soluble fibers with viscous properties [30] although disparity remains amid the viscous fibers since psyllium fibers are among the least effective in inducing satiety and food intake control [29]. In the present study, both fiber containing preloads increased fullness compared to a no added fiber control (NFC) preload, but the insoluble (cellulose) fiber (IF) preload produced the greatest feeling of fullness compared to NFC and soluble (psyllium) fiber (SF) preload in PreM women. Alternatively, the PostM women did not distinguish between the two fiber containing preloads, suggesting PreM women distinguish fiber types, but Post M women do not. Hunger suppression, on the other hand, was suppressed by the SF meal compared to the IF meal in all women although this was driven by the enhanced suppression in the PostM women since PreM women did not differ in hunger suppression by preload type. These differences in hunger and fullness responses to added fibers among PreM and PostM women likely underely some of the confusion in the literature. Understanding responses to treatments within different populations is critical in the dietary recommendations process if we expect successful outcomes. In this regard, genotypes are not always necessary for personalizing nutrition, but clarifying the influence of basic subject characterisitics on treatment outcomes.
Energy intake at a subsequent meal provides behavioral data relevant to the satiety value of a preload. Subjective satiety measures inconsistently predict energy intake at a subsequent meal, and this is true in fiber focused studies as well [29, 30]. Varying factors likely contribute to the inconsistent relationship, among which the time delay to a subsequent (test) meal assessment is an important factor. With fibers, their properties can greatly influence timing of their action. For example, fibers with fermentation qualities would require a much longer time delay than non-fermentatble fibers to capture their effect. The current study used a time delay of 3 h between preload and test meal, which is in line with other research considering preload energy (∼500 kcal) and the fiber types we used [31, 32]. While we did not observe a significant effect of preloads on energy intake at the test meal, there was a general trend for increased intake after the IF meal. This was constant in both PreM and PostM women and generally followed the hunger results which indicated the lowest hunger suppression after IF preload, which was significantly lower than the SF meal. Because the time frame of a fibers effect can influence outcomes, we also assessed intake the rest of the day and the next day after participants left the lab. In general, the preload associated effects on food intake appeared to be delayed (p = 0.055). The SF meal was associated with ∼23% reduction in energy intake the day after each study day compared to group mean usual intake (∼1860 kcal/day) and approximately 15 and 19% lower energy intake compared to the IF and NFC associated day+1 intakes, respectively. These data require further study to better understand the long-term benefits of SF inclusion in the diet, particularly for PostM women, who were more sensitive to the SF vs IF fibers for energy intake control.
Cholecystokinin was the one satiety peptide monitored in this study based on previous research with women indicating that women are sensitive to meal composition and intestinal phase satiety mechanisms, particularly CCK [3, 4, 33]. Previous studies have shown that soluble fibers have the potential to increase plasma CCK levels after fiber intake [3, 34], however, the CCK responses to preloads in the present study did not correspond with satiety or energy intake outcomes of previous investigations. CCK release is dependent upon stimulation of CCK secreting cells in the upper third of the small intestine by the release of digestive products of fat. Enhanced viscosity of intestinal contents with soluble fibers can delay enzymatic action in the duodenum reducing release of substrate to stimulate CCK secretion. The CCK response in the present study was lowest after the SF meal with no influence by menopausal status. A possible explanation for the difference in observations from this and our previous research may be the difference in fiber administration or type. When CCK was associated with the satiety response in women, viscous fibers were provided through foods with inherent fiber content, namely pectin and oat bran [3]. These differences may be reflective of fiber type or matrix, suggesting potential differences in the actions of ingested fibers, in general, and when supplied as a dietary vs functional (added) fiber. However, we expect that alternative mechanisms may also be involved since the SF preload was associated with subjective satiety and influenced energy intake. Gut peptides released from the lower small intestine and bowel are possible targets for explaining our results [35–38].
The influence of menopausal status on satiety and metabolic responses was an important consideration in this study since declining estrogen levels after menopause has been associated with suppressed appetite [39, 40]. Amongst 94 peri-menopausal women, desire to eat, hunger, and prospective food consumption was shown to increase through the menopausal transition and remained elevated through PostM years. Although we did not observe a difference on appetite ratings between groups based on menopausal status, we did observe menopausal by preload interactions that we believe are important for making dietary recommendations to maximize appetite and energy intake control.
Our study had strengths and limitations worth noting. The study was designed as a crossover trial, thus allowing subjects to serve as their own control. All preloads were administered in a blinded fashion and testing of fiber types was conducted in ratios that maintained similar fiber which was then compared against a no fiber control. The design also incorporated the testing of women by menopausal status which was unique since limited data on the subject is available. However, this also led to one of the limitations of the study as age was naturally different between the two groups. PostM status is generally associated with aging women and PreM with younger women. The impact of age vs menopausal status could not be separated in this study. Other limitations included a small sample size and the acute nature of the study limited translation to long-term effects. Despite the limitations however, the study presents new data and insight to be used for the design of future (long-term) studies and devising customized/personalized dietary recommendations for women with the goal of maximizing metabolic and appetite control during their PreM and PostM years. Overall, it appears that incorporating a greater proportion of soluble fibers into a meal delivers generally more metabolic, appetite and energy intake control benefit to adult women than a similar amount of fiber with a higher ratio of insoluble fibers.
Acknowledgments
The author would like to thank Jan Peerson, University of California, Davis for her expert statistical consultation, Jody Randolph, University of California Davis for analysis of CCK and Julie Talbot, Illinois Institute of Technology for food record analysis. Study funds were from the International Life Science Institute, U.S.A. The authors have no conflict of interest associated with this study.
References
[1] | Ogden CL , Carroll MD , Fryar CD , Flegal KM . Prevalence of obesity among adults and youth: United States, 2011–2014. NCHS data brief, no 219. Hyattsville, MD: National Center for Health Statistics. (2015) . |
[2] | Hirschberg AL . Sex hormones, appetite and eating behaviour in women. Maturitas. (2012) ;71: (3):248–56. |
[3] | Burton-Freeman B , Davis PA , Schneeman BO . Plasma cholecystokinin is associated with subjective measures of satiety in women. The American Journal of Clinical Nutrition. (2002) ;76: :959–67. |
[4] | Burton-Freeman B , Davis PA and Schneeman BO . Interaction of fat availability and sex on postprandial satiety and cholecystokinin after mixed-food meals. The American Journal of Clinical Nutrition. (2004) ;80: (5):1207–14. |
[5] | Burton-Freeman B . Sex and Cognitive Dietary Restraint Influence Cholecystokinin Release and Satiety in Response to Preloads Varying in Fatty Acid Composition and Content. The Journal of Nutrition. (2005) ;135: (6):1407–14. |
[6] | Schneeman BO , Burton-Freeman B , Davis P . Incorporating Dairy Foods into Low and High Fat Diets Increases the Postprandial Cholecystokinin Response in Men and Women. The Journal of Nutrition. (2003) ;133: :4124–28. |
[7] | Singh R , Nagapaul JP , Majumdar S , Chakravarti RN , Dhall GI . Effects of 17 beta-estradiol and progesterone on intestinal digestive and absorptive functions in ovariectomized rats. Biochem Int. (1985) ;10: (5):777–86. |
[8] | Ganji V , Kuo J . Serum lipid responses to psyllium fiber: differences between pre- and post-menopausal, hypercholesterolemic women. Nutr J. (2008) ;7: :22. |
[9] | Schneeman BO . Carbohydrates: Significance for Energy Balance and Gastrointestinal Function. The Journal of Nutrition. (1994) ;124: :1747S–1753S |
[10] | Burton-Freeman B . Dietary fiber and energy regulation. The Journal of Nutrition. (2000) ;130: (2):272–5. |
[11] | Howarth NC , Saltzman E , Roberts S . Dietary fiber and weight regulation. Nutrition Reviews (2001) ;59: :129–39. |
[12] | Pasquier B , Armand M , Castelain C , et al. Emulsification and lipolysis of triacylglycerols are altered by viscous soluble dietary fibres in acidic gastric medium in vitro. Biochem J. (1996) ;314: (Pt 1):269–75. |
[13] | Lia A , Anderson H , Mekki N , Juhel C , Senft M , Lairon D . Postprandial lipemia in relation to sterol and fat excretion in ileostomy subjects given oat-bran and wheat test meals. The American Journal of Clinical Nutrition. (1997) ;66: :357–65. |
[14] | Burton-Freeman BM . Glycomacropeptide (GMP) is not critical to whey-induced satiety, but may have a unique role in energy intake regulation through cholecystokinin (CCK). Physiology and Behavior. (2008) ;93: :379–87. |
[15] | Zung WW . A self-rating depression scale. Achieves of General Psychiatry. (1965) ;12: :63–70. |
[16] | Rehfeld JF . Accurate measurement of cholecystokinin in plasma. Clinical Chemistry. (1998) ;44: :991–1001. |
[17] | Khaliq R , Tita O , Antofie MM , Sava C . Industrial Applications of Psyllium: An Overview. Acta Universitatis Cibineinsis. (2015) ;67: (1). |
[18] | Dhingra D , Michael M , Rajput H , Patil RT . Dietary fibre in foods: a review. J Food Sci Technol. (2012) ;49: (3):255–66. |
[19] | U.S. Department of Health and Human Services and U.S.Department of Agriculture. 2015–2020 Dietary Guidelines for Americans. 8 th Edition. December 2015. Available at xhttp://health.gov/dietaryguidelines/2015/guidelines/. |
[20] | Sierra M , García JJ , Fernández N , Diez MJ , Calle AP . Therapeutic effects of psyllium in type 2 diabetic patients. Eur J Clin Nutr. (2002) ;56: (9):830–42. |
[21] | Ziai SA , Larijani B , Akhoondzadeh S , et al. Psyllium decreased serum glucose and glycosylated hemoglobin significantly in diabetic outpatients. J Ethnopharmacol. (2005) ;102: (2):202–7. |
[22] | Anderson JW , Allgood LD , Turner J , Oeltgen PR , Daggy BP . Effects of psyllium on glucose and serum lipid responses in men with type 2 diabetes and hypercholesterolemia. Am J Clin Nutr. (1999) ;70: (4):466–73. |
[23] | Gibb RD , Mcrorie JW , Russell DA , Hasselblad V , D’alessio DA . Psyllium fiber improves glycemic control proportional to loss of glycemic control: a meta-analysis of data in euglycemic subjects, patients at risk of type 2 diabetes mellitus, and patients being treated for type 2 diabetes mellitus. Am J Clin Nutr. (2015) ;102: (6):1604–14. |
[24] | Sierra vega M , Calle pardo AP , Fernández martínez N , et al. Effect of Ispaghula husks on postprandial glycemia in healthy female volunteers. Nutr Hos. (1999) ;14: (5):197–202. |
[25] | Frost GS , Brynes AE , Dhillo WS , Bloom SR , Mcburney MI . The effects of fiber enrichment of pasta and fat content on gastric emptying, GLP-1, glucose, and insulin responses to a meal. Eur J Clin Nutr. (2003) ;57: (2):293–8. |
[26] | Tosh SM . Review of human studies investigating the post-prandial blood-glucose lowering ability of oat and barley food products. Eur J Clin Nutr. (2013) ;67: (4):310–7. |
[27] | Rebello CJ , O’neil CE , Greenway FL . Dietary fiber and satiety: the effects of oats on satiety. Nutr Rev. (2016) ;74: (2):131–47. |
[28] | Rao TP . Role of guar fiber in appetite control. Physiol Behav. (2016) ;164: (Pt A):277–83. |
[29] | Clark MJ , Slavin JL . The effect of fiber on satiety and food intake: a systematic review. J Am Coll Nutr. (2013) ;32: (3):200–11. |
[30] | Wanders AJ , Van den borne JJ , De graaf C , et al. Effects of dietary fibre on subjective appetite, energy intake and body weight: a systematic review of randomized controlled trials. Obes Rev. (2011) ;12: (9):724–39. |
[31] | Almiron-roig E , Palla L , Guest K , et al. Factors that determine energy compensation: a systematic review of preload studies. Nutr Rev. (2013) ;71: (7):458–73. |
[32] | Karalus M , Clark M , Greaves KA , et al. Fermentable fibers do not affect satiety or food intake by women who do not practice restrained eating. J Acad Nutr Diet. (2012) ;112: (9):1356–62. |
[33] | Asarian L , Geary N . Sex differences in the physiology of eating. Am J Physiol Regul Integr Comp Physiol. (2013) ;305: (11):R1215–67. |
[34] | Rao TP . Role of guar fiber in appetite control. Physiol Behav. (2016) ;164: (Pt A):277–83. |
[35] | Lafond DW , Greaves KA , Maki KC , Leidy HJ , Romsos DR . Effects of two dietary fibers as part of ready-to-eat cereal (RTEC) breakfasts on perceived appetite and gut hormones in overweight women. Nutrients. (2015) ;7: (2):1245–66. |
[36] | Daud NM , Ismail NA , Thomas EL , et al. The impact of oligofructose on stimulation of gut hormones, appetite regulation and adiposity. Obesity (Silver Spring). (2014) ;22: (6):1430–8. |
[37] | Reimer RA , Pelletier X , Carabin IG , et al. Increased plasma PYY levels following supplementation with the functional fiber PolyGlycopleX in healthy adults. Eur J Clin Nutr. (2010) ;64: (10):1186–91. |
[38] | Vitaglione P , Lumaga RB , Stanzione A , Scalfi L , Fogliano V . beta-Glucan-enriched bread reduces energy intake and modifies plasma ghrelin and peptide YY concentrations in the short term. Appetite. (2009) ;53: (3):338–4. |
[39] | Brown LM , Clegg DJ . Central effects of estradiol in the regulation of food intake, body weight, and adiposity. J Steroid Biochem Mol Biol. (2010) ;122: (1-3):65–73. |
[40] | Butera PC . Estradiol and the control of food intake. Physiol Behav. (2010) ;99: (2):175–80. |


