
Dietary olive oil induces cannabinoid CB2 receptor expression in adipose tissue of ApcMin/+ transgenic mice
Abstract
BACKGROUND: Cannabinoid- 2 (CB2) receptor is known for its anti-obesity effects silencing the activated immune cells that are key drivers of metabolic syndrome and inflammation. Nutritional interventions in experimental models of carcinogenesis have been demonstrated to modulate tissue inflammation state and proliferation.
OBJECTIVE: Aim of this study was to test, in ApcMin/+ mice, whether a diet enriched with olive oil, omega- 3 and omega-6- PUFAs affects the adipose tissue inflammation status.
METHODS: Four groups of animal were studied: ST group, receiving a standard diet; OO group, receiving the standard diet in which soybean oil (source of fats) was replaced with olive oil; OM-3 group, receiving the standard diet in which soybean oil was replaced with salmon oil; OM-6 group, receiving the standard diet in which soybean oil was replaced with oenothera oil. Gene and protein expression, in adipose tissue, were evaluated by RT-PCR and Western Blotting, respectively. Enzymatic activities were assayed by fluorescent and radiometric method, where appropriated.
RESULTS: The diet enriched with olive oil significantly induced CB2 receptor expression and it was able to control inflammatory and proliferative activity of mice adipose tissue.
CONCLUSIONS: The present findings open opportunities for developing novel nutritional strategies considering olive oil a key ingredient of a healthy dietary pattern.
1Introduction
The endogenous cannabinoid system, including cannabinoid receptors (CB1 and CB2), is known to modulate appetite and food intake [1]. In contrast to the CB1 receptor that increases the rewarding effects of food and promotes the growth of adipocytes, the CB2 receptor is well known for its anti-obesity effects silencing the activated immune cells that are key drivers of the metabolic syndrome [2, 3]. The recent localization of the CB2 receptor also in brain regions mediating appetite [4, 5], and in peripheral metabolically active sites including the liver [6], adipose tissue [7], and etc., highlights the possible role of this receptor in energy homeostasis.
Recent studies demonstrate that CB2 receptor deficiency in mice causes obesity and overall hypertrophy of visceral fat [8]. Moreover, the deletion of CB2 receptors leads to obese phenotype characterized by increased food intake and body weight [3]. Obese phenotype mainly consists in an increase of neutral lipids stored in the adipose tissue that markedly increases its cells size (hypertrophy) and number (hyperplasia) [9]. In adipose tissue, fat laden adipocytes initiate inflammatory response by producing cytokines and chemokines that promote recruitment of proinflammatory macrophages with further amplification of local inflammatory [10]. An inflamed adipose tissue can contributes to the onset of metabolic diseases, as cancer [11].
Tumor growth and abnormal cell proliferation are shown to be associated with a number of cellular metabolic alterations affecting adipocytes [12]. It is worth mentioning that in tumor microenvironment, adipocytes, representing the major source of energy for cancer cells, can revert from mature, differentiated adipocytes to pre-adipocytes [13]. A chronic energy surplus induces acute deterioration of the adipose tissue’s endocrine function and significant alterations in the cellular distribution [14]. The substantial infiltration of inflammatory cells into adipose tissue not only modifies the local metabolism but also may have deleterious effects in many cells, including colonic cells [15]. Pronounced morphologic and molecular alterations of adipose tissue have been observed in tumor-bearing mice [16]. The tumor burden seems to alter adipose tissue mass and function by affecting the expression of genes that control lipogenesis and lipid utilization. For this purpose, here, we have studied the metabolic activity and inflammation status of adipose tissue of ApcMin/+ mice, an experimental model of colorectal carcinogenesis. ApcMin/+ mice have a mutation in the murine homologue of the APC3 gene that is also mutated in humans with a genetic predisposition to develop multiple intestinal adenomas, such as familial adenomatous polyposis syndrome; APC mutations also frequently occur early in many spontaneously arising colorectal cancers [17, 18]. For these reasons, the ApcMin/+ mice are considered one of the most suitable models for colorectal cancer studies [19], investigating the complex mutual relationships between colon cancer cells and their microenvironment.
In cancer cell metabolism, a pivotal role is played by lipogenic enzymes, as Lipoprotein Lipase (LPL) and Fatty acid synthase (FAS), and altered levels of their expression and activity are representative of events which sustain tumor growth [20, 21] Enzymatic activity changes have been also detected in peritumoral adipose tissue of colorectal cancer patients [12], demonstrating an influence of tumor microenvironment on lipid metabolism in adipose tissue.
In order to evaluate the effects of a dietary treatment with natural components, as olive oil, omega- 3 and omega-6-PUFAs, on adipose tissue inflammation and metabolism, we evaluated, in the mice programmed to develop intestinal tumors, adipose tissue expression of CB2 receptor and nitric oxide synthase (NOS), as well as LPL and FAS enzymatic activity.
2Materials and methods
2.1Chemicals and antibodies
Reagents were obtained from the following sources: TRI-Reagent from Mol. Res. Centre Inc. Cincinnati, O, USA; iQ SYBR Green Supermix from Bio-Rad, Milan, Italy; all chemical reagents for lysis buffer, sample and reaction mix from Sigma-Aldrich (St. Louis, MO); polyvinylidenefluoride (PVDF) filters from BioRad Laboratories, Milan, Italy; anti-CB2-R antibody from Abcam, Cambridge, UK; anti-NOS1 antibody from Santa Cruz Biotechnology, Santa Cruz, CA, USA; anti-GAPDH antibody from Cell Signaling Technology, Beverly, MA, USA; ECL from Thermo Scientific, Rockford, IL, USA; horseradish peroxidase conjugated secondary antibody from Bio-Rad Laboratories; LPL activity Kit from Roar Biomedical, New York, NY; 2-14C-malonyl-CoA from Amersham Biosciences, UK.
2.2Animals
Five-week-old C57BL/6J male mice with a heterozygote mutation for the Apc gene (ApcMin/+) were obtained from Charles River Laboratories Italia (Calco, LC, Italy). Mice were maintained under temperature-, air- and light-controlled conditions and received food and water ad libitum; they did not receive any surgical or hormonal manipulation. All animals received care in compliance with the “Guide for the Care and Use of Laboratory Animals”. The procedures relating to animal use were communicated to the Italian Ministry of Health and approved. ApcMin/+ male mice were randomly divided into 4 groups of 10 animal each and fed for 10 weeks as follows: control (ST) group, receiving a purified AIN-93M standard diet (12.5% protein, 12% soybean oil, 3% cellulose fiber); olive oil (OO) group, receiving a purified AIN-93M standard diet in which soybean oil was replaced with olive oil (12.5% protein, 12% olive oil, 3% cellulose fiber); omega-3 PUFA (OM-3) group, receiving a purified AIN-93M standard diet in which soybean oil was replaced with salmon oil, rich in omega-3 PUFAs (12.5% protein, 12% salmon oil, 3% cellulose fiber); omega-6 PUFA (OM-6) group, receiving a purified AIN-93M standard diet in which soybean oil was replaced with 12% of oenothera oil rich in n-6 PUFAs. Fatty acid composition depended on the source of oil used. Soybean oil contained 27.55% of monounsaturated acids (MUFAs), 13.25% of saturated fatty acids, 57.8% of PUFAs (5.8% omega-3 PUFAs and 52% omega-6 PUFAs); olive oil contained 72–75% MUFAs, 13–9/16/201616% saturated fatty acids and 6–11.5% PUFAs (23); salmon oil fatty acid profile was 15% MUFAs, 8% saturated fatty acids and 77% omega-3 PUFAs. Oenothera oil contained 12% of MUFAs, 9% saturated fatty acids and 79% omega-6 PUFAs (11.2% γ-linolenic acid and 67.8% linoleic acid) (informative schedule given by the producer).
Parallel experiments were conducted in a group of 10 wild-type syngenic male mice (WT group) fed the standard diet, described above.
All diets were isocaloric and supplied as pellets (Mucedola Srl, Settimo Milanese, Italy) and mice body weights were recorded weekly.
After 10 weeks of dietary treatment, animals were killed by cervical dislocation and samples of visceral adipose tissue was removed, collected and stored at –80°C until assayed.
2.3Gene expression analysis
Total RNA from samples of adipose tissue was isolated with TRI-Reagent following the manufacturer’s instruction. Briefly, the tissue was homogenized in 0.25 ml of cold 0.9% NaCl; then, 0.75 ml of TRI-Reagent and 0.2 ml of chloroform were added to the homogenate. The samples were vigorously shaken and centrifuged and the RNA present in the aqueous phase was precipitated with 0.5 ml of isopropanol. The RNA pellet was washed once with 1 ml of 75% ethanol, dried, resuspended in sterile water and quantified by UV absorbance. 2 mg of total RNA were used for the reverse transcription reaction performed in 20μl of final volume at 41°C for 60 min, using 30 pmol of antisense primer (Table 1) for analyses of the CB2-R, NOS1 and the β-actin gene. Human β-actin gene was utilized as reference gene. Real-time PCRs were performed in 25μl of final volume containing 2μl of cDNA, master mix with SYBR Green and sense and antisense primers for the CB2-R, NOS1 and β-actin gene (Table 1).
Real-time PCR was carried out in an iCycler Thermal Cycler System apparatus (Bio-Rad) using the following parameters: one cycle of 95°C for 1 min and 30 s, followed by 45 cycles at 94°C for 10 s, 55°C for 10 s and 72°C for 30 s and a further melting curve step at 55 – 95°C with a heating rate of 0.5°C per cycle for 80 cycles. The PCR products were quantified by external calibration curves, one for each tested gene, obtained with serial dilutions of known copy number of molecules (102–107 molecules). All expression data were normalized by dividing the target amount by the amount of β-actin used as internal control for each sample. The specificity of the PCR product was confirmed by gel electrophoresis.
2.4Western blotting analysis
Protein lysates were prepared by homogenizing adipose tissue in lysis buffer (150 mM sodium chloride, 50 mM Tris-HCl, pH 7.4, 1 mM ethylenediaminetetraacetic acid, 1 mM phenylmethylsulfonyl fluoride, 1% Triton X-100, 1% sodium deoxycholic acid, 0.1% sodium dodecylsulfate, 5μg/ml of aprotinin, 5μg/ml of leupeptin). Tissue and cell debris was removed by centrifugation. Protein concentrations were estimated by the Bio-Rad protein assay using BSA as standard. The lysates were boiled for 5 min in 1×SDS sample buffer (50 mM Tris-HCl pH 6.8, 12.5% glycerol, 1% SDS, 0.01% bromophenol blue) containing 5% Beta-mercaptoethanol.
Equal amount of protein (50 μg) were resolved on SDS–PAGE and transferred to polyvinylidenefluoride (PVDF) filters. After transfer, the membranes were blocked for 2 hours in 5% non-fat dry milk in Tris-buffered saline (TBS) and then incubated in primary antibodies overnight at 4°C.The primary antibodies were diluted 1 : 500 in blocking buffer and were directed against the following proteins: CB2-R, NOS1 and GAPDH. After overnight incubation, the membranes were further incubated with a horseradish peroxidase conjugated secondary antibody. The proteins were detected by chemiluminescence (ECL) and the densitometric analysis of each protein-related signal was obtained using the Molecular Imager Chemidoc TM (Bio-Rad Laboratories) and normalized against GAPDH expression.
2.5Lipoprotein lipase activity assay
LPL enzymatic activity was evaluated by a fluorescent method. Specimens of adipose tissue (approximately 50 mg) were homogenized in 20 mM Tris-HCl pH = 7.5, 1 mM DTT, 1 mM MgCl2, 1 mM EDTA, and centrifuged at 10000×g for 10 minutes at 4°C. Aliquots of supernatant (100μl) were incubated with 100μl of pre-diluited substrate emulsion at 37°C for 1 hour, according to the manufacturer’s recommendations. The hydrolyzed triglycerides formed were measured at 370 nm excitation and 450 nm emission. The fluorescence intensity values of samples were compared with the fluorescence intensity values of standard curve applied on the same plate together with samples in each run. LPL activity was expressed as picomoles of hydrolyzed substrate per minute per milligram of total proteins, evaluated using Lowry method, (pmol/min/mg prot).
2.6Fatty acid synthase activity assay
FAS activity was determined on samples of adipose tissue after tissue homogenization and centrifugation. Aliquots of supernatant (50μl) were pre-incubated with 100 mM potassium phosphate buffer, pH = 7 for 15 min at 37°C. Subsequently, 20μl of reaction mix (2.5 mM NADPH, 1.25 mM acetyl-CoA, 1.25 mM malonyl-CoA and 0.02 mM 2-14C-malonyl-CoA (52 mCi/mmol) were added and samples were incubated for 10 min at 37°C. Reactions were stopped by the addition of 500μl of 1 N HCl/methanol (6 : 4,v:v); fatty acids were extracted with 1 ml of petroleum ether and incorporation of 2-14C-malonyl-CoA was analyzed by scintillation counting. FAS activity was expressed as picomoles of incorporated 2-14C-malonyl-CoA per minute per milligram of total proteins (pmol/min/mgprot).
2.7Statistical analysis
The significance of the differences among experimental groups was evaluated with one-way analysis of variance (ANOVA) and Dunnett Post Test. Differences were considered significant at P < 0.05.
3Results
All diets tested in this study were able to affect adipose tissue inflammation and metabolism in ApcMin/+ mice.
In particular, compared to transgenic mice fed standard diet (ST group), the levels of CB2 receptor gene expression were significantly higher in all treatment groups (P < 0.005, ANOVA and Dunnett test, Fig. 1, panel A). The induction was more evident in OO mice group, where olive oil administration restored the CB2 receptor mRNA levels to those detected in wild type mice. The CB2 receptor protein expression levels (Fig. 1, panel B) were significantly increased in all treatment groups respect to ST group, except for wild type mice, where the protein levels were slightly increased. This different behavior of CB2 receptor protein respect to CB2 receptor mRNA levels in WT group can be due to a different rate of turnover and degradation of mRNA compared to protein.
The levels of NOS1 gene expression and protein (Fig. 2, panel A and B, respectively) were significantly increased in all treated group mice when compared to ApcMin/+ mice fed standard diet. The highest levels of NOS1 gene expression and protein were detectable in OO and OM-3 groups mice (P < 0.005, ANOVA and Dunnett test); this effects, probably, was due to omega-3-PUFA content of both administered diets.
Moreover, dietary olive oil, omega-3- and omega-6-PUFAs treatment caused, in mice adipose tissue, a reduction of LPL activity; this effect was more evident in OM-3 mice group even if not statistically significant (Fig. 3, panel A, ANOVA and Dunnett test).
Differently, FAS activity was significantly reduced by olive oil and omega-3-PUFAs treatment and no effect on FAS activity was observed in OM-6 group (Fig. 3, panel B).
4Discussion
The present study points out that a nutritional intervention in ApcMin/+ mice, based on the intake of olive oil, omega-3- and omega-6-PUFAs, showed an anti-inflammatory effect in adipose tissue, acting directly on CB2 receptor and NOS1 expression modulation. In particular, the diet enriched with olive oil induced CB2 receptor expression and exerted an up-regulation of NOS1 enzyme. Distinct NOS isoforms have been described and they represent the products of three distinct genes [22]: two constitutive and Ca2 + dependent forms of NOS, including NOS1(also designated nNOS) and NOS3 (also designated eNOS); the inducible form of NOS, NOS2 (also designated iNOS) is a Ca2 + independent enzyme. Over-expression of constitutive forms of NOS in adipose tissue has been demonstrated to prevent diet-induced obesity, whereas an increase of the inducible NOS seems to enhance both adipocyte size and inflammation [23]. Recent studies have demonstrated that NOS seems to regulate inflammatory genes expression in adipose tissue [24, 25] and the inhibition of its activity has been demonstrated to promote adipose tissue inflammation[26, 27].
NOS1 has been demonstrated to modulate CB2 receptor gene transcription; increased transcription of CB2 receptor takes place in the peripheral and central nervous system of mice with neuropathic pain [28]. In other pain models, such as acute and inflammatory models, a clear relationship between the CB2 receptor and nitric oxide-pathway activation has been extensively demonstrated [29].
Moreover, in according to our previous results [30, 31], olive oil, as well as omega-3 PUFAs, exerted anti-proliferative effects in mice adipose tissue, by reducing LPL and FAS activity. LPL activity has been shown to be increased in areas containing actively proliferating cells in a variety of human sarcomas and carcinomas [32]. LPL, as well as FAS are involved in tissue proliferation rate [15, 16, 32]. Our previous study demonstrated that the lipogenic enzymes activity levels were significantly higher in cancer than in the corresponding normal colorectal mucosa [12]. FAS has been demonstrated to be a functionally active enzyme in cancer and the fatty acid synthesis pathway is up-regulated in colorectal carcinoma [33, 34]. Previously, our in vitro study showed that phenolic compounds of olive oil may exert antiobesity and antineoplastic effects, modulating LPL and FAS gene expression [31].
Our present findings, detected in mice model that spontaneously develop intestinal polyps, much more underline the link between adipose tissue and intestinal tumor development, supporting all evidences demonstrating a metabolic symbiosis between colon cancer growth and adipose tissue.
It is clear that the beneficial effects of dietary treatment might depend on the source and nature of fatty acids present in diet [35]. In our experiments, olive oil exerted the greatest effect on CB2 receptor and NOS1 protein expression; this effect was probably due to its high content of MUFAs. Recently, oleic acid, a monounsaturated fatty acid, the main lipid component of virgin olive oil, has been demonstrated to improve endothelial dysfunction in response to pro-inflammatory signals and to reduce proliferation and apoptosis in vitro. In addition, oleic acid, being the precursor for oleol ethanolamide, affects endocannabinoid production, increasing their degradation and decreasing food intake and adipose tissue mass [37]. An inverse correlation between adipose tissue MUFA content and degree of obesity/inflammation has been also demonstrated [38].
Even if further studies will be need to investigate the role of CB2 receptor and NOS1 in cell proliferation and inflammation of adipose tissue, the present findings open opportunities for developing novel nutritional strategies considering olive oil a key ingredient of a healthy dietary pattern.
Competing interests
The authors declare that they have no competing interests.
Acknowledgments
The authors acknowledge project L.A.I.F.F. - RETE DI LABORATORI PER L’INNOVAZIONE NEL CAMPO DEGLI ALIMENTI FUNZIONALI (codice n. 47); “PO Puglia FESR 2007-2013, Asse I, Linea 1.2. Accordo di Programma Quadro in materia di Ricerca Scientifica. Intervento “Reti di Laboratori Pubblici di Ricerca”.
References
[1] | Schmitz K , Mangels N , Haussler A , Ferreiros N , Fleming I , Tegeder I . Pro-inflammatory obesity in aged cannabinoid-2 receptor- deficient mice. Int J Obesity. (2015) ;1–14. |
[2] | Verty ANA , Stefanidis A , McAinch AJ , Hryciw DH , Oldfield B . Anti-obesity effect of the CB2 receptor agonist JWH-015 in diet-induced obese mice. Plos One. (2015) ;10: (11):e0140592. |
[3] | Agudo J , Martin M , Roca C , Molas M , Bura AS , Zimmer A , Bosch F , Maldonado R . Deficiency of CB2 cannabinoid receptor in mice improve insulin sensitivity but increases food intake and obesity with age. Diabetologia. (2010) ;53: :2629–40. |
[4] | Gong JP , Onaivi ES , Ishiguro H , Liu QR , Tagliaferro PA , Brusco A , Uhl GR . Cannabinoid CB2 receptors: Immunohistochemical localization in rat brain. Brain Res. (1071) ;10–23. |
[5] | Van Sickle MD , Duncan M , Kingsley PJ , Mouihate A , Urbani P , Mackie K , Stella N , Makriyannis A , Piomelli D , Davison JS , Marnett LJ , Di Marzo V , Pittman QJ , Patel KD , Sharkey KA . Identification and functional characterization of brainstem cannabinoid CB2 receptors. Sciences. (2005) ;310: :329–32. |
[6] | Mallat A , Lotersztajn S . Endocannabinoids as novel mediators of liver diseases. J Endocrinol Invest. (2006) ;29: :58–65. |
[7] | Starowicz KM , Cristino L , Matiass I , Capasso R , Racioppi A , Izzo AA , Di Marzo V . Endocannabinoid dysregulation in the pancreas and adipose tissue of mice fed with a high-fat diet. Obesity. (2008) ;16: :553–65. |
[8] | Garg SK , Delaney C , Shi H , Yung R . Changes in adipose tissue macrophages and T cells during aging. Crit Rev Immunol. (2014) ;34: :1–14. |
[9] | Bays H . Central obesity as a clinical marker of adiposopathy; increased visceral adiposity as a surrogate marker for global fat dysfunction. Curr Opin Endocrinol Diabetes Obes. (2014) ;21: :345–51. |
[10] | Riondino S , Roselli M , Palmirotta R , Della-Morte D , Ferroni P , Guadagni F . Obesity and colorectal cancer: Role of adipokines in tumor initiation and progression. World J Gastroenterol. (2014) ;20: :5177–90. |
[11] | Fontana L , Eagon JC , Trujllo ME , Scherer PE , Klein S . Visceral fat adipokine secretion is associated with systemic inflammation in obese humans. Diabetes. (2007) ;56: :1010–3. |
[12] | Notarnicola M , Miccolis A , Tutino V , Lorusso D , Caruso MG . Low levels of lipogenic enzymes in peritumoral adipose tissue of colorectal cancer patients. Lipids. (2012) ;47: :59–63. |
[13] | Guo W , Wong S , Xie W , Lei T , Luo Z . Palmitate modulates intracellular signaling, induces endoplasmic reticulum stress, and causes apoptosis in mouse 3T3-L1 and rat primary preadipocytes. Am J Physiol Endocrinol Metab.E. (2007) ;293: :576–86. |
[14] | Schwartz B , Yehuda-Shnaidman E . Putative role of adipose tissue in growth and metabolism of colon cancer cells. Front Oncol. (2014) ;4: :164–. |
[15] | Weisberg SP , McCann D , Desai M , Rosenbaum M , Leibel RL , Ferrante AW Jr . Obesity is associated with macrophage accumulation in adipose tissue. J Clin Invest. (2003) ;112: :1796–808. |
[16] | Kuhajda FP . Fatty-acid synthase and human cancer: New perspectives on its role in tumor biology. Nutrition. (2000) ;16: :202–8. |
[17] | Mai V , Colbert LH , Berrigan D , Perkins SN , Pfeiffer R , Lavigne JA , Lanza E , Haines DC , Schatzkin A , Hursting SD . Calories restriction and diet composition modulate spontaneous intestinal tumorigenesis in ApcMin/+ mice through different mechanisms. Cancer Res. (2003) ;63: :1752–5. |
[18] | Fearon ER , Vogelstein B . A genetic model for colorectal tumorigenesis. Cell. (1990) ;61: :759–67. |
[19] | Barone M , Tanzi S , Lofano K , Scavo MP , Pricci M , Demarinis L , Papagni S , Guido R , Maiorano E , Ingravallo G , Comelli MC , Francavilla A , Di Leo A . Dietary-induced ERbeta upregulation counteracts intestinal neoplasia development in intact male ApcMin/+ mice. Carcinogenesis. (2010) ;31: :269–74. |
[20] | Panarotto D , Poisson J , Devroede G , Maheux P . Lipoprotein lipase steady-state mRNA levels are lower in human omental versus subcutaneous abdominal adipose tissue. Metabolism. (2000) ;49: :1224–7. |
[21] | Kuhajda FP . Fatty acid synthase and cancer: New application of an old pathway. Cancer Res. (2006) ;66: :5977–80. |
[22] | Elizalde M , Ryden M , van Harmelen V , Eneroth P , Gyllenhammar H , Holm C , Ramel S , Olund A , Arner P , Andersson K . Expression of nitric oxide synthase in subcutaneous adipose tissue of nonobese and obese humans. J Lipid Res. (2000) ;41: :1244–51. |
[23] | Aquilano K , Lettieri Barbato D , Ciriolo MR . The multifaceted role of nitric oxide synthase in mitochondrial biogenesis and cell differentiation. Communicative & Integrative Biology. (2014) ;8: :2, e1017158. |
[24] | Padilla J , Jenkins NT , Thorne PK , Lansford KA , Fleming NJ , Bayless DS , Sheldon RD , Rector RS , Laughlin MH . Differential regulation of adipose tissue and vascular inflammatory gene expression by chronic systemic inhibition of NOS in lean and obese rats. Physiol Rep. (2014) ;2: :e00225. |
[25] | Williams I , Wheatcrofft S , Shah A , Kearney M . Obesity, atherosclerosis and vascular endothelium: Mechanisms of reduced nitric oxide bioavailablity in obese humans. Int J Obes Relat Metab Disord. (2002) ;26: :754–64. |
[26] | Siervo M , Jackson S , Bluck L . In vivo nitric oxide synthesis is reduced in obese patients with metabolic syndrome: Application of a novel stable isotopic method. J Hypertens. (2011) ;29: :1515–27. |
[27] | Handa P , Tateya S , Rizzo N , Cheng A , Morgan-Stevenson V , Han C , et al. Reduced vascular nitric oxide-cGMP signaling contributes to adipose tissue inflammation during high-fat feeding. Arterioscler Thromb Vasc Biol. (2011) ;31: :2827–35. |
[28] | Hervera A , Negrete R , Leánez S , Martín-Campos J , Pol O . The role of nitric oxide in the local antiallodynic and antihyperalgesic effects and expression of delta-opioid and cannabinoid-2 receptors during neuropathic pain in mice. J Pharmacol Exp Ther. (2010) ;334: (3):887–96. |
[29] | Li X , Clark JD . Spinal cord nitric oxide synthase and heme oxygenase limit morphine induced analgesia. Brain Res Mol Brain Res. (2001) ;95: :96–102. |
[30] | Barone M , Notarnicola M , Caruso MG , Scavo MP , Viggiani MT , Tutino V , Polimeno L , Pesetti B , Di Leo A , Francavilla A . Olive oil and omega-3 polyunsaturated fatty acids suppress intestinal polyp growth by modulating the apoptotic process in ApcMin/+ mice. Carcinogenesis. (2014) ;35: :1613–9. |
[31] | Tutino V , Orlando A , Russo F , Notarnicola M . Hydroxytyrosol inhibts cannabinoid CB1 receptor gene expression in 3T3-L1 preadipocyte cell line. J Cell Physiol. (2016) ;213: :483–9. |
[32] | Sakayama K , Masuno H , Miyazaki T , Okumura H , Shibata T , Okuda H . Existence of lipoprotein lipase in human sarcomas and carcinomas. Jpn J Cancer Res. (1994) ;85: :515–21. |
[33] | Trost Z , Sok M , Marc J , Cerne D . Increased lipoprotein lipase activity in non-small cell lung cancer tissue predicts shorter patient survival. Arch Med Res. (2009) ;40: :364–8. |
[34] | Notarnicola M , Altomare DF , Calvani M , Orlando A , Bifulco M , D’Attoma B , Caruso MG . Fatty acid synthase hyperactivation in human colorectal cancer: Relationship with tumor side and sex. Oncology. (2006) ;71: :327–32. |
[35] | Madsen L , Petersen RK , Kristiansen K . Regulation of adipocyte differentiation and function by polyunsaturated fatty acids. Biochem Biophys Acta. (1740) ;266–86. |
[36] | Perdomo L , Beneit N , Otero YF , Escribano O , Casrtoverde SD , Gomez-Hernandez A , Benito M . Protective role of oleic acid against cardiovascular insulin resistance and in the early and late cellular atherosclerotic process. Cardiovascular Diabetology. (2015) ;14: :75–. |
[37] | Naughton SS , Mathai ML , Hryciw DH , McAinch AJ . Fatty acid modulation of the endocannabinoid system and the effect on food intake and metabolism. Int J Endocrinol. (2013) ;2013: :Article ID 361895, 11 pages. |
[38] | Reddy KVK , Naidu KA . Oleic acid, hydroxytyrosol and n-3 fatty acids collectively modulate colitis through reduction of oxidative stress and IL-8 synthesis; in vitro and in vivo studies. International Immunopharmacology. (2016) ;35: :29–42. |
Figures and Tables
Fig.1
Panel A: CB2 receptor mRNA levels in adipose tissue from ApcMin/+ mice treated groups (ST = standard diet; OO = olive oil; OM-3 = omega-3 PUFAs; OM-6 = omega-6 PUFAs supplemented diet) and in the Wilde Type (WT) mice group. Data are presented as the mean±SE of ten animals for each group and expressed as n° molecules mRNA CB2 receptor gene/n° molecules mRNA β-actin. Panel B: Western blotting analysis of CB2 receptor protein in the same groups of treatment. Levels of CB2 receptor protein expression were normalized with Glyceraldeide 3-phosphate dehydrogenase (GAPDH) protein expression. ***P < 0.005 (one-way analysis of variance and Dunnett Post Test).
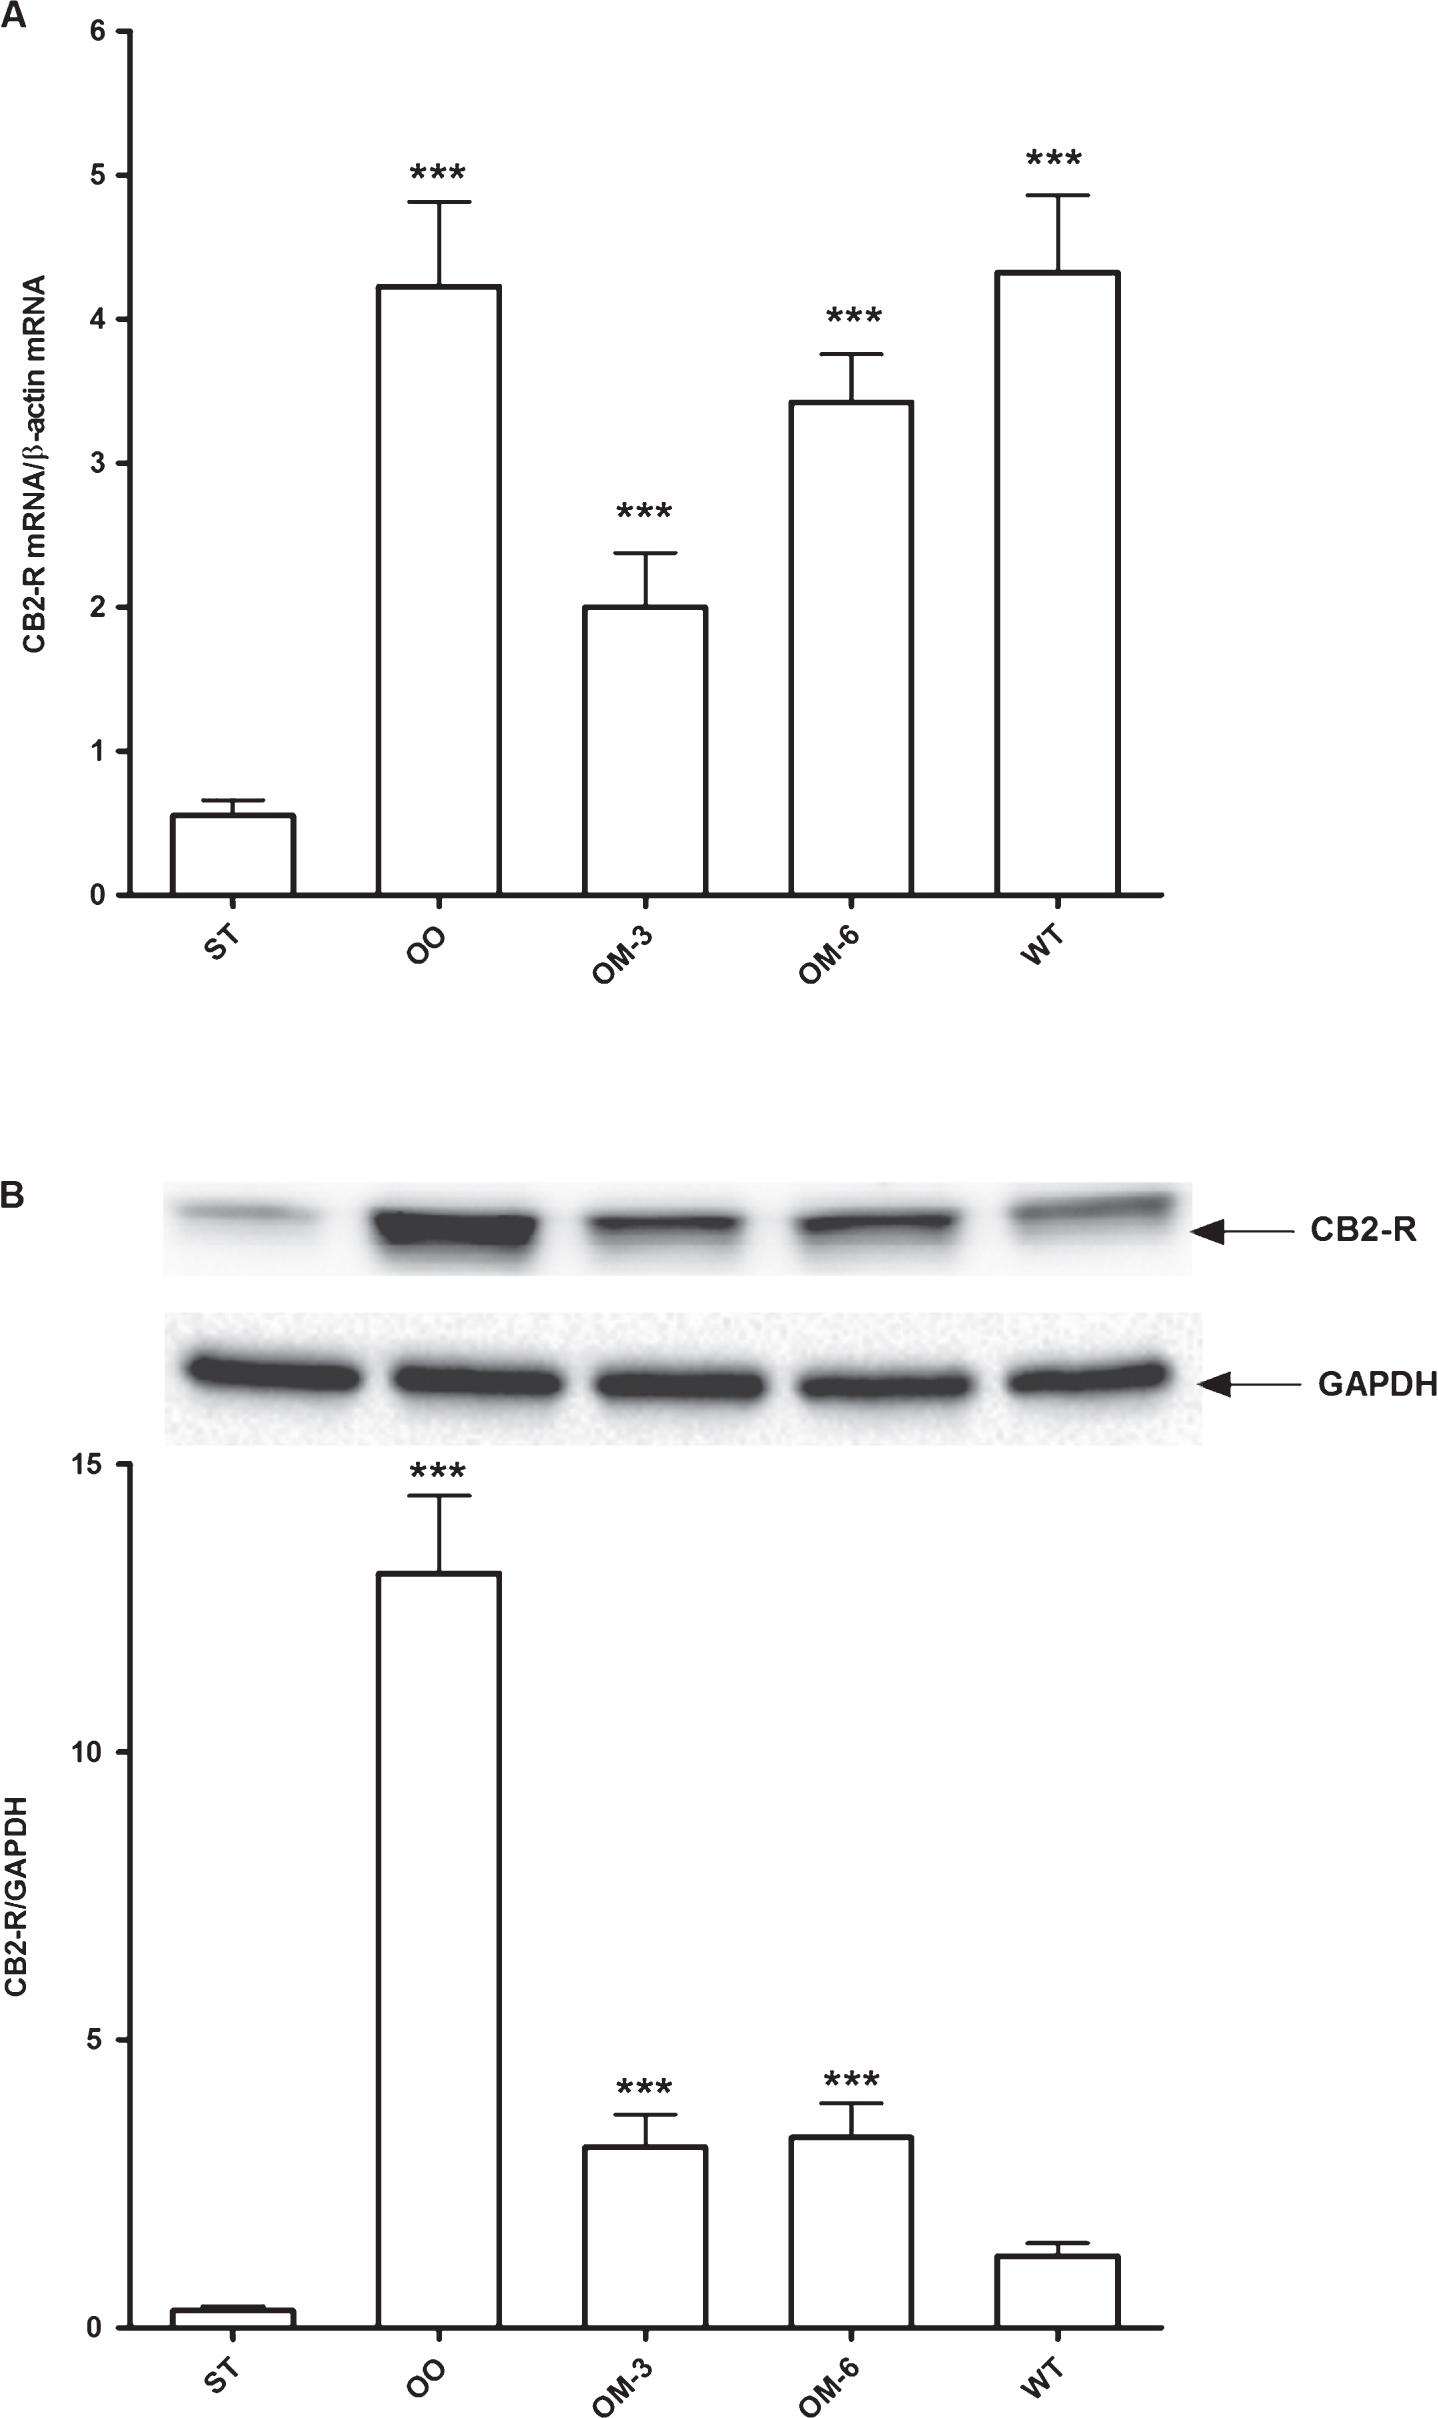
Fig.2
Panel A: NOS1 mRNA levels in adipose tissue from ApcMin/+ mice treated groups (ST = standard diet; OO = olive oil; OM-3 = omega-3 PUFAs; OM-6 = omega-6 PUFAs supplemented diet) and in the Wilde Type (WT) mice group. Data are presented as the mean±SE of ten animals for each group and expressed as n° molecules mRNA NOS1 gene/n° molecules mRNA β-actin. Panel B: Western blotting analysis of NOS1protein in the same groups of treatment. Levels of NOS1 protein expression were normalized with Glyceraldeide 3-phosphate dehydrogenase (GAPDH) protein expression. *P < 0.05, ***P < 0.005 (one-way analysis of variance and Dunnett Post Test).
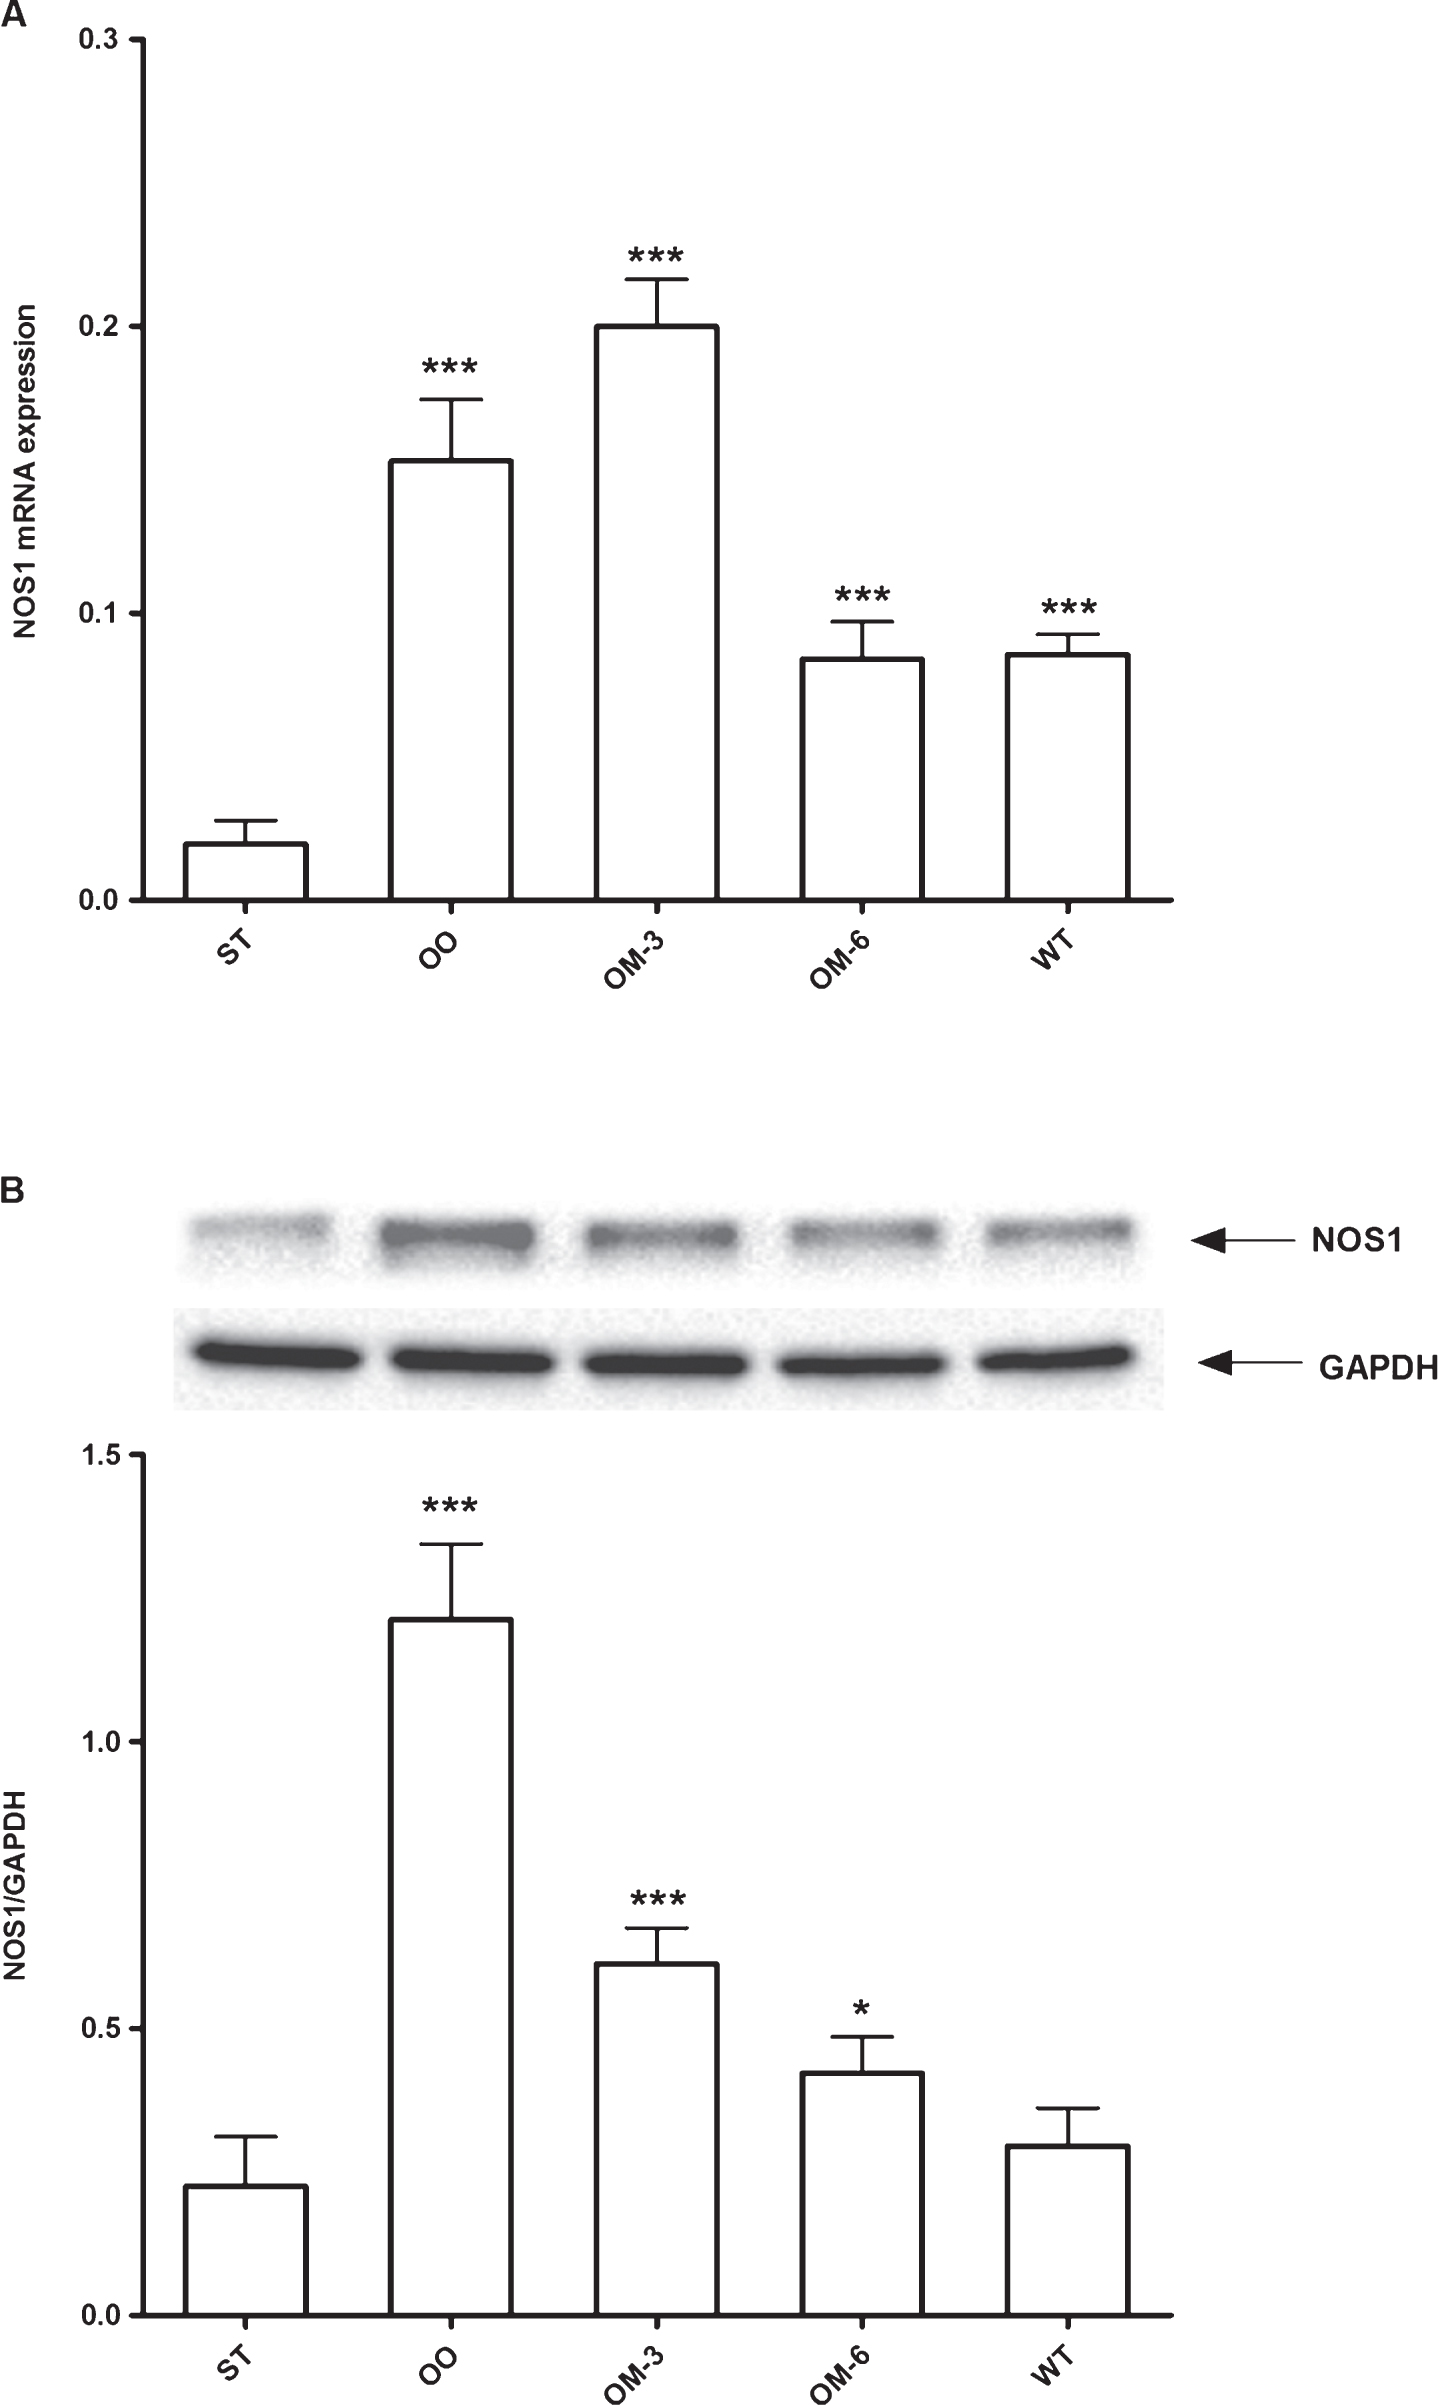
Fig.3
LPL (panel A) and FAS (panel B) enzymatic activity in adipose tissue from ApcMin/+ mice treated groups (ST = standard diet; OO = olive oil; OM-3 = omega-3 PUFAs; OM-6 = omega-6 PUFAs supplemented diet) and in the Wilde Type (WT) mice group. Data are presented as the mean±SE of ten animals for each group and expressed as pmol/min/mg total protein. **P < 0.03, ***P < 0.005 (one-way analysis of variance and Dunnett Post Test).
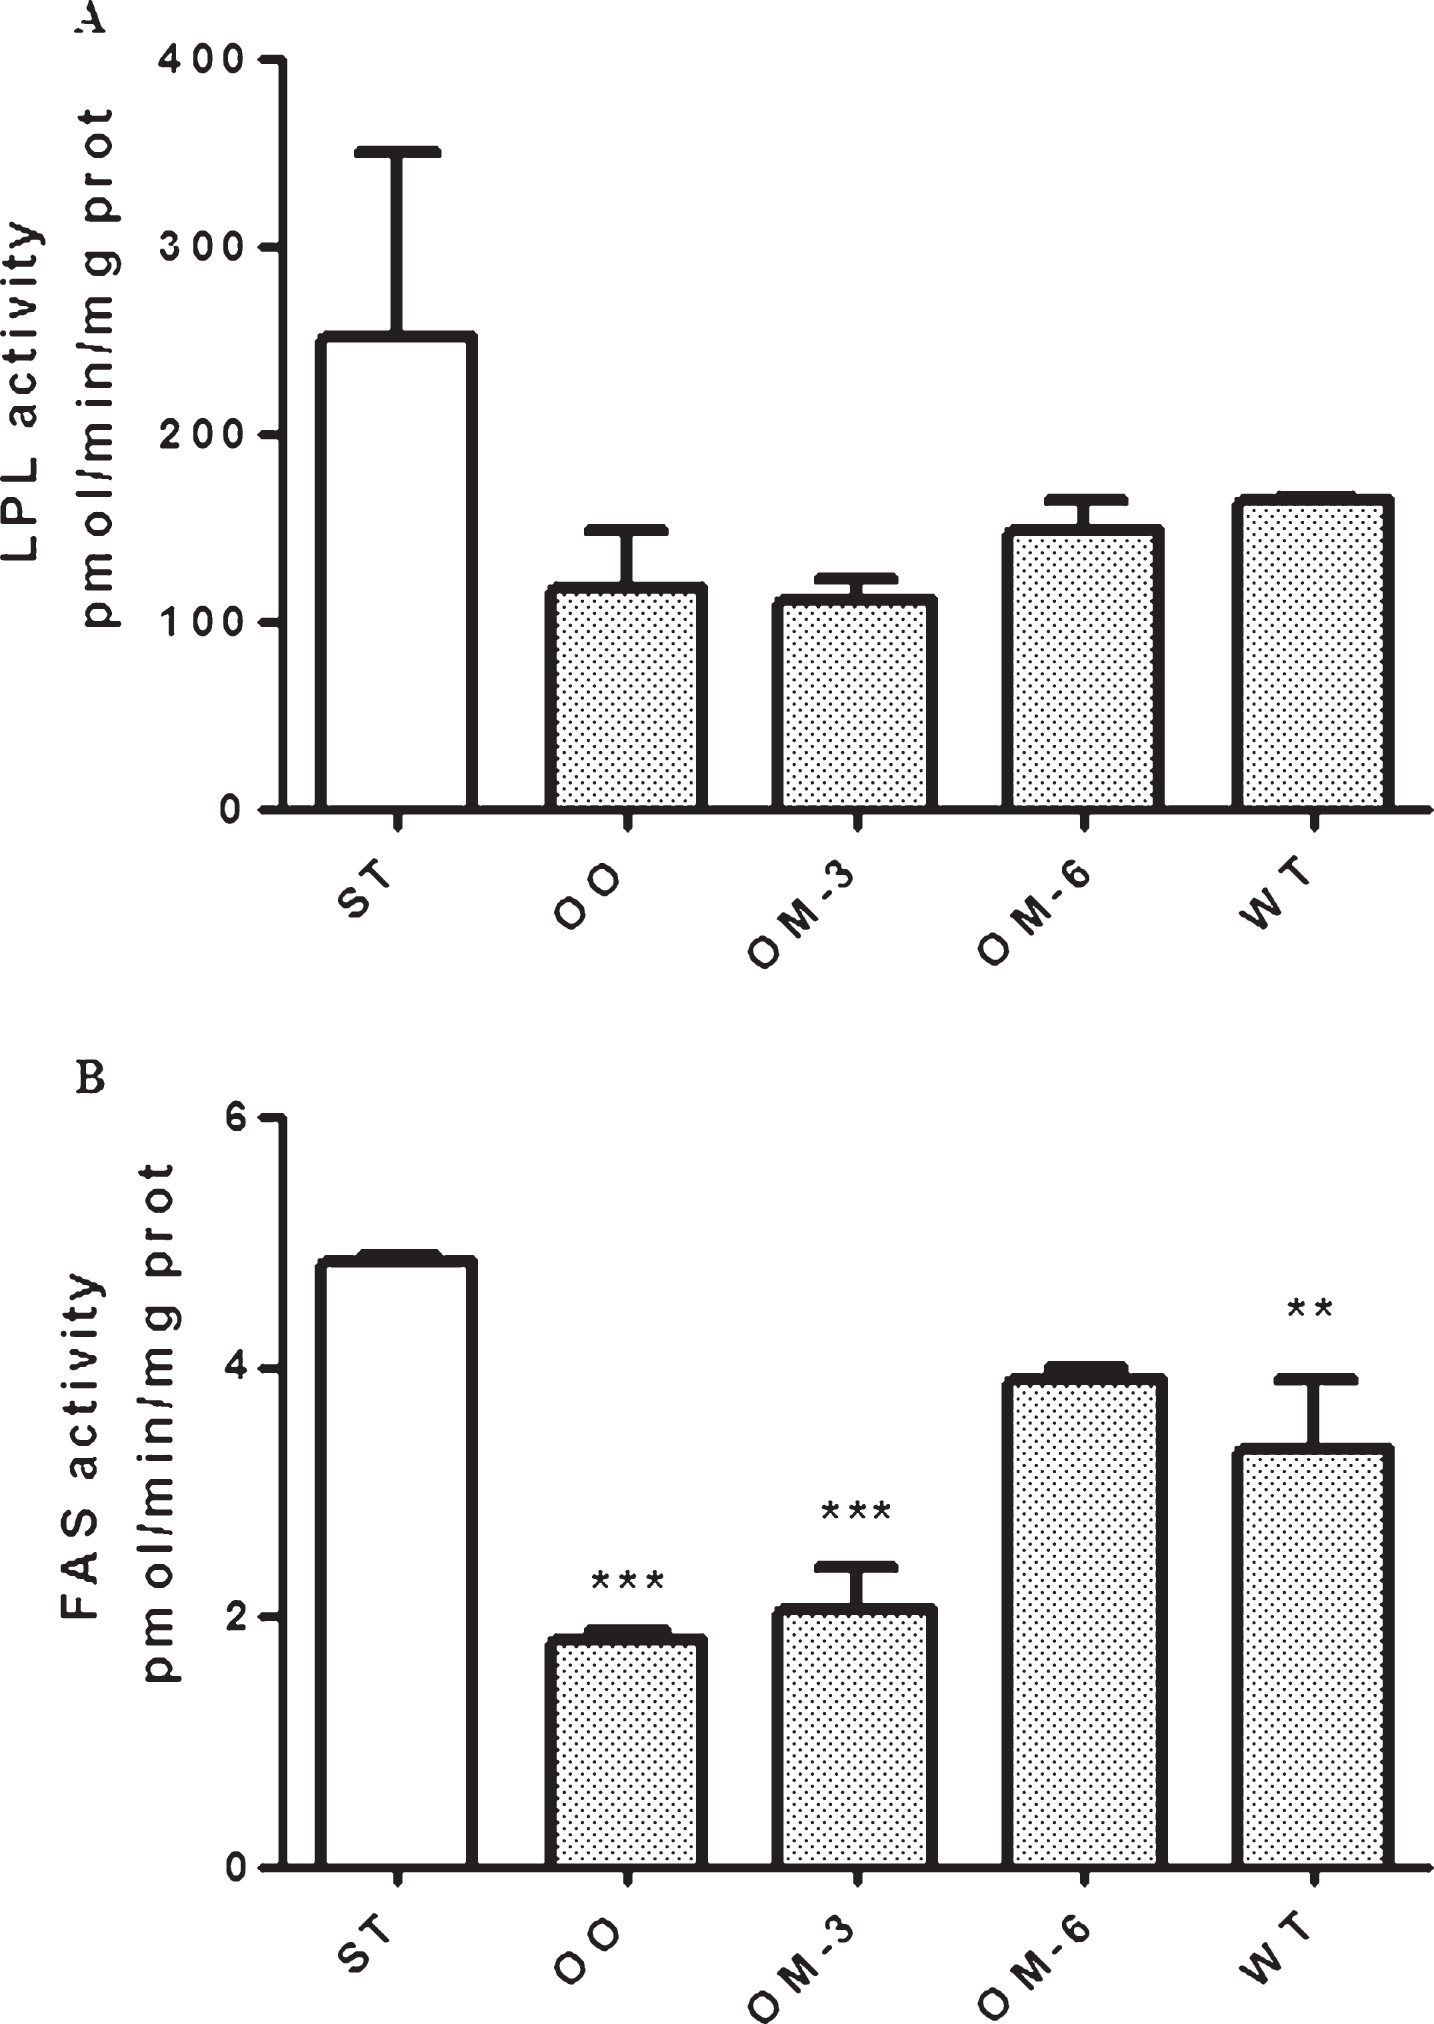
Table 1
Sequences of amplification primers
| Gene | Primer | |
| CB2 receptor | ||
| Sense | 5′-GGATGCCGGGAGACAGAAGTGA-3′ | |
| NOS1 | Antisense | 5′-CCCATGAGCGGCAGGTAAGAAAT-3′ |
| β-actin | Sense | 5′-GCAGAATGTGACCATCATGG-3′ |
| Antisense | 5′-ACAACCTTGGTGTTGAAGGC-3′ | |
| Sense | 5′-GCCTCTGGTCGTACCACTGGC-3′ | |
| Antisense | 5′-AGGGAGGAAGAGGATGCGGCA-3′ | |


