
Inconsistencies in countries COVID-19 data revealed by Benford’s law
Abstract
Reporting of daily new cases and deaths on COVID-19 is one of the main tools to understand and menage the pandemic. However, governments and health authorities worldwide present divergent procedures while registering and reporting their data. Most of the bias in those procedures are influenced by economic and political pressures and may lead to intentional or unintentional data corruption, what can mask crucial information. Benford’s law is a statistical phenomenon, extensively used to detect data corruption in large data sets. Here, we used the Benford’s law to screen and detect inconsistencies in data on daily new cases of COVID-19 reported by 80 countries. Data from 26 countries display severe nonconformity to the Benford’s law (
1.Introduction
COVID-19 outbreak was declared as a Public Health Emergency of International Concern by World Health Organization (WHO) in January, 30
Benford’s Law (also called “first digit phenomenon”) is a statistical phenomenon that describes the frequency of a given integer, from 1 to 9, to be in the first significant digit in the numbers of a large data set. This phenomenon was discovered by Simon Newcomb in 1881 (Newcomb, 1881) and rediscovered and detailed by Frank Benford in 1938 (Benford, 1938). The law states that the expected proportion of numbers in a data set that have a leading digit “
(1)
The Benford’s law has been most practically used to detect fraud or rounding errors in real world numbers. This is possible by examining departures in the frequencies of individual digits from those predicted by Benford. This only makes sense once it is established (often empirically) that the data follow the law under normal circumstances (Sambridge et al., 2011). This is true because human pseudo-random productions are in many ways different from true randomness (Nickerson, 2002). As a consequence, fabricated data might fit to the Benford’s Law to a lesser extent than genuine data (Banks & Hill, 1974; Gauvrit et al., 2017).
Many real-world data sets were shown to conform to this distribution, including the distance between earth and known stars (Alexopoulos & Leontsinis, 2014) or exoplanets (Aron, 2013), crime statistics (Hickman & Rice, 2010), the number of daily-recorded religious activities (Mir, 2014), earthquake depths (Sambridge et al., 2011), interventional radiology dose-area product data (Cournane et al., 2014), financial variables (Clippe & Ausloos, 2012), and internet traffic data (Arshadi & Jahangir, 2014). As pseudo-random numbers generated by humans often fail to conform to Benford’s law, it has been extensively used to detect fabricated data (Gauvrit et al., 2017), including frauds in international trade (Cerioli et al., 2019; Lacasa, 2019), money laundering (Badal-Valero et al., 2018), falsified science articles (Hüllemann et al., 2017), irregularity in payment for medical services (Park et al., 2016), etc.
Figure 1.
First digit density distribution of daily new cases data from countries that indubitably conform to the Benford’s law (
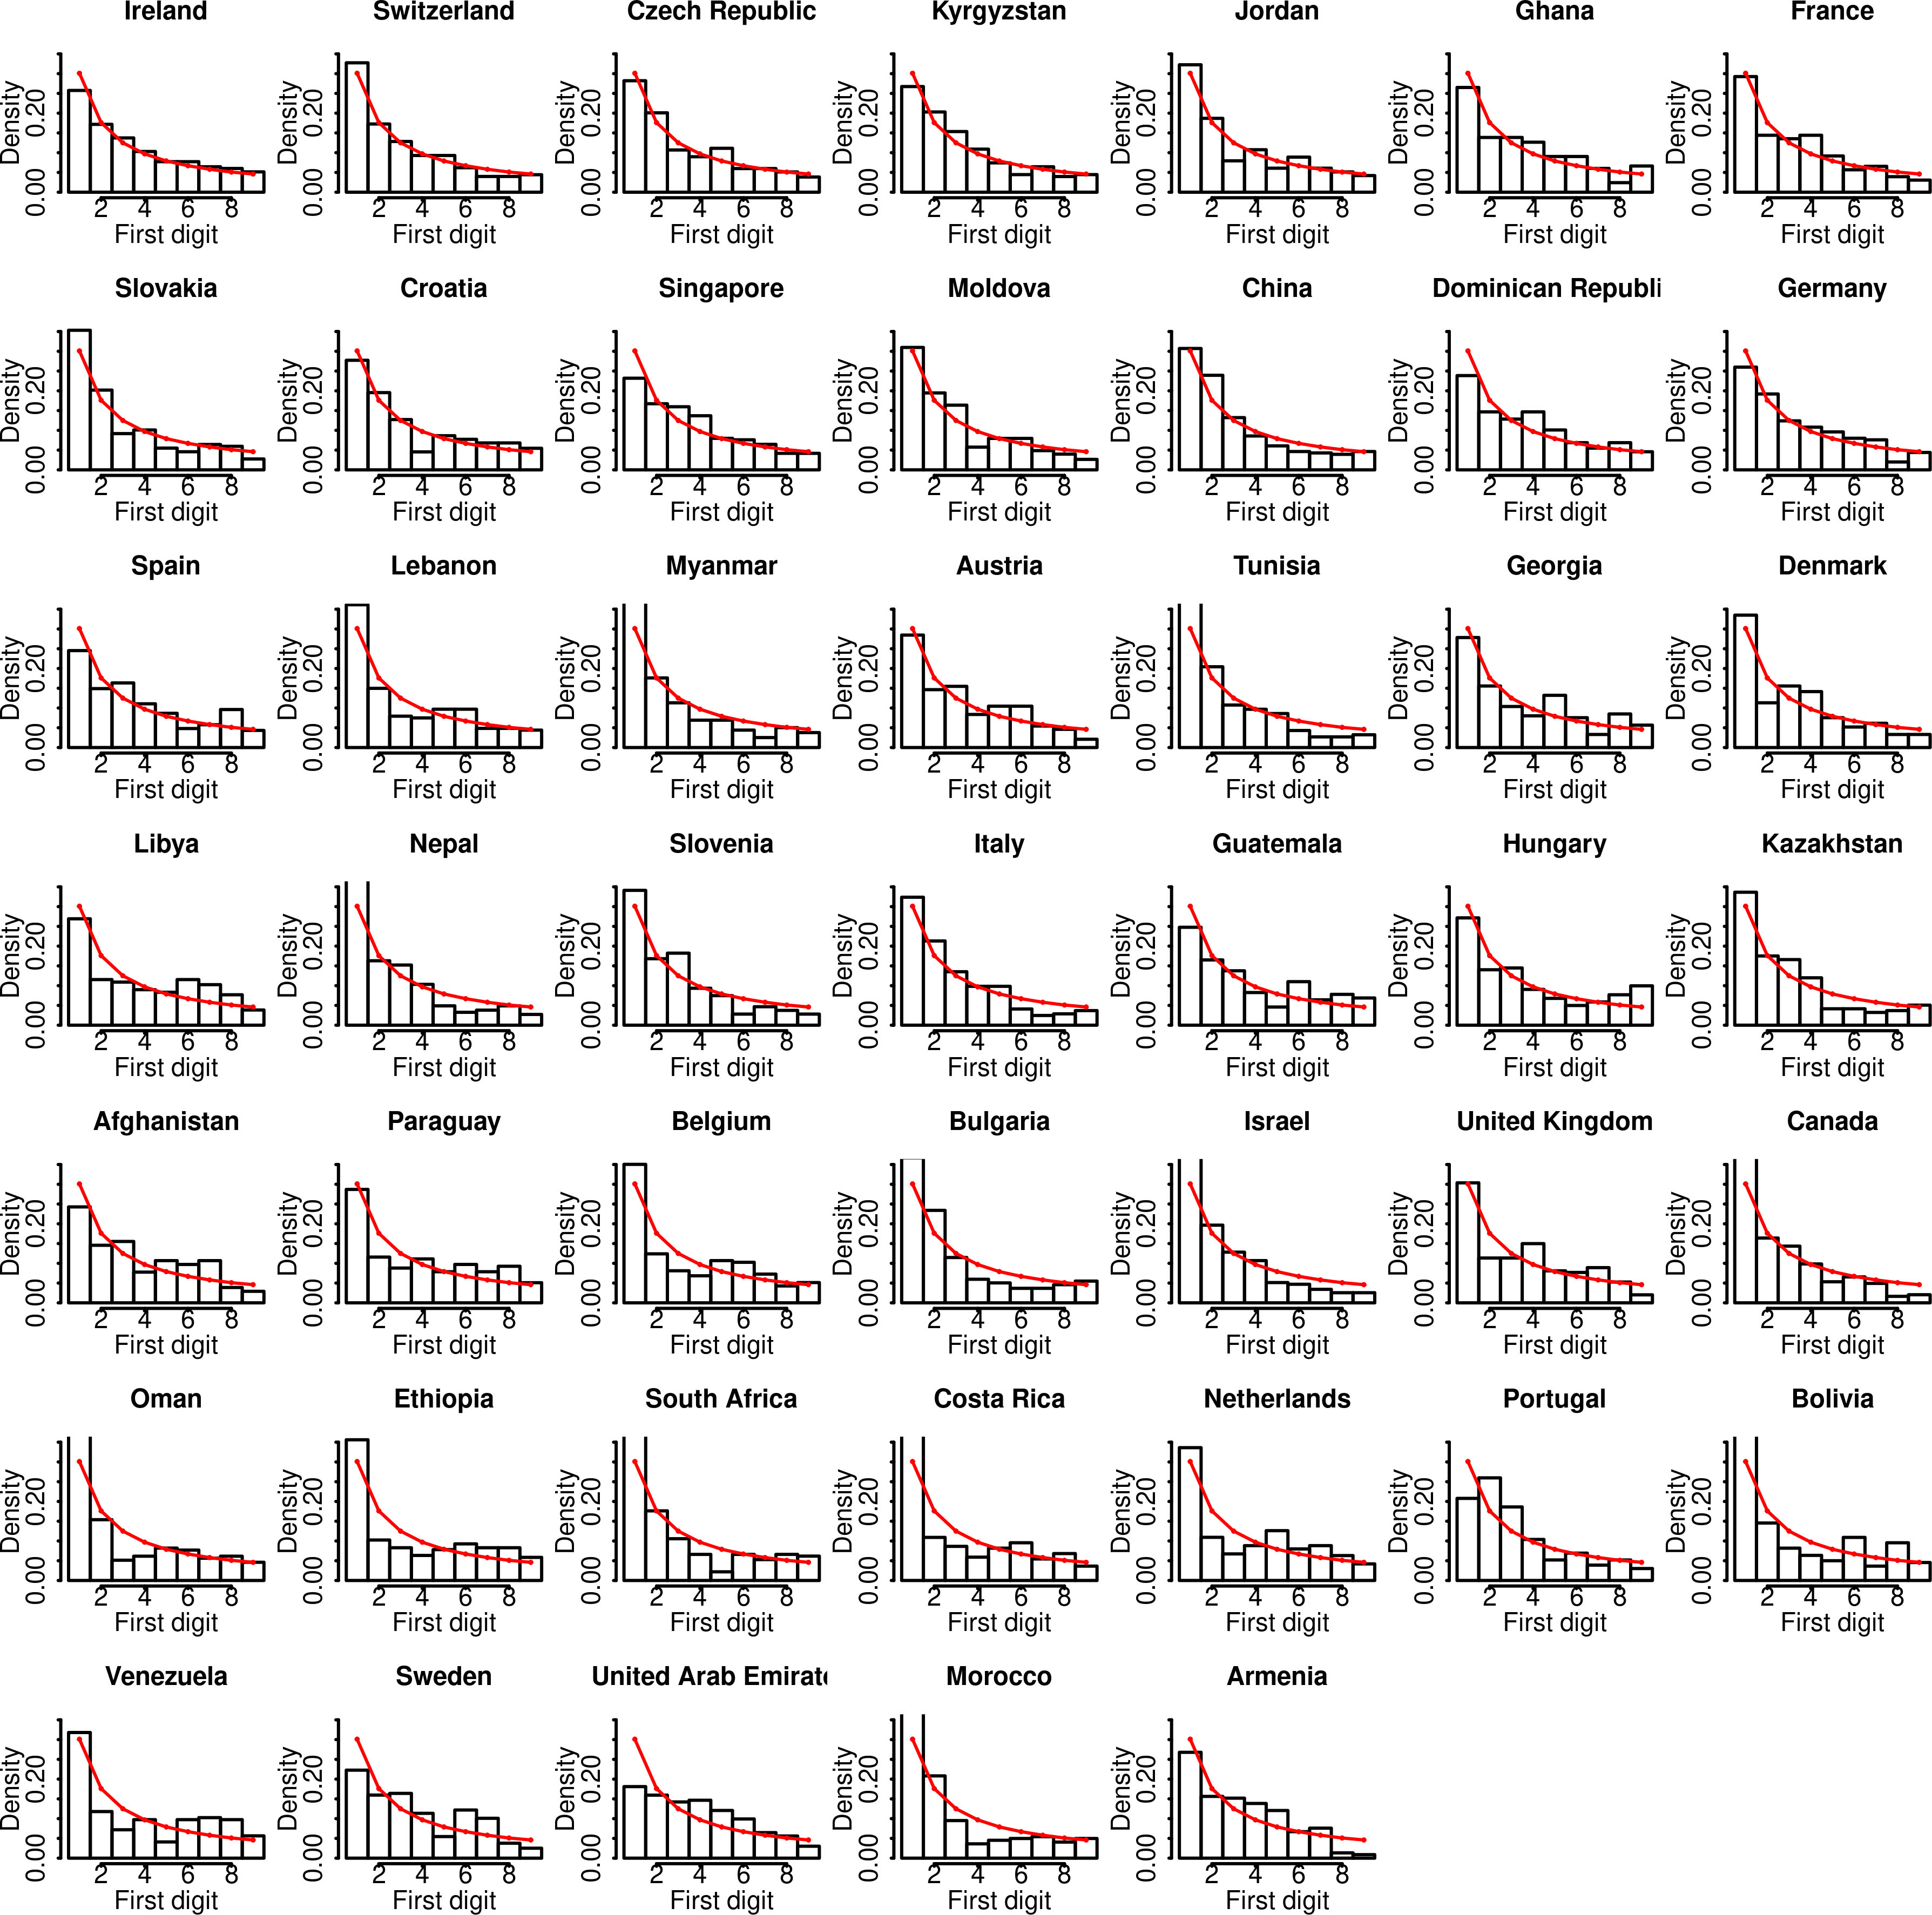
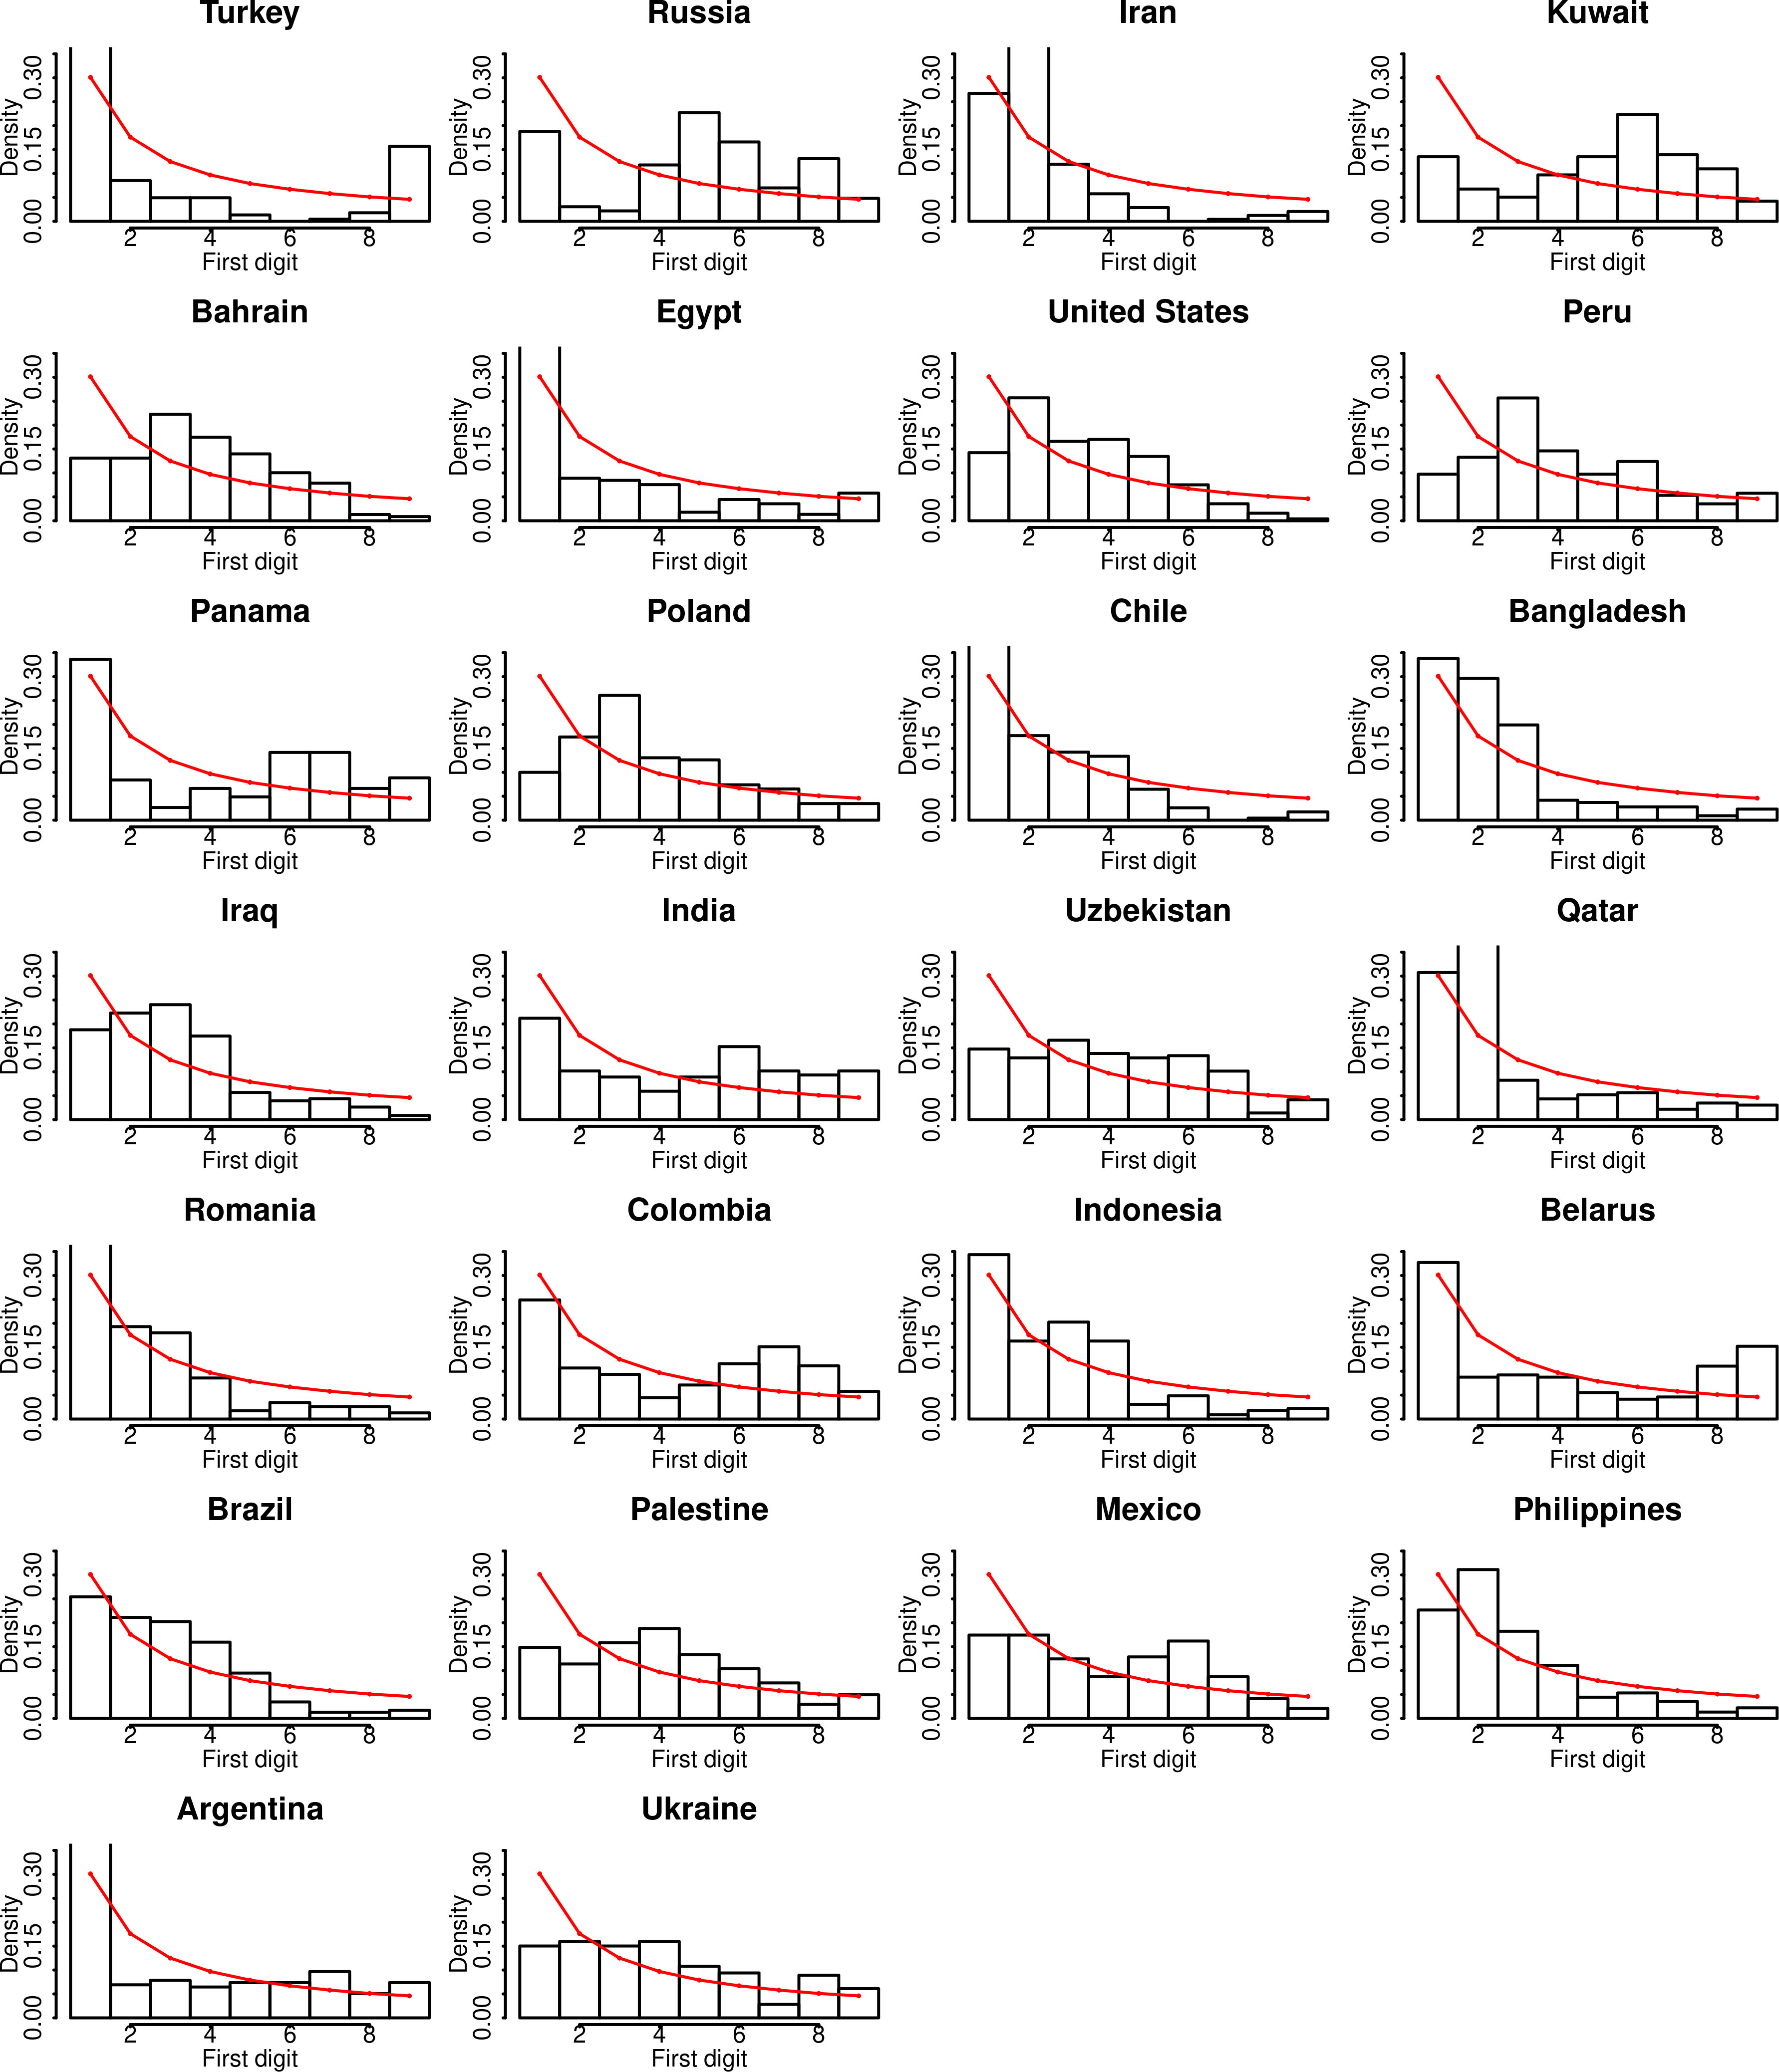
Figure 2.
First digit density distribution of daily new cases data from countries that clearly do not conform to the Benford’s law (
Here, we used the Benford’s law to analyze a data set of daily new cases of COVID-19 reported by 80 countries. Data analysis were carried out by root mean square deviation (RMSD), Likelihood of the fitted data and Chi-square test. Benford’s law may be an efficient screening methods for detecting fraudulent or misconducting procedures in the COVID-19 data collection, compilation and reporting.
2.Materials and methods
Data sets containing the number of daily new cases from every country were extracted from Our World in Data project (Roser et al., 2020) as comma-spaced values (CSV) files, processed with R (R Core Team, 2013), using Rstudio 1.2.5042 (RStudio Team, 2020) for Linux. Data sets used in this work contained information on the number of daily new cases by day, for each country, since the very first registered COVID-19 case, in date-integer formats. Depending on the date in which the first case was registered, the number of positive (not zero) registers for each country varies from 156 to 280 date-cases pairs (median
Data were subset to select countries that registered more than 1,000 cases in, at least, one single day. This sub setting was performed because real-world data sets that ranges for more than three orders of magnitude conform better to the Benford’s law than those that ranges for just one or two orders of magnitude (Fewster, 2009). First digits of every register in the data set were counted and stored for each studied country. Densities of Benford’s distribution among integer numbers were calculated from Eq. (1) to give the following proportions for each number, from 1 to 9, respectively: 0.301, 0.176, 0.125, 0.097, 0.079, 0.067, 0.058, 0.051 and 0.046. Root mean square deviation (RMSD), log of the Likelihood and Chi-square tests were calculated comparing the first digit distribution of each country (Figs 1 and 2, bars) with the Benford’s distribution (Figs 1 and 2, lines).
RMSD were calculated with a simple math routine in R and the log of Likelihoods were calculated as the “goodness-of-fit” of first digit distribution within Benford’s distribution as product of the single likelihoods of each data point, taking a normal distribution with the Benford’s density as mean and the standard deviation of the country’s first digit distribution.
Chi-square tests were performed with the R function “chisq.test”.
All procedures, data retrieving and manipulation, as well as graphics plotting can be reproduced using the R script “moreau.benford.r” available at Code Ocean (codeocean.com).
3.Results
A data set containing the daily number of cases registered and reported by countries (owid-covid-data.csv) was retrieved from Our World in Data project (Roser et al., 2020) and processed in order to evaluate their conformity to the Benford’s law. Countries that have not presented more than 1,000 cases in a single day, as well as those ones that presented less than 150 positive daily registries were excluded from the processed data set, as described in Material and Methods. Histograms depicting density distributions were built and plot together to the Benford’s density distribution. Figure 1 shows the first digit density distributions for countries in which the COVID-19 daily new cases data clearly conform to the Benford’s law (
Figure 2 shows first digit density distributions for countries in which the COVID-19 daily new cases data clearly do not conform to the Benford’s law (
Table 1
RMSD, log (Likelihood) and Chi-square results calculated from the first digit distribution of daily new cases of COVID-19 data from all 80 studied countries, fitted into the Benford’s distribution (Eq. (1)). Countries are sorted by RMSD (higher to lower)
| Country | RMSD | log (Likelihood) | Chi-square | Country | RMSD | log (Likelihood) | Chi-square |
|---|---|---|---|---|---|---|---|
| Turkey | 0.1282 | 4.38 | ** | Ethiopia | 0.0390 | 12.3 | |
| Iran | 0.1129 | 5.79 | ** | Bolivia | 0.0390 | 11.5 | |
| Egypt | 0.1022 | 5.78 | ** | Ecuador | 0.0379 | 14.7 | * |
| Russia | 0.0970 | 7.34 | ** | Netherlands | 0.0374 | 12.7 | |
| Kuwait | 0.0956 | 4.63 | ** | South Africa | 0.0367 | 11.0 | |
| Peru | 0.0867 | 8.49 | ** | Nepal | 0.0361 | 10.7 | |
| Poland | 0.0848 | 9.22 | ** | Canada | 0.0354 | 10.7 | |
| Bahrain | 0.0774 | 10.15 | ** | Bulgaria | 0.0353 | 10.8 | |
| United States | 0.0711 | 10.77 | ** | Israel | 0.0347 | 10.5 | |
| Qatar | 0.0706 | 8.7 | ** | Afghanistan | 0.0344 | 15.2 | |
| Palestine | 0.0676 | 10.8 | ** | Belgium | 0.0340 | 12.4 | |
| Uzbekistan | 0.0659 | 10.93 | ** | Libya | 0.0324 | 15.3 | |
| Iraq | 0.0641 | 10.98 | ** | United Kingdom | 0.0319 | 13.6 | |
| Panama | 0.0627 | 11.1 | ** | Armenia | 0.0318 | 13.7 | |
| Philippines | 0.0597 | 10.53 | ** | Denmark | 0.0317 | 12.3 | |
| Ukraine | 0.0591 | 12.22 | ** | Tunisia | 0.0310 | 11.0 | |
| Bangladesh | 0.0587 | 9.2 | ** | Spain | 0.0309 | 15.4 | |
| Argentina | 0.0580 | 10.0 | ** | Singapore | 0.0305 | 15.3 | |
| India | 0.0580 | 12.2 | ** | Paraguay | 0.0303 | 14.9 | |
| Mexico | 0.0562 | 13.14 | ** | Guatemala | 0.0298 | 15.6 | |
| Bosnia and Herzegovina | 0.0556 | 11.60 | * | Lebanon | 0.0295 | 12.2 | |
| Chile | 0.0551 | 8.9 | ** | Slovenia | 0.0290 | 11.6 | |
| Romania | 0.0549 | 8.9 | ** | Dominican Republic | 0.0289 | 15.8 | |
| Puerto Rico | 0.0543 | 13.5 | * | Hungary | 0.0276 | 15.1 | |
| Belarus | 0.0539 | 11.9 | ** | Georgia | 0.0272 | 14.8 | |
| Colombia | 0.0530 | 13.5 | ** | Kazakhstan | 0.0262 | 12.0 | |
| Honduras | 0.0504 | 14.1 | * | Slovakia | 0.0257 | 11.8 | |
| Morocco | 0.0498 | 9.5 | Ghana | 0.0249 | 15.2 | ||
| United Arab Emirates | 0.0489 | 14.4 | * | Austria | 0.0241 | 14.2 | |
| Portugal | 0.0473 | 12.6 | China | 0.0236 | 12.4 | ||
| Oman | 0.0473 | 10.3 | Italy | 0.0226 | 12.2 | ||
| Costa Rica | 0.0467 | 10.6 | Croatia | 0.0222 | 14.5 | ||
| Japan | 0.0466 | 14.2 | * | Moldova | 0.0222 | 12.7 | |
| Indonesia | 0.0461 | 10.5 | ** | France | 0.0221 | 14.0 | |
| Brazil | 0.0459 | 11.7 | ** | Germany | 0.0214 | 14.8 | |
| Myanmar | 0.0405 | 10.2 | Kyrgyzstan | 0.0200 | 14.0 | ||
| Sweden | 0.0401 | 14.5 | Jordan | 0.0198 | 13.2 | ||
| Saudi Arabia | 0.0396 | 10.7 | * | Ireland | 0.0173 | 15.8 | |
| Pakistan | 0.0393 | 13.8 | * | Czech Republic | 0.0172 | 14.3 | |
| Venezuela | 0.0391 | 13.2 | Switzerland | 0.0124 | 13.0 |
**
Eight countries layed in the group with disputable evidences to be in conformity to the Benford’s law, as evaluated by the Chi-square test (
Analysis of conformity to the Benford’s law were carried out by calculating RMSDs, Likelihoods em Chi-square tests for data of each country (bars), in comparison to the proportions of the Benford’s distribution (lines). Table 1 summarizes the calculated parameters for each country, sorted by the RMSD. As shown, countries with the highest 20 RMSD values presented
Figure 3.
Correlation between RMSD and log (Likelihood) calculated by fitting of the first digit distribution of daily new cases data from studied countries into the Benford’s distribution (Eq. (1)). The line traces the linear regression (
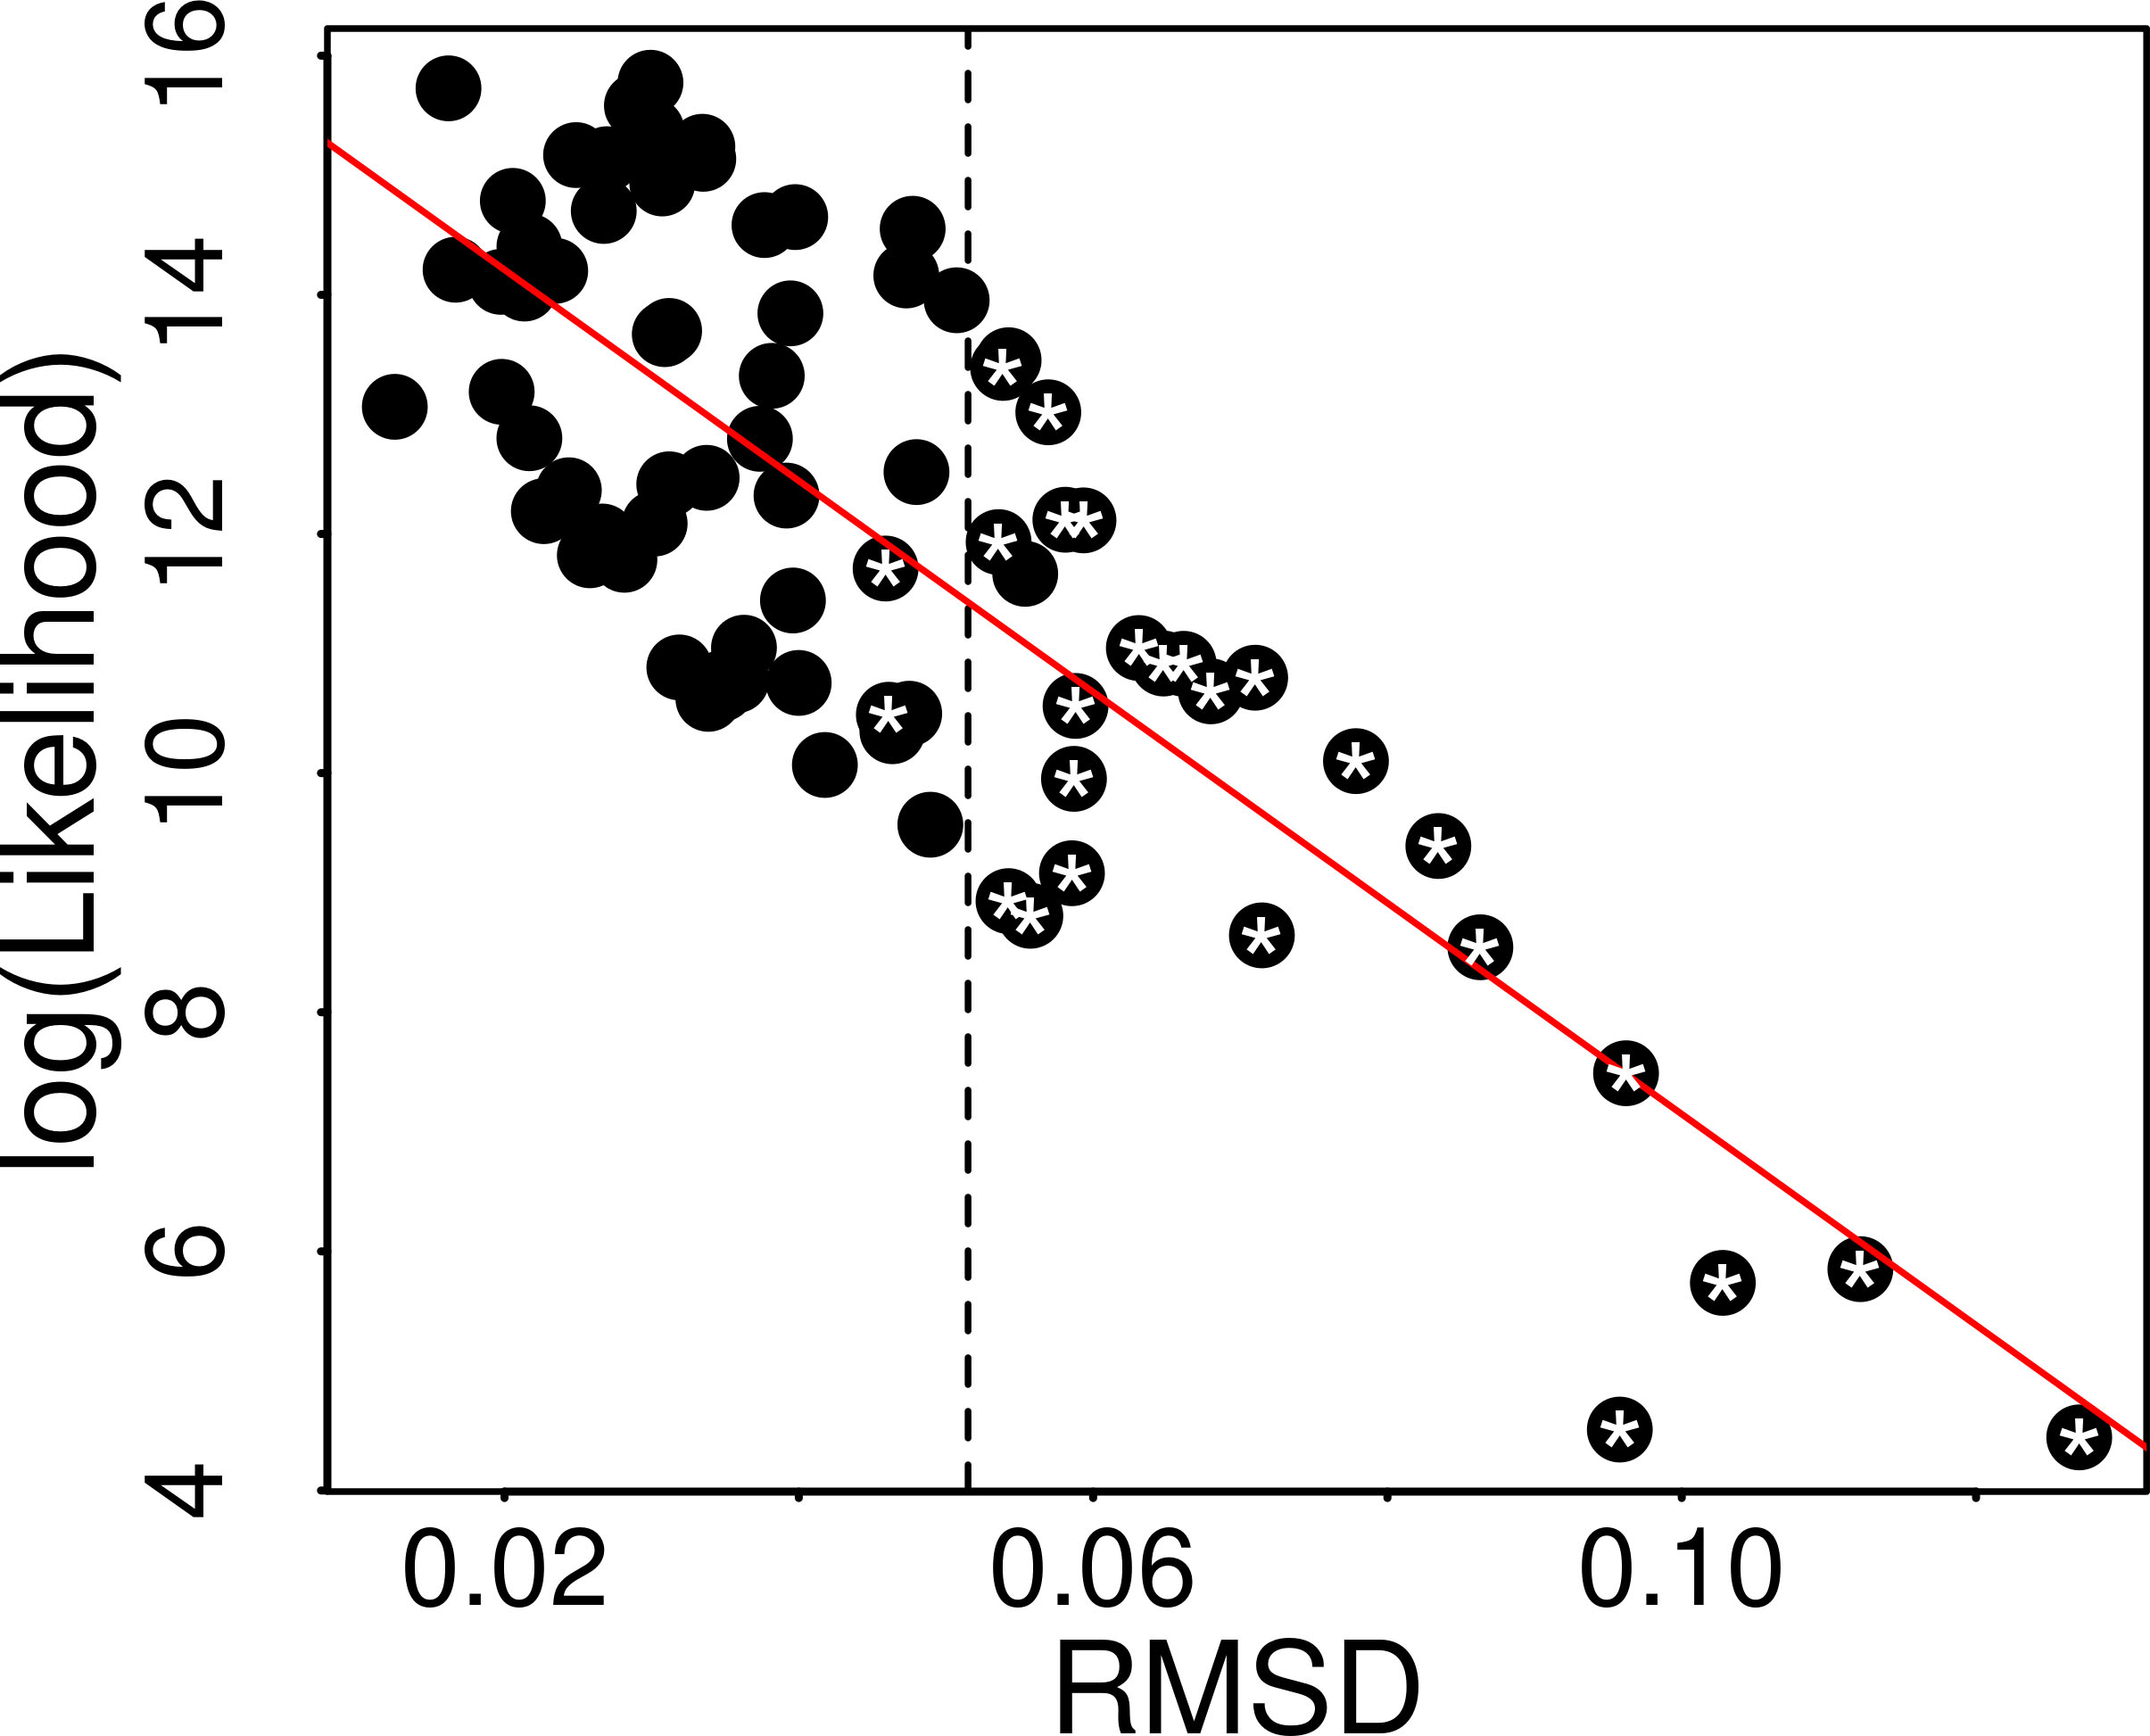
Figure 3 shows the correlation between RMSD and log (Likelihood) for studied countries. As Shown, there is a good correlation between these two parameters (
4.Discussion
Although a good accordance between Chi-square tests, log of Likelihoods and RMSD of the analysis of data conformity of countries daily new cases of COVID-19 to the Benford’s law could be observed, some divergences were noted from those three analytical tools. For instance, data from Bosnia and Herzegovina and Puerto Rico presented RMSD values above 0.051 (dashed vertical line in Fig. 3), though the result of Chi-square tests rejected the hypothesis of non association to the Benford’s law (
Data on the daily new cases of COVID-19 from 26 countries clearly have not conformed to the Benford’s law, as evaluated by Chi-square test (
Benford’s analysis has been used to evaluate COVID-19 data in a preprint paper (Wei & Vellwock, 2020) that evaluates the “Benfordness” using the Euclidian distance between the country numbers and Benford’s distribution - what was called “d-factor”. Although Euclidian distance is not a hypothesis test, the authors argued that a d-factor smaller than 0.25 – an arbitrarily set value - denotes conformity to the Benford’s law. Here, I used Chi-square test, which I believe to be more likely to be used - such it is a hypothesis test. Additionally, the present data have shown good correlation between Chi-square test and RMSD for the used data sets, reinforcing its use.
Results presented here open room to the possibility of data corruption in the reported data of COVID-19 from many countries. Specially in those countries where the lack of democratic principles can restrain the free access to information, both economic and political criteria might superimpose technical and scientific ones. This data corruption may exert a huge impact on the decision taking and on the management of COVID-19 pandemic all over the world.
5.Disclosure statement
Author declare no commercial associations that might create a conflict of interest in connection with submitted manuscripts.
References
[1] | Alexopoulos, T., & Leontsinis, S. ((2014) ). Benford’s Law and the Universe. |
[2] | Aron, J. ((2013) ). Crime-fighting maths law confirms planetary riches. New Sci, 220: , 12. |
[3] | Arshadi, L., & Jahangir, A. H. ((2014) ). Benford’s law behavior of Internet traffic. J Netw Comput Appl, 40: , 194-205. |
[4] | Badal-Valero, E., Alvarez-Jareño J. A., & Pavía J. M. ((2018) ). Combining Benford’s Law and machine learning to detect money laundering. An actual Spanish court case. Forensic Sci Int, 282: , 24-34. |
[5] | Banks, W. P., & Hill, D. K. ((1974) ). The apparent magnitude of number scaled by random production. J Exp Psychol, 102: , 353-376. |
[6] | Benford, F. ((1938) ). The law of anomalous numbers. Proc Am Philos Soc, 78: , 551-572. |
[7] | Cerioli, A., Barabesi, L., Cerasa, A., Menegatti, M., & Perrotta, D. ((2019) ). Newcomb-Benford law and the detection of frauds in international trade. Proc Natl Acad Sci U.S.A, 116: , 106-115. |
[8] | Clippe, P., & Ausloos, M. ((2012) ). Benford’s law and Theil transform of financial data. Phys A Stat Mech its Appl, 391: , 6556-6567. |
[9] | Cournane, S., Sheehy, N., & Cooke, J. ((2014) ). The novel application of Benford’s second order analysis for monitoring radiation output in interventional radiology. Phys Medica, 30: , 413-418. |
[10] | Fewster, R. M. ((2009) ). A simple explanation of benford’s law. Am Stat 63: , 26-32. |
[11] | Gauvrit, N., Houillon, J. C., & Delahaye, J. P. ((2017) ). Generalized Benford’s Law as a Lie Detector. Adv Cogn Psychol, 13: , 121-127. |
[12] | Hickman, M. J., & Rice, S. K. ((2010) ). Digital analysis of crime statistics: Does crime conform to benford’s law? J Quant Criminol, 26: , 333-349. |
[13] | Hüllemann, S., Schüpfer, G., & Mauch, J. ((2017) ). Application of Benford’s law: A valuable tool for detecting scientific papers with fabricated data? A case study using proven falsified articles against a comparison group. Anaesthesist, 66: , 795-802. |
[14] | Lacasa, L. ((2019) ). Newcomb-Benford law helps customs officers to detect fraud in international trade. Proc Natl Acad Sci U.S.A, 116: , 11-13. |
[15] | Mir, T. A. ((2014) ). The Benford law behavior of the religious activity data. Phys A Stat Mech its Appl, 408: , 1-9. |
[16] | Newcomb, S. ((1881) ). Note on the frequency of use of the different digits in natural numbers. Am J Math, 4: , 39. |
[17] | Nickerson, R. S. ((2002) ). The production and perception of randomness. Psychol Rev, 109: , 330-357. |
[18] | Park, J. A., Kim, M., & Yoon, S. ((2016) ). Evaluation of large-scale data to detect irregularity in payment for medical services. An Extended Use of Benford’s Law. Methods Inf Med, 55: , 284-91. |
[19] | R Core Team. ((2013) ). R: A Language and Environment for Statistical Computing. Vienna, Austria. |
[20] | Roser, M., Ritchie, H., Ortiz-Ospina, E., & Hasel, J. ((2020) ). Coronavirus pandemic (COVID-19). |
[21] | RStudio Team. ((2020) ). RStudio: integrated development environment for R. Boston, MA. |
[22] | Sambridge, M., Tkalcic, H., & Arroucau, P. ((2011) ). Benford’s law of first digits: From mathematical curiosity to change detector. Asia Pacific Math Newsl, 1: , 1-5. |
[23] | Wei, A., & Vellwock, A. E. ((2020) ). Is COVID-19 data reliable? A statistical analysis with Benford’s Law. Preprints. |

