
Effect of TV advertising on energy intake of Georgian children: Results of an experimental study
Abstract
BACKGROUND:
Food advertising has been hypothesized to be related with increased consumption of energy-dense food in children, resulting in weight gain. Several studies have been conducted in this field, but little is known about children living in Eastern Europe countries.
OBJECTIVE:
The aim of this study was to investigate the influence of TV viewing and TV advertising on energy intake in Georgian children.
METHODS:
Sixty children aged 3–11 were recruited in a school of Tbilisi (Georgia) and were exposed, in an experimental setting, to different levels of TV and TV advertising: “no exposure to TV”, “exposure to TV without advertising”, “exposure to TV and one advertising”, “exposure to TV and two advertisings”, “exposure to TV and three advertisings”. Children were asked to eat ad libitum for 20 minutes a chocolate-based snack during the afternoon break.
RESULTS:
Enrolled children showed a median value of energy intake of 220.72 kcal, corresponding to a median of 2 snacks for each child. No significant association between energy intake and TV viewing/TV advertising was found, even after adjustment for potential confounding factors.
CONCLUSION:
Findings from the present experimental study showed no association of TV viewing and TV advertising with energy intake in a sample of Georgian children.
1Introduction
Childhood obesity represents a severe public health challenge, affecting both developed and newly industrialized countries. In 2010, it was estimated that more than 40 million of children under the age of 5 were overweight [1].
Overweight and obese children are likely to be obese also in adulthood, with a consequently high risk of developing non-communicable diseases (such as hypertension, dyslipidemia, type 2 diabetes, heart disease, stroke, and certain cancers) [1]. Additionally, obesity status in childhood has found to be related with low levels of self-esteem and negative emotional states (sadness, loneliness, and nervousness) [2].
Several factors have found to be associated with obesity development, and, in addition to genetic factors, a disadvantageous shift in energy balance seems to have play a key role in influencing weight gain. The change in lifestyle (including both changes of dietary habits and reduction of physical activity due to sedentary behaviors) has led to an excess energy intake and, consequently, to weight gain [3].
Clearly, it’s crucial to assess factors promoting the intake of energy-dense food, together with the adoption of sedentary behaviors. Researchers are now interested in examining the role of food advertising on children’s food choices and energy intake [4, 5]. Time spent watching TV appears to be related with increased risk of overweight and obesity, not only because watching TV promotes sedentary behaviors, reducing physical activity, but also because it’s much more likely that children exposed to food advertising choose advertised food (generally energy-dense, nutrient-poor, food products), with a consequently excess energy intake and weight gain [6, 7]. It has been shown that the higher the number of hours spent watching television, the higher the caloric intake and that the greater caloric intake is represented by energy-dense, nutrient-poor food (e.g., snacks and soft drinks) [4, 5].
Several countries have been reached, only recently, by these lifestyle changes (conducting to sudden and dramatic rising of obesity prevalence), as a result of economic development. Post-Soviet nations represent an example of countries that are going through such economic transition, which results in changes of lifestyle habits, promoting obesity development [3]. Not surprisingly, the increasing prevalence of overweight and obesity in such Post-Soviet countries corresponds to the shift from the Soviet model of planned economy to a free market economy (e.g. in Russia) [3, 8].
Among Post-Soviet countries, Georgia is considered one of the fastest growing economies of Eastern Europe. This rapid economic development entails an ever-increasing accessibility to children of most of the factors known to be related with increased obesity risk in Western countries. A recent study on a sample of Georgian children living in Tbilisi has shown that enrolled kids have unhealthy eating habits [9]. Moreover, overweight has been found to be a more prevalent problem compared to undernutrition among Georgian children [10], and overweight/obesity rates have been found to be consistent with those of countries of Central Europe [11].
Given the severe and increasing public health burden represented by childhood obesity, it’s crucial to investigate obesity risk factors, referring especially to non-traditional ones (e.g. food advertising), to specifically target public health policies fighting obesity epidemic also among Post-Soviet countries [3, 8]. However, determinants of overweight and obesity are not widely discussed among children living in Eastern Europe nations.
In this framework, our objective is to investigate the influence of TV viewing and food advertising on energy intake in children in an ad libitum snacking occasion, targeting children in a post-Soviet country, Georgia.
2Materials and methods
2.1Study design
The experimental factor investigated was the exposure to TV and TV advertising, organized in five levels: “no exposure to TV” (NoFilmNoSpot), “exposure to TV without advertisement” (FilmNoSpot), “exposure to TV and one advertisement” (FilmLowSpot), “exposure to TV and two advertisements” (FilmMediumSpot), “exposure to TV and three advertisements” (FilmHighSpot). The Film was a cartoon lasting about 22 minutes, chosen to be a non-spoken cartoon.
The main character was the Disney cartoon character Pluto ©, and the movie was made up by a set of episodes, according with a previous study [12]. The advertisements lasted 30 seconds and were in the country-specific language [13]. They referred to the snack given to the children during the experimental session. The advertisements were delivered at 0′ for the FilmLowSpot level, at 0′ and 6′15″ in the FilmMediumSpot level, and at 0′, 6′15″, and 10′35″ for the FilmHighSpot level. The children had never seen the advertising before.
2.2Randomization and ethical conduction of the study
Each child was randomized to one of the 5 cells of the full-factorial design. Randomization was performed using a software integrated with the data collection and study conduction system. Randomization was stratified by age (two groups of children 3–6 and 7–11 years old) and by gender (male and female) to ensure complete balance for the potential confounding factors. Exclusion criteria were: suffering of cognitive disorders or metabolic diseases or allergies to the snack presented during the experiment.
Parents were asked to sign an informed consent before child’s participation in the study. Participant treatment followed the guidelines and ethics issued by American Psychologist Association. Appropriate permission was obtained.
2.3Study setting
A sample of 60 children was enrolled in a school of Tbilisi in Georgia. The experimental session was conducted during the afternoon break, in a quiet room within the school structure. All children had a standard meal (provided by the school) and practiced regular physical activity.
Parents were asked to sit on a lateral or back position to fill out the parents’ questionnaire, without being seen by the children, who were sitting at a table, facing a monitor (if applicable according to the group to which they were randomized). Children were video-recorded through two hidden HD cameras, positioned to record frontal and side images, while the researcher assumed a back-screen position to easily interact with the child.
2.4Parents’ questionnaire
A standardized questionnaire, consisting of different parts, was administered to parents. The first section assessed family’s socio-demographic characteristics, habits and anthropometrics (number of siblings, with whom the child lives, parents’ educational level, working status, family members’ weight and height, and physical activity frequency). The second part of the questionnaire aimed at assessing child’s food habits, (duration of breastfeeding, actual meal frequency and food consumption). The last investigated child’s physical activity (frequency and weekly hours of physical activity).
2.5Anthropometrics
Weight and height of children, wearing light clothes and without shoes, were taken using an electronic stand-up balance scale and a rigid metric belt. BMI was computed as weight divided by height squared and BMI z-scores were computed for each child according with CDC Pediatric Growth Charts [14].
2.6Brand awareness assessment
Children brand awareness was assessed using a validated tool, the IBAI questionnaire [15]. The questionnaire consisted of 12 food brand logos (including both international and country-specific brands).
Children were asked to recognize the brand presented in the food image, to match it with a second image chosen among 4 different options, and finally to report the specific name of the food product. Brand Awareness Scores (IBAI-score) could range from a minimum of 0 to a maximum of 36. Four different categories of brand awareness were identified: 0–12 very low brand awareness; 13–18 medium-low brand awareness; 19–24 medium-high brand awareness; 25–36 very high brand awareness [16].
2.7Study conduction
Children were measured (weight and height) to calculate their BMI. Afterwards, the IBAI questionnaire was administered to children by the interviewer. Once the assessment of brand awareness was completed, the interviewer explained the progression of the study to the child.
The snack employed for the study was a chocolate based product, mimicking Easter egg (nutritional facts per 100 g (1 snack = 20 g): 545 Kcal, 8.3 g protein, 55 g carbohydrate, 51 g sugar, 32.4 g fat, 14 g saturated fat, 0.083 g sodium, 1.8 g alimentary fiber). It was prepared ad hoc for the experimental study in Georgia, and was chosen because the particular selling combination of the snack allowed a precise weight of the content, both before and after the study, giving, in this way, an accurate estimate of the amount of calories eaten by every child.
The part containing the chocolate was previously weighted and then offered to children. At the time of the first offering of the snack to the child, if the child was assigned to a TV exposed group, the movie was started and not interrupted for any reason thereafter. After the first snack, the investigator could present a further snack one by one (always waiting for the child’s request). Each child could eat ad libitum up to a maximum of 12 snacks. Snacking offering was performed using a pre-developed protocol, in a way to control, as much as possible, investigator influence on the child behavior.
Once the experimental session was concluded, the investigator weighed the chocolate’s residues per each snack, recording all weights in the study software.
All the sessions were digitally recorded for subsequent examination and data quality assurance.
2.8Statistical analysis
Descriptive statistics were reported using median (I-III quartile) for continuous variables and percentages (absolute numbers) for categorical variables, whenever appropriate. Wilcoxon-Kruskal-Wallis test was performed for continuous variables and Pearson chi square test for categorical ones.
The analysis was based on a linear model where blocking factors (age, gender, and FilmSpot) were considered in the model. This is the base model used in the analysis. Specific investigations on single factor-level effects were conducted using appropriate linear contrasts.
To further check for additional confounding factors, six models were developed. In each model, variables were added to the base model:
Base: Age+Gender+FilmSpot
M1: BMI+Breast Feed+Hours/Week TV+Physical activity (hours/week)
M2: BMI Father+BMI Mother+number Brothers
BA: IBAI-Score
M3: Number of rooms in the house+number of TV in the house+Educational level mother
M4: breakfast in the morning+fruit portions/day+vegetables portions/day
Each model was estimated and the AIC criterion in the backward fashion was used for variables selection. For each model, significance of the experimental factor was assessed.
Children were identified as “high consumers” if their caloric intake during the experimental session exceeded the III quartile of the observed distribution.
Analyses were performed using the R System [17].
3Results
3.1Sample characteristics
Fifty-seven children took part to the experimental session. Three children did not take part to the experimental session due to late refusal of consent. Sample characteristics are summarized in Table 1. Children’s parents BMI showed a median of 22 for the mothers and 26 for the fathers. The median weekly hours of TV watching was 15. The analysis of eating habits demonstrated that most of children ate only one serving of fruit and vegetables per day. Referring to brand awareness, the IBAI score showed a normal distribution (Fig. 1, on the left side) with a median value of 13 (which corresponds to low brand awareness).
Table 1
Children characteristics according with randomization. Categorical variables are expressed as percentages (absolute numbers in parenthesis) and continuous variables as median [I and III quartile]
| FilmHighSpot | FilmLowSpot | FilmMediumSpot | FilmNoSpot | NoFilmNoSpot | Combined | P-value | |
| N = 12 | N = 12 | N = 12 | N = 9 | N = 12 | N = 57 | ||
| Age | 6 [5; 10>] | 6 [6; 8] | 6 [5; 9] | 6 [4; 9] | 6 [4; 7] | 6 [5; 9] | 0.824 |
| Gender: Male | 50% (6) | 50% (6) | 50% (6) | 44% (4) | 50% (6) | 49% (28) | 0.999 |
| BMI: Normal weight | 50% (6) | 67% (8) | 58% (7) | 44% (4) | 50% (6) | 54% (31) | 0.855 |
| Obese | 17% (2) | 25% (3) | 17% (2) | 11% (1) | 17% (2) | 18% (10) | |
| Overweight | 33% (4) | 8% (1) | 25% (3) | 44% (4) | 33% (4) | 28% (16) | |
| Neonatal feeding: Both | 25% (3) | 0% (0) | 10% (1) | 0% (0) | 8% (1) | 9% (5) | 0.134 |
| bottle-feeding | 0% (0) | 17% (2) | 0% (0) | 38% (3) | 17% (2) | 13% (7) | |
| breast-feeding | 75% (9) | 83% (10) | 90% (9) | 62% (5) | 75% (9) | 78% (42) | |
| Weekly TV hours | 14 [9; 18] | 13 [10; 23] | 16 [13; 19] | 14 [7; 18] | 16.00 [12; 18] | 15 [11; 18] | 0.811 |
| Weekly breakfast frequency: | |||||||
| 2–3 days a week | 0% (0) | 0% (0) | 17% (2) | 0% (0) | 8% (1) | 5% (3) | 0.4 |
| 3–4 days a week | 8% (1) | 8% (1) | 0% (0) | 11% (1) | 0% (0) | 5% (3) | |
| every day | 92% (11) | 75% (9) | 67% (8) | 78% (7) | 58% (7) | 74% (42) | |
| never | 0% (0) | 17% (2) | 17% (2) | 11% (1) | 33% (4) | 16% (9) | |
| Daily fruit servings: 1 | 42% (5) | 83% (10) | 67% (8) | 67% (6) | 50% (6) | 61% (35) | 0.193 |
| 2 | 42% (5) | 17% (2) | 25% (3) | 11% (1) | 50% (6) | 30% (17) | |
| 3 | 0% (0) | 0% (0) | 0% (0) | 11% (1) | 0% (0) | 2% (1) | |
| 4 | 17% (2) | 0% (0) | 0% (0) | 11% (1) | 0% (0) | 5% (3) | |
| more than 4 | 0% (0) | 0% (0) | 8% (1) | 0% (0) | 0% (0) | 2% (1) | |
| Daily vegetables servings: 1 | 92% (11) | 75% (9) | 75% (9) | 78% (7) | 58% (7) | 75% (43) | 0.759 |
| 2 | 0% (0) | 8% (1) | 17% (2) | 11% (1) | 25% (3) | 12% (7) | |
| no one | 8% (1) | 17% (2) | 8% (1) | 11% (1) | 17% (2) | 12% (7) | |
| Mother’s BMI | 22 [21; 24] | 22 [19; 24] | 20 [18; 22] | 23 [19; 25] | 22 [19; 23] | 22 [19; 24] | 0.769 |
| Father’s BMI | 24 [22; 27] | 26 [25; 28] | 26 [23; 30] | 27 [26; 29] | 25 [25; 26] | 26 [23; 27] | 0.17 |
| IBAI score | 11 [5; 15] | 12 [10; 15] | 10 [4; 16] | 13 [10; 20] | 14 [7; 17] | 13 [8; 17] | 0.955 |
Fig.1
On the left side, IBAI box plot. On the right side, energy intake box plot.
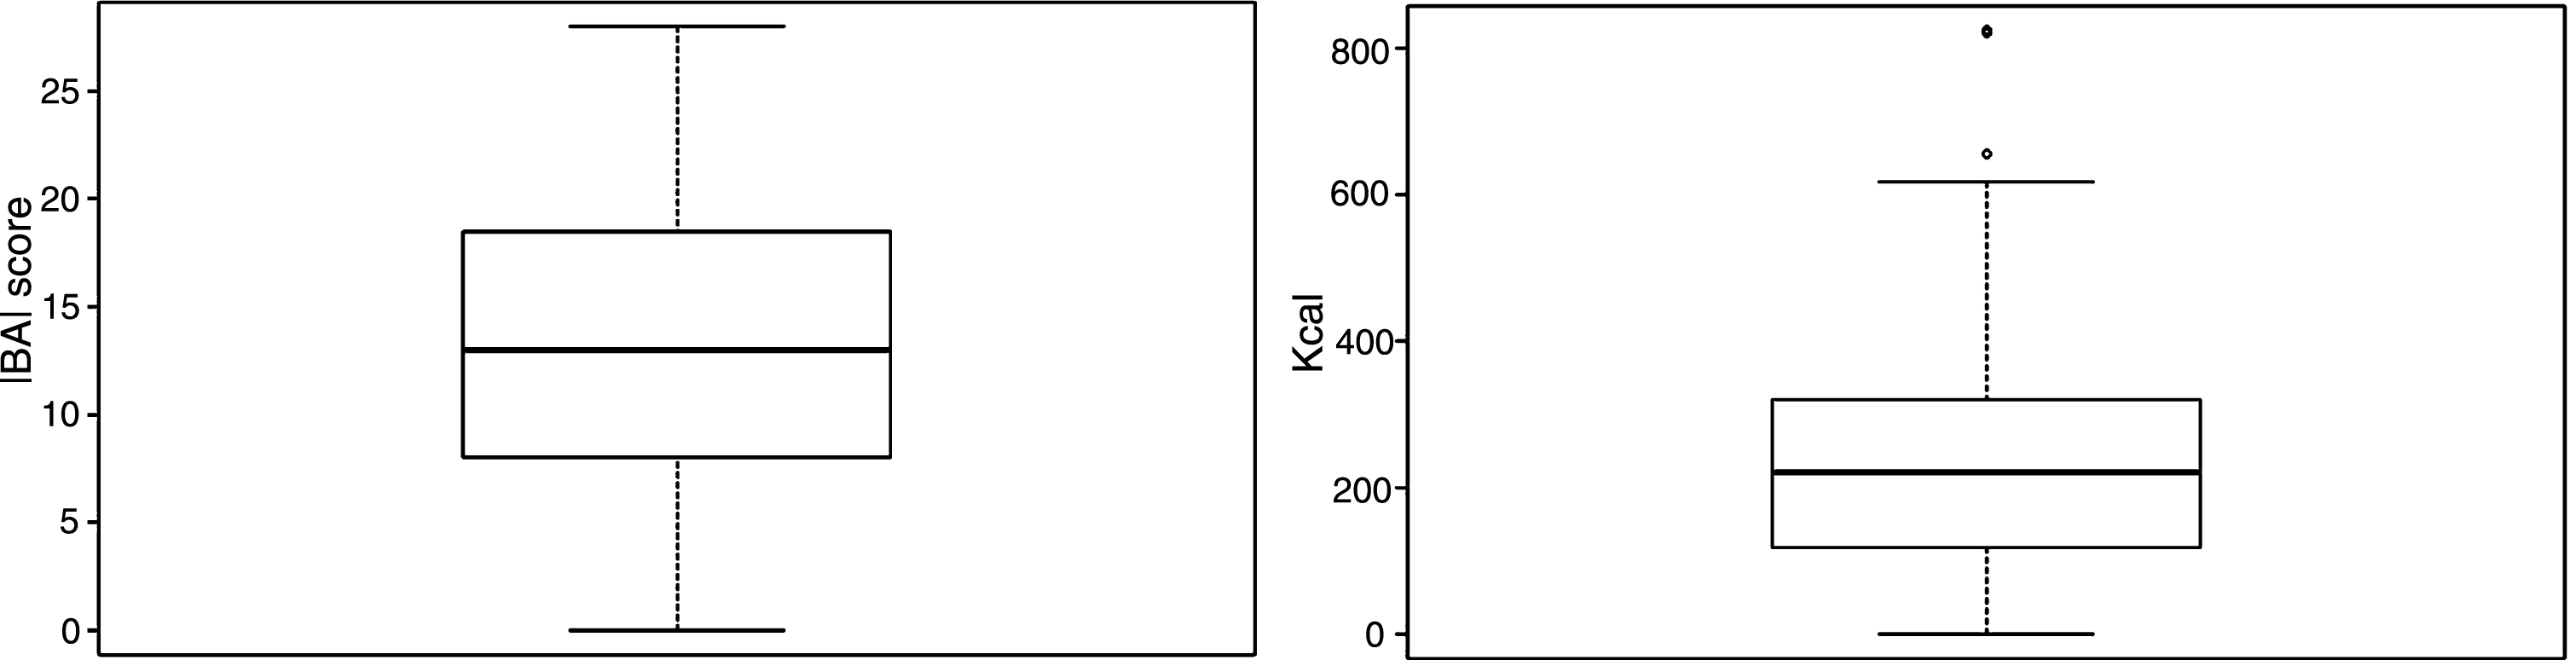
No significant differences were found according with the experimental factor (TV viewing and TV advertising).
The energy intake reported a median value of 220.72 kcal (Fig. 1, on the right side), roughly corresponding to a median of 2 snacks for each child (median of 40.50 g).
3.2Effect of TV viewing and advertising on energy intake
Data on energy intake (both absolute values and per BMI) in specific study factors’ subgroups are presented in Table 2. The higher absolute caloric intake was found among children in the “exposure to TV without advertising” group (median of 307.30 Kcal), which is shown also in Fig. 2. However, the assessment of the relationship between energy intake and different levels of TV viewing and TV advertising exposure revealed no significant association, even after the adjustment for all the described potential confounding factors (Table 3).
Table 2
Overall energy intake (Kcal) according to the study factors
| Study Factors | NoFilmNoSpot | FilmNoSpot | FilmLowSpot | FilmMediumSpot | FilmHighSpot | Total |
| 12 | 9 | 12 | 12 | 12 | 57 | |
| Median | 267.32 | 307.38 | 218.27 | 221.54 | 217.18 | 220.73 |
| [I-III quartile] | [92.24–477.97] | [168.95–361.88] | [134.34–307.38] | [213.10–291.58] | [118.27–340.90] | [120.45–319.37] |
| 15.61 | 13.55 | 12.76 | 13.16 | 13.44 | 13.29 | |
| [4.19; 26.94] | [7.85; 20.77] | [7.60; 15.22] | [11.30; 16.12] | [6.77; 16.55] | [7.32; 18.47] |
The post-hoc power referred to the anova test, for the energy intake and the different levels of TV and TV advertising exposure, was equal to 0.22.
3.3High consumer
Fig.2
Energy intake related to TV and advertising exposure.
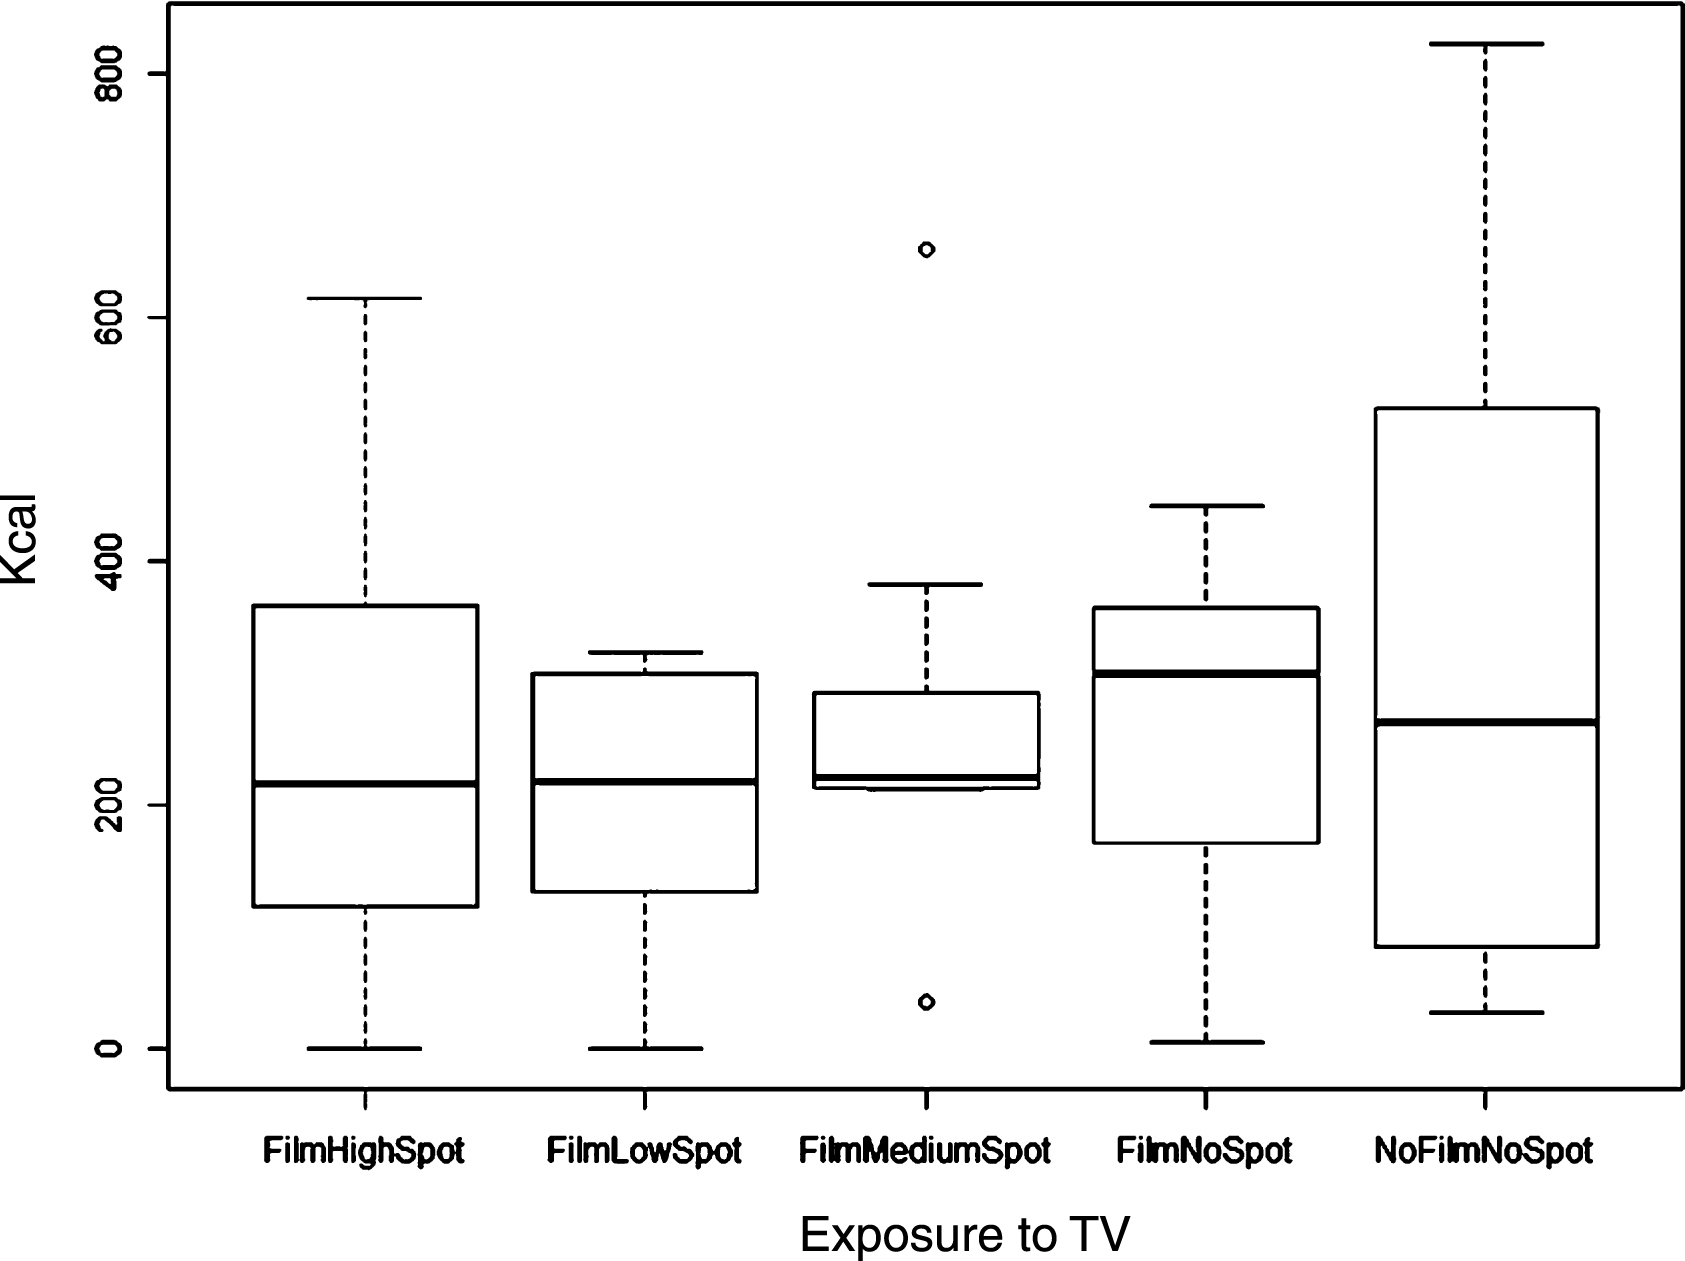
Table 3
Significance of the TV and advertising after adjustment for several potential confounding factors. P-value is considered significant when p < 0.05
| FilmSpot | |||||
| bTVNs | bTVLs | bTVMs | bTVHs | P-value | |
| Base | –65.52 (79.69) | –131.15 (73.88) | –75.34 (74.28) | –103.25 (74.39) | 0.4839 |
| Base+M1 | –16.586 (94.666) | –105.147 (84.816) | –124.293 (86.513) | –103.763 (86.988) | 0.5372 |
| Base+M1 + M2 | –46.888 (94.584) | –131.935 (85.596) | –119.437 (88.409) | –121.979 (87.213) | 0.4873 |
| Base+M1 + M2 + BA | –38.6420 (93.3084) | –95.3199 (88.8684) | –60.5780 (87.2482) | –95.8394 (88.2662) | 0.7853 |
| Base+M1 + M2 + BA+M3 | –92.314 (92.834) | –105.403 (87.302) | –85.342 (87.084) | –231.926 (105.432) | 0.3174 |
| Base+M1 + M2 + BA+M3 + M4 | –145.0500 (140.5660) | –125.2385 (110.6775) | –125.1601 (100.0920) | –285.3881 (127.5205) | 0.2902 |
The third quartile of energy intake corresponded to an amount of 319.4 kcal. This value was chosen as the cut-off to identity the subgroup of children with high energy intake during the experimental session.
Only 14 children were found to be high consumers according with this cut-off. Table 4 shows the main characteristics of such “high consumer” children, who were not significant different for any of the characteristics analyzed compared to “low consumers”, except for gender (male children were more likely to be “high consumer” compared to female ones, p-value 0.011).
Table 4
Characterization of the High Consumers according to the main study variables. Categorical variables are expressed as percentage (absolute numbers in parenthesis) and continuous variables as median [I and III quartile]
| Low | High | P-value | |
| N = 43 | N = 14 | ||
| TV advertsing: FilmHighSpot | 21% (9) | 21% (3) | 0.357 |
| FilmLowSpot | 26% (11) | 7% (1) | |
| FilmMediumSpot | 23% (10) | 14% (2) | |
| FilmNoSpot | 14% (6) | 21% (3) | |
| NoFilmNoSpot | 16% (7) | 36% (5) | |
| Age | 6 [5; 9] | 8 [5; 10] | 0.199 |
| Gender: Male | 40% (17) | 79% (11) | 0.011 |
| BMI: Normal weight | 58% (25) | 43% (6) | 0.366 |
| Obese | 19% (8) | 14% (2) | |
| Overweight | 23% (10) | 43% (6) | |
| Neonatal feeding: Both | 10% (4) | 8% (1) | 0.94 |
| bottle-feeding | 12% (5) | 15% (2) | |
| breast-feeding | 78% (32) | 77% (10) | |
| Weekly TV hours | 14 [10; 18] | 16 [11; 18] | 0.64 |
| Weekly breakfast frequency: 2–3 days a week | 5% (2) | 7% (1) | 0.356 |
| 3–4 days a week | 2% (1) | 14% (2) | |
| every day | 77% (33) | 64% (9) | |
| never | 16% (7) | 14% (2) | |
| Daily fruit servings: 1 | 67% (29) | 43% (6) | 0.23 |
| 2 | 26% (11) | 43% (6) | |
| 3 | 0% (0) | 7% (1) | |
| 4 | 5% (2) | 7% (1) | |
| more than 4 | 2% (1) | 0% (0) | |
| Daily vegetables servings: 1 | 74% (32) | 79% (11) | 0.785 |
| 2 | 12% (5) | 14% (2) | |
| no one | 14% (6) | 7% (1) | |
| Mother’s BMI | 22.04 [19.56; 24.80] | 21 [18; 24] | 0.714 |
| Father’s BMI | 26.32 [24.03; 28.37] | 26 [22; 27] | 0.344 |
| IBAI | 10.00 [6.50; 16.00] | 15 [9; 20] | 0.147 |
4Discussion
The aim of the OBEY-AD study is to understand the influence of non-traditional factors on obesity development. Particularly, in the present study we tested the effect of TV and TV advertising exposure on children’s energy intake in an afternoon snacking occasion.
Food is one of the most often advertised products in kids’ TV channels worldwide [18]. The effect of food advertising on children food behaviour have been already assessed in several studies which have found out an effect of TV on children’s food consumption patterns [19, 20] and on food preferences [21], demonstrating that children are more likely to choose advertised food (referring especially to junk food).
Results of the present study showed no significant association between caloric intake and TV viewing/TV advertising exposure in the studied sample of Georgian children. However, data about the association between TV exposure and caloric intake are controversial. These results are consistent with those emerged from similar experimental studies conducted in a sample of South American [22] and Indian [23] children, showing no effect of TV viewing and TV advertising on energy intake. Conversely, non-experimental studies have suggested a significant impact of TV viewing and food advertising on caloric intake [4, 5].
Such differences could be related to the different study design employed, but also to the specific history of this country (a post-Soviet nation which is going through a great economic development after a severe collapse due to the fall of the URSS and of the corresponding Soviet economic model) that consequently influences (differently from the other countries in which these studies were previously conducted) the lifestyle of population living in this geographical area.
The choice of an experimental ad libitum model for the research on the obesogenic environment allowed for the investigation of subject’s self-regulation mechanisms of food intake, according with individual preferences and behavioural patterns [24]. Furthermore, we focused on an afternoon snacking occasion which is not widely investigated and discussed in literature. However, it would be of interest to investigate what type of food children have in this snacking occasion, the caloric intake and, consequently, its impact on subsequent meal (dinner).
Some limits could be identified in our study. First, the study consists of an experimental session and, consequently, should be transposed in a real-life setting, but, performing an experiment minimizes risk of bias (which, otherwise, could make the power lower than those of this study). Additionally, children couldn’t choose the snack because it was defined a priori in a way that it was adequate to study’s objectives. Further studies might be conducted presenting a wide variety of snacks in order to assess also children’s preferences. Finally, children could be aware of the fact that they were participating to an experiment regarding food/body weight because they were in a room, being observed by the study investigator and this factor could inhibit children’s behaviours. However, this bias was not more likely to occur in a specific group of children than in the other, so, probably, if it occurred, it affected children’s groups equally.
Results of the present study showed no association of TV viewing and TV advertising with energy intake in a sample of Georgian children examined in an experimental setting. Further researches are needed, taking into account socio-economic characteristics of the country in which the study took place because, from a public health point of view, effective interventions to improve health and nutritional status need to be culturally appropriate and implemented at the levels of the individuals, families, and communities.
Conflict of interest
The authors report no conflicts of interest. The authors alone are responsible for the content and writing of the paper.
Acknowledgments
Study was supported by an unrestricted grant of Prochild Onlus (www.prochild.eu).
References
[1] | WHO. Global Strategy on Diet, Physical Activity and Health. (2012) . |
[2] | Strauss R . Childhood obesity and self-esteem. Pediatrics. (2000) ;105: (1):15. |
[3] | Stillman S . Health and nutrition in Eastern Europe and the former Soviet Union during the decade of transition: A review of the literature. Economics and Human Biology. (2006) ;4: (1):104–46. |
[4] | Utter J , Scragg R , Schaaf D . Associations between television viewing and consumption of commonly advertised foods among New Zealand children and young adolescents. Public Health Nutrition. (2006) ;9: (5):606–12. |
[5] | Wiecha JL , Peterson KE , Ludwig DS , Kim J , Sobol A , Gortmaker SL . When children eat what they watch: Impact of television viewing on dietary intake in youth. Archives of Pediatrics & Adolescent Medicine. (2006) ;160: (4):436–42. |
[6] | Caroli M , Argentieri L , Cardone M , Masi A . Role of television in childhood obesity prevention. Int J Obes Relat Metab Disord. (2004) ;28: (3):104–8. |
[7] | Coon KA , Tucker KL . Television and children’s consumption patterns. A review of the literature. Minerva Pediatr. (2002) ;54: (5):423–36. |
[8] | Huffman SK , Rizov M . Determinants of obesity in transition economies: The case of Russia. Economics and Human Biology. (2007) ;5: (3):379–91. |
[9] | Mebonia N , Trapaidze D , Kvanchakhadze R , Zhizhilashvili S , Kasradze N . Dietary habits of school-age children in Tbilisi. Georgian Medical News. (2015) (248):68–73. |
[10] | Kherkheulidze M , Nemsadze K , Kavlashvili N , Kandelaki E , Adamia N . The parameters of physical growth in 5-6 years old children in Tbilisi. Georgian Medical News. (2010) ;178: :52–60. |
[11] | Kharabadze M , Betaneli M , Khetsuriani R , Rainauli Z , Khutsishvili L . Child and adolescent body mass index data according to who new child growth standards in Georgia (Kakheti region). Georgian Medical News. (2012) ;(211):55–9. |
[12] | Francis LA , Birch LL . Does eating during television viewing affect preschool children’s intake? J Am Diet Assoc (2006) ;106: (4):598–600. |
[13] | Harris JL , Bargh JA , Brownell KD . Priming effects of television food advertising on eating behavior. Health Psychol. (2006) ;28: (4):404–13. |
[14] | Kuczmarski RJ, Ogden CL, Grummer-Strawn LM, Flegal KM, Guo SS, Wei R, et al. CDC growth charts: United States. Advance data. (2000) ;(314):1–27. |
[15] | Vecchio MG , Rtskhladze IL , Lorenzoni G , Zangurashvili L , Kankia N , Lomidze M , et al. Measuring Brand Awareness as a Component of Eating Habits in Children: The development of the IBAI questionnaire in Georgia. Accepted, Mediterranean Journal of Nutrition and Metabolism. (2017) . |
[16] | Vecchio MG , Ghidina M , Gulati A , Berchialla P , Paramesh EC , Gregori D . Measuring brand awareness as a component of eating habits in Indian children: The development of the IBAI questionnaire. The Indian Journal of Pediatrics. (2014) ;81: (1):23–9. |
[17] | Dean CB , Nielsen JD . Generalized linear mixed models: A review and some extensions. Lifetime. (2007) ;13: (4):497–512. |
[18] | Kelly B , Halford JC , Boyland EJ , Chapman K , Bautista-Castaño I , Berg C , et al. Television food advertising to children: A global perspective. American Journal of Public Health. (2010) ;100: (9):1730–6. |
[19] | Hastings G , Stead M , McDermott L . Review of the Research on the Effects of Food Promotion to Children. London: Food Standards Agency; (2003) . |
[20] | Ofcom. Child obesity: Food advertising in context. London. (2004) . |
[21] | Story M , French S . Food Advertising and Marketing Directed at Children and Adolescents in the US. Int J Behav Nutr Phys Act. (2004) ;1: (1):3. |
[22] | Gregori D , Ballali S , Gafare CE , Casella A , Stefanini G , de Sousa Alves R , et al. Investigating the obesogenic effects of marketing snacks with toys: An experimental study in Latin America. Nutrition Journal. (2013) ;12: (1):95. |
[23] | Gregori D , Gulati A , Hochdorn A , Ballali S , Paramesh H , Kumar M , et al. Food packaged with toys: An investigation on potential obesogenic effects in Indian children. The Indian Journal of Pediatrics. (2014) ;81: (1):30–8. |
[24] | Anschutz DJ , Engels RC , Van Strien T . Side effects of television food commercials on concurrent nonadvertised sweet snack food intakes in young children. Am J Clin Nutr. (2009) ;89: (5):1328–33. |


