
Distribution of obesity phenotypes and in a population-based sample of Iranian adults
Abstract
BACKGROUND AND AIM: Obesity is a major risk factor for type 2 diabetes mellitus and cardiovascular disease (CVD). Little is known about the metabolic profile across categories of body mass index (BMI), particularly within Asian populations. We assessed the prevalence and distribution of body size phenotypes among Iranian adults from a representative sample from Mashhad.
METHOD: The Mashhad Stroke Heart Atherosclerosis Disorder (MASHAD) study cohort of 9761 adults (3903 men) aged 35–65 years were cross-categorized by BMI and metabolic status into: normal-weight metabolically healthy (NWMH), normal-weight metabolically abnormal (NWMA), overweight metabolically healthy (OvMH), overweight metabolically abnormal (OvMA), obese metabolically healthy (OMH) and obese metabolically abnormal (OMA). Metabolic normality/abnormality was defined by the presence of any two of the following: 1) elevated blood pressure or known hypertension on treatment, 2) high serum fasted triglycerides; 3) low serum HDL-cholesterol, 4) high blood glucose or the presence of diabetes mellitus, 5) serum CRP >90th percentile.
RESULTS: The distribution of obesity phenotypes was 11.6% (NWMH), 15.6% (NWMA), 10.6% (OvMH), 31.3% (OvMA), 4.9% (OMH), and 25.5% (OMA) overall. Equivalent figures were 13.1%, 24.0%, 7.7% 37.3%, 1.5% and 16.2% in men; 10.7%, 10.2%, 12.5%, 27.4%, 7.2% and 31.8% in women, p < 0.001 for gender differences. Multi variables logistic regression models comprising age gender and each of the metabolic factors was associated with 3.2% to 5.3% variations in BMI categories.
CONCLUSION: The present study showed that a considerable proportion normal-weight Iranians display cardiometabolic abnormalities especially men, while a significant percentage of obese individuals, particularly women are metabolically healthy.
1Introduction
Obesity is associated with an altered metabolic profile, and is a major risk factor for type 2 diabetes mellitus and other cardiovascular disease (CVD) risk factors including hypertension, dyslipidemia and pro-inflammatory states [1]. About 52% of the worldwide adult population is either overweight or obese [2]. Differences are seen in metabolic and CVD risk factors among individuals of similar body mass index (BMI), and recent studies have shown that an individuals’ CVD risk may depend both on their body size and metabolic profile [3]. Therefore, it has been suggested that disease risks associated with obesity may not be consistently found.
One subgroup of obese individuals have been identified who appear to be resistant to the development of the adiposity-associated metabolic abnormalities (metabolically healthy obesity (MHO)) and might be at lower risk of CVD or all-cause mortality [4, 5]. A further ‘obesity’ phenotype includes individuals of normal weight, who have metabolic abnormalities, commonly found in overweight and obese individuals [1, 3]. Concepts such as “metabolically healthy” and “metabolically abnormal” have been used to characterize individuals across the distribution of body mass index (BMI) as a function of the underlying burden of metabolic abnormalities.
The prevalence of MHO differs significantly with respect to the obesity definition and the criteria used to define metabolic health. The lowest prevalence of metabolically healthy obesity (6%) was reported in Americans aged 18–65 using HOMA-IR and the Adult Treatment Panel-III criteria [10], while the highest (75%) was found in British people aged ≥20 based on blood pressure, total cholesterol and type 2 diabetes [6]. Few studies have examined the frequencies of various obesity phenotypes by ethnicity, and have reported slightly a higher prevalence estimates in Asian populations compared with non-Asians [5]. Despite the increasing prevalence of obesity in Asian populations, an evaluation of the above-mentioned body size phenotypes have not been reported especially in Middle East countries. Therefore, we studied a representative sample of Iranian adults in order to asses Distribution of obesity phenotypes.
2Materials and methods
The Mashhad Stroke Heart Atherosclerosis Disorder (MASHAD) is an ongoing urban population-based, observational cohort study that was initiated by investigators of Mashhad University of Medical Sciences, using a stratified-cluster random sampling method [7]. This cross-sectional study involved 8105 adults (3142 being men) aged 35–65 years. The age range of participants was 35 and 64 years and none had a history of cardiovascular event, heart failure, peripheral vascular disease including transient ischemic attack or amaurosis fugax, or a history of any previous cardiovascular intervention or surgery. Individuals with any major comorbidity such as cancer, autoimmune, infectious and inflammatory diseases were excluded. The study protocol was approved by the Ethical Committee in Research of Mashhad University of Medical Sciences and conformed to the principles outlined in the declaration of Helsinki, and all study participants provided a written informedconsent [8].
2.1Measurement of anthropometric and cardiometabolic components
For all individuals, anthropometric parameters including weight, height, and waist circumference were measured using standard protocols [9]. Fasting blood samples (after an overnight fast) were collected from each subject, then centrifuged for 15 minutes to obtain serum. Sera were kept at –80°C until they were analysed. Blood pressure was measured using a mercury sphygmomanometer calibrated by the Iranian Institute of Standards and Industrial Research; with Korotkoff phase 1 and phase 5 sounds characterising the systolic (SBP) and diastolic blood pressure (DBP) respectively. Fasting blood glucose and lipid profile were measured using an auto-analyzer (Ependorf, Germany). Biochemical analysis comprising serum total cholesterol (TC), triglycerides (TGs) and HDL-C, were determined using enzymatic based methods (Pars Azmon Inc., Iran). Low-density lipoprotein cholesterol (LDL-C) was calculated from the serum total cholesterol (TC), triglycerides (TGs), and high density lipoprotein cholesterol (HDL-C) concentrations expressed in mg/dl using the Friedewald formula. hs-CRP was measured by using an auto-analyzer (Eppendorf, Germany) [10]. A current smoker was defined as smoking cigarettes at least once a day. A non-smoker was defined as an individual who had never smoked previously.
2.2Body size phenotype definitions
Body mass index (BMI) was calculated as weight (kg)/height*height (m2). BMI was used to classify participants into three categories: normal weight (BMI < 25 kg/m2), overweight (BMI≥25 kg/m2 and BMI < 30 kg/m2) and obese (BMI≥30 kg/m2). There is no consensus on the definition and number of cardio-metabolic abnormalities to use when characterizing obesity phenotypes [5]. In the current study, we considered the following four abnormalities: 1) elevated BP determined using the average of the 2nd and 3rd BP measurements (systolic BP≥130 mmHg or diastolic BP≥85 mmHg or known hypertension on treatment), 2) high triglycerides (≥1.69 mmol/L); 3) low high-density lipoprotein cholesterol (HDL-c C≤1.0 mmol/L in men; ≤1.3 mmol/L in women), 4) high blood glucose [fasting plasma glucose (FPG) ≥5.6 mmol/L or known diabetes mellitus], 5) CRP > 0.1 mg/L (ie, the 90th percentile) [3].
Participants were then classified for metabolic status as “metabolically healthy” if they had none or one metabolic abnormality, and as “metabolically abnormal” if they had two or more metabolic abnormalities. Cross-classification of participants by BMI and metabolic status led to the following six phenotypes: 1) normal weight and metabolically healthy (NWMH), 2) normal weight and metabolically abnormal (NWMA), 3) overweight and metabolically healthy (OvMH), 4) overweight and metabolically abnormal (OvMA), 5) obese and metabolically healthy (OMH), and 6) obese and metabolically abnormal (OMA).
2.3Statistical analysis
Data are expressed as mean±SD for normally distributed variables and median and 25th-75th percentiles for skewed variables. Comparison of baseline characteristics across BMI categories, by metabolic status were done using chi-square tests, fisher-exact test, t-tests or Kruskal-wallis tests or Analysis of Variance test (ANOVA) where appropriate. The linear trends across BMI categories overall and separately for metabolically healthy and metabolically abnormal participants were tested via Cochran-Artmitage trend tests, and Brown-Forsythe Levene procedures. Two-ways interactions between BMI categories and metabolic status and metabolic status were tested, BMI categories, and metabolic status. To assess the association between each continuous metabolic trait and BMI categories, multinomial logistic regressions models (age and sex adjusted) were used to derive the odds ratio (OR) and 95% confidence interval for a unit higher level of each metabolic trait in relation with overweight and obesity risk, always using normal weight are reference category. The McFadden’s R2 [11] was then used as a measure of the overall performance of models containing age, gender, and each metabolic trait of interest. A two-sided p-value <0.05 was used to define statistical significance. All analyses were conducted using the Statistical Package for Social Sciences (SSPS Inc., Chicago, IL) version 17.0software.
3Results
3.1Socio-demographic characteristics
The mean±standard deviation of age was 48.10±8.24 years overall, 48.83±8.43 years in men, and 47.60±8.08 years in women (p < 0.001). As shown in Table 1, 36.6% of participants were employed with a lower proportion in women (12.1%) than in men (73.4%) (p < 0.001). Most of the participants (93.1%) were married with similar rates in men and women (98.7% vs. 89.4%, p = 0.065). Current smoking was more prevalent in men than in women (28.7% vs. 18%, p < 0.001).
3.2Profile of cardio-metabolic abnormalities
The Median of BMI was 24.69 kg/m2 overall with significantly lower levels in men compared with women (26.34 kg/m2 vs. 28.72 kg/m2, p < 0.001). Overall, 27.4% of participants had normal BMI levels while 42.1% were overweight and 30.5% obese with significant differences by gender (p < 0.001). Women compared to men had larger Waist circumference (96.07 cm vs. 93.34 cm, p < 0.001), higher Hip circumference (105.39 cm vs. 100.94 cm, p < 0.001), serum total cholesterol levels (194.44 vs. 186.79 mg/dl, p = 0.009), fasting blood glucose (93.65vs. 91.11 mg/dl, p < 0.001) and serum Hs-C-reactive protein (4.72 vs. 3.77 mg/l, p < 0.001). However, they had lower levels of serum triglycerides (117.2 vs. 124.7 mg/dl, p < 0.001), systolic BP (121.41 vs. 122.38 mmHg, p < 0.001) and diastolic BP (78.51 vs. 80.03 mmHg, p < 0.001). Furthermore, HDL-cholesterol level (44.86 vs. 39.86 mg/dl, p < 0.001) was higher in women than men. The prevalence of hypertension and diabetes were similar in men and women (both p > 0.090), Table 1.
3.3Distribution of body size phenotypes
The distribution of obesity phenotypes was 11.6% (NWMH), 15.6% (NWMA), 10.6% (OvMH), 31.3% (OvMA), 4.9% (OMH), and 25.5% (OMA). In men, the majority (37.3%) were OvMA, over a quarter (24.0%) were NWMA, while others fell into the other categories: 13.1% (NWMH), 7.7% (OvMH), 1.5% (OMH), and 16.2% (OMA). Moreover, the distribution of body size phenotype in women was as follows: 10.7% (NWMH), 10.2% (NWMA), 12.5% (OvMH), 27.4% (OvMA), 7.2% (OMH), and 31.8% (OMA). There was statistically significant interaction by gender in the distribution of body size phenotypes (p-interaction <0.001) (Fig. 1).
3.4Distribution of Metabolic Phenotypes within and Across BMI Categories
Within BMI categories, in addition to the expected differences in the levels of cardio-metabolic risk factors, participants with metabolically abnormal phenotypes tended to be older (all p < 0.001) and retired. Furthermore, metabolically abnormal participants were likely to be men (all p < 0.001). Age across BMI categories increased linearly overall (p < 0.001 for linear trend), but not in metabolically healthy and metabolically abnormal participants taken separately (both linear trend p > 0.536), with evidence of statistical interaction (both BMI categories and metabolic status (B*M), and metabolic status and gender (M*G) interaction, p < 0.001). The proportion of current smokers decreased linearly overall across increasing BMI categories (p < 0.001 for linear trend), and within both metabolic phenotype groups (both p-trend ≤0.036), with statistical interaction (both B*M and M*G interactions p < 0.001), Table 2. Mean waist and hip circumference, TG, Hs-C-reactive protein, SBP, DBP and LDL-C levels across BMI categories increased significantly overall and within the metabolic phenotype groups (all p-trend <0.001), with evidence of statistical interaction (all p-interaction <0.001).
3.5Prediction of body mass index categories by the continuous metabolic traits
In multinomial logistic regression models, mutually adjusted for each other and using normal weight as a reference, male sex was associated with 52% (95% confidence interval: 45–59%) lower odds of being overweight and 80% (75–83%) lower odds of obesity; while each year of increase in age was associated with 1% (0–3%) higher odds of obesity and a non-significant effect on overweight. The McFadden R2 for the overall performance of this basic model was 0.031. In the presence of age and sex, all metabolic traits for both overweight and obesity were significantly associated with odds of overweight and obesity (Table 3). The direction of the effect with increasing metabolic traits levels was always positive, except for HDL-cholesterol where increasing levels were associated with decreasing odds of overweight and obesity. The R2 for the resulting models ranged from 0.032 for the model containing HDL-c to 0.053 for the model containing diastolic blood pressure.
4Discussion
The main findings of present study are the following:
1) Over half of normal weight adults in this population (representing nearly 16% of the total sample) were metabolically abnormal, while one in six obese participants (representing 5% of the total sample) was metabolically healthy;
2) Metabolically abnormal normal weight people were more likely to be men, while metabolically health obese participants were more likely to be women, resulting in significant gender differences in the distribution of body size phenotypes;
3) Within BMI categories, in addition to the expected differences in the levels of cardio-metabolic risk factors, participants with metabolically abnormal phenotypes tended to be older and retired;
4) Lastly, multivariable logistic regression models containing age, gender and each of the metabolic factors explained between 3–5% of variations in BMI categories.
Swati Bhardwaj et al. have evaluated he features of obesity metabolic syndrome among South Asian people [12]. They reported that several phenotypic features contribute to metabolic syndrome in South Asians: despite lower average BMI values, South Asians had a higher percent of body fat compared to Caucasians or Blacks. Moreover, morbidities related to higher body fat including diabetes, hypertension and dyslipidemia are found more commonly at lower BMI levels in Asians than in Caucasians. Mbanya et al. have reported that a total of 25.2% of Cameroonian participants were overweight yet metabolically healthy and 10.1% were obese but metabolically healthy, whereas 1.4% were normal weight but metabolically abnormal [1]. They also reported that metabolically abnormal participants increase linearly across BMI categories. Geetha etal. investigated the prevalence of obesity phenotypes in Asian Indians [13] and reported that the prevalence of the MHO subtype was 13.3%, which was higher than was reported for a Caucasian study (8.1%) [14]. Furthermore, 47.3% of their obese subjects had a healthy metabolic status, which is similar to that reported for a Korean population cohort [13, 15].
There is increasing evidence to suggest that subclinical inflammation may be the underlying mechanism that determines whether or not an individual is MHO [17, 18]. CRP was measured in this study, and used as one of the criteria for defining metabolic normality. In adults, a MHO phenotype is associated with low levels of CRP, supporting the view that these individuals have an inflammatory profile that is more likely to be normal compared to non-MHO subjects [17, 20, 21]. We found higher BMI, waist circumference, hip circumference and and Hs-C-reactive protein in women as well as higher percentages of metabolically healthy obesity in this gender [1, 22]. However it has been reported that the relationship between gender and the distribution of obesity phenotypes remains unclear [23–25].
5Limitations
Our study has some limitations. Whilst the population sample was representative of the population in Mashhad it may not be representative of the entire Iranian population. The definition of obesity phenotypes has not been standardized, hence the prevalence estimates are subject to alteration depending on the number of metabolic abnormalities considered and the specific cut points of those abnormalities. This would need to be related to clinical outcomes, such as CVD endpoints and the incidence of diabetes mellitus. This may be addressed in the future by the MASHAD study cohort. The use of BMI as a measure of obesity has its limitations because it cannot distinguish between fat tissue and lean tissue. Waist circumference may be better marker for visceral adipose tissue mass, or using body analyzer data to distinguish between fat and lean tissue. Another limitation was the cross-sectional design of our study, which precludes appropriate investigation and causal attribution. Despite the aforementioned limitations, our study is the first of its kind in Iranian populations on obesity phenotypes, with a large number subjects, and a range of metabolic measures.
In conclusion, the present study shows that a considerable proportion of adult Iranians with normal-weight display cardiometabolic abnormality especially in men, while significant percentage of obese individuals and particularly women are also metabolically healthy. Larger and longitudinal studies, including behavioral, hormonal or biochemical assessments can be helpful to improve health screening while incorporating the possible role of subtype of obesity phenotype in conferring risks of cardiovascular diseases.
Conflict of interest
The authors have no conflict of interest
REFERENCES
[1] | Mbanya VN , Echouffo-Tcheugui JB , Akhtar H , Mbanya J-C , Kengne AP . Obesity phenotypes in urban and rural Cameroonians:A cross-sectional study. Diabetology & Metabolic Syndrome. (2015) ;7: (1):21. |
[2] | WHO. Global status report on noncommunicable diseases Geneva: (2014) . |
[3] | Wildman RP , Muntner P , Reynolds K , McGinn AP , Rajpathak S , Wylie-Rosett J , et al. The obese without cardiometabolic risk factor clustering and the normal weight with cardiometabolic risk factor clustering: Prevalence and correlates of 2 phenotypes among the US population (NHANES -Archives of Internal Medicine (2008) ;168: (15):1617–24. |
[4] | Phillips CM . Metabolically healthy obesity: Definitions, determinants and clinical implications. Rev Endocr Metab Disord. (2013) ;14: (3):219–27. |
[5] | Rey-López J , Rezende L , Pastor-Valero M , Tess B . The prevalence of metabolically healthy obesity: A systematic review and critical evaluation of the definitions used. Obesity Reviews. (2014) ;15: (10):781–90. |
[6] | Ul-Haq Z , Mackay DF , Fenwick E , Pell JP . Impact of metabolic comorbidity on the association between body mass index and health-related quality of life: A Scotland-wide cross-sectional study of 5,608 participants. BMC Public Health. (2012) ;12: (1):1. |
[7] | Ghayour-Mobarhan M , Moohebati M , Esmaily H , Ebrahimi M , Parizadeh SM , Heidari-Bakavoli AR , et al. Mashhad stroke and heart atherosclerotic disorder (MASHAD) study: Design, baseline characteristics and 10-year cardiovascular risk estimation. International Journal of Public Health. (2015) ;60: (5):561–72. |
[8] | Mazidi M , Heidari-Bakavoli A , Zadeh SK , Azarpazhoo MR , Nematy M , Safarian M , Esmaeili H , Parizadeh SMR , Ghayour-Mobarhan M , Kengne AP , Ferns GA . Dietary cholesterol, but not dietary fatty acid intake, varies with serum hs-CRP concentrations in individuals free of any history of cardiovascular disease. European Journal of Clinical Nutrition. (2016) . |
[9] | Kazemi-Bajestani SM , Azarpazhooh MR , Ebrahimi M , Vedadian P , Esmaeili H , Parizadeh SM , et al. Serum high sensitivity CRP concentrations predict the presence of carotid artery plaque in individuals without a history of cardiovascular events. Nutrition, metabolism, and cardiovascular diseases: NMCD. (2015) ;25: (4):434–5. |
[10] | Kelishadi R , Sharifi M , Khosravi A , Adeli K . Relationship Between C-Reactive Protein and Atherosclerotic Risk Factors and Oxidative Stress Markers Among Young Persons 10–18 Years Old. Clinical Chemistry. (2007) ;53: (3):456–64. |
[11] | McFadden DL . Conditional logit analysis of qualitative choice behavior. In Frontiers in Econometrics; Zarembka P. , Ed.; Academic Press: New York, NY, USA. (1973) ; pp. 105–42. |
[12] | Bhardwaj S , Misra A . Obesity, diabetes and the Asian phenotype. World Review of Nutrition and Dietetics. (2015) ;111: :116–22. |
[13] | Geetha L , Deepa M , Anjana RM , Mohan V . Prevalence and Clinical Profile of Metabolic Obesity and Phenotypic Obesity in Asian Indians. Journal of Diabetes Science and Technology. (2011) ;5: (2):439–46. |
[14] | Meigs JB , Wilson PW , Fox CS , Vasan RS , Nathan DM , Sullivan LM , et al. Body mass index, metabolic syndrome, and risk of type 2 diabetes or cardiovascular disease. The Journal of Clinical Endocrinology and Metabolism. (2006) ;91: (8):2906–12. |
[15] | Lee K . Metabolically obese but normal weight (MONW) and metabolically healthy but obese (MHO) phenotypes in Koreans: Characteristics and health behaviors. Asia Pacific Journal of Clinical Nutrition. (2009) ;18: (2):280–4. |
[16] | Bluher M . The distinction of metabolically ‘healthy’ from ‘unhealthy’ obese individuals. Current Opinion in Lipidology. (2010) ;21: (1):38–43. |
[17] | Munoz-Garach A , Cornejo-Pareja I , Tinahones FJ . Does Metabolically Healthy Obesity Exist? Nutrients. (2016) ;8: (6). |
[18] | Karelis AD , Rabasa-Lhoret R . Obesity: Can inflammatory status define metabolic health? Nature reviews Endocrinology (2013) ;9: (12):694–5. |
[19] | Sutherland JP , McKinley B , Eckel RH . The metabolic syndrome and inflammation. Metabolic Syndrome and Related Disorders. (2004) ;2: (2):82–104. |
[20] | Calori G , Lattuada G , Piemonti L , Garancini MP , Ragogna F , Villa M , et al. Prevalence, metabolic features, and prognosis of metabolically healthy obese Italian individuals: The Cremona Study. Diabetes Care. (2011) ;34: (1):210–5. |
[21] | Ogorodnikova AD , Kim M , McGinn AP , Muntner P , Khan U , Wildman RP . Incident cardiovascular disease events in metabolically benign obese individuals. Obesity (Silver Spring, Md). (2012) ;20: (3):651–9. |
[22] | Velho S , Paccaud F , Waeber G , Vollenweider P , Marques-Vidal P . Metabolically healthy obesity: Different prevalences using different criteria. European Journal of Clinical Nutrition. (2010) ;64: (10):1043–51. |
[23] | Lee K . Metabolically obese but normal weight (MONW) and metabolically healthy but obese (MHO) phenotypes in Koreans: Characteristics and health behaviors. Asia Pacific Journal of Clinical Nutrition. (2009) ;18: (2):280. |
[24] | Lopez-Garcia E , Guallar-Castillon P , Leon-Muñoz L , Rodriguez-Artalejo F . Prevalence and determinants of metabolically healthy obesity in Spain. Atherosclerosis. (2013) ;231: (1):152–7. |
[25] | Nguyen KA , Peer N , de Villiers A , Mukasa B , Matsha TE , Mills EJ , et al. The distribution of obesity phenotypes in HIV-infected african population. Nutrients. (2016) ;8: (6):299. |
Figures and Tables
Fig.1
Distribution of metabolic phenotypes across body mass index categories (overall, male and female). Each vertical bar represents the proportion of participants in the total sample, male and female with the corresponding combination of body size (normal-weight, overweight, or obese) and metabolic phenotype (healthy or abnormal).
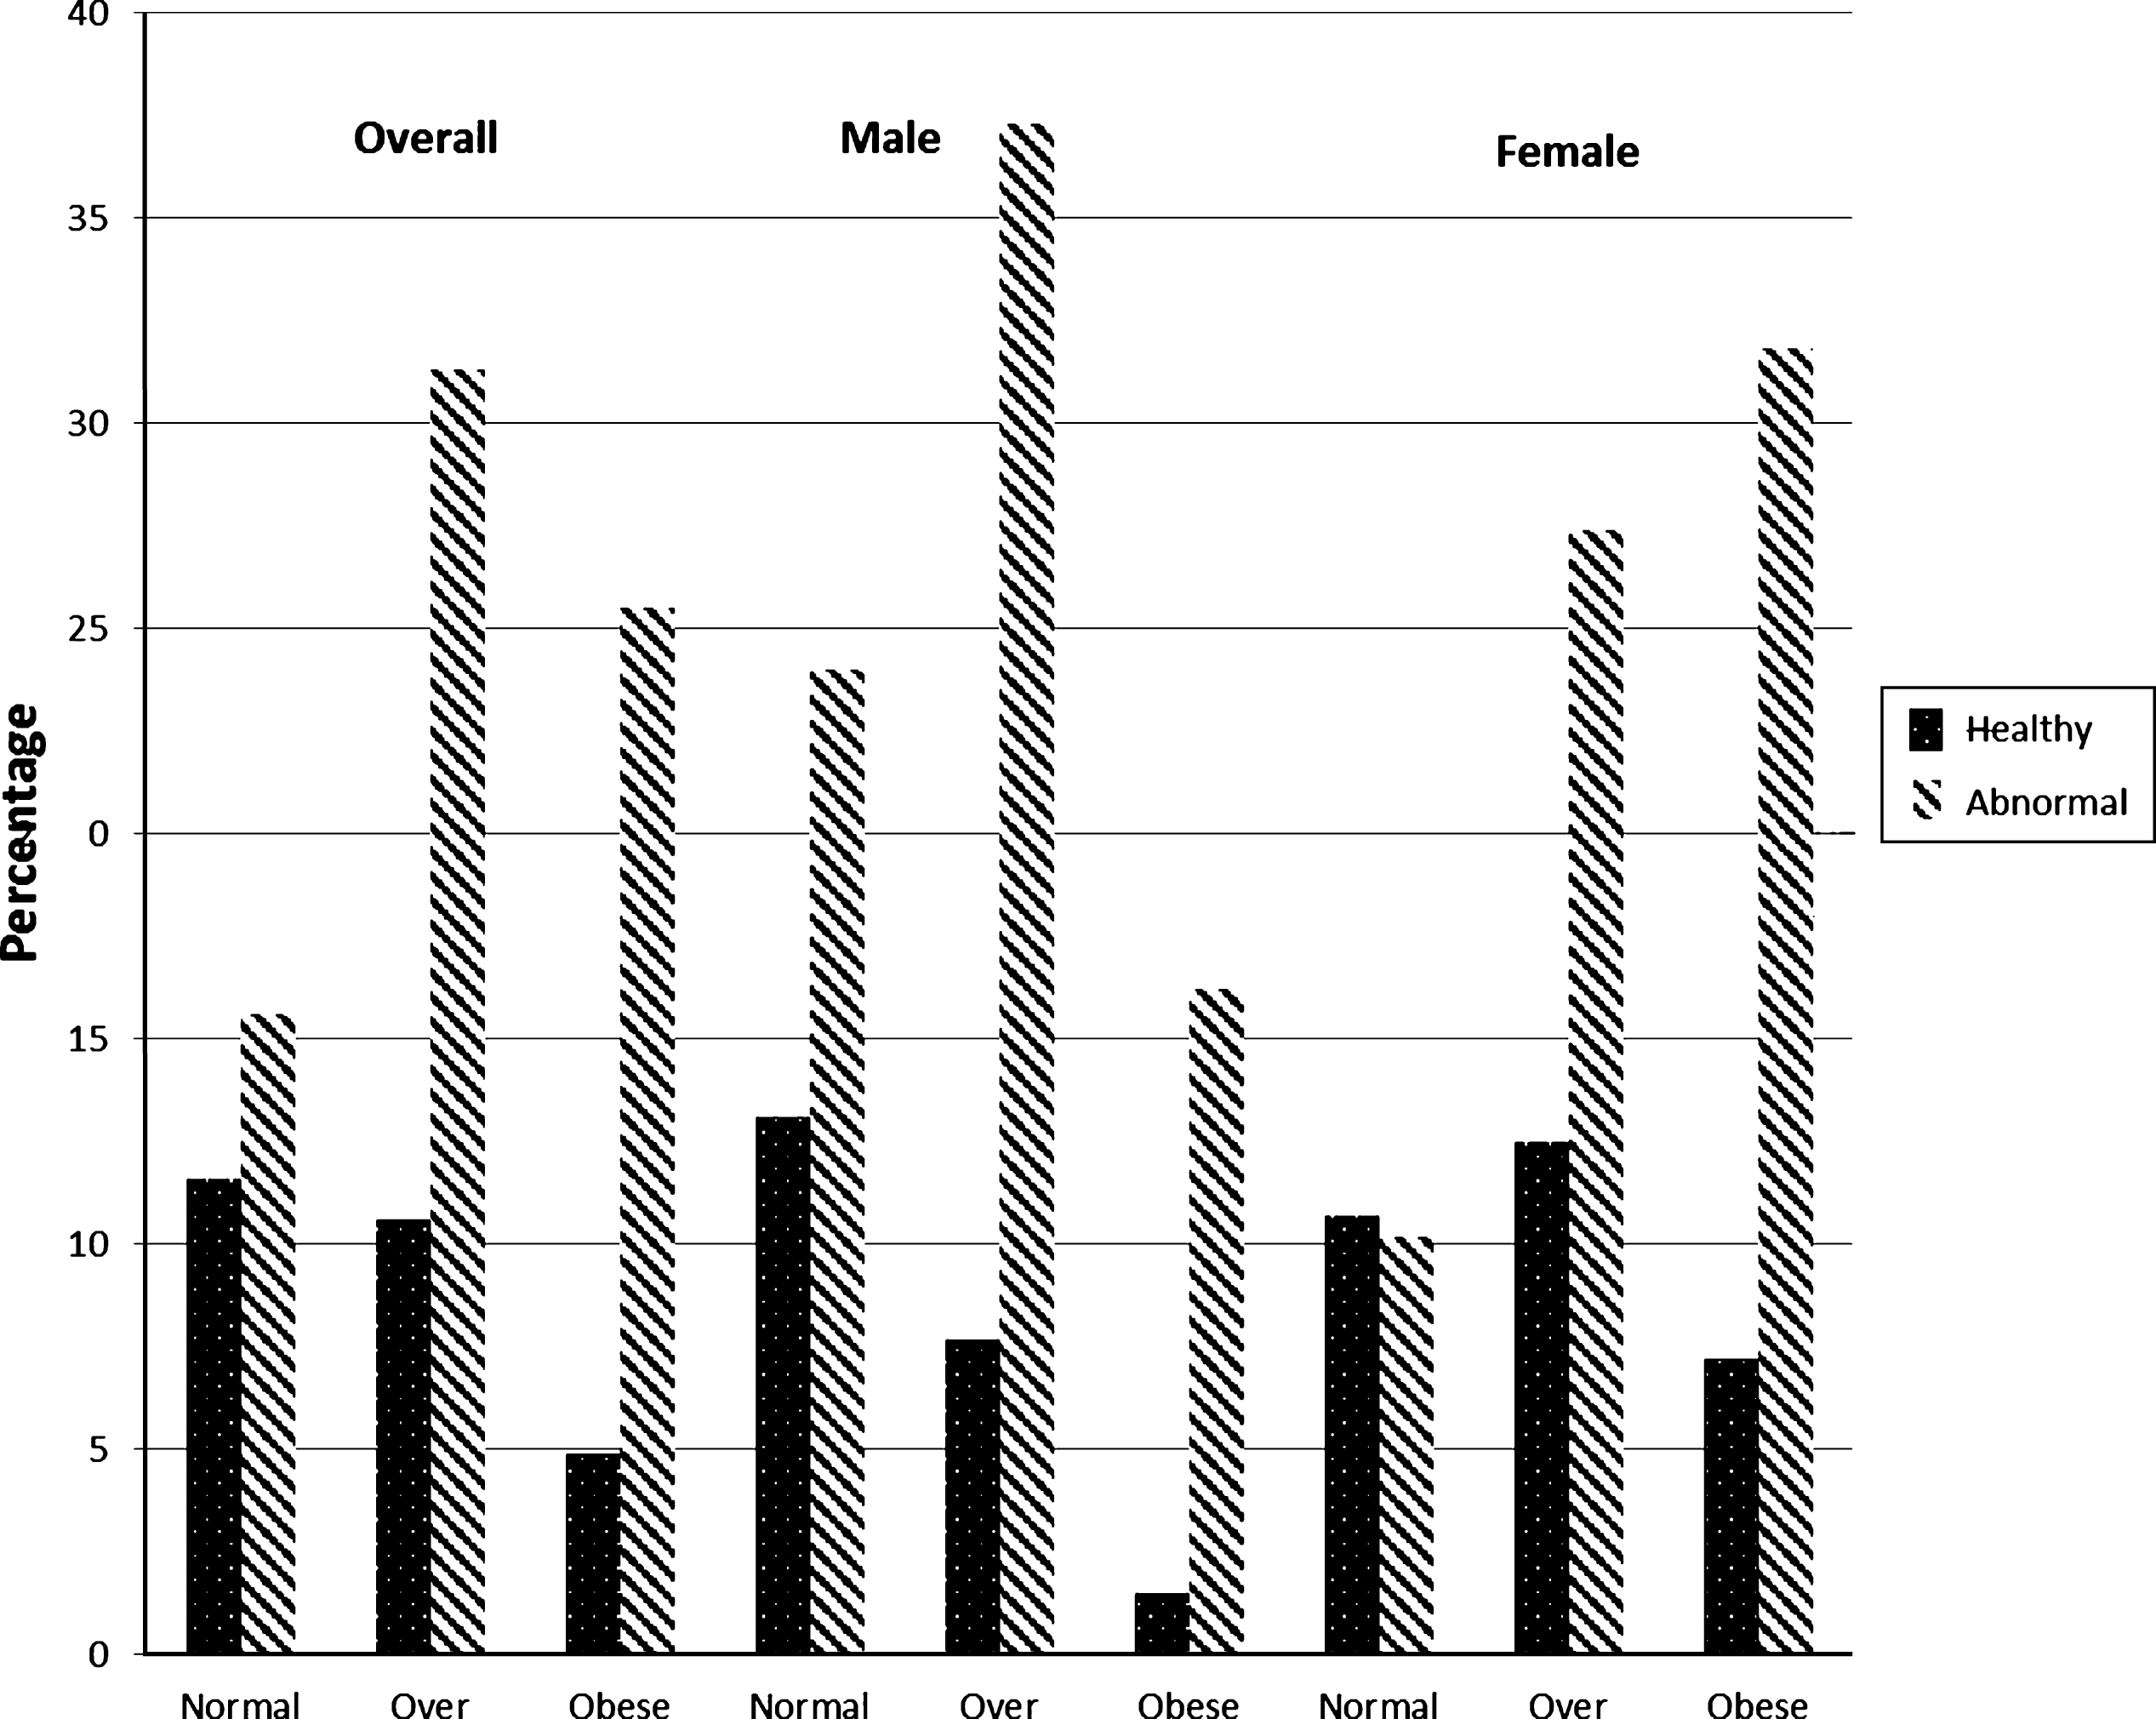
Table 1
Clinical, anthropometrical and socio-economical characteristics of population
| Measurements | Overall (n = 9761) | Men (n = 3903) | Women (n = 5858) | p-value |
| Age (years) | 48.10±8.24 | 48.83±8.43 | 47.60±8.08 | <0.001 |
| Body mass index (kg/m2) | ||||
| Median (P25-P75) | 24.69 (27.63–30.81) | 26.34 (23.54–28.93) | 28.72 (25.63–31.93) | <0.001 |
| <25, n (%) | 2667 (27.4) | 1447 (37.2) | 1220 (20.9) | <0.001 |
| 25.0–29.9, n (%) | 4096 (42.1) | 1754 (45.1) | 2342 (40.1) | |
| ≥30, n (%) | 2972 (30.5) | 688 (17.7) | 2284 (39.1) | |
| Demi span (cm) | 76.73±5.82 | 81.14±4.88 | 73.81±4.38 | <0.001 |
| Waist circumference (cm) | 94.98±12.71 | 93.34±12.17 | 96.07±12.95 | <0.001 |
| Hip circumference (cm) | 103.62±9.40 | 100.94±8.07 | 105.39±9.80 | <0.001 |
| Mid arm circumference (cm) | 30.43±4.91 | 30.10±5.01 | 30.65±4.84 | <0.001 |
| Fasting blood glucose (mg/dl) | 92.73±39.41 | 91.11±38.32 | 93.65±40.36 | <0.001 |
| Serum Total cholesterol (mg/dl) | 191.40±39.16 | 186.79±37.81 | 194.44±39.74 | <0.001 |
| Serum triglyceride (mg/dl) | 120.9 (85.0–172.1) | 124.7 (86.8–129.9) | 117.2 (83.8–167.6) | <0.001 |
| Serum HDL-cholesterol (mg/dl) | 42.87±9.39 | 39.86±9.27 | 44.86±9.86 | <0.001 |
| Serum LDL-cholesterol (mg/dl) | 116.30±35.87 | 113.20±35.15 | 118.35±36.20 | <0.001 |
| Serum Hs-C-reactive protein (mg/l) | 4.34±9.69 | 3.77±9.29 | 4.72±9.92 | <0.001 |
| Systolic blood pressure Systolic (mmHg) | 121.80±18.56 | 122.38±17.21 | 121.41±19.40 | <0.001 |
| Diastolic blood pressure (mmHg) | 79.12±11.35 | 80.03±10.76 | 78.51±11.70 | <0.001 |
| Current Smoking (%) | 2173(22.2) | 1120(28.7) | 1053 (18.0) | <0.001 |
| Hypertension n (%) | 2313 (23.6) | 953 (24.2) | 1360 (23.2) | 0.090 |
| Diabetes mellitus n (%) | 898 (9.2) | 348 (8.9) | 550 (9.4) | 0.225 |
| Marital Status n (%) | <0.001 | |||
| Single | 59 (0.6) | 19 (0.5) | 40 (0.7) | |
| Married | 9082 (93.1) | 3847 (98.7) | 5235 (89.4) | |
| Widowed | 474 (4.9) | 14 (0.4) | 460 (7.9) | |
| Divorced | 135 (1.4) | 17 (0.4) | 118 (2.0) | |
| Employment Status n (%) | <0.001 | |||
| Student | 22 (0.2) | 10 (0.3) | 12 (0.2) | |
| Employed | 3572 (36.6) | 2866 (73.4) | 706 (12.1) | |
| Un Employed | 5201 (53.3) | 320 (8.2) | 4881 (83.3) | |
| Retired | 951 (9.7) | 700 (17.9) | 251 (4.3) |
Values expressed as mean±standard deviation for normally distributed data, and median and 25th–75th percentiles for skewed variables. Between groups comparisons were assessed by parametric statistical analysis for normal distributed data and nonparametric test for data not following a normal distribution.
Table 2
Characteristics of
| BMI categories | Normal weight (N = 2667) | Overweight (N = 4096) | Obese (N = 2972) | P-trend | P-interaction | |||||||||
| Metabolic status | Healthy | Abnormal | p | Healthy | Abnormal | p | Healthy | Abnormal | p | Overall | Healthy | Abnormal | B*M | M*G |
| Prevalence, n (%) | 1136 (42.6) | 1531 (57.4) | 1035 (25.3) | 3061 (74.7) | 480 (16.2) | 2492 (83.8) | <0.001 | – | – | – | – | |||
| Men, n (%) | 511 (45.0) | 936 (61.1) | <0.001 | 300 (29.0) | 1454 (47.5) | <0.001 | 57 (11.9) | 631 (25.3) | <0.001 | <0.001 | <0.001 | <0.001 | <0.001 | – |
| Age (years) | 45.98±8.06 | 48.89±8.66 | <0.001 | 45.91±7.62 | 48.88±8.32 | <0.001 | 46.32±7.58 | 48.88±7.96 | <0.001 | <0.001 | 0.536 | 0.960 | <0.001 | <0.001 |
| Demi span (cm) | 76.92±6.19 | 77.95±5.53 | <0.001 | 76.10±5.25 | 77.36±5.85 | <0.001 | 74.74±5.17 | 75.72±5.85 | <0.001 | <0.001 | <0.001 | <0.001 | <0.001 | <0.001 |
| Waist circumference (cm) | 82.90±9.08 | 85.98±8.74 | <0.001 | 93.21±8.78 | 95.18±8.16 | <0.001 | 102.28±10.43 | 105.75±10.40 | <0.001 | <0.001 | <0.001 | <0.001 | <0.001 | <0.001 |
| Hip circumference (cm) | 94.87±5.61 | 95.48±5.96 | <0.001 | 103.11±5.32 | 102.44±5.71 | <0.001 | 112.20±8.37 | 112.67±8.40 | 0.269 | <0.001 | <0.001 | <0.001 | <0.001 | <0.001 |
| Mid arm circumference (cm) | 27.33±3.53 | 27.81±3.93 | <0.001 | 30.57±5.41 | 30.43±3.99 | 0.376 | 32.86±4.47 | 33.11±4.53 | 0.266 | <0.001 | <0.001 | <0.001 | <0.001 | <0.001 |
| Serum Total cholesterol (mg/dl) | 179.44±33.99 | 186.46±41.18 | <0.001 | 186.08±34.08 | 194.98±39.41 | <0.001 | 190.85±33.88 | 197.66±40.77 | <0.001 | <0.001 | <0.001 | <0.001 | <0.001 | <0.001 |
| Serum triglyceride | 79.8 | 114.5 | <0.001 | 92.8 | 146.2 | <0.001 | 98.2 | 149.1 | <0.001 | <0.001 | <0.001 | <0.001 | <0.001 | <0.001 |
| (mg/dl) | (64.3–102.1) | (79.6–167.4) | (69.9–116.2) | (101.8–199.6) | (77.4–123.6) | (107.8–202.3) | ||||||||
| Serum HDL-cholesterol (mg/dl) | 49.09±10.05 | 40.66±9.14 | <0.001 | 48.07±9.92 | 40.30±9.05 | <0.001 | 50.24±8.54 | 41.11±8.94 | <0.001 | <0.001 | 0.283 | 0.049 | <0.001 | <0.001 |
| Serum LDL-cholesterol (mg/dl) | 110.94±31.54 | 115.25±36.41 | <0.001 | 115.46±31.79 | 117.50±37.39 | <0.001 | 117.45±31.88 | 118.04±37.50 | 0.725 | <0.001 | <0.001 | 0.029 | <0.001 | <0.001 |
| Serum Hs-C-reactive protein (mg/l) | 1.81±5.88 | 3.99±8.99 | <0.001 | 2.27±5.47 | 4.34±9.68 | <0.001 | 3.68±8.40 | 6.69±12.23 | <0.001 | <0.001 | <0.001 | <0.001 | <0.001 | <0.001 |
| Systolic blood pressure (mmHg) | 111.21±12.62 | 120.55±18.16 | <0.001 | 112.97±12.72 | 125.02±18.72 | <0.001 | 115.62±14.57 | 128.26±19.64 | <0.001 | <0.001 | <0.001 | <0.001 | <0.001 | <0.001 |
| Diastolic blood pressure (mmHg) | 72.45±9.24 | 78.30±11.17 | <0.001 | 74.18±8.75 | 81.05±11.39 | <0.001 | 75.77±8.81 | 82.98±11.39 | <0.001 | <0.001 | <0.001 | <0.001 | <0.001 | <0.001 |
| Current Smoking (%) | 266(23.4) | 454(29.7) | <0.001 | 189(18.3) | 653(21.3) | <0.001 | 96(20.0) | 509(20.4) | <0.001 | <0.001 | 0.036 | <0.001 | <0.001 | <0.001 |
| Marital Status | <0.001 | 0.150 | <0.001 | <0.001 | <0.001 | |||||||||
| Single | 11(1.0) | 11(0.7) | 12(1.2) | 16(0.5) | 1(0.2) | 8(0.3) | ||||||||
| Married | 1057(93.1) | 1453(95.0) | 961(92.9) | 2857(93.4) | 444(92.7) | 2290(91.9) | ||||||||
| Widowed | 37(3.3) | 52(3.4) | 51(4.9) | 152(5.0) | 22(4.6) | 160(6.4) | ||||||||
| Divorced | 30(2.6) | 13(0.9) | 11(1.1) | 35(1.1) | 12(2.5) | 34(1.4) | ||||||||
| Employment Status | <0.001 | <0.001 | <0.001 | <0.001 | <0.001 | |||||||||
| Student | 1(0.1) | 2(0.1) | 7(0.7) | 8(0.3) | 1(0.2) | 4(0.2) | ||||||||
| Employed | 509(44.8) | 760(49.6) | 332(32.1) | 1219(39.8) | 99(20.6) | 641(25.7) | ||||||||
| Un Employed | 542(47.7) | 578(37.8) | 621(60.0) | 1448(47.3) | 360(75.0) | 1646(66.1) | ||||||||
| Retired | 83(7.3) | 189(12.3) | 75(7.2) | 381(12.4) | 20(4.2) | 201(8.1) | ||||||||
B: BMI categories, M: metabolic status, G: gender.
Table 3
Odds ratios (OR) and 95% confidence intervals (95% CI) from multinomial age and sex adjusted multinomial logistic regression models, showing the association of metabolic traits with body mass index categories
| Predictors | Normal Weight | Overweight | Obese | |||
| Reference | OR (95% CI) | p-Value | OR (95% CI) | p-Value | R2 | |
| Age | 1.00 | 1.00 (0.99–1.01) | 0.257 | 1.01 (1.00–1.03) | 0.002 | 0.031 |
| Sex, men | 1.00 | 0.48 (0.41–0.55) | <0.001 | 0.20 (0.17–0.25) | <0.001 | |
| Waist circumference (cm) | 1.00 | 1.14 (1.13–1.15) | < 0.001 | 1.30 (1.29–1.31) | < 0.001 | 0.284 |
| Hip circumference (cm) | 1.00 | 1.28 (1.26–1.30) | < 0.001 | 1.65 (1.62–1.68) | < 0.001 | 0.371 |
| Fasting blood glucose (mg/dl) | 1.00 | 1.00 (1.00-1.00) | < 0.001 | 1.00 (1.00-1.00) | < 0.001 | 0.033 |
| Serum Total cholesterol (mg/dl) | 1.00 | 1.02 (1.01-1.02) | <0.001 | 1.03 (1.02-1.03) | <0.001 | 0.036 |
| Serum triglyceride (mg/dl) | 1.00 | 1.00 (1.00-1.00) | <0.001 | 1.00 (1.00-1.00) | <0.001 | 0.053 |
| Serum HDL-cholesterol (mg/dl) | 1.00 | 0.97 (0.96-0.97) | <0.001 | 0.96 (0.95-0.96) | <0.001 | 0.039 |
| Serum LDL-cholesterol (mg/dl) | 1.00 | 1.05 (1.04–1.06) | <0.001 | 1.08 (1.06-1.09) | <0.001 | 0.032 |
| Serum Hs-C-reactive protein (mg/l) | 1.00 | 1.01 (1.00–1.02) | <0.001 | 1.03 (1.02–1.04) | <0.001 | 0.037 |
| Systolic blood pressure(mmHg) | 1.00 | 1.02 (1.01-1.02) | <0.001 | 1.03 (1.03-1.03) | <0.001 | 0.051 |
| Diastolic blood pressure (mmHg) | 1.00 | 1.03 (1.03-1.04) | <0.001 | 1.05 (1.05-1.06) | <0.001 | 0.053 |


