
A pilot study to investigate energy intake and food frequency among middle aged and elderly people in Mauritius
Abstract
Middle age is an important period of life whereby unhealthy eating habits may develop. In addition, during old age, certain transitions such as retirement may impact on eating habits and health. This study was undertaken to identify and characterize dietary patterns in the middle aged and elderly people and to assess different factors influencing energy intake. A total of 500 participants aged between 35–65 years old completed a self-reported questionnaire investigating the eating habits, Physical Activity Level (PAL), Nutrition Knowledge (NK) and BMI. A three 24-hour dietary recalls over three weeks were used to estimate energy intake (EI) of the participants. Statistical tests performed revealed that the mean energy intake was 1919.8 kcal which was lower than the recommended daily allowance. The mean BMI was 24.6 Kg/m2. Factors such as gender, snacking frequency and nutrition knowledge were found to influence the EI of the participants (p < 0.05). As far as eating habits are concerned, snacks rich in fat and sugar, sweetened beverages, carbohydrates and dairy products were the most consumed food items. Healthy food items such as dairy products were more frequently consumed by the middle and higher socio economic groups as compared to the low income earners. Based on the results of this study, it is not advisable to recommend an increase in energy intake among the middle aged and elderly Mauritians. However, basic nutrition knowledge should be imparted to middle aged and elderly people and an increase in physical activity level can be recommended.
1Introduction
Mauritius, a developing country in the Indian Ocean has registered a rise of 7.1% and 7.5% in the proportion of middle-aged and elderly people respectively [1]. This trend is consistent with other developing and developed countries [2]. With longer lifespan, the prevalence of overweight and obesity is on the rise [3] and this is associated with an increased risk of developing non-communicable diseases such as cardiovascular disease, diabetes and other chronic conditions [4]. In Mauritius, the incidence of obesity among middle aged individuals aged 20 to 49 years and 50–64 years was 17.6% and 18.6 % respectively [5]. This increase has been linked to a drastic change in eating habits coupled with sedentary lifestyle. There has been a shift towards consuming more foods from animal sources and most of the increases in such types of foods have been observed in low and middle income countries [6] such as India, China [7] and even Mauritius has adopted this trend. On the other hand, there has been a reduction in the intake of legumes, vegetables and coarse grains. This change was noted from 1960 s to 1980 s in the United States. Recently, this has been reported in Asia and other developing countries [8]. It is widely recognized that eating habits tend to differ among different age groups [9]. Eating habits can be affected by several factors, including marital status, socio economic status (SES), physical activity level (PAL), gender as well as nutrition knowledge (NK) [10]. Obesity can also be attributed to an energy imbalance, whereby energy intake exceeds energy expenditure [11]. The trend in energy intake varies among different countries with a rise in mean energy intakes reported in adults between 1976–1980 and 1985–1991 in the US [12]. However, the Nationwide Food Consumption Survey found a 7 % decline in energy intakes per person in 1994 than in 1977-1978 [13]. Similar results have been reported by the Food and Agriculture Organization of the United Nations [14]. Energy intake is influenced by several factors including socioeconomic status (SES), physical activity level (PAL), nutrition knowledge (NK), food accessibility and living arrangements. The financial status of an individual may restrict his food choices and hence, his eating habits and energy intake [15]. Socio economic inequalities in nutrient intakes have been widely reported [16]. Individuals with higher socio economic status generally have higher intakes of healthy foods such as whole grains, low fat dairy products and lower intakes of unhealthy foods with high fat content than those in low socio economic groups. Evidence suggests that people from high socio economic levels have lifestyles which can contribute to energy balance. However, this solely cannot explain the socioeconomic gradient in obesity [4]. Physical activity (PA) is one of the main factors influencing energy intake since it manipulates energy expenditure and hence, contributes to energy balance [18]. However, changes in lifestyle in transitional societies usually involve a decrease in physical activity levels [19]. According to the recent National NCD Survey 2015, only 23.7% of Mauritians (18.5% of women and 30.2% of men) undertake sufficient vigorous or moderate physical activity to meet the national guidelines [5]. However, Dunneram and Jeewon [10] reported that middle aged women are more likely to engage in a higher amount of vigorous physical activity than their younger counterparts. Nutritional Knowledge (NK) is a less commonly investigated factor which can equally influence the eating habits of older adults. In a study, middle aged women who had knowledge of fat nutrition were found to consume low fat diets [20]. Results from another study have also demonstrated that subjects with lower education consumed less fish but more fried foods, pasta, potatoes, table sugar and beer [7]. The calculation of energy intake is essential as it is a determinant of nutrient requirements and nutrient content of the diet [21]. Several studies on energy intake have used 24-hour dietary recalls and a food composition table to estimate the mean energy intakes of individuals in different populations [22]. Subsequently, in Mauritius there is an absence of data regarding the daily energy intake of middle aged and elderly people. Therefore, this study was proposed with the following objectives:
1. To determine the energy intake of middle aged and elderly people.
2. To investigate the relationships between BMI, physical activity level and energy intake among middle aged and elderly people.
3. To examine the factors influencing energy intake and dietary food habits of middle aged and elderly people.
2Materials and methods
2.1Sample size
Upon obtaining informed written and verbal consent (for phone interview of 24 hour daily recalls) from participants, a total of 500 Mauritian adults aged between 35 and 65 years old; generally healthy were recruited by random sampling technique. Approximately the same number of male (n = 244) and female (n = 256) respondents were selected. People under the age of 35 and physically and mentally disturbed people were excluded. Participants completed a self-reported questionnaire which consisted of sociodemographic variables and three questionnaires based on food frequency (FFQ), physical activity level (PAL) and nutrition knowledge (NK). Ethical approval was granted by Department of Health Sciences (University of Mauritius) research ethics committee.
2.2Sociodemographic variables
Information pertaining to sociodemographic data was related to age, gender, marital status, employment status, educational level and monthly household incomes. Age groups of adults were classified into three age groups: 35–50, 51–65 and above 65 years to cater for both middle aged and elderly individuals [23]. The household income was classified as follows (i) low income (less than $138 to $276) (ii) middle income ($277 to $830) and (iii) high income (above $830). Size of family, access to shops, supermarkets and food commodities was also evaluated.
2.3Food frequency questionnaire
The Food Frequency Questionnaire adapted from the Nutritional Epidemiology group at Leeds University [24] comprised of about 59 items classified under the headings: carbohydrates (grains & tubers), beans/pulses, meat and eggs, seafood, soybeans and products, dairy products, fruits, vegetables, processed foods, snacks high in fat and sugar and beverages. A modified version of this questionnaire has been used in lifestyle surveys in the North West and Yorkshire and Humber regions and has proved to be a practicable alternative for situations where long and labor intensive methods are unaffordable or unfeasible [25]. For each FFQ item, participants could select from 7 frequency categories and scores were allocated as shown in the Table 1 [26]. The FFQ does not elicit information about portion size. The respondents were asked to indicate the pattern and frequency of intake of these food items.
Table 1
Scores for different consumption frequencies
| Frequency | Score |
| Never or less than once per month | 0 |
| 2 times per month | 0.08 |
| Once per month | 0.033 |
| 1 time per week | 0.14 |
| 2-3 times per week | 0.5 |
| Once daily | 1 |
| 2-3 times daily | 2 |
2.4Physical activity level (PAL)
Questions for PAL were chosen from the shortened version of the self-reported International Physical Activity Questionnaire (IPAQ) which has been validated in several settings [27]. Frequency and duration of three types of physical activity were assessed: vigorous activity, moderate activity (excluding walking) and walking. PAL was calculated in metabolic equivalents (MET)—minute per week and categorized according to IPAQ system of scoring into low (<600 MET), moderate (600–1500 MET), and high (>1500) PAL as shown in Table 2 below [28].
Table 2
Criteria for classifying moderate and high physical activity
| Moderate physical activity | High physical activity | |
| Criteria | a) 3 or more days of vigorous-intensity activity of at least 20 minutes per day | a) vigorous-intensity activity on at least 3 days achieving a minimum total physical activity of at least 1500 MET-minutes/week |
| or | or | |
| b) 5 or more days of moderate-intensity activity and/or walking of at least 30 minutes per day | b) 7 or more days of any combination of walking, moderate-intensity or vigorous-intensity activities achieving a minimum total physical activity of at least 3000 MET-minutes/week. | |
| or | ||
| c) 5 or more days of any combination of walking, moderate-intensity or vigorous intensity activities achieving a minimum total physical activity of at least 600 MET-minutes/week |
2.5Nutrition knowledge
Questions on nutrition knowledge were adapted from the General Nutrition Knowledge Questionnaire (GNKQ) for adults [29] which has been previously validated and used to measure General Nutrition Knowledge (GNK) in a large community sample. Questions which were best related to the objectives of the study and the food items in the FFQ were chosen from the questionnaire. Some modifications in the food items in the original questionnaire were made to suit the Mauritian context. For example, baked beans were changed to pulses. Questions chosen were mostly related to sugar, protein, calorie and fat content. In addition, questions about the relationship between health diseases and nutrition were asked to evaluate the knowledge of the participants concerning the relationship between diet and diseases. A score of 1 was allocated for good answer and 0 for a wrong answer and for ‘don’t know” which was assessed on a total score of 30, whereby higher values on the score indicate higher [30].
2.6Anthropometric measurements
BMI of the respondents was calculated using the formula weight (in Kg) divided by square of height in meters. Measurements of height and weight were taken by the investigator using the same instruments to minimize occurrence of errors. The BMI was then calculated and classified as underweight, normal, overweight or obese according to the World Health Organization [31]. Waist and hip measurements were also taken.
2.7Dietary assessment using the 24-hour dietary recall method
A 24-hour dietary recall form was adapted from the EPIC-Norfolk nutritional methods [32]. This form asks for a record of all foods and beverages, including snacks taken over the previous day. The recall was performed with a subsample of 199 participants on a week day. To avoid bias, the recall was not performed if a participant was on special fasting regime or has attended any specific function where participants tend to over eat. Participants were followed for 3 days over 3 weeks. Different commonly available domestic utensils such as bowls, cups, tablespoons, teaspoons and glasses were shown to the participants on the first day of the recall to assist them in reporting the portion sizes of their meals. To overcome mis or under reporting problems, the respondents were prompted to remember eating and drinking episodes by time periods. The FFQ data and dietary recalls for the first day were collected simultaneously from the respondents. Two additional recalls were carried out. The energy intake of the participants was estimated, based on the three dietary recalls by using a Food Composition table, compiled mostly from the Tanzania Food Composition Table [33] Human Nutrition formerly The Heinz Handbook of Nutrition 3rd Edition by Benjamin Burton [34]. The mean energy intake for the three recalls for each participant was then calculated and used for statistical analyses.
2.8Statistical analysis
Statistical analyses were performed using Statistical Package for the Social Sciences (version 20.0). The alpha value was adjusted to 0.05 and it was assumed that the populations from which the samples were taken are normally distributed. Independent sample t-test was used to determine gender differences in energy intake while the influence of NK on eating habits was determined by using Pearson correlation. ANOVA was used for various statistical tests including, the relationship between BMI and food frequency.
3Results
3.1Socio demographic characteristics of participants
Table 3 shows the socio demographic characteristics of the 500 participants by age groups, gender, marital status, education level and employment status. The sample consisted of approximately equal number of males (48.8%) and females (51.2%). Out of the 500 respondents, 55% were in the age group 35–50, 33.6% were in the age group 51–65 while 11.4% were aged above 65 years. As shown in the Table 4 below, the majority of working participants were full time employed (60.4%) and 10.2% were unemployed.
Table 3
Socio demographic characteristics of participants
| Characteristics | n | % | |
| Age group (years) | 35–50 | 275 | 55.0 |
| 51–65 | 168 | 33.6 | |
| >65 | 57 | 11.4 | |
| Gender | Male | 244 | 48.8 |
| Female | 256 | 51.2 | |
| Marital status | Single | 53 | 10.6 |
| Married | 421 | 84.2 | |
| Separated | 3 | 0.6 | |
| Divorced | 3 | 0.6 | |
| Widowed | 20 | 4 | |
| Employment status | Full time | 302 | 60.4 |
| Part time | 6 | 1.2 | |
| Self-employed | 61 | 12.2 | |
| Unemployed | 51 | 10.2 | |
| Retired | 80 | 16.0 | |
| Highest education level | None | 19 | 3.8 |
| Primary | 109 | 21.8 | |
| Secondary | 253 | 50.6 | |
| Tertiary | 119 | 23.8 |
Table 4
PAL, BMI and income classification of middle aged and elderly people
| Characteristics | 35–50 | 51–65 | >65 | |
| n | n | n | ||
| BMI | Underweight | 17 | 6 | 12 |
| Normal | 136 | 71 | 26 | |
| Overweight | 96 | 62 | 11 | |
| Obese | 26 | 29 | 8 | |
| PAL | High | 146 | 74 | 33 |
| Moderate | 78 | 63 | 12 | |
| Low | 51 | 31 | 12 | |
| Total household income level | High | 118 | 79 | 9 |
| Moderate | 87 | 43 | 10 | |
| Low-middle | 64 | 31 | 23 | |
| Low | 6 | 14 | 15 |
Note: n = 500, among which n (35–50) = 275; n (51–65) = 168; n (>65) = 57.
Table 4 shows that among the middle-aged individuals, especially the young middle aged, the majority (n = 118 for 35–50 age group; n = 79 for 51–65 age group) had a high income whereas those aged 65 or more had low- middle income (n = 23). In all the three age groups, high physical activity was more prevalent. Moreover, a higher number of middle aged and elderly participants had a normal weight.
3.2Factors associated with energy intake of middle aged and elderly adults
The mean energy intake (E.I) of the participants was 1919 kcal. The mean BMI was 24.6 Kg/m2. Although it was found that the mean energy intake is higher in overweight and obese participants as compared to normal or underweight individuals, this difference was not statistically significant (p = 0.253). No significant relationship was obtained between energy intake and physical activity (p = 0.667). However, energy intake was reported to be higher among participants engaging in moderate physical activity than those who have a low or high physical activity level. Results indicate a significant relationship between (a) gender (p = 0.000), (b) frequency of snaking (p = 0.041), (c) nutrition knowledge (p = 0.039) and energy intake. Males (M = 2210 kcal) reported higher EI than that of females (1684 kcal). Those who snacked less than once per month had the lowest energy intake (1815.93 kcal). A small negative correlation was found between NK score and energy intake among the participants(p = 0.039).
3.3Relationship between energy intake and frequency of consumption of different food groups
Results show a small significant positive correlation between energy intake and the following food groups (Table 5):
Table 5
Relationship between energy intake and frequency of consumption of different food groups
| Results of Pearson Correlation | |
| Energy intake/kcal | |
| r sig. value (2 tailed) | |
| Carbohydrates | 0.069 0.333 |
| Beans and pulses | 0.052 0.465 |
| Meat and eggs | 0.182 0.010 |
| Sea foods | 0.168 0.017 |
| Soy beans and products | –0.085 0.233 |
| Dairy products | 0.039 0.582 |
| Processed foods | 0.229 0.001 |
| Snacks high in fat and sugar | 0.143 0.044 |
| Beverages | 0.154 0.030 |
Bold significant (p<0.05)
1. Meat and eggs (r = 0.010, significant at 0.01 level)
2. Sea foods (r = 0.017, significant at 0.05 level)
3. Processed foods (r = 0.001, significant at 0.01 level)
4. Snacks high in fat and sugar (r = 0.044, significant at 0.05 level)
5. Beverages (r = 0.030, significant at 0.05 level)
Small positive correlations were also found between carbohydrates, beans and pulses and dairy products but these were not significant (p > 0.05). A small negative correlation which was not significant was found between soy beans and energy intake.
3.4General eating habits and influences
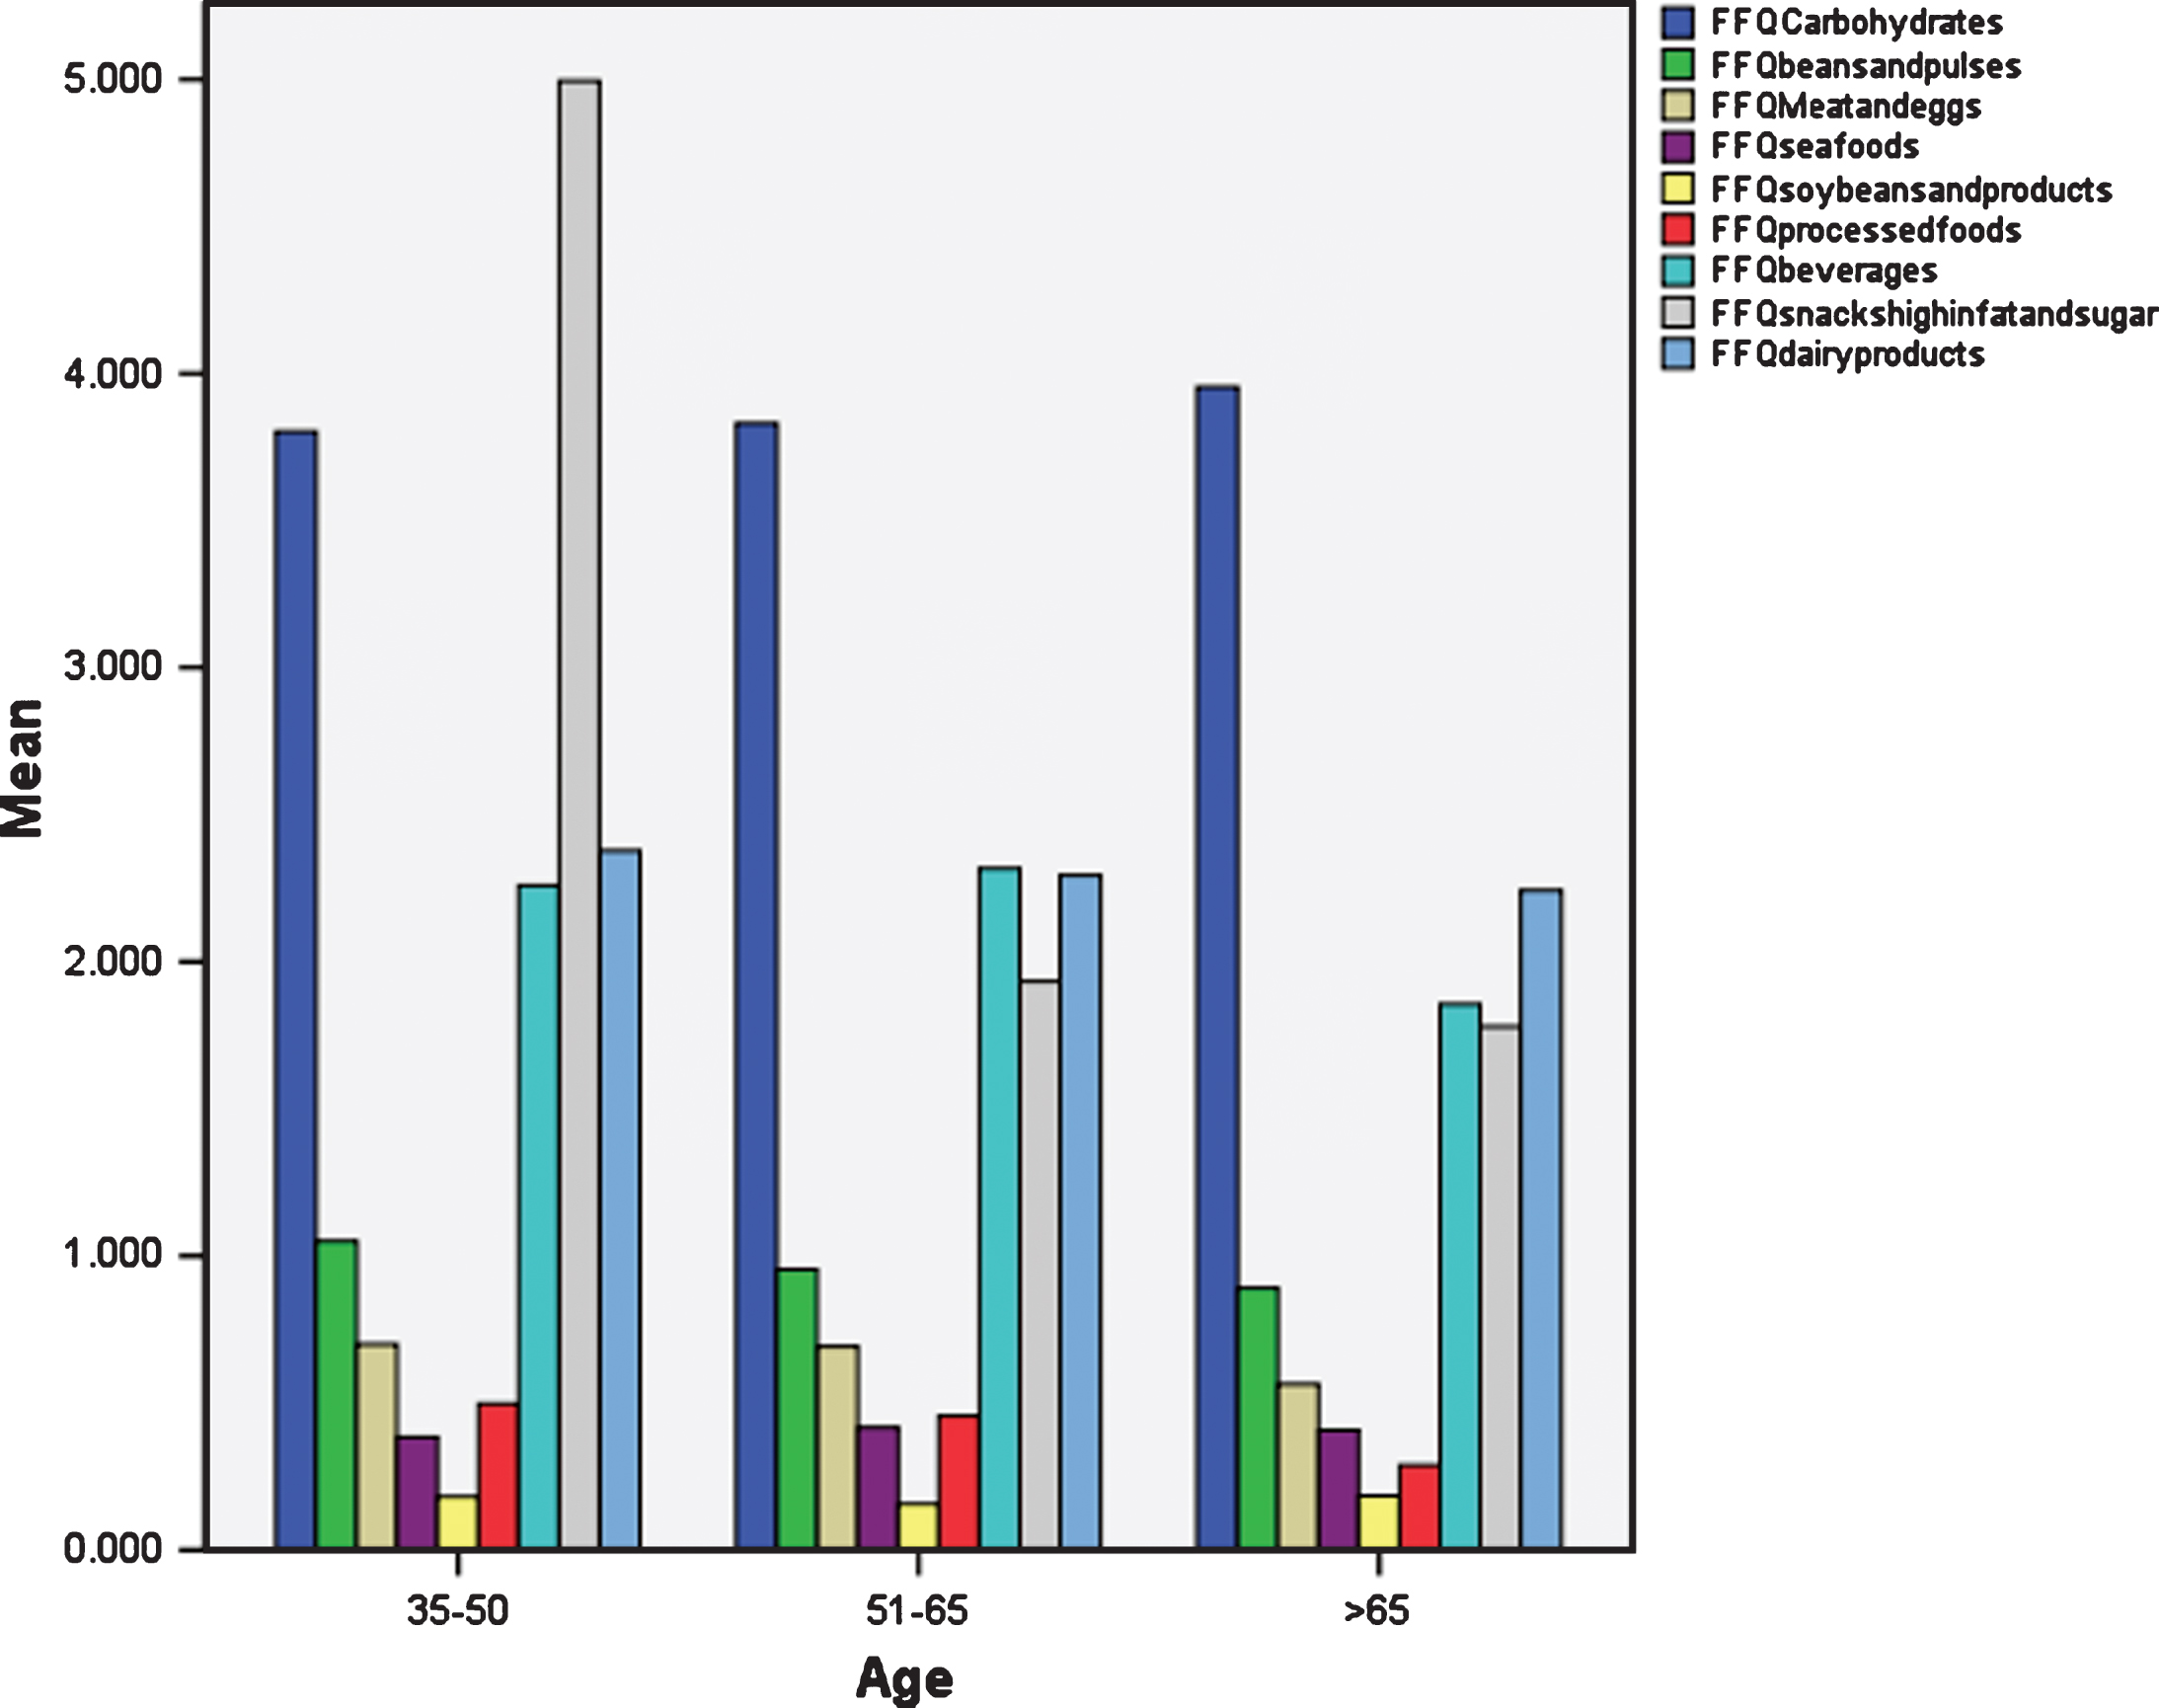
In general, the consumption of carbohydrates was slightly higher among participants aged above 65 years (M = 3.95) as compared to those aged 35–50 (M = 3.80) and 51–65 (M = 3.83). Soybean consumption was also found to be highest in this age group. There is a higher consumption of beans and pulses, meat and eggs, dairy products, processed foods and snacks high in fat and sugar among participants aged 35–50 than in the other age groups. However, the consumption of sea foods and beverages was greater in those aged 51 to 65 years. Figure 1 illustrates the mean consumption of each food group by age. Results indicate that there is a higher consumption of carbohydrates (M = 3.97 in males, M = 3.69 in females), beans and pulses (M = 1.01 in males, M = 0.99 in females), meat and eggs (M = 0.73 in males, M = 0.64 in females), processed foods (M = 0.48 in males, M = 0.44 in females) and beverages (M = 2.37 in males = 2.10 in females) among males. On the other hand, the consumption of soybeans (M = 0.18 in females, M = 0.16 in males), dairy products (M = 2.42 in females, M = 2.25 in males) and snacks high in fat and sugar (M = 5.04 in females, M = 2.09 in males) were found to be higher among women. Sea food consumption was nearly similar both among males and females (M = 0.40 in both males and females). However, the differences were significant only for carbohydrates (p = 0.041) and beverages (p = 0.11). A statistically significant relationship between PAL and gender (p = 0.011) is reported with men being more engaged in moderate physical activity than women. However, a greater percentage of women (57%) were found to have a high PAL than men (43.9%). Results show that a small significant negative correlation exists between BMI and frequency of consumption of carbohydrate foods (r = –0.094). Small positive correlations were also reported between consumption of processed foods (r = 0.096), frequency of beverages consumption (r = 0.137) and BMI and these correlations were also statistically significant (p < 0.05). In context with socio economic status, a significant relationship between income level and beans and pulses (p = 0.015), dairy products (p = 0.007), processed foods (p = 0.028) and beverages (p = 0.010) was reported. A small negative correlation between NK and consumption frequency of meat and eggs which was statistically significant at the 0.05 level (r = –0.110) is reported herein. Another small negative correlation was obtained between frequency of consumption of processed foods (r = –0.149) and NK.
Fig.1
Mean consumption of each food group by age.
4Discussion
4.1Energy intake (EI) and eating habits of middle aged and elderly people
The mean EI of Mauritian adults aged greater than 35 years old is 1919 kcal. Males and females reported 2210 kcal and 1684 kcal/day respectively. The findings are consistent to those of Japanese men and women (2278±428 kcal/day and 1798±325 kcal/day respectively) and the EI for females is also close to that of Chinese women [35]. Similar results were also found in Montreal where men and women had a mean E.I of 2216±835 kcal/day and 1785±600 kcal/day respectively [36]. However, the mean E.I in this study are lower than those of UK, US [35] and New Zealand [37]. The mean daily calorie intake for Sub Saharan Africa was estimated to be 2098 kcal/day with 2120 kcal/ day for Western Africa [38] which is consistent with the E.I of men in this study but higher than the mean E.I of total participants. Although no statistically significant relationship between age and E.I was found, the elderly (>65 years) had the lowest E.I (1776.11 kcal) while those aged between 51–65 years had the highest E.I. Similarly, a study in India also reported higher EI among middle aged participants (1901.68 kcal for 35–50 age group) compared to their elder counterparts [39]. The mean E.I for elderly people in this study (1776.1 kcal) is consistent with the Recommended Daily Allowances (RDA) for elderly people in Thailand (1750 kcal/day for men) but it is lower than that for other countries like Indonesia, Malaysia and Singapore, which recommends 2200 kcal for its senior citizens [40]. Moreover, the recommendations for older adults are less (1550–2200 kcal/day) than for younger adults (1750–3000 kcal/day) in the South East Asia Region. Participants in this study were found to consume carbohydrates, snacks, dairy products and beverages more frequently while soybeans and products were the least consumed food items (Fig. 1). Recently Pem et al. [41] also reported quite similar dietary habits among adults. Precisely, middle aged participants aged 35–50 have high consumption of beans and pulses, meat and eggs, dairy products, processed foods and snacks while those aged 51–65 years old consumed sea foods and beverages more frequently. Adults aged greater than 65 years old had high consumption of carbohydrates and soybean. Elderly people tend to consume more carbohydrate-rich food, which involve minimum chewing, are easily digested and are cheaper than protein-rich food [42]. Similarly, in Indonesia, elderly individuals had a high consumption of rice or other local staple foods, and were reported to consume soybean products on a regular basis (soybean cake, curd) [43]. The North/South Ireland Food Consumption Survey 2001 [44] reveals that younger adults consume chips and snacks more than adults aged between 51–64 years. Similarly, Saava et al. [45] found that the carbohydrate intake was high among elderly people. Furthermore, elderly people consumed less meat, poultry and alcoholic beverages than younger adults [46].
4.2Relationship between eating habits and energy intake
Positive correlations were found between the consumption of meat and eggs, beverages, sea foods, processed foods and snacks and energy intake and this can be explained by the nutritional content of these foods and the method of cooking employed. Meat and eggs contain a high amount of saturated fats and cholesterol [47] which explain why the consumption of these products in great amounts may lead to an increased energy intake [48]. In the case of sea foods, middle aged adults consuming one or more portions of total fish per week were more likely to have a higher total E.I than those consuming less than one portion per week. Moreover, regular shellfish consumption was associated with higher E.I and BMI than those who did not consume shellfish on a regular basis [49]. The type of cooking method used is also imperative; for instance, frying in oil and serving the shellfish or sea foods with condiments such as mayonnaise which are rich in fat can cause a rise in total E.I and is associated with diabetes as well. In line with this result, a study by Virtanen et al. [50] also concluded that men who had a high fish consumption had higher intakes of energy. Beverages, especially sweetened beverages such as soft drinks often contain sweeteners such as HFCS which can contribute significantly to E.I and hence, result in obesity [51]. An alternative explanation may be that sugar sweetened beverages have low satiety and hence, the resulting incomplete compensation of energy at the following meals, leading to weight gain [52] Moreover, Gibson and Shirreffs [53] advocated that during 2008-2009, alcoholic beverages provided 184 kcal/day per capita while caloric soft drinks (soda and fruit drinks) contributed 50 kcal/day per capita in British adults. A positive correlation between processed foods (mostly meats) and energy intake has also been found in this study. Processed meats contain a great number of calories and a high % of energy comes from the saturated fats that they contain [54]. The findings corroborate those of Larsson et al. [55] who reported that high intakes of processed meat and red meat both result in an increased E.I.
4.3Energy intake and body mass index (BMI)
With a mean BMI of 24.61 Kg/m2, the participants have a normal weight with a tendency towards overweight. This trend was also observed in the Finland and Tanzania among the middle-aged adults, where a high proportion was obese [56, 57] Findings also reveal that E.I increases with increasing BMI, with underweight participants having the lowest energy intakes (1689±396.10 kcal) and obese having the highest intakes (2097±967.5 kcal). This result corroborates those of Malay women, where the overweight and obese consumed more calories than their normal counterparts, demonstrating a positive correlation between energy intake and BMI [27]. However, in the present study, despite the energy rise obtained with increasing BMI, the difference was not statistically significant. Similar results have been reported in Korea, where the lack of statistically significant relationship between E.I and BMI was attributed to either under reporting or the intentional reduction of energy intake of the obese [58]. This finding has been further supported by Schröder et al. [59] who found that energy consumption was directly correlated with BMI but did not reach statistical significance. The type of carbohydrates consumed may influence BMI [60] however in the present study, carbohydrates were negatively correlated to BMI. Feng et al. [61] also reported that BMI was not positively associated with daily carbohydrate intake. These findings were further supported by another study which reported that individuals having a white bread pattern did not experience gains in BMI [62]. Weight gain was inversely associated with the intake of high fibre whole grains whereas increases in the intake of refined carbohydrates led to a rise in body weight [63]. This difference was suggested to be due to the high fibre content of whole grains which increase appetite control by producing a delay in carbohydrate absorption. The positive association observed between processed foods and BMI in this study was also reported by [64] who advocated that “modern” foods which included processed meat and sodas can result in weight gain due to their high saturated fat content [65]. As far as the consumption of beverages are concerned, the positive relationship reported with BMI in this study coincides with a study on Canadian women where a high consumption of “fruit drink” led to a high BMI among women [66]. This rise in BMI was attributed to the high calories of these sweetenedbeverages [67].
4.4Energy intake and physical activity level (PAL)
The present study indicates that the majority of participants from each age group had a high PAL. Adults aged 51–65 years old had a more moderate PAL (37.5%) than those aged 35–50 (28.4%) while the latter engaged into high PAL (53.1%) to a greater extent than the 51–65 age group (44.0%). It is commonly known that PAL decreases with age [68]. However, controversial results have been obtained herein with a greater number of elderly being engaged in high PAL and it is in agreement with a study by Lee and Ory [69] who reported that elderly had the highest PAL than the other groups. This result was attributed to the fact that elderly individuals have more time than middle aged persons for leisure activity. Moreover, in this study a greater number of men were found to be engaged in moderate PA while more women were engaged in high PA. This can be supported by a study on Greeks where women had a higher total physical activity than men due to household tasks and daily living activities which helped to keep women more active, especially during old age [70]. In contrast, findings have reported that in general men had higher physical activity than women [71, 72]. E.I of participants in this study was higher with increasing levels of physical activity, with the exception of those engaged in high physical activity. However, this association of E.I with PAL was not statistically significant (P > 0.05). The increase in E.I with rising levels of physical activity has been advocated by Westerterp [73]. Moreover, men were found to increase their caloric intake with increased demands for physical activity than men who were employed in sedentary jobs [74], hence supporting the findings of the study. However, Donnelly et al. [75] argued that there is no consistent evidence to confirm that physical activity has an impact on E.I. The diverging result obtained in this study which reveals that participants engaged in high physical activity had lower energy intakes may be because of attempts to loseweight.
4.5Factors influencing energy intake and dietary food habits of middle aged and elderly people
4.5.1Gender
A significant relationship (p≤0.05) was obtained between gender and energy intake, with males (M = 2210 kcal) reporting higher EI than that of females (1684 kcal). This disparity has been attributed to the difference in body composition and energy expenditure of men and women. While males have a greater proportion of lean body mass together with a larger body size than females, women tend to have a higher proportion of body fat [76, 77]. The findings of this study have been supported by other countries and populations such as Nepal [78], the United States [79] and among Native American Indians [80] where energy intakes of men were significantly higher than for females. Results show that the frequency of consumption of meat and eggs, processed foods, beverages and carbohydrates were higher among males, with significant associations reported only for beverages and carbohydrates. On the other hand, women consumed dairy products, snacks and soybeans more frequently than males. These findings can be supported by several studies where women had a higher consumption of milk, biscuits and chocolates while men consumed meat, eggs [81], potatoes and alcohol more often. Men also consumed more processed foods and beverages than women [82]. The difference was accounted for by social norms and cultural beliefs. For instance, meat is known to symbolize masculinity. Moreover, women tend to have distinct eating habits since the preparation of foods have always been done by women [83] and society has different expectations from males and females concerningslimness [84].
4.5.2Snacking
A statistically significant relationship (P = 0.041) between the frequency of snacking and energy intake of the participants was reported. According to the results obtained, those who snacked less than once per month had the lowest energy intake (1815.93 kcal). Snacking regularly resulted in a higher E.I than those who do not, with those snacking thrice or more per week having significant differences in energy intakes from those who never snacked or snacked less than once per month. In developed countries, snacks contribute to about 20–23% of total energy intake [85]. Moreover, snacking, including both foods and beverages contribute to an average of 586 calories for men and 421 calories for women with 24% of total calories being consumed at snacking occasions [86]. Usual snackers have a higher E.I (2455 kcal) than non-snackers (2364 kcal) [87, 88]. The portion size of a snack plays a vital role in E.I, with larger portion sizes contributing to higher energy intakes. For instance, as the bag of potato chips increased from 28 g to 170 g in a study, snack intake rose significantly, hence, leading to increased total energy intake [88]. However, an interesting finding herein was that participants snacking on a daily basis had a lower E.I than those who snacked thrice or more per week. A possible explanation for this may be due to the types of foods selected as snacks [90]. This coincides with a study where dried plums or low fat cookie incorporated in the diet as snacks were not found to influence energy intake [91].
4.5.3Nutrition knowledge
A small negative correlation was found between NK score and energy intake among the participants. Results demonstrate that participants having a higher education level had better nutrition knowledge and similar findings have been reported in a study in Taiwan [92]. This finding is essential as NK is a major determinant of dietary intake among adults [93]. This has been further supported by Parmenter and Wardle [94] who found that degree holders had higher NK than those having no formal qualifications. A negative correlation between NK and energy intake indicates that, as NK increases, E.I declines. Other studies also show that nutrition knowledge have an effect on eating habits [95]. Results from a study reported that reading nutrition labels led to a decrease in E.I among adults [96]. Women with a high NK are also less likely to consume salty snacks, sweets and instead consumed fruits and vegetables more often [97].
4.5.4Socioeconomic status
A greater number of middle aged individuals have a high income whereas among the elderly a higher number have low middle income. Results from the present study reported a significant association between income levels and the consumption of beans and pulses, dairy products and beverages. Participants with a middle income were found to consume more beans and pulses than the low income participants. Similarly, in India, middle income people spent more on pulses than the low and high socio economic groups [98] as a major source of protein. However, it would have been expected to find a higher consumption of beans and pulses among the low income group due to the low prices of these food items. Yet, the low cost of pulses combined with its high micronutrient content [99] may be an incentive to increase its consumption in the diet among middle income people as well. A high consumption of dairy products among the middle-income group as compared to the low-income group was also reported herein. This can be explained by the fact that high SES people increase their intake of dairy products to compensate for their protein intakes since they have a reduced consumption of pulses and beans [98]. Studies carried out recently in Mauritius also reported a higher consumption of dairy products among middle and high SES groups than among the low SES groups [10, 100] and this difference has been attributed to the higher cost of dairy products. Processed foods are consumed to a greater extent by the high-income group than the low-income participants. Conflicting results have been reported by Mendoza et al. [101] who reported that cheaper, high calorie diets which include processed foods which are high in saturated fats and simple sugars were more prevalent in low income groups. However, it is also widely recognized that as SES increases, lifestyle becomes less healthy and people tend to adopt more aspects of a Western lifestyle which include processed foods [102]. The cause for this behavior is linked to the fact that people tend to view western food patterns as the privileges of the wealthy. In addition, in the current study, a significant relationship between income level and BMI was reported, revealing that a higher proportion of middle and high SES participants were overweight than low SES ones and hence, further supporting this finding. High income groups have a higher beverage intake than those from lower SES. The findings are consistent with those of the Center for Science in the Public Interest [103] which stated that high income individuals consume more beer than those from a low SES background. Furthermore, a higher proportion of men from a high SES were found to consume sweetened beverages than those from a lower income group [104].
5Limitations of the study
Major limitations of the current study are as follows: (i) Cultural traditions may have a profound influence on the food choices of each ethnic group in Mauritius and these have not been considered; (ii) Data derived from 24-hour dietary recall are prone to mis reporting and participants with lower energy intake may over report while those with high energy intake tend to under report [105]; (iii) Data such as physical activity level were self-reported and hence, prone to bias [106].
6Conclusions
The present study found that the mean energy intake for men and women were lower than the recommended daily allowances in India. It was also observed that men had higher energy intakes than women. A few factors were found to influence the energy intake of the participants, in particular, gender, frequency of snacking, nutrition knowledge and socioeconomic status. On the other hand, factors such as BMI, PAL and income level had no significant effect on energy intake, although interesting trends were observed between the related variables and energy intake. The current study also reveals that the middle aged and elderly persons did not have good eating habits in general. Healthier eating habits were observed among women than men. Diverse factors were found to have an effect on eating habits such as BMI, income level and NK. Moreover, the consumption frequency of certain food groups was found to influence energy intake of participants. Based on the results of this study, it is not advisable to recommend an increase in energy intake among the middle aged and elderly Mauritians. However, basic nutrition knowledge should be imparted to middle aged and elderly people and an increase in physical activity level should be recommended.
Author contributions
Natasha Hurree and Rajesh Jeewon conceived and designed the experiments; Natasha Hurree performed the experiments; Natasha Hurree analyzed the data; Natasha Hurree, Dhandevi Pem, Rajesh Jeewon and Suress Bhagwant contributed to other research aspects of the project.
Conflicts of interest
The authors declare no conflict of interest.
Acknowledgments
The University of Mauritius and the Department of Health Sciences are acknowledged for sponsoring this project and providing necessary research support.
References
[1] | Government of Mauritius Statistics, 2016. Population and Vital Statistics Year 2015. Available at: http://statsmauritius.govmu.org/English/Publications/Pages/Pop_and_Vital_Stats_Year15.aspx (Accessed January 2016). |
[2] | United Nations Population Funds, 2012. Ageing in the Twenty-First Century: A Celebration and A Challenge. New York: United Nations Populations Fund. New York: United Nations Populations Fund. Available at: https://www.unfpa.org/webdav/site/global/shared/documents/publications/2012/Ageing-Report_full.pdf (Accessed March 2016). |
[3] | Apostolopoulou M , Savopoulos C , Michalakis K , Coppack S , Dardavessis T , Hatzitolios A . Age, weight and obesity. Maturitas. (2012) ;71: :115–9. |
[4] | Skrzypczak M , Szwed A , Pawlińska-Chmara R , Skrzypulec V . Body mass index, waist to hip ratio and waist/height in adult Polish women in relation to their education, place of residence, smoking and alcohol consumption. HOMO. (2008) ;59: (4):329–42. |
[5] | Ministry of Health and Quality of Life, 2015. The Trends in Diabetes and Cardiovascular Disease Risk in Mauritius the Mauritius Non Communicable Diseases Survey 2015. Available at: http://health.govmu.org/English/Statistics/Documents/Mauritius%20NCD%20Survey%202015%20Report.pdf (Accessed on January 2016) |
[6] | Lokuruka MNI . A literature review of role of obesity in adult health with reference to Africa. Ajfand. (2013) ;13: (1):1–18. |
[7] | Vlismas K , Stavrinos V , Panagiotakos DB . Socio-economic status, dietary habits and health-related outcomes in various parts of the world: A review. Cent Eur J Public Health. (2009) ;17: (2):55–63. |
[8] | Popkin BM , Adair LS , NG SW . Now and Then: The global nutrition transition: The pandemic of obesity in developing countries. Nutr Rev. (2012) ;70: (1):3–21. |
[9] | Shahar D , Shai I , Vardi H , Fraser D . Dietary intake and eating patterns of elderly people in Israel: Who is at nutritional risk? Eur J Clin Nutr (2003) ;57: :18–25. |
[10] | Dunneram Y , Jeewon R . A scientific assessment of sociodemographic factors, physical activity level, and nutritional knowledge as determinants of dietary quality among indo-mauritian women. J Nutr Met. vol. 2013: , Article ID 572132, 9 pages, (2013) . |
[11] | Caudwell P , Gibbons C , Finlayson G , Näslund E , Blundell J . Physical activity, energy intake, and obesity: The links between exercise and appetite. Curr Obes Rep. (2013) ;2: :185–90. |
[12] | Harnack LJ , Jeffery RW , Boutelle KN . Temporal trends in energy intake in the United States: An ecologic perspective. Am J Clin Nutr. (2000) ;71: :1478–84. |
[13] | National Research Council (US) Coordinating Committee on Evaluation of Food Consumption Surveys. Washington (DC): National Academies Press (US); (1984) . |
[14] | World Health Organization/Food and Agriculture Organization. Diet, nutrition and the prevention of chronic diseases. Geneva: World Health Organization, 916. 2003. Available at: ftp://ftfao.org/docrep/fao/005/ac911e/ac911e00.pdf (Accessed January 2015). |
[15] | Risonar MGD , Rayco-Solon P , Ribaya-Mercado JD , Solon JAA , Cabalda AB , Tengco LW , Solon FS . Physical activity, energy requirements, and adequacy of dietary intakes of older persons in a rural Filipino community. Nutr J. (2009) ;8: (19):1–9. |
[16] | Hur I , Jang MJ , OH K . Food and nutrient intakes according to income in korean men and women. Public Health Res Perspect. (2011) ;2: (3):192–7. |
[17] | Irala-Estevez JD , Groth M , Johansson L , Oltersdorf U , Prättälä R , Martínez-González MA . A systemic review of socio-economic differences in food habits in Europe: Consumption of fruit and vegetables. Eur J Clin Nutr. (2000) ;54: :706–14. |
[18] | Melzer K , Kayser B , Saris WHM , Pichard C . Effects of physical activity on food intake. Clin Nutr. (2005) ;24: :885–95. |
[19] | Nagata JM , Valeggia CR , Barg FK , Bream KDW . Body mass index, socio-economic status and socio-behavioral practices among Tz’utujil Maya women. Econ Hum Biol. (2009) ;7: :96–106. |
[20] | Worsley A . Nutrition knowledge and food consumption: Can nutrition knowledge change food behaviour? Asia Pac J Clin Nutr (2002) ;11: (Suppl):579–85. |
[21] | Ma Y , Olendzki BC , Pagoto SL , Hurley TG , Magner RP , Ockene IS , Schneider KL , Merriam PA , Hébert JR . Number of 24-hour diet recalls needed to estimate energy intake. Ann Epidemiol. (2009) ;19: (8):553–9. |
[22] | Elmadfa L , Meyer AL . Importance of food composition data to nutrition and public health. Eur J Clin. (2010) ;64: (3):S4–7. |
[23] | U. S Census Bureau, 2008. Working Beyond Retirement-Age. U.S Census Bureau, Housing and Household Economic Statistics Division Labour Force Statistics Branch. Available at: https://www.census.gov/hhes/www/laborfor/Working-Beyond-Retirement-Age.pdf (Accessed March 2015). |
[24] | Cade J , Thompson R , Burley V , Warm D . Development, validation and utilization of food-frequency questionnaires-a review. Public Health Nutr. (2002) ;5: :567–87. |
[25] | Dave J . A Review & Needs Assessment of Local Level Diet & Nutrition Data. 2008. Available from: http://www.thehealthwell.info/node/94701 (Accessed July 2015). |
[26] | National Health and Nutrition Examination Survey (NHANES), 2008. National health and nutrition examination survey, 2003–2004 Data Documentation, Codebook, and Frequencies Food Frequency Questionnaire Output from DietCalc Software (FFQDC_C). NHANES, US. Available at: http://www.cdc.gov/nchs/nhanes/nhanes2003-2004/FFQDC_C.htm (Accessed August 2015). |
[27] | Lee CL , Norimah AK , Ismail M . Association of energy intake and macronutrient composition with overweight and obesity in malay women from klang valley. Malays J Nutr. (2010) ;16: (2):251–60. |
[28] | International Physical Activity Questionnaire, 2005. Guidelines for Data Processing and Analysis of the International Physical Activity Questionnaire (IPAQ) –Short and Long Forms. Available at: http://www.ipaq.ki.se/scoring.pdf (Accessed on August 2015). |
[29] | Parmenter K , Wardle J . Development of a general nutrition knowledge questionnaire for adults. Eur J Cli Nutr. (1999) ;53: :298–308. |
[30] | Whati LH . The development of a valid and reliable nutrition knowledge questionnaire and performance-rating scale for urban South African adolescents participating in the ‘birth-to-twenty’ study. Thesis (Msc). University of Stellenbosch, Available at: http://scholar.sun.ac.za/handle/10019.1/16624 (Accessed August 2015). |
[31] | World Health Organization, 2015. Obesity and overweight. Fact sheet No 311. http://www.who.int/mediacentre/factsheets/fs311/en/ (Accessed October 2015). |
[32] | Epic-Norfolk: Nutritional methods, 2014. University of Cambridge. Available at: http://www.srl.cam.ac.uk/epic/nutmethod/24hr.shtml (Accessed August 2015). |
[33] | Lukmanji Z , Hertzmark E , Mlingi N , Mlingi N , Assey V , Ndossi G , Fawzi W . Tanzania Food Composition Table. MUHAS- TFNC, HSPH, Dar es Sallam Tanzania, 2008. Available at: https://cdn1.sph.harvard.edu/wp-content/uploads/sites/30/2012/10/tanzania-food-composition-tables.pdf (Accessed August 2015). |
[34] | Burton BT . Human Nutrition Formerly the Heinz Handbook of Nutrition, 3rd Ed, New York, McGraw-Hill, (1976) . |
[35] | Zhou BF , Stamler J , Dennis B , Moag-Stahlberg A , Okuda N , Robertson C , Zhao L , Chan Q , Elliott P . Nutrient intakes of middle-aged men and women in China, Japan, United Kingdom, and United States in the late 1990s: The INTERMAP Study. J Hum Hypertens. (2003) ;17: :623–30. |
[36] | Shatenstein B , Nadon S , Godin C , Ferland G . Diet quality of montreal-area adults needs improvement: Estimates from a self -administered food frequency questionnaire furnishing a dietary indicator score. J Am Dietetic Assoc. (2005) ;105: :1251–60. |
[37] | Ministry of Health, New Zealand, 2013. Food and Nutrition Guidelines for Healthy Older People: A background paper.Wellington, New Zealand: Ministry of Health. Available at: http://www.health.govt.nz/system/files/documents/publications/food-and-nutritionguidelines-healthy-older-people-background-paper-jan2013.pdf (Accessed November 2015). |
[38] | Van Wesenbeeck CFA , Keyzer MA , Nubé M . Estimation of undernutrition and mean calorie intake in Africa: Methodology, findings and implications. Int J Health Geogr. (2009) ;8: (37):1–18. |
[39] | Mandeep W . Energy intake and energy expenditure pattern in middle aged females 30–50 years of age living in Urban slums of Punjab. JESP. (2007) ;3: (2):171–6. |
[40] | Tee E , Florentino R . RecommendedDietaryAllowances:Harmonisation in SoutheastAsia. InternationalLife Sciences Institute, 2005. Available at: http://ilsisea-region.org/wp-content/uploads/sites/21/2016/06/ILSI-SEAR-Monograph-ASEAN-RDAs.pdf (Accessed January 2016). |
[41] | Pem D , Bhagwant S , Jeewon R . A pre and post survey to determine effectiveness of a dietitian-based nutrition education strategy on fruit and vegetable intake and energy intake among adults. Nutrients. (2016) ;8: :127. |
[42] | Amarya S , Singh K , Sabharwal M . Changes during aging and their association with malnutrition. J Clin Gerontol Geriatr. (2015) ;78e84. |
[43] | Boedhi-Darmojo R . Trends in dietary habits of the elderly: The Indonesian case. Asia Pac J Clin Nutr. (2002) ;11: :S351–4. |
[44] | Harrington KE , Robson PJ , Kiely M , Livingstone MB , Lambe J , Gibney MJ . The north/south ireland food consumption survey: Survey design and methodology. Public Health Nutr. (2001) ;4: (5A):1037–42. |
[45] | Saava M , Kisper-Hint IR . Nutrition of elderly people in merivälja nursing home. Anthropol Pa. (2002) ;200–6. |
[46] | Wu S , Chang Y , Wei I , Kao M , Lin Y , Pan W . Intake levels and major food sources of energy and nutrients in the Taiwanese elderly. Asia Pac J Clin Nutr. (2005) ;14: (3):211–20. |
[47] | Delimaris I . Adverse effects associated with protein intake above the recommended dietary allowance for adults. ISRN Nutr, vol. 2013: , Article ID 126929, 6 pages, (2013) . doi:10.5402/2013/126929 |
[48] | Pan A , Sun Q , Bernstein AM , Schulze MB , Manson JE , Willett WC , Hu FB . Red meat consumption and risk of type 2 diabetes: 3 cohorts of US adults and an updated meta-analysis. Am J Clin Nutr. (2011) ;94: :1088–96. |
[49] | Patel PS , Sharp SJ , Forouhi NG . Association between type of dietary fish and seafood intake and the risk of incident type 2 diabetes. Diabetes Care. (2009) ;32: (10):1857–63. |
[50] | Virtanen JK , Mozaffarian D , ChiuvE SE , Rimm EB . Fish consumption and risk of major chronic disease in men. Am J Clin Nutr. (2008) ;88: :1618–25. |
[51] | Bray GA , Nielsen SJ , Popkin BM . Consumption of high-fructose corn syrup in beverages may play a role in the epidemic of obesity. Am J Clin Nutr. (2004) ;79: :537–43. |
[52] | Malik VS , Schulze MB , Hu FB . Intake of sugar-sweetened beverages and weight gain: A systematic review. Am J Clin Nutr. (2006) ;84: :274–88. |
[53] | Gibson S , Shirreffs SM . Beverage consumption habits “24/7” among British adults: Association with total water intake and energy intake. Nutr J. (2013) ;12: (9):1–13. |
[54] | Micha R , WallacE SK , Mozaffarian D . Red and processed meat consumption and risk of incident coronary heart disease, stroke, and diabetes mellitus: A systematic review and meta-analysis. J Am Heart Assoc. (2010) ;121: :2271–83. |
[55] | Larsson SC , Virtamo J , Wolk A . Red meat consumption and risk of stroke in Swedish men. Am J Clin Nutr. (2011) ;94: :417–21. |
[56] | Saaristo TE , Barengo NC , Korpi-hyövälti E , Oksa H , Puolijoki H , Saltevo JT , Vanhala M , Sundvall J , Saarikoski L , Peltonen M , Tuomilehto J . High prevalence of obesity, central obesity and abnormal glucose tolerance in the middle-aged Finnish population. BMC Public Health. (2008) ;423: (8):1–8. |
[57] | Muhihi AJ , Njelekela MA , Mpembeni R , Mwiru RS , Mligiliche N , Mtabaji J . Obesity, overweight, and perceptions about body weight among middle-aged adults in Dar es Salaam, Tanzania. ISRN Obesity, vol. 2012: , Article ID 368520, 6 pages, (2012) . |
[58] | Ahn Y , Paik HY , Lee HK . Average dietary energy intake does not increase as BMI increased in the national health and nutrition examination survey data of Korea. Int J Hum Ecol. (2003) ;4: (2):27–37. |
[59] | Schröder H , Marrugat J , Elosua R , Covas MI . Relationship between body mass index, serum cholesterol, leisure-time physical activity, and diet in a Mediterranean Southern-Europe population. Br J Nutr. (2003) ;90: :431–9. |
[60] | Ma Y , Olendzki B , Chiriboga D , Hebert JR , Li Y , Li W , Campbell M , Gendreau K , Ockene IS . Association between dietary carbohydrates and body weight. Am J Epidemiol. (2005) ;161: :359–67. |
[61] | Feng R , Du S , Chen Y , Zheng S , Zhang W , Na G , Li Y , Sun C . High carbohydrate intake from starchy foods is positively associated with metabolic disorders: A Cohort Study from a Chinese population. Sci Rep. (2015) ;5: :16919. doi: 10.1038/srep16919. |
[62] | Newby PK , Muller D , Hallfrisch J , Qiao N , Andres R , Tucker KL . Dietary patterns and changes in body mass index and waist circumference in adults. Am J Clin Nutr. (2003) ;77: :1417–25. |
[63] | Liu S , Willett WC , Manson JE , Hu FB , Rosner B , Colditz G . Relation between changes in intakes of dietary fibre and grain products and changes in weight and development of obesity among middle-aged women. Am J Clin Nutr. (2003) ;78: :920–7. |
[64] | Becquey E , Savy M , Danel P , Dabiré HB , Tapsoba S , Prével Y . Dietary patterns of adults living in Ouagadougou and their association with overweight. Nutr J. (2010) ;13: (9):1–10. |
[65] | Keszei AP , Schouten LJ , Goldbohm RA , Van Den Brandt PA . Red and processed meat consumption and the risk of esophageal and gastric cancer subtypes in The Netherlands Cohort Study. Ann Oncol. (2012) ;23: (9):2319–26. |
[66] | Nikpartow N . The association between beverage intake and overweight and obesity among Canadian adults. Thesis, Master of Science University of Saskatchewan, 2010. Available at: https://ecommons.usask.ca/bitstream/handle/10388/etd-10272010-120730/Thesis.pdf?sequence=1 (Accessed October 2015). |
[67] | Lin W , Lee YW . Nutrition knowledge, attitudes, and dietary restriction behaviour of the Taiwanese elderly. Asia Pac J Clin Nutr. (2005) ;14: (3):221–9. |
[68] | Koeneman MA , Verheijden MW , Chinapaw MJM , Hopman-Rock M . Determinants of physical activity and exercise in healthy older adults: A systematic review. Int J Behav Nutr Phys Act. (2011) ;8: (142):1–15. |
[69] | Lee WC , Ory MG . The engagement in physical activity for middle-aged and older adults with multiple chronic conditions: Findings from a community health assessment. J Aging Res, vol. 2013: , Article ID 152868, 8 pages, (2013) . doi:10.1155/2013/152868 |
[70] | Babatsikou F , Gerogianni G , Zyga S , Koutis C . Physical activity in a sample of elderly Greek people: A research study. Health Sci J. (2012) ;6: (3):518–33. |
[71] | Schnohr P , Scharling H , Jensen JS . Changes in leisure-time physical activity and risk of death: An observational study of 7,000 men and women. Am J Epidemiol. (2003) ;158: :639–44. |
[72] | American Heart Association, 2015. Statistical Fact Sheet 2013 Update Physical Inactivity. United States of America: American Heart Association, Inc. Available at: http://www.heart.org/idc/groups/heart-public/@wcm/@sop/@smd/documents/downloadable/ucm_319589.pdf (Accessed March 2015). |
[73] | Westerterp KR . Physical activity, food intake, and body weight regulation: Insights from doubly labelled water studies. Nutr Rev. (2010) ;68: (3):148–54. |
[74] | Hill J , Wyatt HR , Peters JC . Energy balance and obesity. Circulation. (2012) ;126: (1):126–32. |
[75] | Donnelly JE , Herrmann SD , Lambourne K , Szabo AN , Honas JJ , Washburn RA . Does Increased exercise or physical activity alter ad-libitum daily energy intake or macronutrient composition in healthy adults? A systematic review. PLoS One. (2014) ;9: (1):1–34. |
[76] | Nieves J , Formica C , Ruffing J , Zion M , Garrett P , Lindsay R , Cosman F . Males have larger skeletal size and bone mass than females, despite comparable body size. J Bone Miner Res. (2005) ;20: (3):529–35. |
[77] | Wu BN , O’Sullivan AJ . Sex differences in energy metabolism need to be considered with lifestyle modifications in humans. J Nutr Met, (2011) ;2011: :391809. doi:10.1155/2011/391809. |
[78] | Sudo N , Sekiyama M , Maharjan M , Ohtsuka R . Gender differences in dietary intake among adults of Hindu communities in lowland Nepal: Assessment of portion sizes and food consumption frequencies. Eur J Clin Nutr. (2006) ;60: :469–77. |
[79] | Mcardle WD , Katch FI , Katch VL . Essentials of Exercise Physiology, (3rd ed). United States of America, Lippincott Williams & Wilkins, (2006) . |
[80] | Carter TL , Morse KL , Giraud DW , Driskell JA . Few differences in diet and health behaviors and perceptions were observed in adult urban Native American Indians by tribal association, gender, and age grouping. Nutr Res. (2008) ;28: :834–41. |
[81] | Rurik I . Nutritional differences between elderly men and women. Primary care evaluation in Hungary. Ann of Nutr Met. (2006) ;50: (1):45–40. |
[82] | Kanter R , Caballero B . Global gender disparities in obesity: A review. Adv Nutr. (2012) ;3: :491–8. |
[83] | Prättälä R , Paalanen L , Grinberga D , Helasoja V , Kasmel A , Petkeviciene J . Gender differences in the consumption of meat, fruit and vegetables are similar in Finland and the Baltic countries. Eur J Public Health. (2006) ;17: (5):520–5. |
[84] | Guang Tian R , Boyce T , Henry P , Shrivastava P . Gender and reference groups in food consumption patterns formatting: A case study in the erskine college cafeteria. HPSfAA. (2002) ;22: (2):163–72. |
[85] | Zizza CA , Tayie FA , Lino M . Benefits of snacking in older Americans. J Am Diet Assoc. (2007) ;107: :800–6. |
[86] | United States Department of Agriculture. Food groups.United States ofAmerica:United States Department of Agriculture. Available from: http://www.choosemyplate.gov/food-groups/protein-foods.html (Accessed October 2015). |
[87] | Bes-Rastrollo M , Sanchez-Villegas A , Basterra-Gortari FJ , Nunez-Cordoba JM , Toledo E , Serrano-Martinez M . Prospective study of self-reported usual snacking and weight gain in a Mediterranean cohort: The SUN project. Clin Nutr. (2010) ;29: :323–30. |
[88] | Hampl JS , Heaton CLB , Taylor CA . Snacking patterns influence energy and nutrient intakes but not body mass index. J Hum Nutr Diet. (2003) ;16: (1):3–11. |
[89] | Rolls BJ , Roe LS , Meengs JS . Larger portion sizes lead to a sustained increase in energy intake over 2 days. J Am Diet Assoc. (2006) ;106: (4):543–49. |
[90] | Coulston AM , Boushey C , Ferruzzi M . Nutrition in the Prevention and Treatment of Disease, 2013 (2nd ed). United States of America, Academic Press. |
[91] | Howarth L , Petrisko Y , FurchneR-Evanson A , Nemoseck T , Kern M . Snack selection influences nutrient intake, triglycerides, and bowel habits of adult women: A pilot study. J Am Diet Assoc. (2010) ;110: :1322–7. |
[92] | Lin W , Lee Y-W . Nutrition knowledge, attitudes, and dietary restriction behaviour of the Taiwanese elderly. Asia Pac J Clin Nutr. (2005) ;14: (3):221–9. |
[93] | Sharma SV , Gernand AD , Day RS . Nutrition knowledge predicts eating behavior of all food groups except fruits and vegetables among adults in the Paso del Norte region: Qué Sabrosa Vida. J Nutr Educ Behav. (2008) ;40: (6):361–8. |
[94] | Parmenter K , Waller J , Wardle J . Demographic variation in nutrition knowledge in England. Health Educ Res. (2000) ;15: (2):163–74. |
[95] | Sakamaki R , Toyama K , Amamoto R , Liu C , Shinfuku N . Nutritional knowledge, food habits and health attitude of Chinese university students –a cross sectional study. Nutr J. (2005) ;4: :4. |
[96] | Temple JL , Johnson K , Recupero K , Suders H . Nutrition labels decrease energy intake in adults consuming lunch in the laboratory. J Am Diet Assoc. (2010) ;110: :1094–7. |
[97] | Fitzgerald N , Damio G , Segura-Pérez S , Pérez-Escamilla R . Nutrition knowledge, food label use, and food intake patterns among latinas with and without type 2 diabetes. J Am Diet Assoc. (2008) ;108: :960–7. |
[98] | Food and Agriculture Organization, 2006. The double burden of malnutrition Case studies from six developing countries. Rome: Food and Agriculture Organization, 84. Available at: ftp://ftp.fao.org/docrep/fao/009/a0442e/a0442e00.pdf (Accessed August 2015). |
[99] | Drewnowski A , Monsivais P , Maillot M , Darmon N . Low-energy-density diets are associated with higher diet quality and higher diet costs in french adults. J Am Diet Assoc. (2007) ;107: :1028–32. |
[100] | Fokeena WB , Jeewon R . Is there an association between socioeconomic status and body mass index among adolescents in Mauritius? Sci World J. vol. 2012: , Article ID 750659, 9 pages, (2012) . |
[101] | Mendoza JA , Drewnowski A , Christakis DA . Dietary energy density is associated with obesity and the metabolic syndrome in U.S. adults. Diabetes Care. (2007) ;30: (4):974–9. |
[102] | Kim S , Symons M , Popkin BM . Contrasting socioeconomic profiles related to healthier lifestyles in China and the United States. Am J Epi. (2004) ;159: :184–91. |
[103] | Center for Science in The Public Interest, 2009. Do higher alcohol taxes really hurt lower-income people? Available at: http://www.cspinet.org/booze/taxguide/lowerincome.pdf (Accessed August 2015). |
[104] | Han E , Hyun kim T , Powell LM . Beverage consumption and individual-level associations in South Korea. BMC Public Health. (2013) ;195: (13):1–10. |
[105] | Sun Y , Roth DL , Locher JL . Reliability and predictive validity of caloric intake measures from the 24-hour dietary recalls of homebound older adults. J Am Diet Assoc. (2010) ;110: (5):773–8. |
[106] | Prince SA , Adamo KB , Hamel ME , Hardt J , Gorber SC , Tremblay MA . A comparison of direct versus self-report measures for assessing physical activity in adults: A systematic review. Int J Behav Nutr Phys Act. (2008) ;56: (5):1–24. |


