
School fortified milk improves vitamin A status of rural children in Morocco: A longitudinal interventional and controlled study1
Abstract
BACKGROUND:
Schoolchildren in Morocco are rarely targeted by micronutrient interventions. A school-milk program could be a good strategy for the administration of micronutrients, including vitamin A, in Moroccan school age children.
OBJECTIVE:
Our study aims to evaluate the effect of consumption of multiple micronutrients fortified milk on reducing vitamin A deficiency (VAD) in a pilot school milk program.
METHODS:
This longitudinal, interventional and double-blind study aimed to investigate the effects of consuming multi-micronutrient fortified whole milk, including vitamin A, for a period of 9 months, as part of a geographical targeted school-milk program, on vitamin A status of school-aged children living in a rural and mountainous area. Children were divided in two groups: a non-fortified milk group (NFMG, n = 111) received daily 200 ml of a whole ultra-high temperature (UHT) milk and a fortified milk group (FMG, n = 69) received daily 200 ml of an UHT milk fortified with multiple micronutrients, including vitamin A (retinyl palmitate). The vitamin A status of children has been assessed on the basis of serum retinol concentrations, using high performance liquid chromatography (HPLC). Children were not dewormed during the study.
RESULTS:
At the endline, albeit it was observed a significant decrease of VAD prevalence from 49.3% to 4.3% in the fortified group (P < 0.001) and from 45% to 25.2% in the non-fortified group (P = 0.001), the remaining prevalence of VAD in the endline was significantly lower in the fortified milk group (P < 0.001).
CONCLUSIONS:
A fortified school milk program seems to be effective to combat VAD among schoolchildren in this rural region of Morocco.
1Introduction
Vitamin A deficiency (VAD) is widely reported as a health problem in developing countries, affecting mainly children and women at child bearing age [1]. Among young children, VAD can cause xerophthalmia and lead to blindness, limit growth, weaken innate and acquired host defenses, exacerbate infection and increase the risk of death [2]. VAD is estimated to affect approximately one third of children under the age of five around the world [1]. VAD persists into adulthood and is a major public health problem among women of reproductive age, it manifests most clearly during pregnancy and the early postpartum period [3] and may increase morbidity and mortality during these periods [4, 5]. A high maternal prevalence of low vitamin A status during pregnancy, coupled with evidence of recurrent night blindness in repeated pregnancies, suggests that the nutritional problem is likely to be chronic, with antecedent risk possibly starting earlier in childhood and pubescence [6].
In the developing world, VAD is not restricted to preschool-aged children and affects also school-aged children. In Africa, some population surveys or community based studies have revealed prevalence for xerophthalmia and for VAD suggesting that VAD could be a significant public health problem, and highlighted the need for more representative population data in this age group, throughout sub-Saharan Africa [7–13].
In 1996, a national survey on vitamin A in Morocco revealed in children aged 6 months to 5 years a high prevalence of VAD to a severe level of public health concern [14]. In Morocco, preventive Vitamin A supplementation of children under 2 years is done routinely in health facilities during the immunization of children. For children 2–5 years, therapeutic vitamin A supplementation is administered in cases of measles, stunting, underweight, severe anemia or persistent diarrhea [15]. Other public health interventions to control infection and improve overall nutritional status like vaccination, fight against the diarrheic diseases and parasitic infestations and nutritional education are also implemented. Although VAD in women is not considered a public health problem [16], routine vitamin A supplementation in postpartum women for preventive target (for the benefit of the breastfed child) is a current program. In parallel with the vitamin A supplementation programs, food fortification program in vitamin A has also been launched to reach a broader population. Edible oil was chosen as main vehicle for vitamin A fortification [17]. Vitamin A fortification levels aim to cover a third of the dailyrequirement [18].
In morocco, school-aged children, especially those living in rural areas, are not specially targeted with regard to nutrition surveys or nutritional interventions to improve their micronutrient status and a gap of knowledge about the vitamin A status of school children remains in the country. Given that the typical diet of Moroccan families, especially from poor rural settings, is mainly based on cereals, fruits and vegetables and doesn’t rely on the more expensive foods of animal origin that are rich in preformed vitamin A [19], which would result in a low intake of Vitamin A, school age children from disadvantaged backgrounds may be a high – risk group for VAD and its health consequences.
Thus, under the efforts to address malnutrition (including VAD) among school-aged Moroccan children from disadvantaged backgrounds, the Ministry of National Education and the Foundation of Child Nutrition began a geographical targeted school milk program consisting on a daily distribution of fortified milk with multiple micronutrients (MMN) covering more than 23.500 students in more than 159 rural schools. The rationale for fortifying the milk with multiple micronutrients was to address multiple micronutrient deficiencies through the national school-feeding program.
To our knowledge, there is no interventional study that has evaluated the effect of a school based micronutrient fortification intervention on biochemical status in Morocco. Hence, and in partnership with the Foundation of Child Nutrition and the Ministry of National Education and the Ministry of Health, our team undertook a study to assess the efficacy of the consumption of a MMN fortified milk (including iron, iodine, vitamin A and vitamin D) under a school-feeding program for a period of 9 months on nutritional status of school children aged 7–9 years living in rural and mountainous areas of morocco. In this paper we will describe the effect and efficacy of the MMN fortified milk on the vitamin A status.
2Materials and methods
2.1Study area
The area where the study took place is located in the central high-Atlas Mountains of Morocco. It’s 400 to 700 m above sea level with rural predominance and low income communities. Farming is the main activity of the population in the form of small family farms, 8% of households are connected to the drinking water network [20], and most available food is produced locally on small and familial farms. This region is also known to have high prevalence of micronutrient deficiencies [21], more than one-third of the infants aged <5 years suffer from stunted growth and 12% are wasted [22] and diarrheal diseases are common.
2.2Selection of schools
School selection criteria have been discussed with officials of the provincial delegation of the National Ministry of Education in the province of Azilal. The choice fell on three primary schools (Abouantar primary school, Iwariden primary school and Iminifri primary school) on the basis of the following criteria: schools serving nearby communities and similar socio-economic and living conditions, large attendance of children to cover the required number for the study age range, accessibility of the schools to our field team.
2.3Study design
This study is a longitudinal interventional, double-blind (participants and assessors), and controlled one conducted among Moroccan schoolchildren, aged 7–9 years between February and October 2012, in a rural and mountainous area. A total of 194 schoolchildren were recruited from three primary schools and were divided into two groups to receive daily 200 ml either the fortified or the non-fortified milk by random drawing of schools. The corresponding type of milk (fortified milk group: FMG or non-fortified milk: NFMG) was delivered to children by the head master or by the teachers and the consumption of milk has been done during the morning time under close supervision. To ensure a regular consumption of milk during school holidays, the required quantity of the according type of milk was provided weekly to children through their parents with an additional quantity of normal milk for the whole family to ensure that the parents will adhere to the study protocol. The compliance with milk intake during school days was monitored by teachers and head masters, and a record of student attendance including individual milk consumption was kept up to date. During school holidays, the compliance was followed weekly with the help of parents.
2.4Subjects
Children were eligible for the study if they were 7 to 9 years old and were not taking supplements during the period of study. Only children with general good health and no major chronic diseases were eligible to participate. At the times of vitamin A status assessments, children had to be free from acute illness, febrile conditions, and gastrointestinal problems. Children who had measles and/or infections that lasted one week or more within a month prior to baseline data collection and those presenting signs of severe malnutrition or anemia (Hb < 7 mg/dl) or having clinic signs of chronic or acute illness requiring treatment or hospitalization were excluded from the study and transferred to the local health center for follow up.
The study was conducted under the ethical approval of the Ministry of Education of Morocco. The purpose and the protocol of the study were presented and explained to the local authorities, school head masters, teaching staff and parent’s union representatives who in turn explained the benefits of the study to the children’s parents. Subsequently, written consents were obtained from the parents or legal guardians of all of the children before the beginning of the study. The children were free to leave the study at any time they wanted. Trained medical technicians were recruited from local medical facilities to help with sample collection.
2.5Sample size
The calculation of the sample size was based on the standard deviation found in a reference regional study on the impact of the consumption of a vitamin A fortified oil in the vitamin status in women of childbearing age (SD = 0.6 μmol), done in 2006–2008 in Morocco [23]. To observe a difference of 0.4 μmol/l in vitamin A with 5% level of significance and 80% power between the intervention group and the control group, and after accounting for 20% dropouts, sample size of 43 children per study group was the required number.
2.6Milk composition
The milk used in the study was whole UHT and vanilla flavored. Two batches of milk were developed and produced for the purpose of the study. The fortified and unfortified milk were similar in macro-nutrient composition, taste, aroma, texture and packaging but not in micronutrients content (Table 1). An inter-laboratory control was performed with Laboratoire Aquitaine Analyses (AQUANAL, France) and LOARC (Laboratoire Officiel d’Analyses et de Recherches Chimiques, Morocco), to determine the macro- and micronutrient contents of each batch of milk before their use in the study and at mid study.
Table 1
Composition of the fortified and non-fortified milks
| Nutritional composition | NFMG | FMG | ||
| Content for 200 ml | % RDIa | Content for 200 ml | % RDIa | |
| Energy (Kcal) | 154.8 | – | 154.8 | – |
| Fat (%) | 5.8 | – | 5.8 | – |
| Protein (g) | 5.8 | – | 5.8 | – |
| Lipids (g) | 6 | – | 6 | – |
| Carbohydrates (g) | 19.44 | – | 19.44 | – |
| Calcium (mg) | 240 | 30 | 240 | 30 |
| Iron (mg)b | <0.4 | <3 | 4.2 | 30 |
| Iodine ( μg)c | 20.8 | 14 | 45 | 30 |
| Vitamin A ( μg)d | 54 | 7 | 240 | 30 |
| Vitamin D3 ( μg) | <1 | <10 | 3 | 30 |
| Calcium (mg) | 240 | 30 | 240 | 30 |
aRDI: Reference Daily Intake (for adults), based on the guidelines of the European Council 1169/2011 relative to nutritional food labeling (annex XIII). bIron: Ferrous sulfate, cIodine: potassium iodide and dVitamin A: Retinyl palmitate. NFMG: Non Fortified Milk Group, FMG: Fortified Milk Group.
2.7Socio-economic status
Socio-demographic data were collected at baseline by interviewing the parents of children. Information collected included parent’s educational level, size of household and household possessions, number of children, hygiene conditions, clean water and household income using a structured questionnaire developed for the study purpose.
2.8Anthropometric and morbidity assessments
Weight was measured (with children in light clothing) to the nearest 0.1 kg using a portable scale (Seca 750-Germany). Height was measured (with children shoeless) to the nearest 0.1 cm using a mobile stadiometer (Fazzini 2 meters). WHO Anthro+2007 software was used to calculate Z scores for height-for-age (HAZ), weight-for-age (WAZ) and BMI (24). The birth date of each child was obtained from the schools register.
All clinical history of chronic and current diseases was investigated by medical practitioners, focusing on acute lower respiratory infections urinary infections and diarrheal diseases. The sought-after symptoms were nausea and vomiting, burning during urination and abdominal pain, fever, dysenteric signs and the presence of blood or mucus in the stool and clinical signs of intestinal helminthiasis.
2.9Blood collection and laboratory analysis
Blood samples (8 ml) were collected from non-fasting children by venous puncture in dry tubes. Care was taken to avoid the exposure of the samples to light, for this; the tubes were wrapped in aluminum foil. The blood samples were immediately centrifuged (5000 rpm, 5 min); serum was aliquoted in Cryovial tubes and transferred in isothermic box under 4–8°C to the Joint Unit of Nutrition and Food Research laboratory and then stored at –80°C until analysis. The level of C-reactive protein (CRP) in the serum was determined by nephelometry using the Minineph kit (MININEPH, ZK044.L.R, The Binding Site, Birmingham, UK). In Our study, the presence of subclinical infection was assessed by CRP values > 10 mg/L.
The vitamin A status of children has been assessed by quantification of their serum retinol concentrations, using high performance liquid chromatography (HPLC) method [25, 26], as described by Narsri, Mokhtar et al. [16], in the Joint Unit of Nutrition and Food Research laboratory.
The population cut-off for preschool-age children to indicate a subclinical VAD prevalence of values below 0.70 μmol/l [27], which was also considered applicable for children 5–15 y of age [6], has been used in the present study. According to this recommended cut-off value, VAD prevalence less than 10%, 10% to 20% and above 20% were used to indicate mild, moderate and severe public health problems. Serum retinol concentrations were defined according to the World Health Organization (WHO) diagnostic criteria [28]: severe retinol deficiency (<0.35 μmol/l), moderate (≥0.35 μmol/l and <0.70 μmol/l), and normal (≥0.70 μmol/l).
2.10Dietary assessment
A dietary assessment was conducted in baseline with the children’s mothers by trained dietitians, in a face-to-face interview considering the high percentage of illiteracy. In this purpose, a culture-specific frequency food questionnaire (FFQ) was designed to assess frequency of consumption, over the previous month, of foods or food’s groups that are good sources of vitamin A. It included 31 foods, and was based on the typical diet of the low socioeconomic families in Morocco. The main components of the FFQ were the list of foods (groups that are good sources of dietary vitamin A) and frequency of consumption (per day, per week, per month or never).
3Statistical analyses
A per-protocol analysis was conducted on the data of participants who fulfilled the obligations of the protocol (children who were fully compliant to milk intake and present on the two blood samplings). All statistical analyses were performed using Statistical Package for the Social Sciences (SPSS, version 20.0). Anthropometric Z-scores were analysed by Anthro+software [24]. The distribution normality of quantitative variables was tested by Kolmogorov -Smirnov test. The variables normally distributed were presented as mean±SD, and those non-normally distributed as median (IQRs: interquartile ranges at 25 and 75 %). Differences between milks groups were examined by analysis of variance (ANOVA) or with the Mann-Whitney U test. Differences between baseline and 9 months follow-up were examined by using Wilcoxon signed ranks test or by the McNemar test. Two-sided p-values < 0.05 were considered significant.
4Results
A total of 194 eligible children were recruited from the 3 schools. The flow diagram of the study is reported in Fig. 1. The level of compliance with milk intake was complete and no refusal to consume milk by children during school time or at home was reported by teachers and principals or by parents. No adverse events because of the milk intervention were reported during the course of the study.
Fig.1
Participant Flowchart. SES: Socioeconomic Status, SR: serum retinol and CRP: C Reactive Protein. alost to follow-up = changed school or were relocated during study.
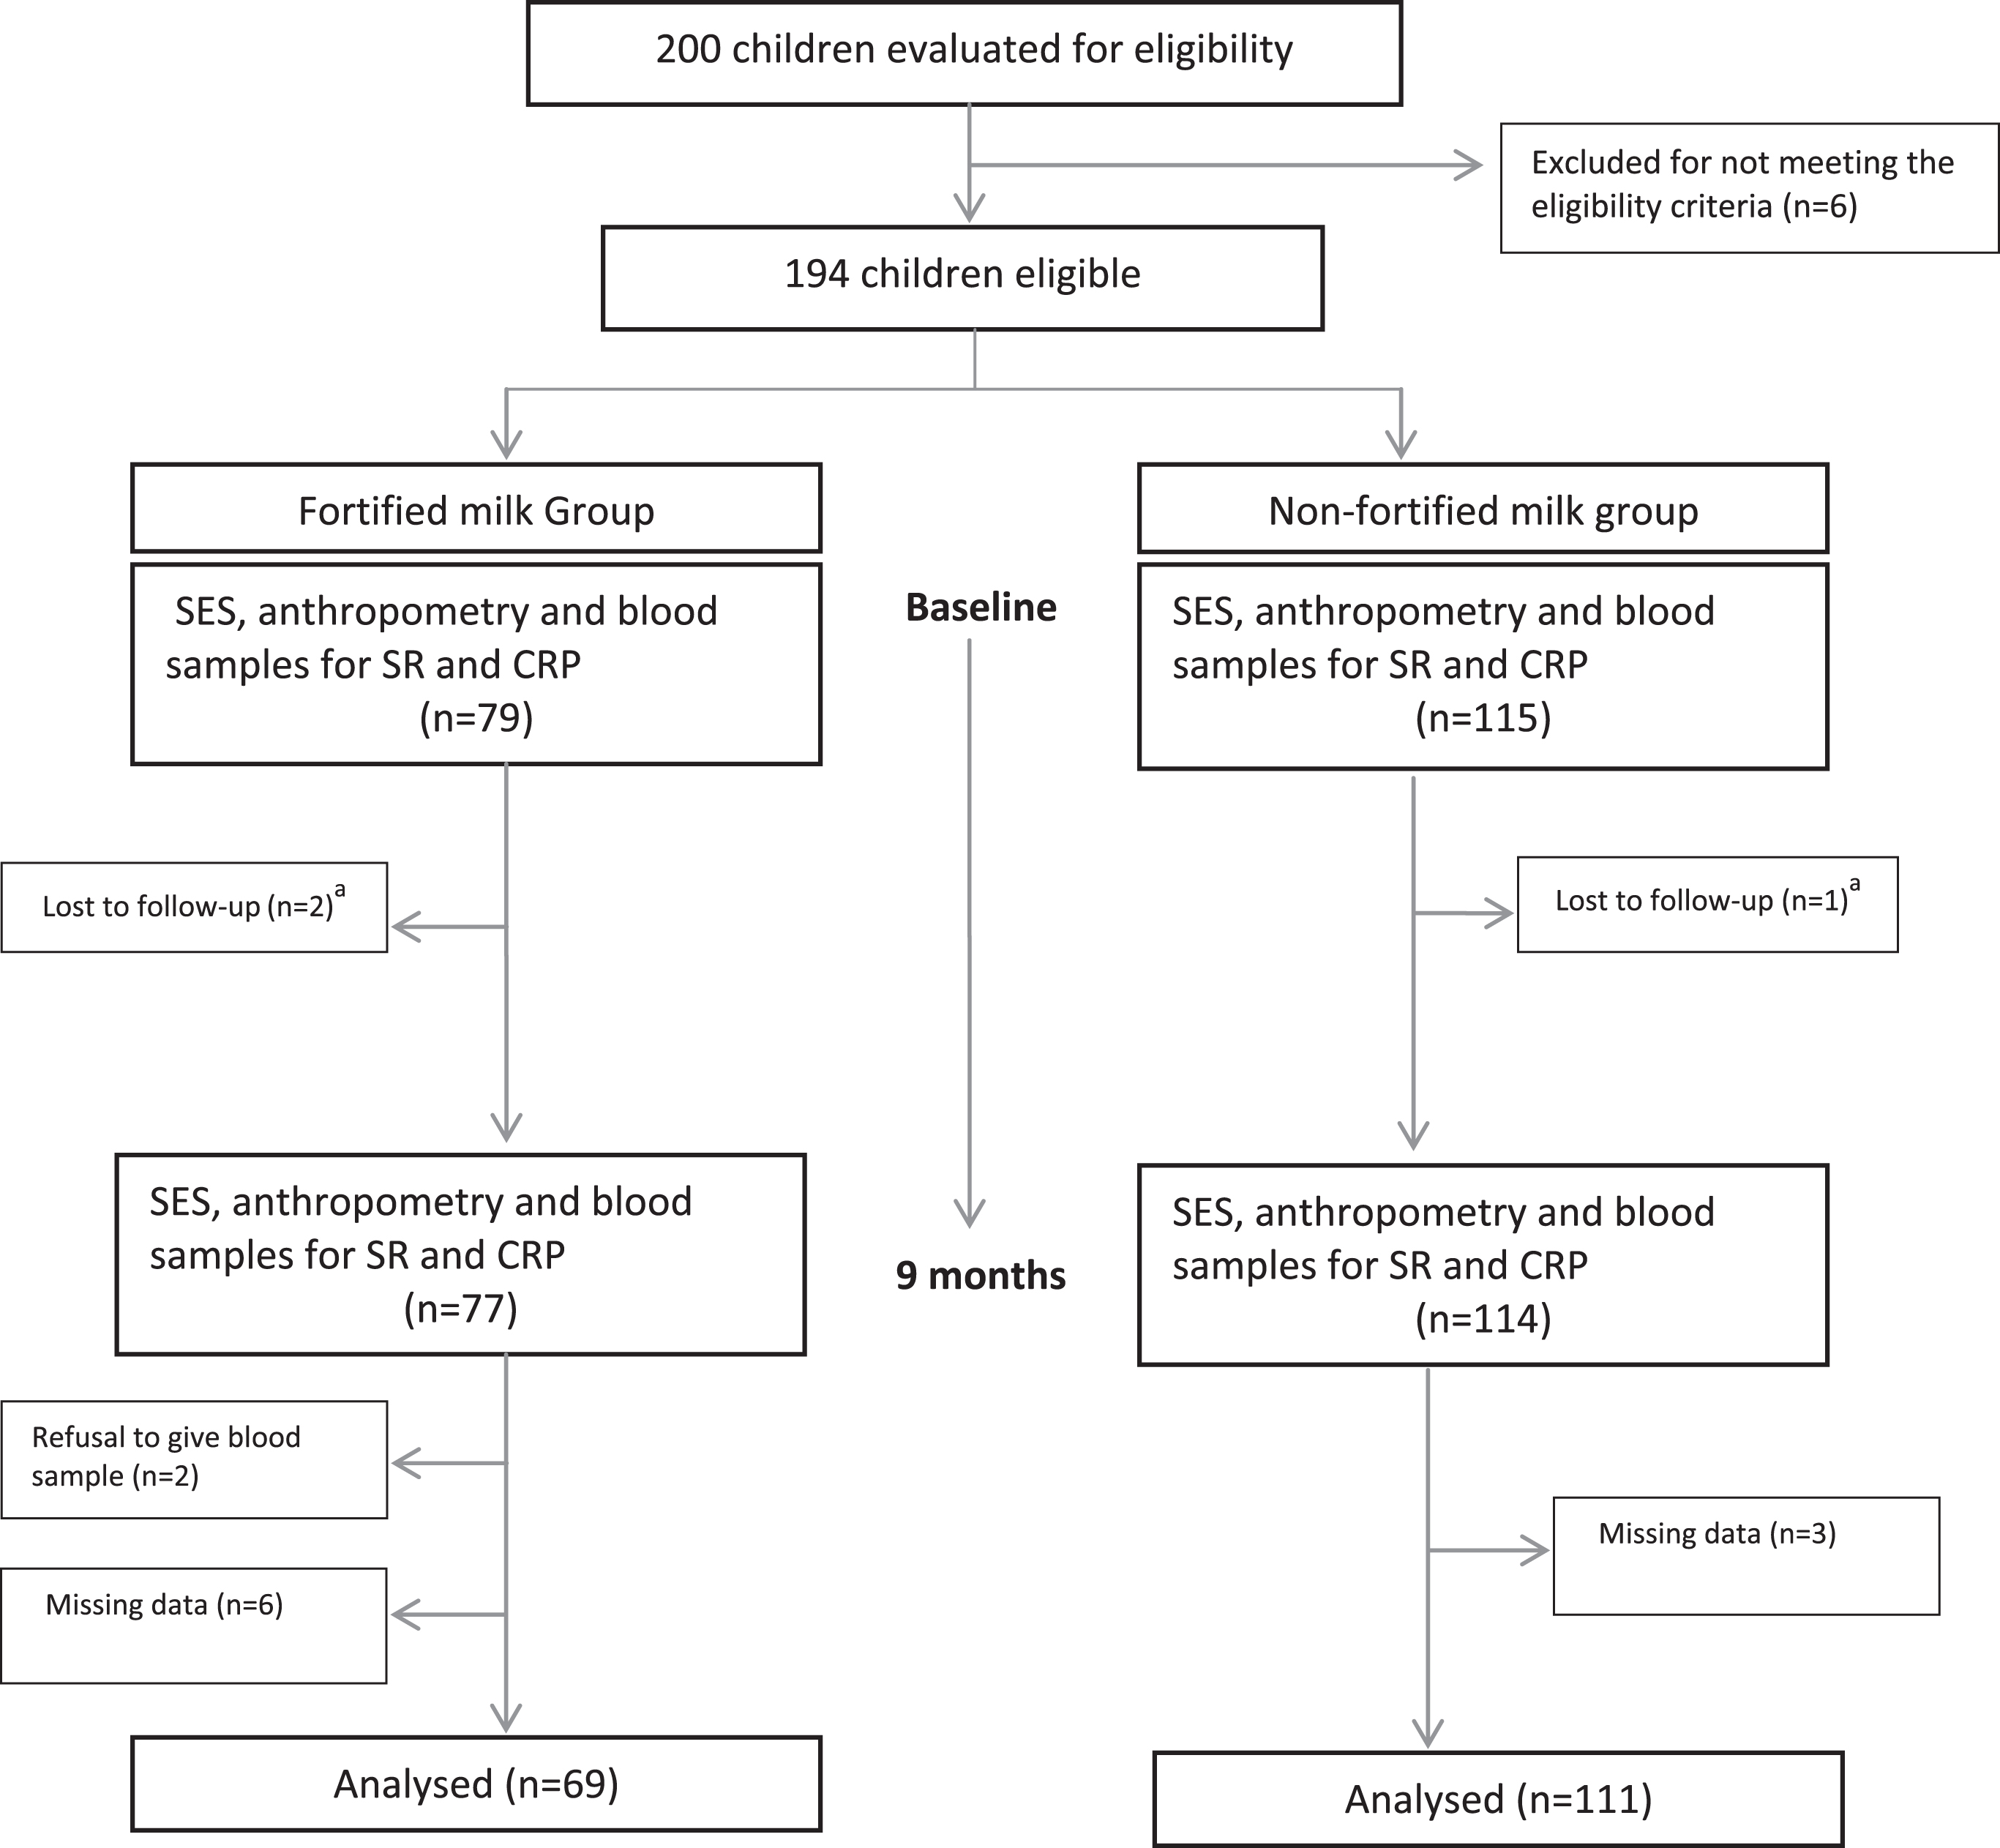
Table 2 shows baseline growth parameters and socio-economic information of children who participated in the study.
Table 2
Baseline characteristics of schoolchildren by milk’s group
| Variable | NFMG | FMG | P value* |
| (n = 115) | (n = 79) | ||
| Age (y)a | 8.14 + /–0.071 | 7.9 + /–0.101 | 0.092 |
| Sex | |||
| Female (%) | 49 | 45.5 | 0.658 |
| Male (%) | 51 | 54.5 | |
| Anthropometric status (%) | |||
| Stuntingb | 4.6 | 10.3 | 0.191 |
| Thinnessb | 0 | 1.5 | 0.370 |
| Recent morbidity history (%) | |||
| Diarrhea in previous 2 wk | 20.8 | 13.8 | 0.258 |
| Fever in previous 2 wk | 5.1 | 0 | 0.158 |
| Educational level of mothers (%) | |||
| Illiterate | 98.1 | 89.3 | 0.631 |
| Koranic pre-school | 0 | 0 | |
| Primary school | 0.8 | 8.9 | |
| Middle school | 1.1 | 1.8 | |
| High school | 0 | 0 | |
| College | 0 | 0 | |
| Educational level of fathers (%) | |||
| Illiterate | 59.3 | 57.1 | 0.513 |
| Koranic pre-school | 36 | 33.9 | |
| Primary school | 4.7 | 7.1 | |
| Middle school | 0 | 1.8 | |
| High school | 0 | 0 | |
| College | 0 | 0 | |
| Household size (%) | |||
| < 6 people | 47.1 | 44.6 | 0.771 |
| 6 to 10 people | 52.9 | 53.8 | |
| Family total monthly budget (%) | |||
| Less than 122 US$ | 27.6 | 18.2 | 0.087 |
| 122 to 195 US$ | 24.1 | 45.5 | |
| 196 to 244 US$ | 28.7 | 16.4 | |
| 245 to 366 US$ | 12.6 | 12.7 | |
| More than 366 US$ | 6.9 | 7.3 | |
| Family monthly budget dedicated for food (%) | |||
| Less than 110 US$ | 59.7 | 67.3 | 0.121 |
| 110 to 147 US$ | 24.1 | 10.9 | |
| 148 to 195 US$ | 5.7 | 12.7 | |
| 196 to 305 US$ | 10.3 | 7.3 | |
| More than 305 US$ | 0 | 1.8 | |
| Source of drinking water (%) | |||
| Tap water | 14.9 | 17.9 | 0.512 |
| Well | 80.5 | 91.1 | |
| Tank | 1.1 | 0 | |
| Waste disposal system (%) | |||
| Toilets inside the house | 24.1 | 33.9 | 0.203 |
| Shared toilets | 1.1 | 3.6 | 0.561 |
| Nature | 74.7 | 62.5 | 0.120 |
aMeans±s.d. bStunting and thinness were defined as height-for-age, BMI-for-age Z-scores < –2, respectively. *P-values were determined using independent samples t-test for means, and the Pearson or likelihood ratio chi-square statistics were used for comparing prevalence (P < 0.05). US$: based on the currency rate of September 2013. NFMG: Non Fortified Milk Group, FMG: Fortified Milk Group.
The two groups of children were well-balanced with respect to age and gender; the mean age was 8.06 + /–0.7 years. For malnutrition, the overall percentages of stunting (height- for-age Z-scores < –2 SD) and thinness (BMI-for-age Z-scores < –2 SD) in children were 8% and 0.6%, respectively. No child was overweight or obese. Overall, the study population has limited resources and there were no significant differences in baseline socioeconomic characteristics of children’s families between the two groups (household income, parental educational level, household size, source of drinking water and waste disposal system). At baseline and 9 months follow-up, there were no differences between milks groups with regard to prevalences of diarrhea and fever.
In the baseline, the overall prevalence (N = 180) of low serum retinol (<0.70 μmol/l) was found in 52.8% of children and 7.2% of children had severe serum retinol levels (<0.35 μmol/l) and medians baseline serum retinol concentrations were comparable in both milk’s groups (N = 180). The overall prevalence of elevated CRP (>10 mg/l) was 0.9% at baseline of the study, and there was no difference between the two milk’s groups. No significant change in CRP concentrations was observed from baseline to 9 months follow-up.
The Table 3 shows changes in serum retinol concentration and prevalence of VAD by milk’s group.
Table 3
Serum retinol concentrations and prevalence of VAD at baseline and 9 months of follow-up, by milk’s group
| Variable | NFMG | FMG | P-value |
| n = 111 | n = 69 | ||
| SR, μmol/l | |||
| Baseline | 0.93(0.65–1.27) | 0.83 (0.67–1.28) | 0.874 |
| Endline | 1.21(0.7–1.47)** | 1.46 (1.26–1.68)** | <0.001* |
| Prevalence of VAD, <0.70 μmol/l,% | |||
| Baseline | 45 | 49.3 | 0.646 |
| Endline | 25.2** | 4.3** | <0.001* |
Values are medians (IQRs) or percent. *Difference between fortified and non-fortified group using Pearson’s chi square or Mann-whitney U-tests (p < 0.05), **Significant difference between baseline and endline using Wilcoxon signed ranks test or McNemar test (P < 0.05). NFMG: Non Fortified Milk Group, FMG: Fortified Milk Group, SR: Serum Retinol Concentration.
Medians (IQRs) serum retinol concentrations were comparable in both groups in baseline: 0.93 (0.65–1.27) and 0.83 (0.67–1.28) in the NFMG and FMG, respectively. 49.3% of the children from the FMG and 45 % from the NFMG had low serum retinol concentrations (i.e. <0.70 μmol/l). From baseline to 9 months of follow-up, prevalence of low serum retinol decreased significantly to 25.2% in the NFMG (P = 0.001) and to 4.3% in the FMG (P < 0.001), with a significant difference between milk’s groups, in favor to the FMG (N = 180, P < 0.001). Furthermore, the distribution of serum retinol concentrations at baseline and 9 months follow-up showed a more pronounced rightward shift in the FMG comparing with the NFMG (Fig. 2).
Fig.2
Distribution of serum retinol concentration at baseline and 9 months follow-up by milk’s group.
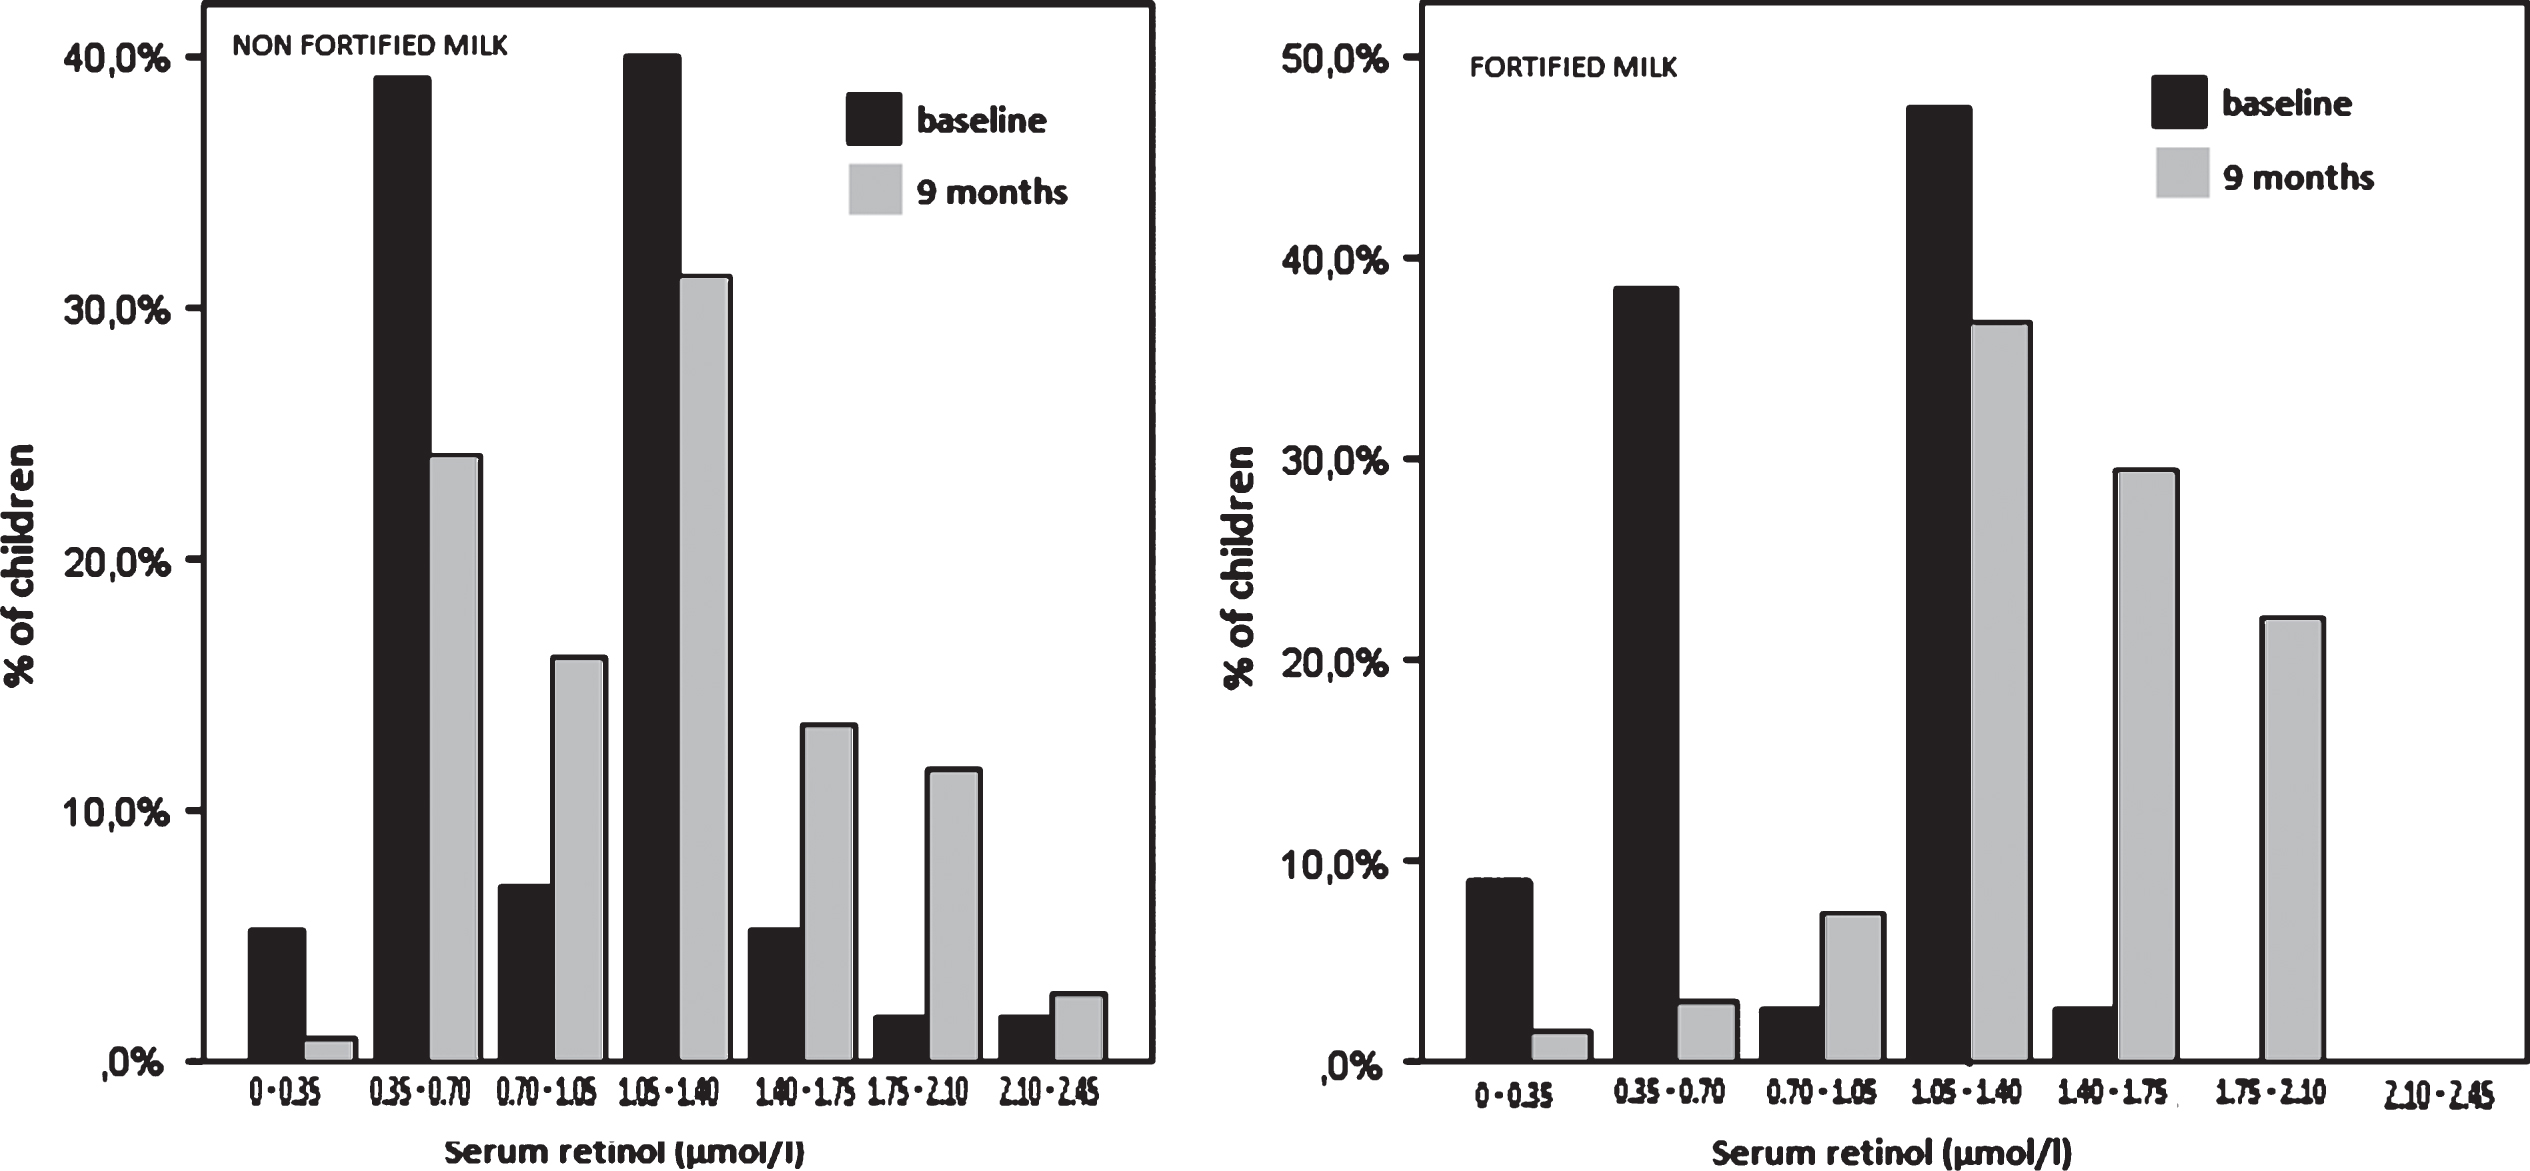
Table 4 shows serum retinol concentrations at baseline and 9 months of follow-up, and changes in VAD prevalence by milk’s group and by baseline’s serum retinol concentration category (below/above the WHO cutoff of 0.70 μmol/l at baseline).
Table 4
Serum retinol at baseline and 9months of follow-up, changes in vitamin A deficiency prevalence by milk’s group and by baseline serum retinol concentration category
| variable | Adequate VA status at baseline, ≥0.70 μmol/L | Deficient VA status at baseline, <0.70 μmol/L | ||||
| NFMG | FMG | P | NFMG | FMG | P | |
| n = 61 | n = 35 | n = 50 | n = 34 | |||
| SR, μmol/l | ||||||
| Baseline | 1.39 (1.16–1.32) | 1.28 (1.24–1.29) | 0.703 | 0.64 (0.57–0.68) | 0.67 (0.62–0.69) | 0.119 |
| Endline | 1.29 (0.93–1.62) | 1.46 (1.35–1.66)** | 0.009* | 0.89 (0.64–1.42)** | 1.42 (1.20–1.77)** | 0.002* |
| Prevalence of SR < 0.70 μmol/l,% | ||||||
| Endline | 16.4 | 0 | 0.012* | 36 | 8.8 | 0.005* |
| Change | 16.4 | 0 | –64 | –91.2 | ||
Values are medians (IQRs) or percent. *Significant difference between fortified and non-fortified group using Pearson’s chi square or Mann-whitney U-tests (p < 0.05). **Significant difference between baseline and endline using Wilcoxon signed ranks test (P < 0.05). Change = (% Endline) minus (% Baseline). NFMG: Non Fortified Milk Group, FMG: Fortified Milk Group, SR: serum retinol concentration.
The effect of the fortified milk was greater in both sub-groups (below/above the cutoff of 0.70 μmol/l at baseline). Indeed, the median serum retinol concentration in children with deficient baseline vitamin A status increased significantly in the two milks groups from baseline to endline, but this increase was significantly higher in the FMG (Mann-Whitney U, P = 0.002). Among children with adequate VA status at baseline, there was a significant increase in the median serum retinol concentration in the FMG, and a slight but non-significant decrease in the NFMG. Furthermore, 36% of the NFMG and 8,8% of the FMG of the children with deficient baseline vitamin A status exhibited yet a VAD after 9 months of follow-up, with a significant difference between the two milks groups (Pχ2 = 0,005). Among children with adequate VA status at baseline, no cases of VAD had appeared in the FMG after 9months follow-up (0% change), while the prevalence of VAD has reached 16.4% in the NFMG. The difference was significant between the milk’s groups (Pχ2 = 0,012).
The dietary intakes of selected nutrients rich in vitamin A in the two groups assessed by a single FFQ in baseline are shown in Table 5.
Table 5
Frequency of consumption over the previous months of foods that are good sources of dietary vitamin A in the two milk’s groups assessed by a single Frequency Food Questionnaire in baseline (n (%))
| Food item | N | Daily | Weekly | Monthly | zero times |
| Whole wheat | 180 | 28(15.6) | 0(0) | 0(0) | 152(84.4) |
| Soft wheat | 179 | 162(90.5) | 0(0) | 1(0.6) | 16(8.9) |
| Pasta | 180 | 5(2.8) | 129(71.7) | 27(15.0) | 19(10.6) |
| Corn | 180 | 0(0) | 20(11.1) | 0(0) | 160(88.9) |
| Carrots | 180 | 133(73.9) | 42(23.3) | 1(0.6) | 4(2.2) |
| Pumpkin | 179 | 34(19.0) | 128(71.5) | 1(0.6) | 16(8.9) |
| Sweet potatoes | 179 | 20(11.2) | 14(7.8) | 10(5.6) | 135(75.4) |
| Eggs | 180 | 41(22.8) | 121(67.2) | 6(3.3) | 12(6.7) |
| Milk | 180 | 88(48.9) | 14(7.8) | 0(0) | 78(43.3) |
| Yogurt | 180 | 7(3.9) | 67(37.2) | 20(11.1) | 86(47.8) |
| Cheese | 180 | 3(1.7) | 6(3.3) | 11(6.1) | 160(89.0) |
| Red meat | 180 | 16(8.9) | 130(72.2) | 11(6.1) | 23(12.8) |
| Chicken | 180 | 38(21.1) | 129(71.7) | 3(1.7) | 10(5.6) |
| Fresh fish | 180 | 5(2.8) | 106(58.9) | 50(27.7) | 19(10.5) |
| Liver | 180 | 0(0) | 10(5.5) | 16(8.9) | 154(85.5) |
| Butter | 180 | 47(26.1) | 40(22.2) | 10(5,5) | 83(46.1) |
| Margarine | 180 | 6(3.3) | 8(4.4) | 4(2.2) | 162(90.0) |
| Non fortified oil | 180 | 4(2.2) | 0(0) | 0(0) | 176(97.8) |
| Fortified oil* | 179 | 157(90.2) | 6(3.4) | 3(1.7) | 8(4.6) |
| Olive oil | 179 | 174(97.2) | 1(0.6) | 1(0.6) | 3(1.7) |
| Legumes | 180 | 11(6.1) | 135(75) | 20(11.1) | 14(7.8) |
| Green leafy vegetables | 180 | 2(1.1) | 6(3.3) | 2(1.1) | 171(94.5) |
| Fruits | 179 | 28(15.6) | 135(75.4) | 2(1.1) | 14(7.8) |
*Fortified oil with vitamin A and D3.
Over 90 % of the participants consumed diets prepared from soft wheat on a daily basis. The results also showed a low green leafy vegetables consumption intake among the participants, 94.5% of the participants didn’t consumed leafy vegetables in the previous months. The consumption of fruits was however higher than green leafy vegetables with 15.6% of the participants consuming fruits daily. Poultry, meat and fish group were consumed on a weekly basis, more than 10% of the participants didn’t consumed red meat or fresh fish in the previous month. Liver was not regularly consumed by the participants in the study. More than 40% of the school children did not consume milk or dairy products in the previous month. The vitamin A fortified table oil was consumed every day by more than 90 % of the studied children’s families. 45.9% of the participants did not consume any butter, the month preceding the interview.
5Discussion
Our results showed that the routine consumption of a MMN fortified milk, including 30% of the RDA of vitamin A, was efficacious in improving vitamin A status among a sample of children 7–9years in a rural and mountainous area of Morocco.
Increases in serum retinol concentrations have been reported in preschool and school aged children participating in several controlled trials of vitamin-A fortified foods using margarine [29], salt [30], wheat flour bun [31], coconut oil [32] and maize meal [33] as vehicles for fortification, but only vitamin-A fortified margarine and the fortified salt trials significantly improved serum retinol concentration over control. The difference in efficacy between these vitamin A fortification trials were explained by the low levels of serum retinol at baseline in the trials using margarine and salt, suggesting that homeostatic control mechanisms operating in adequately vitamin A nourished children may have attenuated any effect [34]. Moreover, the fortified wheat flour bun trial in preschool Filipino children reported a significant interaction between baseline serum retinol values and the response to treatment, and a subgroup analysis (by baseline serum retinol concentration category) showed a greater, albeit non-significant, change in serum retinol among children with deficient baseline vitamin A status than among those with adequate baseline vitamin A status at baseline [31, 34].
In the current study, in children fed fortified milk, we observed a significant increase in serum retinol concentration from baseline to 9 months follow-up, and also when comparing with control. We also noted a more marked shift in the distribution of serum retinol concentrations at baseline and 9 months follow-up in the FMG. These results can be explained by the low levels of serum retinol at baseline in the studied population. The significant increase in serum retinol concentration from baseline to follow-up in the NFMG can be explained by the use of a whole milk, containing 27 μg/ 100 ml, as a control.
In the current study, it was also noted a more pronounced effect of the fortified milk in both low vitamin A and adequately VA-nourished children at baseline. The consumption of the fortified milk also prevented the occurrence of new cases of VAD in adequately vitamin A-nourished children at baseline, which was not likely the case for the non-fortified milk. The more pronounced improvement in children with the lowest baseline serum retinol concentrations can be explained by an improvement in liver stores of vitamin A. Indeed, Solon et al reported an apparent improvement in liver stores of vitamin A as indicated by the MRDR test results in a subsample of children with marginal vitamin A status [29].
The high prevalence of VAD found at baseline (approximately 45% in the total sample) allowed us to identify this studied school-aged population as having a severe public health problem of VAD according to WHO criteria, and could be explained by nutrient-poor diets and recurrent infections common among this school-age children leading to depletion of VA stores in the liver and peripheral tissues. Indeed, children’s diet in this study consisted typically of cereals and more specifically soft wheat. Most of children consumed very little animal products rich in vitamin A (meat, eggs, milk and cheese) and rarely consumed green leafy vegetables even if it was their season. And even if the majority of interviewed mothers reported using vitamin A-fortified oil in cooking; the fact remained that the vitamin A-fortified oil, as the only vitamin A-fortified food available for this community, was probably unable to raise vitamin A levels in this population.
The high prevalence of VAD found in our study were similar with the prevalence of VAD reported in the 90’s Moroccan Regional Survey of vitamin A deficiency [14], which revealed that 40.9% of children aged 6–71 months had subclinical vitamin A deficiency as indicated by the serum retinol level <0.70 μmol/l and 3.2% of the children had serum retinol levels <0.35 μmol/l; in mountainous areas, the prevalence was 47.1 %. By using the same criteria; the concordance of our results with these relatively recent estimates, points the need to consider school-age children as ‘at-risk’ group concerning VAD in rural and mountainous areas in Morocco. Similar VAD prevalences were reported in South Africa, Congo and in Philippines’ school age-children. Indeed, in South Africa, the prevalence of VAD was 39.1%, as indicated by serum retinol in children aged 6–11 years [35]. In Congo, 18% and 49% of the children had serum retinol levels <0.35 μmol/l and 0.70 μmol/l, respectively [36]. Our results were higher than those found among school age children in center west of Tunisia where the prevalence of VAD (values below 0.70 μmol/l) observed was 2.3% observed and none exhibited severe VA deficiency (<0.35 μmol/l) [37].
VAD and iron deficiency anemia often coexist and VAD can contribute to anemia. Several studies using supplementation or fortification showed a positive effect of vitamin A on iron status [38–41] and supplementation trials that combine iron and vitamin A have shown a higher impact on the reduction of iron deficiency anemia than the administration of either iron or vitamin A alone [38, 39]. In our study, it was observed an increase of median ferritin levels and a marked reduction in the prevalence of iron deficiency in the fortified group, compared to the non-fortified group (results published elsewhere) [42]. The Consumption of fortified milk also resulted in a significant improvement in iodine status and appeared to have a favorable effect on the cognitive ability of the children (results published elsewhere) [43].
In Morocco, the school feeding program in rural areas has strong government support and is viewed as part of a necessary package of inputs for improving education. This school milk program consisting on a daily distribution of fortified milk with multiple micronutrients, presented short term beneficial outcomes on nutritional status of vitamin A.
6Conclusion
This is the first study to test the efficacy of vitamin A fortification of milk in Moroccan schoolchildren living in rural area. By using serum retinol concentrations, high proportions of subclinical VAD were observed among apparently healthy school-age children living in isolated areas with conditions of poor-socioeconomic background in Morocco. Our study provides evidence that delivery of vitamin A via milk is feasible and produces positive and short term effects on vitamin A status among school children.
Our findings provide only a narrow picture of vitamin A status among Moroccan school-aged children, but the possibility of similar results being found in other primary schools in similar socio-economic environment cannot be excluded. This study therefore indicates that further research is needed to determine vitamin A status after the preschool age in children and outlines the necessity of larger studies among school-age population to determine the real dimension of this nutritional deficiency in Morocco.
Our findings can be used in the decision making of existing or new school food policies in our country. The expansion of the fortified milk program in Moroccan rural schools should receive more encouragement.
7Study’s limitations
In our study, we assessed vitamin A status in this rural population using serum retinol concentrations as recommended by the WHO and UNICEF for assessing the population’s VA status [1, 44]. Nevertheless, serum retinol concentrations have several limitations as they are homeostatically controlled and do not begin to decline until liver reserves of vitamin A are very low; furthermore, serum retinol concentrations may be negatively influenced by the body’s acute-phase response to infection [45] or by a protein–energy malnourished state [46]. Accordingly, serum retinol does not always respond to vitamin A intervention strategies. We tried to overcome this issue by limiting analyses to children who were apparently healthy at the time of blood collection [47]. Rather, Modified Relative Dose Response (MRDR) is one of gold standard to determine vitamin A status. This test would better reflect liver reserves of vitamin A and is also more responsive to intervention with vitamin A than SR concentrations. Unfortunately, we just have not been able to realize this test because of limited funds.
A seasonal effect on serum retinol concentrations in response to dietary changes cannot be excluded, although it is unlikely because of the very low consumption of animal foods rich in vitamin A by this poor population. The habitual diet of the children with regard to vitamin A and provitamin A intakes during the intervention period was not controlled for, it was assumed that the habitual vitamin A intake was low.
8Study’s strengths
The main strength of the study is that it has allowed, for the first time in Morocco, an assessment of VAD in school-age children from a disadvantaged socio-economic community. Moreover, this evaluation was carried without deworming children. The deworming would have create a state that would have been different from the reality on the ground, indeed Moroccan public health programs do not provide deworming treatment for school children as a regular intervention.
Competing interests
The authors declare that they have no conflicts of interest.
Acknowledgments
We express our gratitude to school children who participated in this study and to their parents, all school principals, teachers, health workers and other support staff who made this study possible. We are also grateful to acknowledge the contribution of Foundation for Child Nutrition for providing UHT milk used in thestudy.
References
[1] | World Health Organization (WHO). Global prevalence of vitamin A deficiency in populations at risk 1995–2005. WHO Global Database on Vitamin A Deficiency. Geneva, World Health Organization 2009; Available from: http://whqlibdoc.who.int/publications/2009/9789241598019_eng.pdf |
[2] | Sommer A , West KP Jr . Vitamin A Deficiency: Health, Survival, and Vision, Oxford University Press, New York, NY, (1996) . |
[3] | Keith P , West KP Jr . Extent of Vitamin A Deficiency among Preschool Children and Women of Reproductive Age. Proceedings of the XX International Vitamin A Consultative Group Meeting. American Society for Nutritional Sciences. (2002) . |
[4] | West KP Jr , Katz J , Khatry SK , LeClerq SC , Pradhan EK , Shrestha SR , Connor PB , Dali SM , Christian P , Pokhrel RP , Sommer A . Double blind, cluster randomised trial of low dose supplementation with vitamin A or β-carotene on mortality related to pregnancy in Nepal. The NNIPS-2 Study GrouBr Med J. (1999) ;318: :570–5. |
[5] | Christian P , West KP Jr , Khatry SK , Katz J , LeClerq SC , Kimbrough- Pradhan E , Dali SM , Shrestha SR . Vitamin A or β -carotene supplementation reduces symptoms of illness in pregnant and lactating Nepali women. J Nutr. (2001) ;130: :2675–82. |
[6] | Singh V , West KP Jr . Vitamin A deficiency and xerophthalmia among school-aged children in Southeastern Asia. Eur J Clin Nutr. (2004) ;58: (10):1342–9. |
[7] | Gouado I , Mbiapo TF , Moundipa FP , Teugwa MC . Vitamin A and E status of some rural populations in the north of Cameroon. Int J Vit Nutr Res. (1996) ;68: :21–5. |
[8] | Kassaye T , Receveur O , Johns T , Becklake MR . Prevalence of vitamin A deficiency in children aged 6-9 years in Wukro, northern Ethiopia. Bull WHO. (2001) ;79: :415–22. |
[9] | Ghana VAST Study Team, Ross DA , Binka FN , Dollimore N , Smith PG , Addy HA , Tomkins AM , Kirkwood BR , Arthur P , Morris SS , Gyapong JO . Vitamin A supplementation in northern Ghana: Effects on clinic attendances, hospital admissions, and child mortality. Lancet. (1993) ;342: :7–12. |
[10] | Brabin L , Frazio-Tirrozzo G , Brabin B , Agbaje O , Harper G , Broadhead R . Vitamin A, vitamin E and anaemia status of non-pregnant Malawian adolescents. XIX IVACG Meeting, Durban, South Africa, (1999) . |
[11] | Carlier C , Coste J , Etchepare M , Pe’riquet B , Ame’de’e-Manesme O . A randomized controlled trial to test equivalence between retinyl palmitate and a∧ carotene for vitamin A deficiency. BMJ. (1993) ;307: :1106–10. |
[12] | Ash DM , Tatala SR , FrangilloJr EA , Ndossi GD , Latham MC . Randomized efficacy trial of a micronutrient-fortified beverage in primary school children in Tanzania. Am J Clin Nutr. (2003) ;77: :891–8. |
[13] | Ene-Obong HN , Odoh IF , Ikwuagwu OE . Plasma vitamin A and C status of in-school adolescents and associated factors in Enugu State, Nigeria. J Health Popul Nutr. (2003) ;21: :18–25. |
[14] | Ministère de la Santé. Enquête régionale sur la carence en vitamine A. Ministère de la Santé, Direction de la Population. Direction de la Planification et des Ressources Financières. Direction de l’Epidémiologie et de la lutte contre les Maladies. Royaume du Maroc (1999) . |
[15] | Plan d’action santé 2008-2012 « Réconcilier le citoyen avec son système de santé ». Ministère de la Santé, Royaume du Maroc. (http://srvweb.sante.gov.ma/Ministere/Mission/strategie/Documents/plan_action_sante_2008_2012.pdf). |
[16] | Nasri I , El Bouhali B , Aguenaou H , Mokhtar N . Vitamin A deficiency among Moroccan women and children. African Health Sciences. (2004) ;4: (1):3–8. |
[17] | Moroccan Ministry of health and MOST/USAID. Rapport technique de consultation: Dossier technique relatif à la fortification des huiles de table par les vitamines A et D3. Ministère de la Santé et USAID Micronutrient Program, HRN-A-00-98-0047-00. (2002) . |
[18] | Aguenaou H , Sarhani N , Janah K , Mahfoudi M . L’état d’avancement au Maroc de la fortification et de l’enrichissement des aliments de base dans le cadre du programme national de lutte contre les carences en micronutriments. Communications scientifiques« Santemaghreb.com ». (Available from: http://www.santemaghreb.com/maroc/nutrition.htm) (2005) . |
[19] | Enquête nationale sur la consommation et les dépenses des ménages 2000/2001. Rapport de synthèse. Royaume du Maroc/Haut Commissariat au Plan, Division des enquêtes auprès des ménages, Direction de la Statistique (Available from: http://www.hcma/pubData/ConsommationDepensesMenages/rapportsSynthese/2000-2001.pdf). |
[20] | Haut-Commissariat au Plan-Direction régionale Tadla Azilal-Monographie régionale 2012 (Available from: http://www.hcma/downloads/Monographies-regionales_t11957.html). |
[21] | MS - Enquête Nationale sur la Population et la Santé ENPS-II, 1992 (Available from www.sante.gov.ma/Publications/Etudes_enquete). |
[22] | Enquête sur la Population et la Santé Familiale EPSF, 2003/2004 (Available from www.sante.gov.ma/Publications/Etudes_enquete). |
[23] | Aguenaou H , Rjimati L , Elkari K , Janah K , Mahfoudi M , Zerrari A , Mokhtar N , Elmzibri M . impact of vitamin A and D3 fortified oil on nutrional status of Moroccan woman in reproductive age and preschool children. 2d Micronutrient Forum Meeting Micronutrients, Health and Development: Evidence-based Programs 12–15 May 2009 Beijing, China. (2009) . |
[24] | WHO Multicentre Growth Reference Study Group: WHO Child Growth Standards: Length/height-for-age, weight-for-age, weight-for-length, weight-for-height and body mass index-for age: Methods and development. Geneva: World Health Organization; (2006) . |
[25] | Sommer A , Davidson FR . Annecy Accords. Assessment and control of vitamin A deficiency: The Annecy Accords. J Nutr. (2002) ;132: (9 Suppl):2895S–2901S. http://www.who.int/growthref/en/. |
[26] | de Pee S , Dary O . Biochemical indicators of vitamin A deficiency: Serum retinol and serum retinol binding protein. J Nutr. (2002) ;132: (9 Suppl):2895S–2901S. |
[27] | World Health Organization. Serum Retinol Concentrations for Determining the Prevalence of Vitamin A Deficiency in Populations. Geneva: World Health Organization, (2011) . |
[28] | WHO. Indicators of vitamin A deficiency and their application in monitoring and evaluating intervention program. WHO/NUT/96.10. World Health Organization, (1996) . Geneva, Switzerland. |
[29] | Solon FS , Solon MS , Mechansho H , West KP Jr , Sarol J , Perfecto C , Nano T , Sanchez L , Isleta M , Wasantwisut E , Sommer A . Evaluation of the effect of vitamin A-fortified margarine on the vitamin A status of preschool Filipino children. Eur J Clin Nutr. (1996) ;50: :720–3. |
[30] | Zimmermann MB , Wegmueller R , Zeder C , et al. Triple fortification of salt with microcapsules of iodine, iron, and vitamin A. Am J Clin Nutr. (2004) ;80: :1283–90. |
[31] | Solon FS , Klemm RD , Sanchez L , et al. Efficacy of a vitamin A-fortified wheat-flour bun on the vitamin A status of Filipino schoolchildren. Am J Clin Nutr. (2000) ;72: :738–44. |
[32] | Candelaria LV , Magsadia CR , Velasco RE , et al. The effect of vitamin A-fortified coconut cooking oil on the serum retinol concentration of Filipino children 4-7 years old. Asia Pac J Clin Nutr. (2005) ;14: :43–53. |
[33] | Nesamvuni AE , Vorster HH , Margetts BM , et al. Fortification of maize meal improved the nutritional status of 1–3-year-old African children. Public Health Nutr. (2005) ;8: :461–7. |
[34] | Palmer AC , West KP , Dalmiya N , Schultink W . The use and interpretation of serum retinol distributions in evaluating the public health impact of vitamin A programmes. Public Health Nutr. (2012) ;15: :1201–15. |
[35] | Vanstuijvenberg ME , Kvalsvig JD , Faber M , Kruger M , Kenoyer DG , Benade AJ . Effect of iron-, iodine-, and β-carotene–fortified biscuits on the micronutrient status of primary school children: A randomized controlled trial. Am J Clin Nutr. (1999) ;69: :497–503. |
[36] | Samba C , Tchibindat F , Houze P , Gourmel B , Malvy D . Prevalence of infant Vitamin A deficiency and undernutrition in the Republic of Congo. Acta Tro. (2006) ;97: (3):270–83. |
[37] | Fares S , Chahed MK , Feki M , Beji C , Traissac P , El Ati J , Kaabachi N . Status of vitamins A and E in schoolchildren in the centre west of Tunisia: A population-based study. Public Health Nutr. (2011) ;14: (2):255–60. |
[38] | Mejía LA , Chew F . Hematological effect of supplementing anemic children with vitamin A alone and in combination with iron. Am J Clin Nutr. (1988) ;48: :595–600. |
[39] | Kolsteren P , Rahman SR , Hilderbrand K , Diniz A . Treatment for iron deficiency anaemia with a combined supplementation of iron, vitamin A and zinc in women of Dinajpur, Bangladesh. Eur J Clin Nutr. (1999) ;53: :102–6. |
[40] | Mejia LA , Arroyave G . The effect of vitamin A fortification of sugar on iron metabolism in preschoolchildren in Guatemala. Am J Clin Nutr. (1982) ;36: :87–93. |
[41] | Parmaesih D , Idjradinata , et al. Vitamin A fortified monosodium glutamate and health, growth and survival of children: A controlled field trial. Am J Clin Nutr. (1988) ;48: :1271–6. |
[42] | El Menchawy I , El Hamdouchi A , El Kari K , Saeid N , Zahrou FZ , Benajiba N , El Harchaoui I , El Mzibri M , El Haloui N , Aguenaou H . Efficacy of Multiple Micronutrients Fortified Milk Consumption on Iron Nutritional Status in Moroccan Schoolchildren. Journal of Nutrition and Metabolism. Volume 2015, Article ID 690954, 8 pages, http://dx.doi.org/10.1155/2015/690954. |
[43] | Zahrou FZ , Azlaf M , El Menchawy I , El Mzibri M , El Kari K , El Hamdouchi A , Mouzouni FZ , Barkat A , Aguenaou H . Fortified Iodine Milk Improves Iodine Status and Cognitive Abilities in Schoolchildren Aged 7–9 Years Living in a Rural Mountainous Area of Morocco. Journal of Nutrition and Metabolism. Volume 2016, Article ID 8468594, 7 pages. http://dx.doi.org/10.1155/2016/8468594. |
[44] | UNICEF, TheMicronutrient Initiative, World Health Organization et al. A Strategy for Acceleration of Progress in Combating Vitamin A Deficiency. Consensus of an Informal Technical Consultation; 18–19 December 1997. New York: UNICEF (1997) . |
[45] | Stephensen CB , Gildengorin G . Serum retinol, the acute phase response, and the apparent misclassification of vitamin A status in the third National Health and Nutrition Examination Survey. Am J Clin Nutr. (2000) ;72: :1170–8. |
[46] | Smith FR , Suskind R , Thanangkul O , et al. Plasma vitamin A, retinol-binding protein and prealbumin concentrations in protein–calorie malnutrition. III. Response to varying dietary treatments. Am J Clin Nutr. (1975) ;28: :732–8. |
[47] | Thurnham DI , McCabe GP , Northrop-Clewes CA , et al. Effects of subclinical infection on plasma retinol concentrations and assessment of prevalence of vitamin A deficiency: Meta-analysis. Lancet. (2003) ;362: :2052–8. |


