
Relationships of alcohol consumption and nutritional knowledge on body weight and composition in a group of Italian students
Abstract
BACKGROUND: Obesity is a global problem to which alcohol could contribute, and adolescent anthropometric measures have a predictive role for overweight in adults.
OBJECTIVE: To investigate the relations among nutritional knowledge, drinking habits and anthropometric measures in a cohort of local young people.
METHODS: Two questionnaires on alcohol consumption and on nutritional knowledge were submitted to 110 healthy subjects and their anthropometric data were taken.
RESULTS: Nutritional knowledge did not affect anthropometric data in females, while an inverse relationship between nutritional knowledge and WHR was observed in males.
In females a quadratic relation between BF and HC and alcohol consumption was reported.
In addition the amount of alcohol showed a linear correlation with HC.
In males no relations among antropometric measures and alcohol consumption were found.
Students with the highest nutritional competences consumed more alcohol than the others. In our cohort 14,29% of males and 5,56% of females were at risk of alcohol addiction, while binge-drinking was found in 17,86% of males and 0% of females.
CONCLUSIONS: Better nutritional knowledges are not enough to counteract the social aspects of drinking, and alternative ways of social entertainment should be proposed.
1Introduction
Obesity has been recognised as a global problem with epidemic proportions due to the massive social, economic and cultural problems both of industrialized and developing countries [1]. The obesity epidemic has been mainly related to a negative behavior regarding lifestyle and environment [2], that can be expressed by a chronic energy intake exceeding the energy expenditure.
One of the most spread behaviour resulting in an excess of energy intake can be the alcohol misuse [3–5].
Likewise a moderate alcohol consumption could as well be related to a weight increase if consumers use to add alcohol to their daily energy instead of introducing it as a substitute of foods [6]. As a matter of fact alcohol provides high energy (7,1 kcal/g) and it shows priority for oxidation compared with fat and carbohydrates [7, 8].
However the role of alcohol consumption in overweight or obesity incidence is relatively unclear: studies reported equally positive, negative or absence of associations [9–11]. Moreover it has to be considered that the source of alcohol (eg. wine vs spirits) is of great importance to define if the intake is positive or negative for health [12].
Nevertheless, due to the predictive role of adolescent anthropometric measures for overweight and obesity in adults, each behaviour leading to an increse of BMI in young people should be carefully evaluated.
In Italy alarming data regarding alcohol consumption were published and the binge-drinking phenomenon was underlined.
As a matter of fact the alcohol abuse is mainly expressed by binge-drinking (intake of an excess of alcohol in a single session) and alcohol intoxication (being drunk), while the aperitif is defined as a moderate but frequent alcohol consumption accompanied by snack foods.
In Italy the number of occasional drinkers is increasing, ranging from 37,6% in 2003 to 41,2% in 2013, as well as the consumers drinking alcohol outside mealtimes (from 24,8% to 25,8%). In addition the binge drinking has become a consolidated behavior in young people where 21,9% of males and 8,1% of females are involved, covering quite all the global risk regarding alcohol in Italy [13].
Together with others alcohol-dependent problems, the increase of overweight and obesity in young Italian people, nowadays showed by several epidemiological data, could be partially related to the misuse of alcohol and to a lack in nutritional consciousness.
At our knowledge no studies are available regarding the relation between alcohol consumption and anthropometric measures in Italian adolescents.
Thus the aim of our study was to investigate the relations among nutritional knowledge, drinking habits and anthropometric measures in a cohort of local young people.
2Material and methods
2.1Subjects and study design
This study was conducted according to the guidelines laid down in the Declaration of Helsinki and all procedures involving human subjects were approved by Ethical Committee of Universitá Cattolica (Protocol number 2781/15) and registered at ClinicalTrials.gov Identifier: NCT02336204.Written informed consent was obtained from all subjects.
110 healthy subjects (56 males and 54 females) were recruited using oral advertisements among the students of 18-19 years-old belonging to the Istituto Agrario (ITAS) and the Istituto Alberghiero Raineri-Marcora (ALB) of Piacenza. The two schools have different training focuses, with ALB providing a better knowledge on human nutrition and dietetics than ITAS.
The subjects were asked to complete a questionnaire on alcohol consumption (Table 1) and another one related to nutritional knowledge (Table 2).
Each answer from both the questionnaires defined a mark from 1 to 5: the lowest score was related to the worse drinking behaviour or nutritional knowledge; contrariwise the highest score was defined by the better drinking behavior or nutritional knowledge.
From both the questionnaires a final score was calculated by adding the answers mark: an alcohol score (Alcohol 1) and a nutritional score (NUTRI) were defined for each subject (Tables 1 and 2).
To specifically investigate the amount of alcohol introduced by volunteers, another score (Alcohol 2) was calculated from the alcohol questionnaire, considering only the questions related to the amount of alcohol introduced (Q2 and Q3). In particular Q2 expressed the binge drinking, while Q3 investigated the alcohol intoxication.
The subjects were then divided in quartiles based on the scores they obtained in each questionnaire.
Quartiles including higher scores of the nutritional questionnaires were related to a better knowledge in the field, while quartiles with higher Alcohol 1 and 2 scores meant a better drinking behavior and a low alcohol consumption.
Then anthropometric data were measured. Height (using a stadiometer) and weight (using a Gima scale) of each subject were measured with subjects wearing light clothes and the body mass index (BMI) was calculated (kg/m2); in addition waist and hips circumferences (WC and HC, respectively), the waist-hips ratio (WHR) and skinfolds (TSF-Triceps skinfold, BSF-Biceps skinfold, SSSF-Subscapolar skinfold, SISF-Supra iliac skinfold) were evaluated for each subject and body fat mass (BF) was calculated as proposed by Durnin and Womersley [14].
2.2Statistical analisys
Statistical analysis was performed with SAS 9.2 [15]. Data were analyzed in agreement to a completely randomized design and fixed effects of the model were: school, sex and their first order interaction.
The post-hoc means comparison between males vs females and school type (ITAS vs ALB) was performed with the t Student test. Linear, quadratic and cubic effect of alcohol score on anthropometric measures were tested by using ortogonal contrast.
The effect of nutritional knowledge and alcohol habits on anthropometric measures was determined using the Spearman-rank order correlation (PROC CORR).
Finally χ2 test was applied for contingency tables of alcohol questionnaire.
3Results
3.1Sex, anthropometric measures and school course
The comparison of anthropometric measures between sex and school courses are reported in Table 3.
The school course did not show any effect on anthropometric measures.
The subjects were classified basing on their BMI in 4 groups: underweight, normal weight, overweight and obese (Table 4).
Sex did not affect students partition in the four groups.
3.2Nutritional knowledge, alcohol consumption and anthropometric measures
Table 5 reports the scores obtained by the students answering the questionnaires in relation to their school course and sex.
The students of ALB showed a better knowledge regarding nutrition than their collegues of ITAS.
Nonetheless ALB students consumed more alcohol than ITAS students, even if males from both the school courses definetly consumed more alcohol than their female collegues.
3.3Alcohol score
In Table 1male and female the answers to the alcohol questionnaires are compared. No differences were found in the frequency of alcohol consumption (Q1) between sexes. However, a significant difference was reported in binge-drinking and alcohol intoxication (Q2 and Q3): males often introduced high amount of alcohol in a single session and got drunk as well (P < 0.01), while females stated that the phenomenon of binge drinking rarely happened (P < 0.05) and they never got drunk (P < 0.01).
The whole cohort was divided in quartiles based on the Alchol 1 score: the risk of alcohol addiction was hypotesized for the subjects belonging to the lower quartile.
In our cohort only 14,29% of males and 5,56% of females were considered at risk of alcohol addiction (Q1), while binge-drinking was found in 17,86% of males and 0% of females (Q2).
However 26,79% of males and 18,52% of females of our cohort reported that binge-drinking sometimes occurred (Q2).
Regarding alcohol intoxication (Q3), this occurred often to 16,07% of males and 0% females, while 59,26% of females denied any drunkennesses episode against only 33,93% of males.
The second part of the alcohol questionnaire regarded the aperitif: no differences were found between the sexes in relation to the quantity of alchol introduced, nor to food intake during or after the aperitif (Q4-Q6).
Most of the subjects usually eat something during the aperitif and quite all have dinner after it (82,14% of males and 81,48% of females).
3.4Relationship between alcohol and nutrition score with the body composition in females
Anthropometric measures, alcohol consumption and nutritional knowledge in females were regressed to each other in Table 6.
Anthropometric measures, as expected, are correlated each other, and BF was significantly related to all skinfolds, WC, HC and WHR.
Nutritional knowledge did not affect anthropometric data, while a quadratic relation between BF and HC and Alcohol 1 was reported (Fig. 1a and 1b).
In addition Alcohol 2 is inversely related to HC (P < 0.05).
3.5Relationship between alcohol and nutrition score with the body composition in males
Table 7 shows linear correlation among anthropometric measures, alcohol consumption and nutritional knowledge in males.
As observed in females, anthropometric measures were related each others and BF was significantly related to all skinfolds, WC, HC and WHR.
Inverse relationships between nutritional knowledge and BSF and WHR are observed, however a better nutritional knowledge was not related to a reduced alcohol consumption.
Differently than females, no relations were found between alcohol scores and anthropometric measures.
4Discussion
4.1Sex, anthropometric measures and school course
Regarding school course and anthropometric measures, no effect of the type of school was observed on the anthropometric data.
Proper et al. [16] showed that higher education contribute to a people predisposition to correct healthy habits and Skrzypczak et al. [17] found that low levels of educations were related to the highest values of BMI and WHR.
In our research the absence of effect of school type could due to the similar education level of the schools, being both high school.
In Table 4 the subjects were classified, according to their BMI, in four groups and a correlation with sex was investigated, but no differences were found.
Our results are in accordance with the Italian survey of Gallus et al. [18] who reported a percentage of female underweight students similar to ours (13.0% vs 12.80%). The same study reported instead a number of overweight and obese subject lower than ours. This result could be explained by the effective trend of obesity prevalence in Emilia Romagna that is higher than other Italian regions (10.6 % vs 10.3%) [19]. Moreover our data source was a direct anthropometric measure, while Gallus et al. [18] used data from self-reported measurements, that are more prone to under- or over-estimation [20].
4.2Nutritional knowledge, alcohol consumption and anthropometric measures
As expected, a significative difference was found between the school courses in the nutritional questionnaire: the students of ALB showed a better knowledge regarding nutrition than their collegues of ITAS (Table 5). As a matter of fact the ALB course is focused on cooking and catering and nutrition is included in the school core-businness.
However a better knowledge in nutrition did not mean a reduced alcohol consumption: ALB students also consumed more alcohol than ITAS students.
In literature a different drinking beaviour was mainly related to the level of education: heavy or excessive drinking in adolescents could be found in subjects with low education levels [20].
In contrast in our study an excessive drinking was reported in the ALB students, despite the same education level than ITAS: unexpectedly better nutritional knowledge was not associated to healthier behaviors.
Also the sex influenced the drinking habits: as expected males from both the school courses definetly consumed more alcohol than their female collegues.
4.3Alcohol score
In our cohort, binge-drinking and intoxication occurred differently between sexes: they happened more frequently in males, while females stated they only rarely introduce high amount of alcohol in a single session and never get drunk.
Our results are in agreement with Chiassai et al. [21] and with the Italian official survey ISTAT [13]: in both studies the alcohol misuse was more spread among males than females.
Regarding binge drinking, our results are in according with Chiassai [21], Cranford et al. [22], Wechsler et al. [23], who reported that females were less likely than men to binge-drink.
Moreover a less worring scenery than the national one was showed: incidences of 19,2% in males and 7,1% in females were reported by ISTAT against our 17,96% and 0% in males and females, respectively.
A difference between the sexes was also reported regarding alcohol intoxications: in our study the incidence in males is significatively higher than in females (Table 1). Contrarywise Chiassai et al. [21] did not find any difference between the two sexes in relation to alcohol intoxications from the questionnaires, however obtained results similar to ours from the semi-structured debates with the students after the questionnaire.
The ISTAT national study [13] reported that the 18-19 years-old consumers at risk of alcohol addiction were 19,9% of males and 7,4% of females, results quite similar to our findings, where 14,3% of males and 5,6% of females can be considered at risk (Table 1).
The second part of the alcohol questionnaire regarded the aperitif.
Our results are in according with Chiassai et al. [21] and national data [13]. The first study reported that 67% of the subjects did not exceed the intake of 1 glass during the aperitif, 74,4% eat something during the aperitif and 91,4% have dinner after.
Similarly national data reported that the aperitif consumption was limited to one glass or was matched with food [13].
4.4Effect of alcohol and nutrition score on body composition in females
Even if some previous cited works [16, 17] showed that education could affect anthropometric measures, probably this can only be related to the level of education and not to the specific nutrition field: in our study a better nutritional knowledge was not related to better anthropometric data (Table 6).
Weak relationships were instead found between anthropometric data and alcohol score: females showed a quadratic relation between BF and HC and Alcohol 1 (Fig. 1a and b).
These results were unexpected, since an higher alcohol score, and consequently alcohol intake in terms of frequency and amounts, should determine an increase in body fat, a linear relationship was expected.
As a matter of fact Vagstrand et al. [24] reported a positive correlation between alcohol consumption and BF in females but not in males.
However in people having high BF, other nutrients (e.g., fats and sugars) could be more relevant than alcohol in determining energy intake and consequently fat deposition, thus explaining the quadratic relationship we observed.
Thus at high levels of BF the influence of alcohol consumption could be not highlighted. Moreover it must be considered that the alcohol questionnaire in our study investigated both the amount and the frequency of consumption, thus a high Alcohol 1 score could result by frequent consumption even drinking small amounts.
Differently, in the work of Vagstrad et al. [24] the alcohol consumption was considered as ingested amount expressed not as grams but as percentage of ingested energy.
In order to better understand if these discrepancies could be due to the quantity of alcohol introduced rather than the frequency of consumption, the Alcohol 2 was applied but no significant relationship with BF was found.
This is not in accordance with Vagstrad et al. [24] who found a positive relationship between alcohol intake and BF. However other authors reported a negative raltionship between alcohol intake and body fat in women [25].
Furthermore in literature the relationship between alcohol intake and BMI is mainly J-shaped and not linear. Since BMI and BF are positively related each other, these results suggest that many other factors than ethanol intake could affect BF [25, 26].
Regarding WC, our results are in agreement with the work of Koh-Banerjee et al. [27], where no relations between alcohol scores and WC were reported.
4.5Effect of alcohol and nutrition score on body composition in males
Regarding nutritional knowledge and anthropometic measures, an inverse relationship with BSF and WHR was showed, suggesting that a better nutrition expertise could be involved in the improvement of anthropomethric measures in males (r –0.30, P < 0.05) (Table 7).
Since WHR is a risk factor for type 2 diabetes and cardio-vascular disease, this result supports the effectiveness of education projects aimed to improve nutritional skills and to reduce the risk of chronic diseases.
However a better nutritional knowledge was not related to a reduced alcohol consumption, and this result should be the consequence of being a member of some social groups. As a matter of fact, drinking phenomenon is often implicated in social occasions: drunkness is usually associated to group belonging, uninhibited fun and overcoming shyness and the aperitif habits is seen as an opportunity to spend time with friends [21].
No relations were found among anthropometric measures and alcohol consumption in males. This is in according to Colditz et al., Dallongeville et al. and Randrianjohany et al. [28–30], while Lukasiewicz et al. [25] found an inverse relationship.
5Conclusions
The relations among nutritional knowledge, drinking habits and body composition in a cohort of students from two different study courses were investigated.
No effects of the school course were reported on anthropometric measures, while a relationship was found between school course and nutritional knowledge: as a matter of fact the ALB course provides better information on nutrition than ITAS.
However the students with the highest nutritional competences also consumed more alcohol than the others.
Thus it must be suggested that the nutritional education is not enough to reduce the drinking behavior of adolescents.
Interestingly the effects of alcohol consumption on anthropometric measures were reported only in females regarding BF and HC.
Males showed a higher predisposition than females to binge drinking phenomenon and drunknesses.
Our study had however some limitations. The sample size is smaller than that of national surveys and some factors as dietary intake and physical activity have not been taken into account because they were not included in the aims of the work.
Nevertheless the number of subjects involved in our study allowed us to measure directly the anthropometric indexes, avoiding any problem of accuracy of the self-reported data, differently than in national survey.
Thus our results confirmed that alcohol consumption could be considered as a problem in Italy, but not the only one, also because not even good nutritional knowledges could be enough to counteract the social aspects of drinking.
Additional strategies should be improved to reduce the drinking behaviors among students and alternative ways of social entertainment should be proposed.
Acknowledgments
Adriana Santoro
References
[1] | World Health Organization. The problem of overweight and obesity. Obesity: Preventing and managing the global epidemic WHO technical Report Series (2000) . Series 894: ;5–37. |
[2] | Herrera BM , Keildson S & Lindgren CM. Genetics and epigenetics of obesity. Maturitas. (2011) ;69: :41–49. |
[3] | Grucza RA , Krueger RF , Racette SB , et al. The emerging link between alcoholism risk and obesity in the United States. Arch Gen Psychiatry. (2010) ;67: :1301–1308. |
[4] | Yeomans MR . Alcohol, appetite and energy balance: Is alcohol intake a risk factor for obesity? Physiol Behav. (2010) ;100: :82–89. |
[5] | Sun K , Ren M , Liu D , et al. Alcohol consumption and risk of metabolic syndrome: A meta-analysis of prospective studies. Clin Nutr. (2014) ;33: :596–602. |
[6] | Suter PM , Hasler E , Vetter W . Effects of alcohol on energy metabolism and body weight regulation: Is alcohol a risk factor for obesity? Nutr Rev. (1997) ;55: :157–171. |
[7] | Yeomans MR , Caton S , Hetherington MM . Alcohol and food intake. Curr Opin Clin Nutr Metab Care. (2003) ;6: :639–644. |
[8] | Yeomans MR . Effects of alcohol on food and energy intake in human subjects: Evidence for passive and active over- consumption of energy. Br J Nutr. (2004) ;92: :S31–S34. |
[9] | Westerterp KR , Prentice AM , Jequier E . Alcohol and body weight. In: McDonald I., (ed). Health Issues Related to Alcohol Consumption. Blackwell Science Ltd: London. (1999) 103–123. |
[10] | Lahti-Koski M , Pietinen P , Helioövaara M , et al. Associations of body mass index and obesity with physical activity, food choices, alcohol intake, and smoking in the 1982–1997 FINRISK Studies. Am J Clin Nutr. (2002) ;75: :809–817. |
[11] | Suter PM . Alcohol, nutrition and health maintenance: Selected aspects. Proc Nutr Soc. (2004) ;63: :81–88. |
[12] | Sayon-Orea C , Martinez-Gonzalez MA , Bes-Rastrollo M . Alcohol consumption and body weight: A systematic review. Nutr Rev. (2011) ;69: :419–431. |
[13] | Istituto Nazionale di Statistica-ISTAT Report 2013 L’uso e l’abuso di alcol in Italia (2014) . |
[14] | Durnin JVGA , Womersley J . Body fat assessed from total body density and its estimation from skinfold thickness. Measurements on 481 men and women aged from 17 to 72 years. Br J Nutr. (1974) ;32: :77–97. |
[15] | StatisticalAnalytical System, 2010. SAS/SAT guide for personal computers, version 9.3. SAS Institute Inc., Cary, NC, USA. |
[16] | Proper KI , Cerin E , Brown WJ , et al. Sitting time and socio-economic differences in overweight and obesity. Int J Obes. (2007) ;31: :169–176. |
[17] | Skrzypczak M , Szwed A , Pawlinska-Chmara R , et al. Body mass index, waist to hip ratio and waist/height in adult Polish women in relation to their education, place of residence, smoking and alcohol consumption. Homo. (2008) ;59: :329–342. |
[18] | Gallus S , Colombo P , Scarpino V , et al. Overweight and obesity in Italian adults 2004, and an overview of trends since 1983. Eur J Clin Nutr. (2006) ;60: (10), 1174–1179. |
[19] | STAT Stili di vita e condizioni di salute. Indagine multiscopo sulle famiglie “Aspetti della vita quotidiana”, Rome, (2005) . |
[20] | Croezen S , Visscher TLS , ter Bogt NCW , et al. Skipping breakfast, alcohol consumption and physical inactivity as risk factors for overweight and obesity in adolescents: Results of the E-MOVO project. European Journal of Clinical Nutrition. (2009) ;63: :405–412. |
[21] | Chiassai S , Ferrara G , Francalanci C , et al. The aperitif: An investigation into young people’s relationship with alcohol. Mediterr J Nutr Metab. (2010) ;3: :127–132. |
[22] | Cranford JA , McCabe SE , Boyd CJ . A new measure of binge drinking: Prevalence and correlates in a probability sample of undergraduates. Alcohol Clin Exp Res. (2006) ;30: :1896–1905. |
[23] | Wechsler H , Dowdall GW , Davenport A , et al. Correlates of college student binge drinking. Am J Public Health. (1995) ;85: :921–926. |
[24] | Vågstrand K , Barkeling B , Forslund HB , et al. Eating habits in relation to body fatness and gender in adolescents— results from the “SWEDES” study. Eur J Clin Nutr. (2007) ;61: :517–525. |
[25] | Lukasiewicz E , Mennen LI , Bertrais S , et al. Alcohol intake in relation to body mass index and waist-to-hip ratio: The importance of type of alcoholic beverage. Public Health Nutr. (2004) ;8: :315–320. |
[26] | Tolstrup JS , Halkjaer J , Heitmann BL , et al. Alcohol drinking frequency in relation to subsequent changes in waist circumference. Am J Clin Nutr. (2008) ;87: :957–963. |
[27] | Koh-Banerjee P , Chu NF , Spiegelman D , et al. Prospective study of the association of changes in dietary intake, physical activity, alcohol consumption, and smoking with 9-y gain in waist circumference among 16 587 US men. Am J Clin Nutr. (2003) ;78: :719–727. |
[28] | Colditz GA , Giovannucci E , Rimm EB , et al. Alcohol intake in relation to diet and obesity in women and men. Am J Clin Nutr. (1991) ;54: :49–55. |
[29] | Dallongeville J , Marecaux N , Ducimetie‘re P , et al. Influence of alcohol consumption and various beverages on waist girth and waist-to-hip ratio in a sample of French men and women. Int J Obes Relat Metab Disord. (1998) ;22: :1178–1183. |
[30] | Randrianjohany A , Balkau B , Cubeau J , et al . The relationship between behavioural pattern, overall and central adiposity in a population of healthy French men. Int J of Obes Relat Metab Dis. (1993) ;17: :651–5. |
Figures and Tables
Fig.1
a. Mean body fat percentage (BF) according to quartiles of alcohol score in women. (b) Mean hips circumferences (HC) according to quartiles of alcohol score in women.
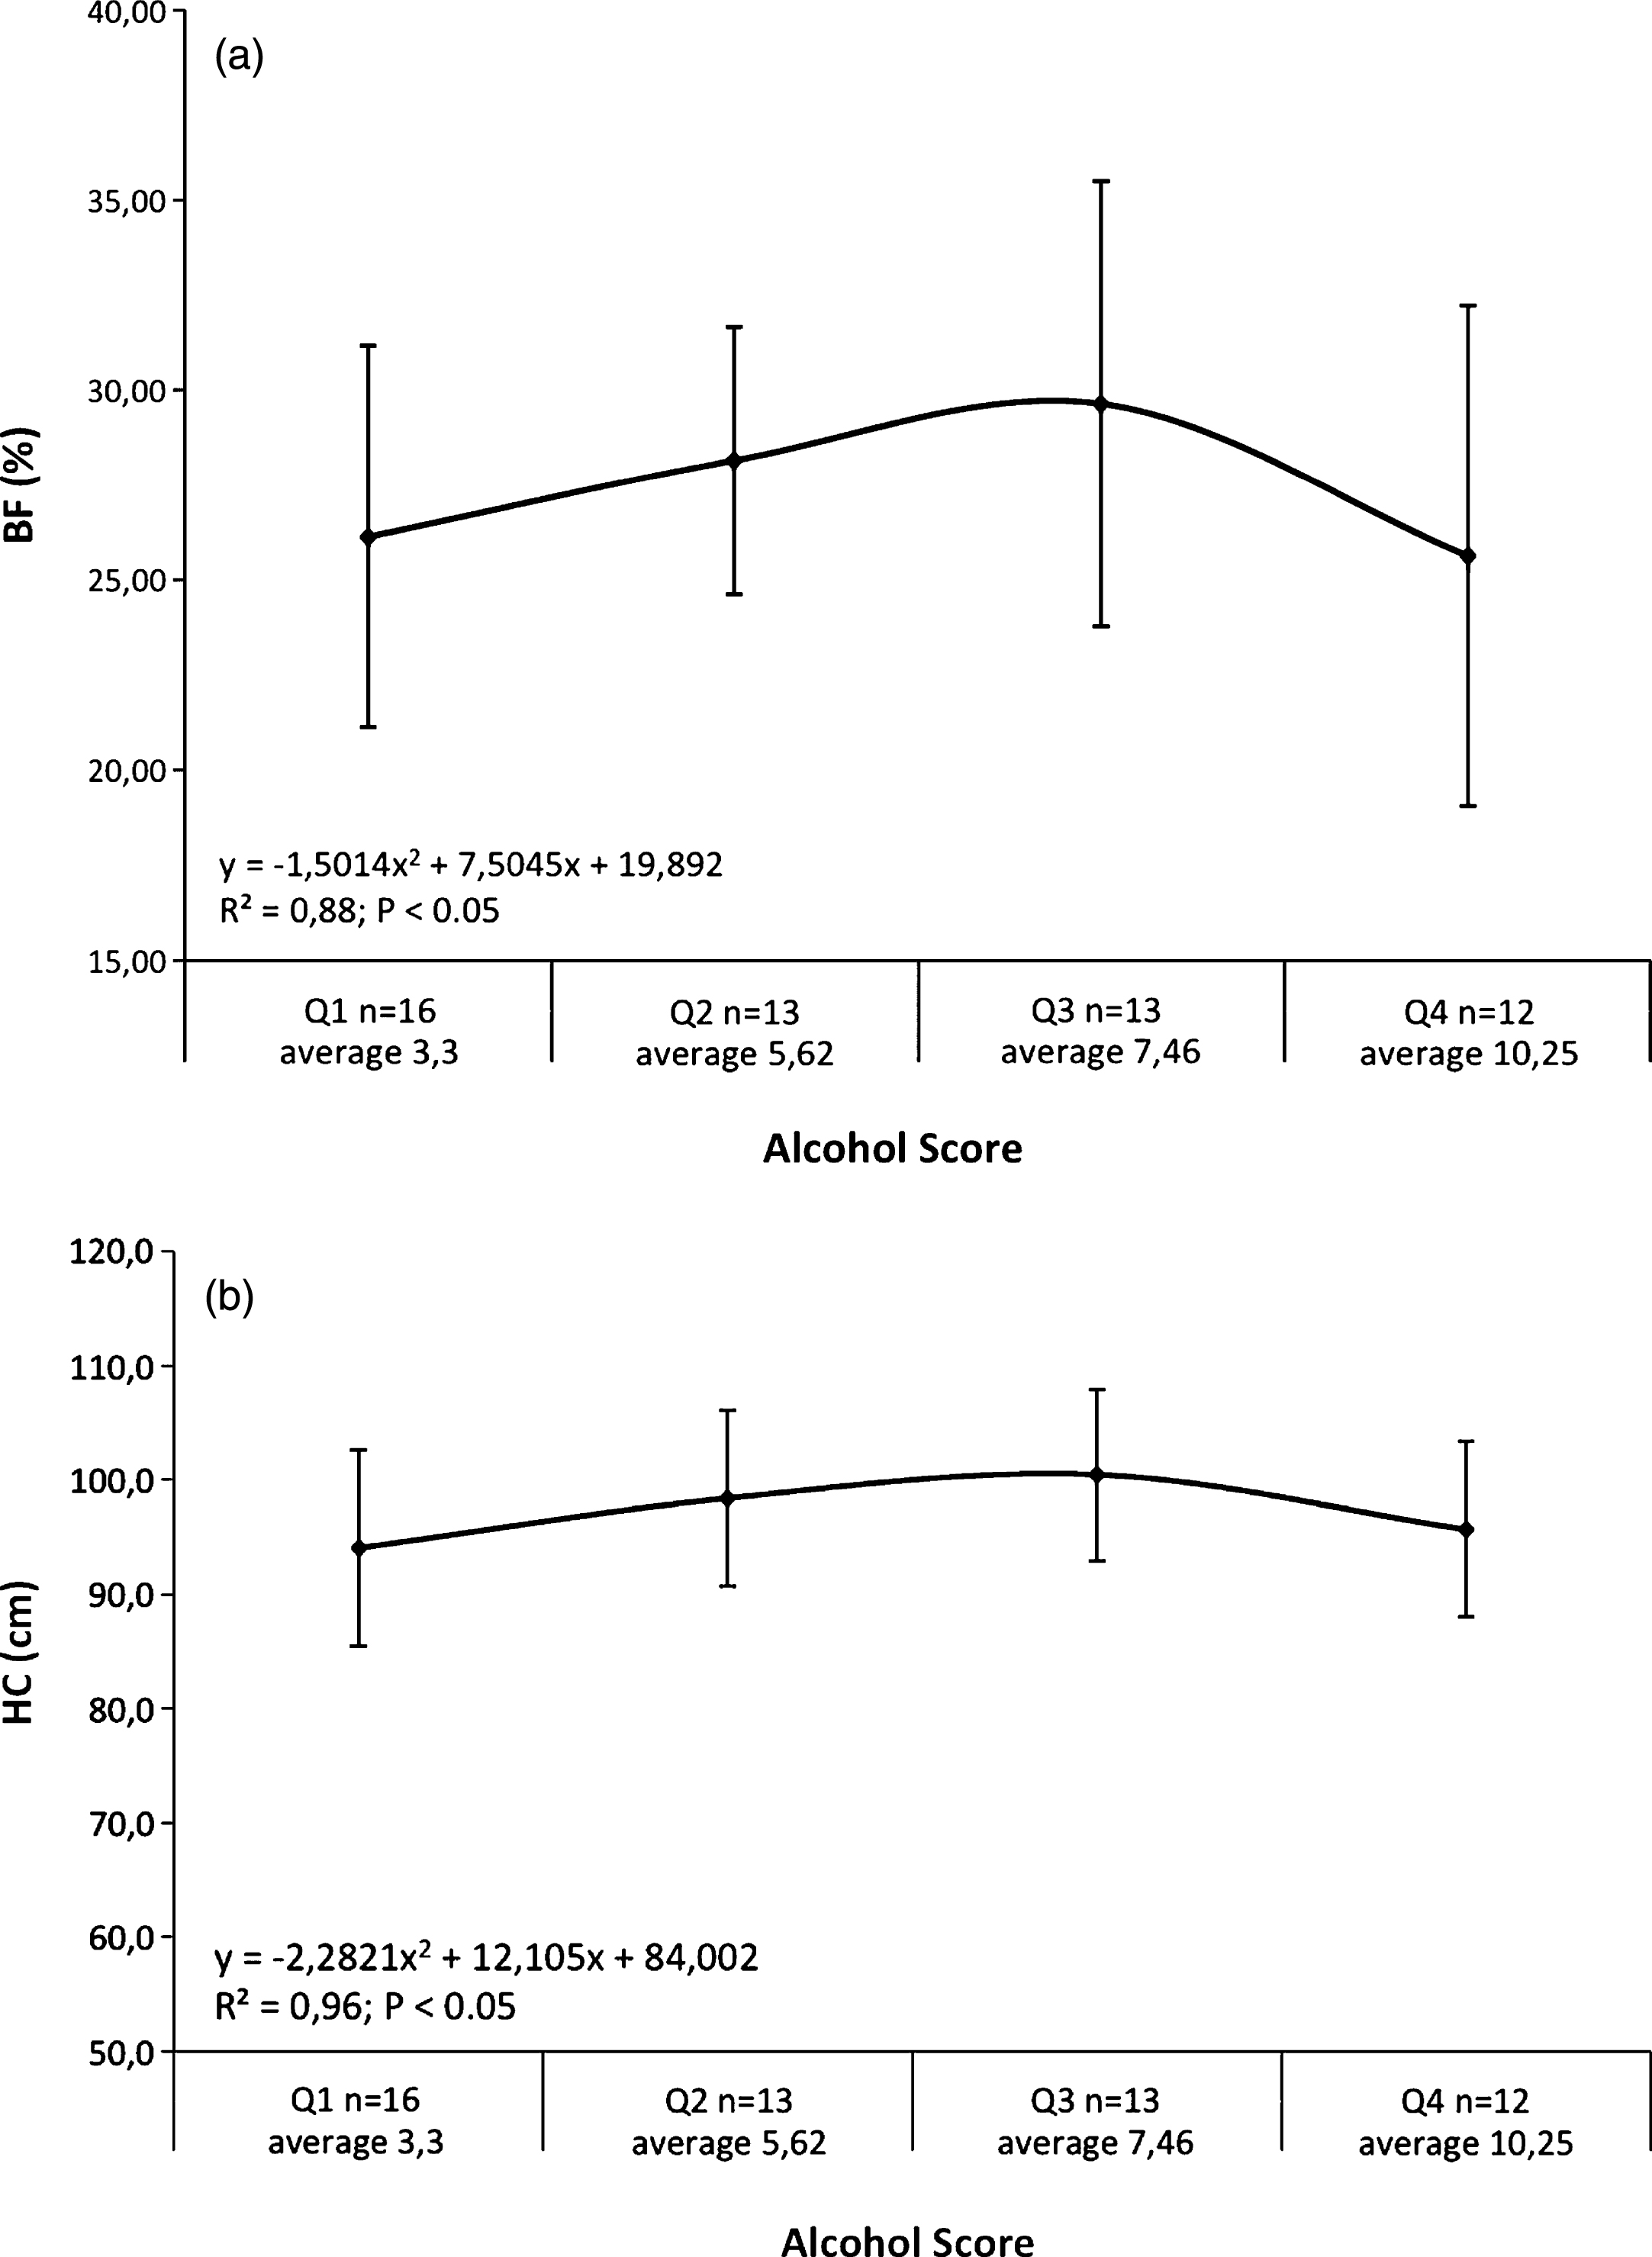
Table 1
Questionnaire on alcohol consumption: scores related to each question and subjects results
| Score | Males | Females | P | |||
| (max. 17) | n | % | n | % | ||
| Q 1. How often do you drink alcohol? | ||||||
| Several times a week | 0 | 8 | 14.29 | 3 | 5.56 | ns |
| At least once a week | 1 | 18 | 32.14 | 14 | 25.93 | ns |
| At least once a month | 2 | 9 | 16.07 | 16 | 29.63 | ns |
| Rarely (2/3 times a year) | 3 | 15 | 26.79 | 15 | 27.78 | ns |
| Never | 4 | 6 | 10.71 | 6 | 11.11 | ns |
| Q 2. How often do you drink much alcohol at one time? | ||||||
| Often | 0 | 10 | 17.86 | 0 | 0 | <0.01 |
| Sometimes | 1 | 15 | 26.79 | 10 | 18.52 | ns |
| Rarely | 2 | 14 | 25.00 | 26 | 48.15 | <0.05 |
| Never | 3 | 17 | 30.36 | 18 | 33.33 | ns |
| Q 3. How often have you been drunk? | ||||||
| Often | 0 | 9 | 16.07 | 0 | 0 | <0.01 |
| Sometimes | 1 | 16 | 28.57 | 10 | 18.52 | ns |
| Rarely | 2 | 12 | 21.43 | 12 | 22.22 | ns |
| Never | 3 | 19 | 33.93 | 32 | 59.26 | <0.01 |
| Q 4. How much do you drink in an aperitif? | ||||||
| Nothing | 4 | 6 | 10.71 | 5 | 9.26 | ns |
| 1 glass | 3 | 30 | 53.57 | 35 | 64.81 | ns |
| 2 glasses | 2 | 15 | 26.79 | 14 | 25.93 | ns |
| 3 glasses | 1 | 2 | 3.57 | 0 | 0 | ns |
| More than 3 glasses | 0 | 3 | 5.36 | 0 | 0 | ns |
| Q 5. Do you usually eat something during an aperitif? | ||||||
| Yes | 1 | 29 | 51.79 | 28 | 51.85 | ns |
| Yes, a lot | 2 | 18 | 32.14 | 16 | 29.63 | ns |
| No | 0 | 9 | 16.07 | 10 | 18.52 | ns |
| Q 6. Do you have dinner after an aperitif? | ||||||
| Yes | 1 | 46 | 82.14 | 44 | 81.48 | ns |
| No | 0 | 10 | 17.86 | 10 | 18.52 | ns |
Table 2
Nutritional questionnaire with scores related to each question
| Q1. How many kcal are introduced by 1 g of alcohol ? | |
| 4 kcal | 0 |
| 5kcal | 0 |
| 7kcal | 1 |
| 9kcal | 0 |
| Q2. How many kcal are provided by 1 g of fat ? | |
| 4 kcal | 0 |
| 5kcal | 0 |
| 7kcal | 0 |
| 9kcal | 1 |
| Q3. How many kcal are provided by 1 g of carbohydrates? | |
| 4 kcal | 1 |
| 5 kcal | 0 |
| 7 kcal | 0 |
| 9 kcal | 0 |
| Q4. Which ones of these vitamins are soluble in fat? | |
| A | 1 |
| D | 1 |
| B group | 0 |
| C | 0 |
| Q5. Indicate what is the correct sequence in order of increasing energy content of food | |
| Walnuts, pork chop, apple, whole bread. | 0 |
| Apple, whole bread, walnuts, pork chop. | 1 |
| Apple, pork chop, whole bread, walnuts. | 0 |
| Q6. Which one contains more trans fat? | |
| Butter | 0 |
| Margarine | 1 |
| Q7. The main component of potatoes is: | |
| Starch | 1 |
| Proteins | 0 |
| Fiber | 0 |
| Q8. Weight for weight, who has more calories between oil and butter? | |
| Oil | 1 |
| Butter | 0 |
| Q9. The whole cereal consumption, that are a great source of fiber: | |
| Helps against intestinal cancer growth | 1 |
| Reduces the risk of kidney stones | 0 |
| Nothing of what reported above | 0 |
| Q10. The main source of essential Omega-3 fatty acids is: | |
| Extra-virgin olive oil | 0 |
| Fish | 1 |
| Whole cereals | 0 |
| Fruits | 0 |
| Q11. Fresh fruits is a basic source of: | |
| Starch | 0 |
| Fatty acids | 0 |
| Vitamins | 1 |
| Cholesterol | 0 |
| Q12. Meat proteins, if compared to vegetable ones, are: | |
| Better | 1 |
| Worse | 0 |
| The same | 0 |
| Q13. Cholesterol can be found: | |
| Only in animal-derived food | 1 |
| Only in foods rich in lipids | 0 |
| In all foods | 0 |
| Q14. Nutritional indications suggest to eat fruits and vegetable: | |
| 2-4 times/day | 1 |
| 5 times/day | 0 |
| Away from the main courses | 0 |
| Q15. Indicate which one of these foods contains more fiber | |
| Fruit | 0 |
| Not-whole cereals | 0 |
| Legumes | 1 |
Table 3
Effect of school course and sex on anthropometric measures
| ITAS | ALB | P-value | |||||||||
| female | male | female | male | SC | S | SCxS | |||||
| mean | SD | mean | SD | mean | SD | mean | SD | ||||
| BMI | 20.71A | 2.93 | 24.05B | 4.07 | 23.25 | 4.14 | 23.80 | 3.50 | ns | 0.0129 | ns |
| BF (%) | 26.22B | 3.93 | 18.74A | 6.71 | 27.88B | 5.93 | 18.08A | 6.39 | ns | 0.0001 | ns |
| WC (cm) | 71.92A | 6.74 | 83.16B | 11.79 | 77.84 | 10.26 | 81.72 | 10.16 | ns | 0.0004 | ns |
| HC (cm) | 94.31 | 6.16 | 96.83 | 8.06 | 98.24 | 8.65 | 95.75 | 6.71 | ns | ns | ns |
| WHR | 0.76A | 0.05 | 0.85B | 0.06 | 0.79A | 0.05 | 0.85B | 0.07 | ns | 0.0001 | ns |
ITAS, Technical School I.T.A.S Raineri-Marcora. ALB, Professional School Alberghiero Raineri-Marcora. BMI, body mass index. BF, body fat mass. CW, waist circumference. CH, hips circumference. WHR, waist/hips ratio. SC, school course effect. PROC GLM was applied for means comparison ITAS vs ALB. S, sex effect. PROC GLM was applied for means comparison: males vs females. A,BMale and female values within school with unlike superscripts letters were significantly different (P < 0.01).
Table 4
Effect of sex on anthropometric measures
| ITAS | ALB | Total | ||||||
| female | male | female | male | female | male | χ2 | ||
| Underweight | n | 5 | 3 | 2 | 0 | 7 | 3 | ns |
| % | 29.41 | 8.82 | 5.41 | – | 12.96 | 5.26 | ||
| Normal weight | n | 11 | 20 | 25 | 13 | 36 | 33 | ns |
| % | 64.71 | 57.14 | 67.57 | 59.09 | 66.67 | 57.89 | ||
| Overweight | n | 1 | 7 | 8 | 9 | 9 | 16 | ns |
| % | 5.88 | 20.00 | 21.62 | 40.91 | 16.67 | 28.07 | ||
| Obesity | n | 0 | 5 | 2 | 0 | 2 | 5 | ns |
| % | – | 14.29 | 5.41 | – | 3.7 | 8.77 | ||
ITAS, Technical School I.T.A.S Raineri-Marcora. ALB, Professional School Alberghiero Raineri-Marcora.
Table 5
Alcohol and Nutritional questionnaire mean scores (ALCOHOL 1 and NUTRI) of subjects divided for sex and school course
| ITAS | ALB | P-value | |||||
| female | male | female | male | SC | S | SCxS | |
| Alcohol 1 | 5.94 | 7.09 | 6.62 | 9.64 | 0.0232 | 0.0037 | ns |
| NUTRI | 7.00 | 7.50 | 9.24 | 9.41 | <0.0001 | ns | ns |
ITAS, Technical School I.T.A.S Raineri-Marcora. ALB, Professional School Alberghiero Raineri-Marcora. SC, school course effect. PROC GLM was applied for means comparison ITAS vs ALB. S, sex effect. PROC GLM was applied for means comparison: males vs females.
Table 6
Linear correlations between female sex and anthropometric measures
| BMI | TSF | BSF | SSSF | SISF | BF | WC | HC | WHR | NUTRI | ALCOHOL1 | ALCOHOL2 | |
| BMI | . | 0.505** | 0.735** | 0.790** | 0.782** | 0.811** | 0.880** | 0.896** | 0.405** | –0.032 | 0.131 | –0.180 |
| TSF | . | 0.661** | 0.559** | 0.571** | 0.745** | 0.403** | 0.576** | 0.025 | –0.180 | –0.046 | –0.026 | |
| BSF | . | 0.731** | 0.661** | 0.815** | 0.672** | 0.704** | 0.293** | –0.159 | 0.092 | –0.110 | ||
| SSSF | . | 0.859** | 0.913** | 0.785** | 0.742** | 0.429** | –0.173 | 0.016 | –0.034 | |||
| SISF | . | 0.941** | 0.718** | 0.719** | 0.338** | –0.110 | 0.028 | –0.094 | ||||
| BF | . | 0.744** | 0.789** | 0.305** | –0.148 | –0,002 | –0.057 | |||||
| WC | . | 0.825** | 0.656** | 0.005 | 0.118 | –0.190 | ||||||
| HC | . | 0.199** | –0.068 | 0.203 | –0.263* | |||||||
| WHR | . | 0.123 | –0.065 | –0.045 | ||||||||
| NUTRI | . | 0.162 | 0.048 |
TSF, Triceps skinfold. BSF, Biceps skinfold SSSF, Subscapolar skinfold SISF, Supra iliac skinfold BF, Body fat mass WC, Waist circumference HC, Hips circumference WHR, Waist/Hips ratio. NUTRI, nutritional questionnaire. ALCOHOL 1, alcohol questionnaire (all questions). ALCOHOL 2, alcohol questionnaire (scores from Q1+Q2+Q3+Q4). **P < 0.001 *P < 0.05.
Table 7
Linear correlations between male sex and anthropometric measures
| BMI | TSF | BSF | SSSF | SISF | BF | WC | HC | WHR | NUTRI | ALCOHOL1 | ALCOHOL2 | |
| BMI | . | 0.772** | 0.780** | 0.862** | 0.873** | 0.881** | 0.927** | 0.911** | 0.638** | –0.179 | –0.086 | –0.071 |
| TSF | . | 0.766** | 0.764** | 0.868** | 0.915** | 0.771** | 0.765** | 0.472** | –0.230 | –0.082 | –0.082 | |
| BSF | . | 0.683** | 0.752** | 0.793** | 0.778** | 0.798** | 0.492** | –0.331* | –0.080 | –0.890 | ||
| SSSF | . | 0.857** | 0.891** | 0.879** | 0.824** | 0.651** | –0.127 | –0.180 | –0.166 | |||
| SISF | . | 0.962** | 0.881** | 0.834** | 0.628** | –0.184 | –0.174 | –0.174 | ||||
| BF | . | 0.887** | 0.860** | 0.596** | –0.177 | –0.140 | –0.145 | |||||
| WC | . | 0.896** | 0.784** | –0.227 | –0.170 | –0.163 | ||||||
| HC | . | 0.469** | –0.148 | –0.146 | –0.148 | |||||||
| WHR | . | –0.260* | –0.160 | –0.143 | ||||||||
| NUTRI | . | –0.004 | –0.047 |
TSF, Triceps skinfold. BSF, Biceps skinfold SSSF, Subscapolar skinfold SISF, Supra iliac skinfold BF, Body fat mass WC, Waist circumference HC, Hips circumference WHR, Waist/Hips ratio. NUTRI, nutritional questionnaire. ALCOHOL 1, alcohol questionnaire (scores from all questions). ALCOHOL 2, alcohol questionnaire (scores from Q1+Q2+Q3+Q4). **P < 0.001. *P < 0.05.


