
Osteocalcin is a predictor for diabetes mellitus in postmenopausal women and correlated with oral intake of vitamin k
Abstract
BACKGROUND:
Osteocalcin (OC) has been suggested as a regulator of glucose metabolism. OC function and secretion depends on its carboxylation, which is a vitamin K dependent process.
OBJECTIVE:
A total of 205 non-diabetic postmenopausal women (fasting plasma glucose (FPG) <126 mg/dl) were enrolled in this study.
METHOD:
We investigated the correlation of OC and oral intake of vitamin K with incidence of type 2 diabetes mellitus (T2DM) in a prospective population-based study in 205 non-diabetic postmenopausal women (FPG <126 mg/dl). We measured OC, bone turn over markers, cardiovascular risk factors, components of metabolic syndrome and oral intake of vitamin D & K at the beginning of the study and followed these patients for five years to check development of T2DM.
RESULTS:
In multiple logistic regression analysis, low (<9.1) vs high (>11.6) OC level had a significant odds ratio (OR) for incidence of T2DM (OR: 2.89 with P-value: 0.038). Serum triglyceride (TG) ≥150 mg/dl (OR 2.983) and FPG 1 ≥100 mg/dl (OR: 9.881) had significant P-values for incidence of diabetes as well. However, other components of metabolic syndrome, such as Waist to Hip ratio (WHR) ≥0.9 and Body Mass Index (BMI) ≥30 had lower OR without significant P-values. Postmenopausal women who developed diabetes mellitus had significantly lower intake of vitamin K.
CONCLUSION:
OC is potentially able to predict incidence of diabetes mellitus better than the components of metabolic syndrome (except for FPG ≥100 mg/dl and TG >150 mg/dl). Lower incidence of diabetes in participants with higher oral intake of vitamin K may indicate that adequate levels of vitamin K lead to better function and secretion of OC, resulting in prevention of diabetes mellitus; future interventional studies using vitamin K supplementation will be needed to definitively determine this.
Abbreviations
OC | osteocalcin |
cOC | carboxylated osteocalcin |
ucOC | uncarboxylated osteocalcin |
OR | odd ratio |
DM | diabetes mellitus |
T2DM | type 2 diabetes mellitus |
BP | Blood pressure |
WC | waist circumference |
WHR | Waist to Hip ratio |
BMI | Body Mass Index |
HC | hip circumference |
WHeR | waist to height ratio |
FPG | fasting plasma glucose |
TC | serum total cholesterol |
HDL-C | serum high-density lipoprotein |
TG | serum triglyceride |
LDL-C | Serum low-density lipoprotein |
OPG | serum osteoprotegerin |
RANKL | receptor activator of nuclear factor-κB ligand |
CTX- I | serum C-terminal telopeptides of type I collagen |
FFQ | validated food frequency questionnaire |
1Introduction
There is increasing evidence that bone cells, including osteocytes and osteoblasts, play a role in regulating energy metabolism. Several studies have shown that bone may regulate glucose and lipid metabolism in a biofeedback loop [1, 2]. The osteoblast-derived hormone, osteocalcin (OC), may play an important role in this process. The bone γ-carboxyglutamate protein (BGLAP) gene is expressed in osteoblasts and is regulated by physiological and pathological processes (such as growth factors, hormones, cytokines and physical stimuli). OC is the product of BGLAP gene and is produced and secreted in two forms: carboxylated OC (cOC) and undercarboxylated OC (ucOC). OC has a primary role in the regulation of bone remodeling, is a marker of differentiated osteoblast, increases β-cell proliferation, improves insulin expression and release, increases expression and secretion of adiponectin, improves insulin sensitivity, decreases fat mass, decreases liver steatosis, and increases muscle mass and mitochondria proliferation [1–4]. In type 2 diabetic patients, its correlation with fasting plasma glucose (FPG), fat mass [5], insulin sensitivity, insulin secretion [6], glucose metabolism, atherosclerosis parameters [7], and glycemic variability [8] has been demonstrated.
OC carboxylation is a vitamin K dependent process; varying levels of vitamin K in bone influence the amount of OC that is carboxylated. Studies have shown that oral intake of vitamin K affects the ucOC/OC ratio [9]. Low intake of vitamin K increases ucOC/OC ratio while phylloquinone supplementation reduces that ratio. Warfarin treatment in rats reduces cOC while increasing ucOC [9–12]. These findings suggest that oral intake of vitamin K may influence OC production as well. Additionally, cOC might be an indicator of vitamin K status. Human diets contain varying amounts of vitamin K; changes in vitamin K levels can be achieved by altering oral intake of vitamin K in a short period of time [10].
In this longitudinal prospective study, postmenopausal non-diabetic women were followed for 5 years. OC levels of patients who developed diabetes mellitus were compared with those who did not develop the disease as a means to further investigate the potential use of serum OC as a biomarker in predicting development of diabetes mellitus. Postmenopausal women with a consistent population of bone markers were selected. We hypothesized that postmenopausal women with lower OC levels were more likely to manifest type 2 diabetes mellitus (T2DM) over the five year follow-up period, independent of body mass index, FPG, other components of metabolic syndrome and unrelated bone turn over markers. We also hypothesized that higher oral intake of vitamin K would be associated with higher OC levels and lower incidence of developing T2DM.
2Materials and methods
2.1Study population
Details of the Iranian Multicenter Osteoporosis Study (IMOS) have been described in our previous studies [13, 14]. A population-based sample of 205 community-dwelling and generally healthy postmenopausal women in Bushehr metropolitan area participated in the study; they were recruited through radio and TV advertisement. The study participants completed an educational course about osteoporosis and associated risk factors in the Persian Gulf Tropical Medicine Research Center of Bushehr University of Medical Sciences and after obtaining informed consent, they were enrolled for sampling and study procedures (after getting permission from IMOS group, we investigated the same population). Women were excluded with: (1) Generalized bone diseases (such as hyper/hypoparathyroidism, thyroid disorders, rheumatoid arthritis, Cushing disease, and steroid-induced osteoporosis; renal osteodystrophy; or other metabolic disorders); (2) history of malignant diseases; (3) drug addiction; (4) restriction to bed rest; (5) liver or renal disease (values ≥2×upper limit of normal for total bilirubin, aspartate aminotransferase, alanine aminotransferase, gamma-glutamyl trans-peptidase, alkaline phosphatase, lactate dehydrogenase, urea, creatinine, and uric acid); (6) use of medications influencing bone metabolism such as bisphosphonate, sex hormones, etc. (excluding calcium and vitamin D supplementation); (7) use of particular type of diet which affects body weight, blood glucose or bone metabolism; (8) FPG ≥126 mg/dl or taking anti-diabetic drugs (oral hypoglycemic agents or insulin sensitizers). We measured other bone markers such as receptor activator of nuclear factor-κB ligand, serum C-terminal telopeptides of type I collagen, serum osteoprotegerin, and serum alkaline phosphatase to rule out disorders with high or low bone turnover markers.
At the beginning of the study, a complete physical examination was performed, and medical history and lifestyle factors, such as smoking and alcohol consumption, were ascertained. Demographic information, medical history, medications, diet, and other conditions that may affect bone mass and metabolism were collected by a questionnaire from all participants.
2.2Anthropometric measurements
Anthropometric measurements were taken at the beginning of the study and then again, 5 years later. Body measurements such as weight (in kilograms), height (in meters), waist circumference (WC) (the narrowest part, in centimeters, between the iliac crest and the lateral costal margin) and hip circumference (HC) (the maximum value, in centimeters, over the buttocks, usually at greater trochanter) were measured. Body mass index (BMI), waist to hip ratio (WHR) and waist to height (WHeR) ratio were calculated.
Blood pressure (BP) was determined 2 times by using a standard mercury sphygmomanometer on the right arm and after 15 minutes of rest in the sitting position. History of hypertension, BP ≥130/85 on exam or use of antihypertensive drugs qualified the patients as having hypertension.
2.3Assays
All samples were drawn from participants at the beginning of the study and after a 5 year follow-up period. Blood was obtained in the morning after 12–14 hours of fast. All samples were rapidly centrifuged and serum separated, and the analyses were performed at the Persian Gulf Health Research Center on the day of blood collection (using Selectra 2 autoanalyzer, Vital Scientific, Spankeren, Netherland). We used similar methods of measurement for items such as blood glucose, serum total cholesterol (TC), serum high-density lipoprotein (HDL-C) and serum triglyceride (TG), by using commercial kits (Pars Azmun Inc., Tehran, Iran). Serum low-density lipoprotein (LDL-C) was determined by using the Friedewald formula. In participants with serum TG concentration of more than 400 mg/dl LDL-C, calculation of LDL-C was not performed [13]. The measurement of C-reactive protein (CRP) by a high-sensitivity (hs) CRP assay and hs-CRP enzyme-linked immunosorbent assay (ELISA) (DRG Instruments GmbH, Germany) was used. The minimum detectable concentration of the hs-CRP was 0.1 mg/l; the functional sensitivity was 0.1 mg/l (Interassay coefficient of variation (CV) <20% ). An ELISA commercial kit (Biomedica Gruppe, Vienna, Austria) was used to measure serum osteoprotegerin (OPG) levels. The detection limit of the assay was 0.14 pmol/l. The mean intra- and interassay CVs of the OPG assay were 4–10 and 7–8% , respectively.
ELISA with an additional enhancement system (ampli-sRANKL; Biomedica Gruppe, Vienna, Austria) was used to measure the receptor activator of nuclear factor-κB ligand (RANKL) levels. The detection limit of the assay was 0.4 pg/ml. The mean intra- and interassay CVs of the RANKL assay were 8–9 and 6–3% , respectively. The N-MID Osteocalcin ELISA (Nordic Bioscience Diagnostics A/S, Herlev, Denmark) was used for the quantitative measurement of OC. The intra-assay CVs for the low (7.0 ng/ml), medium (21.8 ng/ml), and high (43.2 ng/ml) values were 3.4, 2.0, and 2.4% , respectively.
The serum C-terminal telopeptides of type I collagen (CTX- I) ELISA (Nordic Bioscience Diagnostics A/S, Herlev, Denmark) was used for the quantification of degradation products of C-terminal telopeptides of type I collagen. The intra-assay CVs for low (0.242 ng/ml), medium (0.375 ng/ml), and high (0.476 ng/ml) values were 5.4, 5.0, and 5.1% , respectively.
Serum alkaline phosphatase was measured by spectrophotometry using p-nitrophenylphosphate as substrate (Pars Azmun Inc., Tehran, Iran with normal level of <240 U/l). Intra- and interassay CVs were 1.5 and 2.6% , respectively.
Dietary intake of vitamin D and K was measured by using a validated food frequency questionnaire (FFQ). The FFQ contained questions on the overall frequency of consumption of 168 food items during the first year of the study enrollment. Reproducibility and relative validity and reliability of the questionnaire for the Tehran Lipid and Glucose study is published elsewhere [15]. Well-trained interviewers collected the dietary data by asking the subjects to determine frequency and amount of consumption for each food item during a period of twelve months on a daily, weekly or monthly basis, and the result was later converted to daily intake. Each food and beverage was analyzed for content of vitamin D and K as well as other nutrients (vitamins and minerals) using nutritionist III software which was modified for Iranian foods. Food items with very low levels of vitamin K and D were disregarded as they had no significant effects on total intake of these vitamins.
2.4Definitions
Enrollment in this study began in 2007. Diabetes mellitus was defined, as either FPG of ≥126 mg/dl or use of anti-diabetic drugs [16].
National Cholesterol Education Program Adult Treatment Panel III criteria were used to allocate the subjects to a certain level of risk according to their TC, TG, HDL-C and LDL-C levels [16]. A participant with BP ≥130/85 or use of antihypertensive drugs was considered hypertensive and central obesity was defined as WHR ≥0.9.
Oral intake of vitamin K and D is reported as microgram per day (μg/d).
2.5Ethics
The Ethics Committee of Bushehr University approved the study protocol and all study participants provided their written informed consent.
2.6Statistics
The Shapiro–Wilk test and probability plots were used to study the distribution of variables. We found that log transformation of OC, hs-CRP, OPG and RANKL, and CTX-I gave a better fit to a Gaussian distribution. The geometric mean for those biochemical variables was defined as the arithmetic mean of the log-transformed data±SD, raised to the power of 10. A two-tailed t test was used to compare the mean values across groups. Pearson correlation analysis was employed to study the relationships between OC with anthropometric measurements, bone turnover markers and biochemical variables. For variables without normal distribution, log-transformed data were used.
Multiple logistic regression analysis was used to determine the odds ratio and the association between low serum OC levels and developing T2DM. In the full model of logistic regression analysis, T2DM was considered as dependent variable and serum OC level (<9.1 versus >11.6) was the independent variable of interest. Age, hs-CRP, OPG, cardiovascular risk factors (according to NCEP-ATP III criteria), and BMI were considered as covariates. A P-value less than 0.05 was considered significant. All statistical analyses were achieved using the PASW Statistics GradPack 21 (SPSS Inc., Chicago, IL, USA).
3Results
The baseline characteristics of the participants are shown in Table 1. All 205 participants that initially enrolled in the study returned for completion. FGP1 was measured to be <100 mg/dl in 138 participants and >100 mg/dl and <126 mg/dl in 67 participants. At the 5 year follow-up, 27 participants (13.17% ) had developed diabetes mellitus. Correlation of logarithm of OC with FPG1 and FPG2 is shown in Fig. 1. The mean age of the study participants were 57.53±6.85. Mean level of OC was 11.69±5.25 ng/ml. We stratified the participants into two groups according to their OC level. The median level of OC in the participants was 10.05 ng/ml. Those with OC levels equal or less than the median were categorized in one group (103 subjects) and those with levels more than median in another group (102 subjects). We compared the parameters between the groups and there were no significant differences in FPG1, BMI, WC, WHR, systolic BP, diastolic BP, TC, LDL-C, HDL-C and OPG (Table 1). Participants with low OC levels were younger and had higher FPG2, TG and hs-CRP levels (Table 1). The subjects with OC higher than median level had higher serum RANKL, RANKL/OPG ratio, CTX-I and alkaline phosphatase levels (Table 1). Participants who had higher osteocalcin levels (>10.05 ng/ml), had higher intake levels of vitamin K and did not develop diabetes, as opposed to those who had lower intake and did develop disease (Tables 1, 2).
Multiple logistic regression models were used to identify how well OC levels could predict future development of T2DM (Tables 3, 4). After categorizing the participants into three groups: Group 1 with OC level <9.1 ng/ml (76 persons), Group 2: OC level between 9.1 and 11.6 ng/ml (58 persons) and Group 3: OC level >11.6 ng/ml (71 persons). The odds ratio of incidence of diabetes mellitus by comparing group 1 (OC <9.1 ng/ml) vs. group 3(OC >11.6 ng/ml) was 2.89 (95% confidence interval 1.06–7.87) with significant P-value (0.038). Comparison of group 1 vs. 3 for TG ≥150 mg/dl (OR 2.983) and FPG 1 ≥100 mg/dl (OR: 9.881) had significant P-value for incidence of diabetes as well, but other components of metabolic syndrome (WC ≥88 cm, HDL-C <50 mg/dl, BP ≥130/85 mmHg), WHR ≥0.9 and BMI ≥30 had lower almost similar OR but with non- significant P-value for future development of diabetes (Table 3). In multiple logistic regression analyses adjusting for the components of metabolic syndrome (FPG1 ≥100 mg/dl, WC ≥88 cm, serum TG ≥150 mg/dl or drug treatment for elevated TG, Serum HDL-C <50 mg/dl or drug treatment for low HDL, BP ≥130/85 mmHg or drug treatment for elevated BP), WHR ≥0.9 and BMI ≥30; low OC level (OC <9.1 vs >11.6 ng/ml) was associated with an odds ratio of 2.5 or more for developing diabetes mellitus (Table 4). However, P-value of this OR for incidence of diabetes was non-significant after adjustment for TG ≥150 mg/dl and WHR ≥0.9 (Table 4). As a result, serum OC remained an independent risk factor for developing diabetes, and better predictor of development of diabetes than the standard indicators of metabolic syndrome, barring those who had FPG ≥100 mg/dl and TG ≥150 mg/dl.
4Discussion
This study considered OC as a potential predictor for development of T2DM. We showed that low OC levels is strongly correlated with incidence of T2DM and was better than several components of the metabolic syndrome, with the exception of FPG ≥100 mg/dl or TG >150 mg/dl, in indicating development of disease (Table 3). Further, we showed that participants with higher oral intake of vitamin K had lower incidence of diabetes mellitus (Table 2).
The mechanisms responsible for the higher incidence of diabetes mellitus in subjects with low serum OC levels are not well understood. OC exerts endocrine regulation of energy metabolism especially through glucose and fat metabolism. The correlation of total serum OC (as a potential regulator of blood glucose) with glucose intolerance and abdominal obesity in postmenopausal women has been shown [13, 17]. A number of findings support a potential reciprocal relationship between OC and glucose metabolism. Serum OC levels were negatively correlated with blood markers of the dysmetabolic phenotype [18]. The association of serum OC level with blood glucose, total adiponectin levels, fat mass, insulin secretion, insulin sensitivity and atherosclerosis parameters, independently of other risk factors of atherosclerosis, has been shown in type 2 diabetic patients [5–7, 19]. On the other hand, some studies indicated that hyperglycemic states can suppress osteoblast function, and blood glucose control may recover attenuated bone turnover and increase OC levels. Patients with T2DM have lower levels of OC, which is found to be higher after treatment. High initial levels of OC were shown to improve glucose variability during treatment [8, 20].
Our study is similar in result to previous studies (Pittas et al.), where higher serum OC levels were associated with lower fasting glucose in adult subjects older than 65 years after a 3 year follow-up period [18]. Ngarmukos et al. in a cohort study following 63 men for 10 years showed that baseline serum OC levels and FGP were independent risk factors for the development of T2DM [21]. To the best of our knowledge, five prospective clinical studies investigated the predictive role of OC in diabetes mellitus development and none of them included this number of postmenopausal women [18, 21–24].
We measured dietary intake of vitamin D and K. Subjects with high serum OC levels (higher than the median) had significantly more vitamin K intake and lower FPG2 (Table 1). In the participants whose FPG2 was less than 126 mg/dl, oral intake of vitamin K was higher than those whose FPG2 was greater than or equal to 126 mg/dl (Table 2). Previous studies have demonstrated that vitamin K supplementation reduced serum ucOC and increased cOC [25, 26], but increased insulin sensitivity by increasing cOC [27, 28] and it seems that cOC rather than ucOC has endocrine function to increase insulin sensitivity. However, other studies showed vitamin K supplementation did not increase OC concentration but reduced concentration and percentage of ucOC in serum [10]. Dietary intake of vitamin K has positive correlation with serum vitamin K (phylloquinone and menaquinone) [9]. Warfarin, a vitamin K antagonist, reduces OC production through inhibition of transcriptional activity of Runx2 pathway [29]. cOC has high affinity for hydroxyapatite, but ucOC has lower affinity to bone and will be secreted in the general circulatory system (2, 3). Participants with lower intake of vitamin K may have lower transcriptional activity of Runx2 on OC gene, or higher production of ucOC which may repress OC gene expression. However, in this study we did not include some factors such as serum concentration of vitamin D and K, physical activity, and calorie intake which can influence OC levels, OC carboxylation, glucose metabolism and incidence of diabetes mellitus [9, 28, 30–32].
Our study has several limitations. In this study, we investigated postmenopausal women and our results cannot be extended to the general population. Another limitation of our study consists of the lack of ability to interpret the correlation of HbA1c and insulin resistance with OC level. Other limitations included lack of measuring insulin, ucOC, and cOC levels; as well the absence of the HOMA index that would be useful in interpreting the predictive role of OC in our subjects. We measured dietary intake of vitamin D and K to explain the role of these vitamins in production and carboxylation of OC, but without measuring ucOC it was difficult to clarify exact role of vitamin D and K with regard to OC secretion and function.
Our population was self-selected postmenopausal women without diabetes mellitus followed for 5 years. Diagnosis of diabetes in our participants was confirmed by measuring FPG (FPG ≥126 mg/dl) and according to the ADA report [33] we have used a less sensitive and more specific method for diagnosing diabetes in comparison to measuring FPG, HbA1c or/and oral glucose tolerance test together. The results of this study with regards to the predictive role of OC for diabetes could be strengthened with the following factors: longer term follow-up, larger number of participants, exclusion of confounding factors, and inclusion of well characterized (generally regarded healthy) postmenopausal women.
5Conclusion
This study showed that low levels of total serum OC are associated with higher incidence of T2DM in postmenopausal women. Furthermore, this study showed that higher intake of vitamin K is associated with higher OC levels, which resulted in reduced incidence of T2DM. Future studies will be important in elucidating the role of cOC versus ucOC in energy metabolism and of the mechanistic relationship between vitamin K and OC in the prevention of T2DM.
Conflicts of interest
Kamyar Asadipooya, Leland Graves, Barbara P. Lukert, Mohammadreza Kalantarhormozi, Majid Assadi, Afshin Ostovar, Bagher Larijani, and Iraj Nabipour declare that they have no conflict of interest.
Authors’ contributions
IN and KA designed study; IN conducted study; IN, KA, MrK, MA, AO, BL collected data; KA analyzed and interpreted data, wrote the article; LG, DcR, BpL, IN Revised manuscript content; KA takes responsibility for the integrity of the data analysis and final content. All authors approved the final version of the manuscript.
Source of funding
This project was supported jointly by grants from Bushehr University of Medical Sciences and Health Services, the Ministry of Health, Tehran Endocrine Research Center, Tehran University of Medical Science and Bushehr Province Research Committee.
Acknowledgments
The authors take this opportunity to express their regards to Dr. Mojtaba Noursalehi for helping them in analyzing the data and preparing the tables and Reza Roohanirad for helping in editing the article. We thank Namrata Gumaste for helpful revision of final manuscript.
References
1 | Lee NK . An evolving integrative physiology: Skeleton and Energy Metabolism. BMB Rep. 43: (9), 579–83. |
2 | Confavreux CB , Levine RL , Karsenty G . A paradigm of integrative physiology, the crosstalk between bone and energy metabolisms. Mol Cell Endocrinol. (2009) ;310: (1-2):21–9. |
3 | Villafán-Bernal JR , Sánchez-Enríquez S , Muñoz-Valle JF . Molecular modulation of osteocalcin and its relevance in diabetes (Review). Int J Mol Med. (2011) ;28: (3):283–93. |
4 | Pi M , Quarles LD . Multiligand specificity and wide tissue expression of GPRC6A reveals new endocrine networks. Endocrinology. (2012) ;153: (5):2062–9. |
5 | Kanazawa I , Yamaguchi T , Yamauchi M , Yamamoto M , Kurioka S , Yano S , Sugimoto T . Serum undercarboxylated osteocalcin was inversely associated with plasma glucose level and fat mass in type 2 diabetes mellitus. Osteoporos Int. (2011) ;22: (1):187–94. |
6 | Kanazawa I , Yamaguchi T , Tada Y , Yamauchi M , Yano S , Sugimoto T . Serum osteocalcin level is positively associated with insulin sensitivity and secretion in patients with type 2 diabetes. Bone. (2011) ;48: (4):720–5. |
7 | Kanazawa I , Yamaguchi T , Yamamoto M , Yamauchi M , Kurioka S , Yano S , Sugimoto T . Serum osteocalcin level is associated with glucose metabolism and atherosclerosis parameters in type 2 diabetes mellitus. J Clin Endocrinol Metab. (2009) ;94: (1):45–9. |
8 | Bao Y-Q , Zhou M , Zhou J , Lu W , Gao Y-C , Pan X-P , et al. Relationship between serum osteocalcin and glycaemic variability in Type 2 diabetes. Clin Exp Pharmacol Physiol. (2011) ;38: (1):50–4. |
9 | Haraikawa M , Tsugawa N , Sogabe N , Tanabe R , Kawamura Y , Okano T , et al. Effects of gamma-glutamyl carboxylase gene polymorphism (R325Q) on the association between dietary vitamin K intake and gamma-carboxylation of osteocalcin in young adults. Asia Pac J Clin Nutr. (2013) ;22: (4):646–54. |
10 | Booth SL , Centi A , Smith SR , Gundberg C . The role of osteocalcin in human glucose metabolism: Marker or mediator? Nat Rev Endocrinol. (2013) ;9: (1):43–55. |
11 | Price PA , Williamson MK , Lothringer JW . Origin of the vitamin K-dependent bone protein found in plasma and its clearance by kidney and bone. J Biol Chem. (1981) ;256: (24):12760–6. |
12 | Malashkevich VN , Almo SC , Dowd TL . X-ray crystal structure of bovine 3 Glu-osteocalcin. Biochemistry. (2013) ;52: (47):8387–92. |
13 | Movahed A , Larijani B , Nabipour I , Kalantarhormozi M , Asadipooya K , Vahdat K , et al. Reduced serum osteocalcin concentrations are associated with type 2 diabetes mellitus and the metabolic syndrome components in postmenopausal women: The crosstalk between bone and energy metabolism. J Bone Miner Metab. (2012) ;30: (6):683–91. |
14 | Nabipour I , Larijani B , Beigi S , Jafari SM , Amiri M , Assadi M , et al. Relationship among insulin like growth factor I concentrations, bone mineral density, and biochemical markers of bone turnover in postmenopausal women: A population-based study. Menopause. (2008) ;15: (5):934–9. |
15 | Azizi F , Rahmani M , Emami H , Mirmiran P , Hajipour R , Madjid M , et al. Cardiovascular risk factors in an Iranian urban population: Tehran lipid and glucose study (phase 1). Soz Praventivmed. (2002) ;47: (6):408–26. |
16 | Expert Committee on the Diagnosis and Classification of Diabetes Mellitus. Report of the Expert Committee on the Diagnosis and Classification of Diabetes Mellitus. Diabetes Care. (1997) ;20: :1183–97. |
17 | Im JA , Yu BP , Jeon JY , Kim SH . Relationship between osteocalcin and glucose metabolism in postmenopausal women. Clin Chim Acta. (2008) ;396: (1-2):66–9. |
18 | Pittas AG , Harris SS , Eliades M , Stark P , Dawson-Hughes B . Association between serum osteocalcin and markers of metabolic phenotype. J Clin Endocrinol Metab. (2009) ;94: (3):827–32. |
19 | Kanazawa I , Yamaguchi T , Sugimoto T . Relationship between bone biochemical markers versus glucose/lipid metabolism and atherosclerosis; a longitudinal study in type 2 diabetes mellitus. Diabetes Res Clin Pract. (2011) ;92: (3):393–9. |
20 | Kanazawa I , Yamaguchi T , Yamauchi M , Yamamoto M , Kurioka S , Yano S , Sugimoto T . Adiponectin is associated with changes in bone markers during glycemic control in type 2 diabetes mellitus. J Clin Endocrinol Metab. (2009) ;94: (8):3031–7. |
21 | Inaba M , Nishizawa Y , Mita K , Kumeda Y , Emoto M , Kawagishi T , et al. Poor glycemic control impairs the response of biochemical parameters of bone formation and resorption to exogenous 1, 25-dihydroxyvitamin D3 in patients with type 2 diabetes. Osteoporos Int. (1999) ;9: (6):525–31. |
22 | Fernández-Real JM , Izquierdo M , Ortega F , Gorostiaga E , Gómez-Ambrosi J , Moreno-Navarrete JM , et al. The relationship of serum osteocalcin concentration to insulin secretion, sensitivity, and disposal with hypocaloric diet and resistance training. J Clin Endocrinol Metab. (2009) ;94: (1):237–45. |
23 | Lee NK , Sowa H , Hinoi E , Ferron M , Ahn JD , Confavreux C , et al. Endocrine regulation of energy metabolism by the skeleton. Cell. (2007) ;130: (3):456–69. |
24 | Ngarmukos C , Chailurkit LO , Chanprasertyothin S , Hengprasith B , Sritara P , Ongphiphadhanakul B . A reduced serum level of total osteocalcin in men predicts development of diabetes in a long term follow up cohort. Clin Endocrinol (Oxf). (2012) ;77: (1):42–6. |
25 | Hwang YC , Jee JH , Jeong IK , Ahn KJ , Chung HY , Lee MK . Circulating osteocalcin level is not associated with incident type 2 diabetes in middle-aged male subjects: Mean 8.4-year retrospective follow-up study. Diabetes Care. (2012) ;35: (9):1919–24. |
26 | Shea MK , Gundberg CM , Meigs JB , Dallal GE , Saltzman E , Yoshida M , et al. Gamma-carboxylation of osteocalcin and insulin resistance in older men and women. Am J Clin Nutr. (2009) ;90: (5):1230–5. |
27 | Bulló M , Moreno-Navarrete JM , Fernández-Real JM , Salas-Salvadó J . Total and undercarboxylated osteocalcin predict changes in insulin sensitivity and β cell function in elderly men at high cardiovascular risk. Am J Clin Nutr. (2012) ;95: (1):249–55. |
28 | Binkley N , Harke J , Krueger D , Engelke J , Vallarta-Ast N , Gemar D , et al. Vitamin K treatment reduces undercarboxylated osteocalcin but does not alter bone turnover, density, or geometry in healthy postmenopausal North American women. J Bone Miner Res. (2009) ;24: (6):983–91. |
29 | Emaus N , Gjesdal CG , Almås B , Christensen M , Grimsgaard AS , Berntsen GK , et al. Vitamin K2 supplementation does not influence bone loss in early menopausal women: A randomised double-blind placebo-controlled trial. Osteoporos Int. (2010) ;21: (10):1731–40. |
30 | Jeong HM , Cho DH , Jin YH , Chung JO , Chung MY , Chung DJ , Lee KY . Inhibition of osteoblastic differentiation by warfarin and 18-α-glycyrrhetinic acid. Arch Pharm Res. (2011) ;34: (8):1381–7. |
31 | Choi HJ , Yu J , Choi H , An JH , Kim SW , Park KS , et al. Vitamin K2 supplementation improves insulin sensitivity via osteocalcin metabolism: A placebo-controlled trial. Diabetes Care. (2011) ;34: (9):e147. |
32 | Yoshida M , Jacques PF , Meigs JB , Saltzman E , Shea MK , Gundberg C , et al. Effect of vitamin K supplementation on insulin resistance in older men and women. Diabetes Care. (2008) ;31: (11):2092–6. |
33 | American Diabetes Association. Diagnosis and Classification of Diabetes Mellitus , Diabetes Care. (2013) ;36: (1):S67–S74. |
Figures and Tables
Fig.1
Scattered platform was used to show the correlation between logarithm of osteocalcin (ng/ml) and FPG (mg/dl) in postmenopausaul women with FPG <126 mg/dl at the beginning of the study (FPG1) and after the 5 year follow-up period (FPG2). OC had no significant correlation with FPG1 (r = –0.039 and P-value = 0.288), but had negative correlation with FPG2 (r = –0.134 and P-value = 0.028). FPG, Fasting Plasma Glucose; OC, osteocalcin.
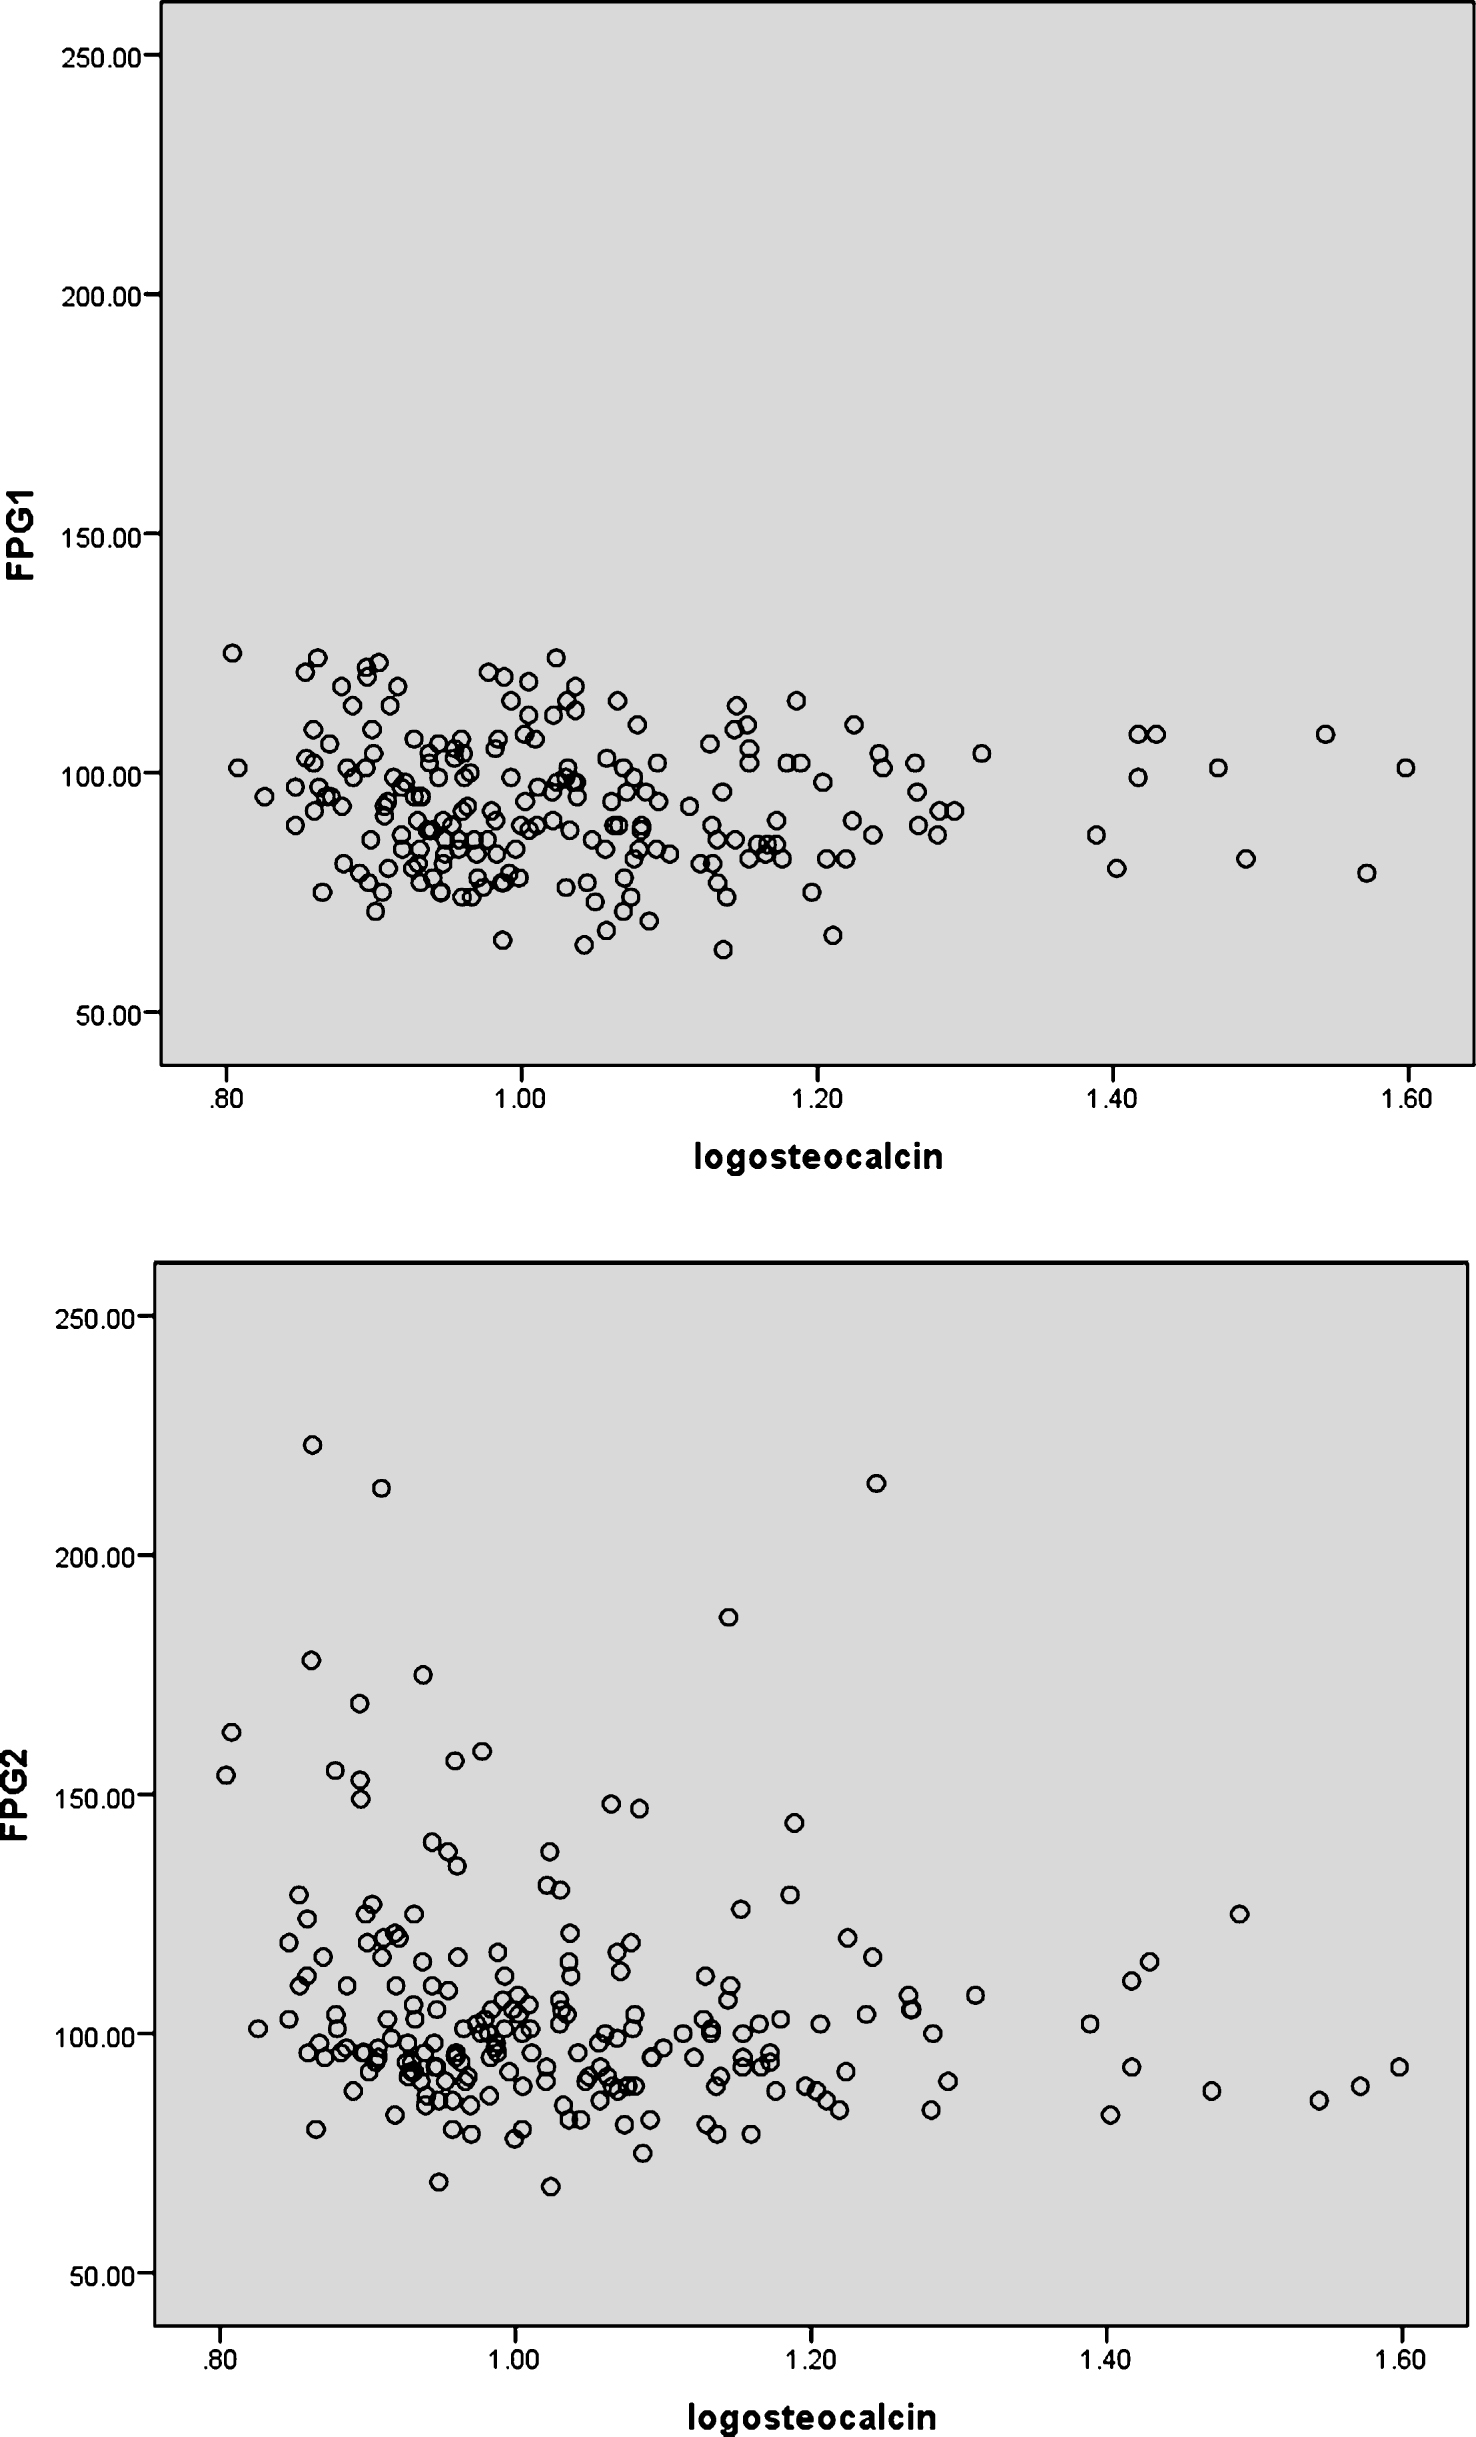
Table 1
Baseline Characteristics of 205 postmenopausal women, stratified by serum osteocalcin below/equal or above median (Osteocalcin median = 10.05 ng/ml), and two-tailed t test was used to compare the mean values across groups
| Variables | All | Serum osteocalcin | Serum osteocalcin | P-value |
| participants | ≤ median (103 subjects) | >median (102 subjects) | ||
| Age, year | 57.53 ± 6.85 | 56.56 ± 5.99 | 58.50 ± 7.53 | 0.0220 |
| Vitamin D μg/day | 38.11 ± 47.01 | 41.43 ± 50.33 | 34.72 ± 43.35 | 0.1354 |
| Vitamin K μg/day | 36.38 ± 175.55 | 26.53 ± 33.95 | 46.41 ± 247.35 | <0.0001 |
| FPG 1 (mg/dl) | 93.51 ± 13.66 | 94.20 ± 13.97 | 92.81 ± 13.37 | 0.6613 |
| FPG 2 (mg/dl) | 105.72 ± 24.46 | 109.66 ± 26.99 | 101.73 ± 21.00 | 0.0112 |
| BMI (kg/m2) | 28.57 ± 4.56 | 29.57 ± 4.58 | 27.56 ± 4.34 | 0.5884 |
| WHR | 0.925 ± 0.075 | 0.93 ± 0.07 | 0.92 ± 0.07 | 0.4128 |
| WC (cm) | 99.30 ± 10.36 | 101.67 ± 9.28 | 96.91 ± 10.88 | 0.1120 |
| SBP (mmHg) | 124.31 ± 19.04 | 124.59 ± 17.82 | 124.02 ± 20.29 | 0.1919 |
| DBP (mmHg) | 78.86 ± 10.92 | 79.45 ± 9.95 | 78.27 ± 11.85 | 0.0790 |
| TC (mg/dl) | 233.74 ± 44.53 | 233.97 ± 46.46 | 233.50 ± 42.73 | 0.4005 |
| LDL-C (mg/dl) | 156.27 ± 40.55 | 154.32 ± 42.60 | 158.24 ± 38.49 | 0.3095 |
| HDL-C (mg/dl) | 42.24 ± 11.20 | 42.81 ± 11.13 | 41.67 ± 11.30 | 0.8751 |
| TG (mg/dl) | 176.20 ± 98.64 | 184.17 ± 108.03 | 168.16 ± 87.94 | 0.0394 |
| hs-CRP (mg/l) (N < 3 mg/l) | 2.83 ± 3.11 | 3.24 ± 2.70 | 2.42 ± 3.45 | 0.0142 |
| Log (hsCRP) (mg/l)a | 0.58 ± 0.98 | 0.82 ± 0.91 | 0.35 ± 0.99 | 0.3872 |
| OPG (pg/ml)a (N 0–400 pg/ml) | 3.70 ± 1.60 | 3.70 ± 1.51 | 3.71 ± 1.70 | 0.2338 |
| RANKL (pg/ml)a (N 0–40 pg/ml) | 1.28 ± 1.75 | 1.09 ± 1.28 | 1.47 ± 2.12 | <0.0001 |
| RANKL/ OPG | 0.42 ± 0.60 | 0.34 ± 0.39 | 0.51 ± 0.75 | <0.0001 |
| OC (ng/ml)a (N 0–100 ng/ml) | 11.69 ± 5.25 | 8.51 ± 0.89 | 14.90 ± 5.84 | |
| AP (U/l) (N < 240 U/l) | 226.62 ± 63.77 | 207.02 ± 47.79 | 246.42 ± 71.55 | <0.0001 |
| CTX- I (ng/ml)a (N 0–2.172 ng/ml) | 0.67 ± 0.30 | 0.52 ± 0.21 | 0.82 ± 0.32 | <0.0001 |
AP, Alkaline phosphatase; BMI, Body Mass Index; CTX- I, serum C-terminal telopeptides of type I collagen; DBP, Diastolic Blood pressure; FPG1, Fasting Blood Glucose at the beginning of the study; FPG 2: Fasting Blood Glucose after 5 years; HDL-C, serum high-density lipoprotein; hs-CRP, high-sensitive C-reactive protein; LDL-C, Serum low-density lipoprotein; OC, osteocalcin; OPG, serum osteoprotegerin; RANKL, receptor activator of nuclear factor-κB ligand; SBP, Systolic Blood pressure; TC, serum total cholesterol; TG, serum triglyceride; Vitamin D, oral intake of vitamin D; Vitamin K, oral intake of vitamin K; WC, waist circumference; WHR, Waist to Hip ratio, N normal level. Data are given as means ± SD. aGeometric mean ± SD.
Table 2
Characteristics of 205 postmenopausal women, stratified by FPG2 (FPG after 5 years follow up) below 126 mg/dl or above/equal 126 mg/dl. Two-tailed t test was used to compare the mean values across groups (comparison of diabetic and non-diabetic)
| Variables | FPG 2 <126 mg/dl | FPG 2 ≥126 mg/dl | P-Value |
| (178) Mean ± SD | (27) Mean ± SD | ||
| Osteocalcin (ng/ml)a | 11.96 ± 5.46 | 9.92 ± 3.03 | 0.0008 |
| Age, year | 57.25 ± 6.67 | 59.33 ± 7.83 | 0.2314 |
| Vitamin D intake in mcg/day | 38.41 ± 47.25 | 36.06 ± 46.21 | 0.9442 |
| Vitamin K intake in mcg/day | 38.31 ± 187.58 | 23.11 ± 30.15 | <0.0001 |
| FPG1 (mg/dl) | 91.08 ± 12.32 | 109.55 ± 11.08 | 0.5347 |
| FPG2 (mg/dl) | 98.08 ± 1.60 | 156.04 ± 27.43 | <0.0001 |
| BMI (kg/m2) | 28.62 ± 4.64 | 28.21 ± 4.09 | 0.4579 |
| WHR | 0.92 ± 0.069 | 0.96 ± 0.095 | 0.0226 |
| WC (cm) | 99.09 ± 10.65 | 100.67 ± 8.26 | 0.1268 |
| TC (mg/dl) | 234.72 ± 44.70 | 227.26 ± 43.67 | 0.9348 |
| LDL (mg/dl) | 158.11 ± 40.22 | 144.15 ± 41.43 | 0.7832 |
| HDL (mg/dl) | 42.95 ± 11.20 | 37.60 ± 10.21 | 0.5913 |
| TG (mg/dl) | 168.42 ± 90.58 | 227.52 ± 131.66 | 0.0048 |
| hs-CRP (mg/l) | 2.81 ± 3.20 | 2.97 ± 2.55 | 0.1777 |
| Log (hs-CRP) (mg/l)a | 0.57 ± 0.97 | 0.65 ± 1.07 | 0.4500 |
| OPG (pg/ml)a | 3.71 ± 1.59 | 3.67 ± 1.67 | 0.7021 |
| RANKL (pg/ml)a | 1.3 ± 1.8 | 1.06 ± 1.19 | 0.0120 |
| RANKL/OPG | 0.43 ± 0.61 | 0.36 ± 0.55 | 0.5656 |
| AP (U/l) | 230.71 ± 65.16 | 199.67 ± 46.24 | 0.0413 |
| CTX- I (ng/ml)a | 0.67 ± 0.30 | 0.69 ± 0.34 | 0.3049 |
AP, Alkaline phosphatase; BMI, Body Mass Index; CTX- I, serum C-terminal telopeptides of type I collagen; FPG1, Fasting Blood Glucose at the beginning of the study; FPG 2, Fasting Blood Glucose after 5 years; HDL-C, serum high-density lipoprotein; hs-CRP, high-sensitive C-reactive protein; LDL-C, Serum low-density lipoprotein; OC, osteocalcin; OPG, serum osteoprotegerin; RANKL, receptor activator of nuclear factor-κB ligand; TC, serum total cholesterol; TG, serum triglyceride; WC, waist circumference; WHR, Waist to Hip ratio. Data are given as means ± SD. aGeometric mean ± SD.
Table 3
Multiple logistic regression analysis to evaluate Odds Ratio (OR) and 95% Confidence Interval (CI) of incident diabetes mellitus (FPG2 ≥126 mg/dl) in the postmenopausal women after categorizing the population into three groups [Group 1 with OC less than 9.1 ng/ml (76 persons); Group 2 with OC between 9.1 and 11.6 ng/ml (58 persons) and Group 3 with OC above 11.6 ng/ml (71 persons)] and comparing group 1 and 3 for total serum OC, 2001 National Cholesterol Education Program (Adult Treatment Panel [ATP] III) criteria for metabolic syndrome (FPG ≥100 mg/dl or drug treatment for elevated blood glucose, abdominal obesity defined as a WC ≥88 cm, serum TG ≥150 mg/dl or drug treatment for elevated TG, Serum HDL-C <50 mg/dl or drug treatment for low HDL-C, BP systolic ≥130 or diastolic ≥85 mmHg or drug treatment for elevated BP), WHR ratio ≥0.9 and BMI ≥30. We also categorized our participant into three groups according to oral intake of vitamin K and compared incident of diabetes in the participants with oral intake of vitamin K≤15μg/day (79 persons) vs participant with oral intake ≥50μg/day (32 persons)
| Low OC (<9.1 vs >11.6 ng/ml) OR and | OR | 95% CI | P-Value | |
| 95% CI for incidence of diabetes without adjustment | Lower | Upper | ||
| OC <9.1 vs >11.6 ng/ml | 2.89 | 1.06 | 7.87 | 0.038 |
| FPG 1 ≥100 mg/dl | 9.881 | 3.372 | 28.952 | <0.0001 |
| WC ≥88 | 1.468 | 0.313 | 6.884 | 0.626 |
| TG ≥150 mg/dl | 2.983 | 1.095 | 8.124 | 0.032 |
| HDL-C <50 mg/dl | 2.000 | 0.553 | 7.229 | 0.290 |
| Systolic BP ≥130 mmHg | 2.397 | 0.952 | 6.038 | 0.064 |
| Diastolic BP ≥85 mmHg | 1.320 | 0.523 | 3.335 | 0.557 |
| BP ≥130/85 mmHg | 2.022 | 0.792 | 5.160 | 0.141 |
| WHR ≥0.9 | 1.980 | 0.685 | 5.722 | 0.207 |
| BMI ≥30 | 1.320 | 0.523 | 3.335 | 0.557 |
| Oral intake of vitamin K≤15 vs ≥50μg/day | 1.073 | 0.381 | 3.026 | 0.894 |
BMI, Body Mass Index; BP, Blood pressure; FPG1, Fasting Blood Glucose at the beginning of the study; HDL-C, serum high-density lipoprotein; TG, serum triglyceride; OR, odd ratio; CI, confidence interval.
Table 4
Multiple logistic regression analysis to evaluate Odds Ratio (OR) and 95% Confidence Interval (CI) of incident diabetes mellitus (FPG2 ≥126 mg/dl) for low OC (OC <9.1 vs >11.6 ng/ml) after adjustment for FPG1 ≥100 mg/dl, WC ≥88 cm, TG ≥150 mg/dl or drug treatment for elevated TG, Serum HDL-C <50 mg/dl or drug treatment for low HDL, BP ≥130/85 mmHg or drug treatment for elevated BP, WHR ≥0.9 and BMI ≥30
| Low osteocalcin (<9.1 vs >11.6 ng/ml) OR and | OR | 95% CI | P-value | |
| 95% CI for incidence of diabetes after adjustment for | Lower | Upper | ||
| Osteocalcin (without adjustment) | 2.89 | 1.06 | 7.87 | 0.038 |
| FPG1 | 3.058 | 1.039 | 9.009 | 0.042 |
| WC | 2.881 | 1.030 | 8.064 | 0.044 |
| TG | 2.590 | 0.937 | 7.142 | 0.066 |
| HDL-C | 3.021 | 1.102 | 8.264 | 0.032 |
| BP | 3.086 | 1.119 | 8.547 | 0.029 |
| WHR | 2.732 | 7.518 | 0.997 | 0.051 |
| BMI | 2.832 | 1.033 | 7.812 | 0.043 |
| WC, TG, HDL, BP, FPG1 | 3.135 | 1.005 | 9.803 | 0.049 |
| WC, TG, HDL, BP, FPG1, BMI, WHR | 3.086 | 0.988 | 9.615 | 0.052 |
BMI, Body Mass Index; BP, Blood pressure; FPG1, Fasting Blood Glucose at the beginning of the study; HDL-C, serum high-density lipoprotein; TG, serum triglyceride; WC, Waist circumference; WHR, Waist to Hip ratio; OR, odd ratio; CI, Confidence Interval.


