
Prevalence of hypertension, pre-hypertension and undetected hypertension in Mashhad, Iran
Abstract
OBJECTIVE: Hypertension (HTN) is an important risk factor for cardiovascular disease (CVD) affecting more than a quarter of the world’s adult population. The aim of this survey was to determine the prevalence of HTN, pre-HTN, and awareness of HTN in an Iranian population, and to assess the factors associated with HTN and pre-HTN.
MATERIALS AND METHODS: The MASHAD study started in 2010 and will continue until 2020. The demographic, anthropometric and lifestyle data were collected by two certified health care professionals and a nurse. SPSS software was used for statistical analysis
RESULTS: There were a total of 9762 participants, of whom 40 % were males (n = 3903) and 60 % females (n = 5859). The means (and SD) age of the population samples were 48.8±8.4 years for the male and 47.6±8.0 years for the female subgroups. 12% (95% CI, 11.5% –12.6%) were classified as pre-hypertensive, 23% (95% CI, 22.2% –23.9%) as hypertensive and 65 % were normotensive. Of the group that was hypertensive, 55% were individuals with previously undetected HTN. The prevalence of undetected HTN in the sub-group with diabetes mellitus (DM) was 42%; and in those who were current smoking the prevalence of undetected HTN was 54.9%, indicating a high degree of co-clustering of cardiovascular risk factors.
CONCLUSION: In an unselected population from North-Eastern Iran, hypertension was common, often undetected and frequently co-existed with other CVD risk factors.
1Introduction
Hypertension (HTN) is a prevalent public health concern and a major risk factor for coronary heart disease (CHD), stroke, and renal disease. HTN affects approximately one-quarter of the world’s total adult population and it has been estimated that its prevalence will increase to 29% by 2025 [1]. Optimum management of hypertension can lead to a substantial reduction in the risk of morbidity and mortality [2].
The World Health Organization (WHO) has estimated that a suboptimal BP (a SBP >115 mm Hg) is globally accountable for 62% of cerebrovascular disease and 49% of ischemic heart disease (IHD) and a major attributable risk factor for death [3]. In the developed world, the increase in the prevalence of HTN has been blunted over the past few decades owing to improvements in population screening, generating awareness and control of risk factors [4]. However, the prevalence of HTN in most developing countries is increasing due to lifestyle changes associated with economic growth and urbanization, and is now approaching that of industrialized countries [5]. The current prevalence of HTN in developing countries is estimated to be 22.9% whilst that reported for developed countries is approximately 37.3% [2].
In order to adequately address this global problem it is essential that an accurate assessment of the prevalence of HTN and for its attributable risk factors are identified. Consequently, the aim of this survey was to determine the prevalence of HTN, pre-HTN, and awareness of HTN in Mashhad.
2Materials and methods
Participants were recruited as part of the MASHAD study from three areas in the city of Mashhad, in the North East of Iran, using a stratified cluster random sampling method [6]. Every area was divided into 9 locations centered upon Mashhad Healthcare Center divisions. Families were identified via the individuals of qualifying age (30 to 65 years) by the indigenous population authorities and these authorities were used to offer the families information brochures providing detailed information about the study. Communal leaders who were acquainted with the families in these communities also helped with the identification and enrollment of potential participants. Eligible participants were contacted by telephone to organize an appointment for the physical examination. Non-responders were also contacted and information was sought regarding their demographic and diabetes and hypertension status. This was to reduce the likelihood that the prevalence of these diseases may be underestimated.
The demographic, anthropometric and lifestyle data were collected by two expert health care professionals and a nurse, and comprised:
1. Standard health examination and anthropometric measures: weight, height, BMI, waist-to-hip ratio (WHR), and blood pressure.
2. A health-related questionnaire comprising questions on: demographic characteristics, physical activity and tobacco usage) and use of therapeutic and non-therapeutic drugs.
2.1Baseline laboratory investigations
Blood and mid-stream urine sample was collected from all participants. Blood samples were taken between 8 and 10 a.m. by venipuncture from an antecubital vein after 14 hours overnight fasting with the subject in a sitting position. Fluoridated tubes were used for collecting blood samples for glucose measurement. The samples were collected into Vacutainertrademark tubes (20 ml). All blood samples were centrifuged at room temperature between 30 to 45 minutes of collection to isolated the serum and plasma and these samples were stored in 6 microtubes (0.5 ml), which were then sent to the Bu Ali Research Institute, Mashhad in an ice box and assayed on the day of blood collection for biochemical analyses. Aliquots of serum were also stored, frozen at –80°C for subsequent analysis. Clinical biochemistry assays were performed using a SYSMEX-KX21 analyzer (BT 3000, USA). Blood samples were used for the determination of, total cholesterol, triglycerides, low-density lipoprotein cholesterol (LDL-C) and high-density lipoprotein cholesterol (HDL-C) using routine analyses and the results validated using external national and international quality controls. Glucose and lipid profile measurements were measured using an auto-analyzer (Ependorf, Germany). TC (total cholesterol) and TGs (triglycerides) were determined using enzymatic based methods (Pars Azmon Inc., Iran). HDL-C was measured after precipitation of low-density and very low-density lipoproteins with dextran sulfate-magnesium. LDL-C was calculated from the serum TC, TGs, and HDL-C concentrations expressed in mg/dl using the Friedwald formula [7] if TGs concentration was >400 mg/dl, LDL-C was measured using a direct method.
Height (centimeters) was documented in all individuals without shoes, and weight (kilograms) was measured for contributors in light clothing using electronic weighing scales. BMI was calculated using weight in kilograms divided by the square of the height in meter. Waist (at the level of the umbilicus) and hip (defined as the widest part of the body below the waist) measurements were also taken, and the WHR was calculated.
For blood pressure measurements, the subjects remained seated for 15 minutes and as a minimum of two readings were taken using a standard mercury sphygmomanometer from individuals who had rested adequately before measurement. The systolic blood pressure was defined by the onset of the first sound (Korotkoff phase 1), and the diastolic blood pressure was defined by the disappearance of the sound (Korotkoff phase 5) throughout deflating the cuff at a 2–3 mm per second decrement rate. If the two readings varied by more than 15 mmHg diastolic or 25 mmHg systolic, a third reading was done. The mean values of the closest two readings were calculated.
Diabetes mellitus was defined by a FBG ≥126 mg/dl, or treatment with an oral hypoglycemic agent or insulin.
Hypertension was diagnosed in persons with systolic blood pressure ≥140 mmHg and/or diastolic blood pressure ≥90 mmHg, and in individual who were previously diagnosed as hypertension subjects based on their past medical history and used anti hypertension drugs [8].
A current smoker was defined as an individual who was smoking cigarettes at a minimum of once a day. Those with raised blood pressure, cholesterol, or with other abnormal findings were advised to undertake further medical follow-up. Any “alert” findings of conditions that were considered to be medically urgent— were reported to the contributor and his or her physician by telephone as soon as they were recognized.
2.2Data management
Data collected at the field centers were communicated to the data bank using Microsoft visual studio.NET software which is used for the overall data management in MASHAD study. The data were kept consistent with procedures proposed to maintain confidentiality.
2.3Statistical analysis
SPSS software (version 11.5, Chicago, IL, USA) was used for statistical analysis. Kolmogorov-Smirnov test was used to evaluate the normality of data. Values were expressed as mean±SD for normally distributed variables. Baseline demographic and clinical characteristics were compared between groups using independent samplest-test, chi-square and/or Fisher’s exact test, as appropriate. Regression logistic was used to determine the effect of each parameter on pre-HTN and HTN subjects. ANOVA One-way analysis of variance and Tukey test were used for multiple comparisons A step wise multivariate analysis model was used to examine associations between SBP and DBP with anthropometrical and biochemical factors. p-value >0.05 was considered for outing the factors. To determine the relationship between systolic blood pressure (SBP), diastolic blood pressure (DBP) and other clinical and biochemical parameters, Pearson’s.Correlation or Spearman’s. Correlation coefficients were determined. p-value ≤0.05 was considered significant.
3Results
3.1Prevalence of categories of blood pressure
There were a total of 9762 participants, approximately 40% (n = 3903) males and 60% (n = 5859) females. The means (and SD) for age were 48.8±8.4 years for the male and 47.6±8.0 years for the female subgroups.
Statistical analysis showed that 12% (95% CI, 11.5% –12.6%) of the population was classified as pre-hypertensive, 23% (95% CI, 22.2% –23.7%) as hypertensive and 65% as normotensive. The percentages of females in the HTN category were higher than for males (14% V.s 9%, respectively, p < 0.01). Also for Pre-HTN (7% V.s 4%, respectively, p < 0.05). Moreover, 55% of the hypertensive subgroup overall were unaware of their blood pressure status; 66% of men and 46% of women. The prevalence of undetected HTN in the group with diabetes mellitus was 42%; and in current smokers the prevalence of undetected HTN was 54.9%.
3.2Clinical, demographic and anthropometric data for subjects in different blood pressure categories
Table 1 shows the mean and standard deviation for clinical and biochemical parameters in the subgroups with pre-HTN, HTN, Undetected-HTN and normotensive subjects. Age, BMI, WC, WHR and PAL were significantly different between the groups (p < 0.01); subjects without HTN were younger than those with established or undiagnosed HTN. Furthermore ssubjects with HTN were significantly more adipose than those without.
3.3Associations between SBP and DBP with demographic, anthropometric and laboratory data
To determine the relationship between systolic blood pressure (SBP), diastolic blood pressure (DBP) and other clinical and biochemical parameters, Pearson’s. Correlation or Spearman’s correlation coefficients were determined. As can be seen from Table 2, p-value for all factors for both (SBP) and (DBP) were significant, except for HDL-C, respectively (p = 0.69, r = 0.04) and (p = 0.97, r = 0.06) for (SBP) and (DBP). For this set of data, Spearman’s coefficient was highest for age (rSBP = 0.36, rDBP = 0.27) in both (SBP) and (DBP).
In Table 3 we show the results of binary regression logistic analysis, which was used to determine the effect of each parameter on pre-HTN and HTN.
Table 3, shows that several factors, including measures of adiposity, glucose tolerance and lipid status, had a significant effect on HTN. Gender, age, weight, BMI, WHR, FBG, HDL-C and current smoking habit were significant (p < 0.05). For Pre-HTN age, weight, WC and WHR p-values were significant (p < 0.05).
3.4Independent determinants of SBP and DBP
Table 4 compares the prevalence of pre-HTN, HTN, undetected HTN and normotensive subjects in different subgroups for adiposity, employment status and marital status. It is apparent from this table that there was a significant (p < 0.01) difference between the three BMI sub-groups (p < 0.01). Moreover, the percentage of obesity was higher for all HTN subgroups as compared with Normal subjects. Normal subject consist higher percentage of the person in normal BMI sub group. And overweight patients were similarly distributed across the four subgroups.
The prevalence of pre-HTN, HTN and undetected HTN in the married sub-population was higher than for other groups and there were significant difference between the three sub groups (p < 0.05). Additionally there are four sub groups of Employment status, and from this data there were again significant differences between the four groups (p < 0.05).
A step wise multiple regression was undertaken to determine the factors that predict systolic BP from age, waist circumference, FBG, weight, current smoking habit, TG and HDL-C. These variables statistically significantly predicted systolic BP, F (9, 5879) = 154, p < 0.001, R2 = 0.191. All variables added significantly to the prediction, (p < 0.05) Table 5.
In Table 6, a step wise multiple regression was undertaken to predict diastolic BP from age, waist to hip ratio, FBG, weight, current smoking, TG and HDL-C. These variables significantly predicted blood diastolic, F (8, 5875) = 110.7, p < 0.001, R2 = 0.131. Again all variables added significantly to the prediction, (p < 0.05).
4Discussion
This survey was undertaken primarily to determine the prevalence of HTN, pre-HTN and undetected HTN together with their determinants among the population of Mashhad. This is the first population-based survey to provide data on the prevalence of hypertension and its associated determinants in this population. We found that 23% and 12% of the Mashhad population have HTN and pre-HTN, respectively. Of the population who had HTN, 41.3% were men and 58.7% women. Azizi et al. showed that the prevalence of HTN in 60–69 years old people was 62.2% and 47.3% in women and men, respectively [9]. The reported prevalence of HTN in the Asian Pacific region varies from 5–47% in males and 7–38% in females [10]. This discrepancy may be related to the population samples investigated and to the variations in genetic and lifestyle determinants of blood pressure and also when the survey wasundertaken.
The high frequency of HTN in the elderly can be attributed to changes in age-related vascular compliance of the conductance arteries which contributes to isolated systolic HTN and extended pulse pressure [11]. Furthermore, with regard to gender, the results of our study indicate that females had a higher prevalence of isolated high systolic blood pressure and lower prevalence of high diastolic blood pressure compared to males. The SHEP (Systolic Hypertension in the Elderly Program) study revealed that this form of high blood pressure is more prevalent in the elderly, and particularly in females [12].
4.1Undetected hypertension
One interesting finding was that 66% of men and 45% of women diagnosed with HTN were unaware of their condition. This is consistent with the results of the NHMS III study [13]. Among the diabetic subpopulation, 42% were unaware of their HTN. HTN is often not detected because of the absence of a screening program and the lack of obvious symptoms [14]. Screening for HTN is the best tool for the identification of the affected individuals, in particular those at the prehypertension stage, and enables the application of early lifestyle and pharmaco-therapeutic measures in order to prevent HTN-associated morbidities including cardiovascular, cerebrovascular and chronic kidney disease [15].
Studies from low- and high-income countries have shown that women are usually more aware of their HTN. A plausible reason for this is a greater degree of surveillance of women because of maternal and child health programs [15].
4.2Hypertension and anthropometric features
Adiposity is an established risk factor for HTN, appearing to have an impact on HTN for a BMI as low as 23–25 kg/m2 [16]. In a study based in Taiwan, using logistic regression model, HTN was reported to be related to aging and BMI [17].
We found that HTN was equally prevalent among those who were overweight and obese. Lifestyle changes associated with urbanization are likely to be important factors in the development of HTN. Furthermore as the life expectancy increases in developing countries and a greater proportion of the inhabitants become urban dwellers, the overall prevalence of HTN and other cardiovascular diseases is likely to rise [18]. The migration of people from rural areas to an urban setting is associated with an increase in blood pressure, body weight, pulse rate, and urinary sodium–potassium ratios suggesting a marked change in diet and an increased autonomic nervous system activity that could contribute to the higher blood pressure found [19].
The relationship between obesity and hypertension is well established both in adults and children [1, 2]. The mechanisms by which obesity causes hypertension are still an area of research. Activation of the sympathetic nervous system (SNS) has been considered to have a crucial function in the pathogenesis of hypertension among obese individuals; however there is also evidence of high muscle SNS activity in obese subjects [20] High-caloric intake increases norepinephrine turnover in peripheral tissues raises resting plasma norepinephrine concentrations and amplifies the rise of plasma norepineprhine in response to stimuli such as upright posture [21]. A high dietary content of fat and carbohydrate has been suggested to acutely stimulate peripheral α- and β-adrenergic receptors, leading to elevated sympathetic activity and hypertension [22] Overweight and obesity are associated with alterations in nutritional and physical activity levels, which are regularly the consequence of urbanization and social modifications connected to improvement and absence of reassuring strategies in health and supplementary associated areas [23].
4.3Hypertension and clinical and biochemical features
There was a significant negative association between SBP and DBP with physical activity levels (PAL). Dimeo et al. have also previously reported that aerobic exercise decrease BP in resistant HTN [24]. Moreover Tringler et al. showed a close association between inactive lifestyle and the development of hypertension [25].
We found a negative association between raised BP and HDL-C level. However, results show that there were a positive and significant relationship between biochemical and clinical elements with SBP and DBP.
The logistic regression analysis revealed a strong positive association between age, FBG, HDL-C, weight and WHR with the risk of HTN.
We found that WC but not BMI was strongly associated with the risk of HTN and pre-HTN. This is consistent with a report from Beijing that suggests that BMI may be a stronger predictor than WC for HTN [26].
Central adiposity probably correlates better with diabetes and CVD risk than overall adiposity.
Physical activity is another factor that powerfully impacts on BP. Adolescents with higher levels of physical activity have fewer risk factors for cardiovascular disease, including high blood pressure and adiposity [27]. We found a strong association between physical inactivity and both SBP and DBP. Our results are consistent with previous reports. Aerobic exercise lowers blood pressure and improves blood pressure control among overweight adult subjects [28], and a modest weight loss of 3–9% is associated with a significant reduction in systolic and diastolic blood pressure of approximately 3 mmHg in overweight people [29].
4.4Hypertension and demographic characteristics
Overwhelming evidence supports the conclusion that cigarette smoking causes excess adverse cardiovascular events [30] and acts synergistically with hypertension and dyslipidemia to increase the risk of coronary heart disease [31]. In addition to the well-established effects of smoking on BP and endothelial function [32], smoking also causes an acute increase in blood pressure (BP) and heart rate, and has been found to be associated with malignant hypertension [33].
Marital status also appears to be a risk factor for HTN. This is consistent with some other studies that concluded that this may be due to psychosocial factors affecting biological, neuroendocrine and immune systems [34]. Previous surveys have suggested that being single or widowed may contribute to cardiovascular risk. However these data may be partially confounded by age or other associated factors [35].
5Conclusion
In our unselected random population from North-Eastern Iran, hypertension and pre hypertension are common; undetected hypertension is common particularly among women and there is a co-clustering of cardiovascular risk factors.
Declaration of interest
The authors have no conflict of interests to declare.
Summary Table
| What is known about topic | What this study adds |
| Hypertension is the most common risk factor for cardiovascular diseases. Hypertension has been recognized as a global, chronic, non-communicable disease and as a “silent killer” due to its high mortality rates and lack of early symptoms. One-quarter of the world’s adult population is hypertensive and this figure is likely to increase to 29% by 2025. | The goal of this study was to estimate the prevalence of hypertension, pre-hypertension and undetected hypertension in Mashhad, Iran. We found that 23% and 12% of the Mashhad population have HTN and pre-HTN, respectively. Of the population who had HTN, 41.3% were men and 58.7% women. In an unselected population from North-Eastern Iran, hypertension was common, often undetected and frequently co-existed with other CVD risk factors. |
Acknowledgments
The MUMS (Mashhad University of Medical Science) has provided the financial supports for this study. We are particularly grateful to the patients and their family members who volunteered to participate in this study.
References
[1] | Law MR , Morris JK , Wald NJ . Use of blood pressure lowering drugs in the prevention of cardiovascular disease: Meta-analysis of 147 randomised trials in the context of expectations from prospective epidemiological studies. Bmj.. (2009) ;338: :b1665. |
[2] | Kearney PM , Whelton M , Reynolds K , Muntner P , Whelton PK , He J . Global burden of hypertension: Analysis of worldwide data. Lancet. (2005) ;365: :217–223. |
[3] | World Health Report 2002: Reducing risks, promoting healthy life. Geneva, Switzerland: World Health Organization, 2002. http://www.who.int/whr/2002. |
[4] | Guessous I , Bochud M , Theler JM , Gaspoz JM , Pechere-Bertschi A . 1999–2009 trends in prevalence, unawareness, treatment and control of hypertension in Geneva, Switzerland. PLoS One. (2012) ;7: :e39877. |
[5] | Ibrahim MM , Damasceno A . Hypertension in developing countries. Lancet. (2012) ;380: :611–619. |
[6] | Ghayour-Mobarhan M, Moohebati M, Esmaily H, Ebrahimi M, Parizadeh SM, Heidari-Bakavoli AR, et al. Mashhad stroke and heart atherosclerotic disorder (MASHAD) study: Design, baseline characteristics and 10-year cardiovascular risk estimation. Int J Public Health. (2015) ;60: (5):561–72. |
[7] | Castelli WP , Garrison RJ , Wilson PW , Abbott RD , Kalousdian S , Kannel WB . Incidence of coronary heart disease and lipoproteincholesterol levels. The Framingham Study. JAMA. (1986) ;256: :2835–2838. |
[8] | An epidemiological approach to describing risk associated with blood pressure levels. Final report of theWorking Group on Risk and High Blood Pressure. Hypertension. (1985) ;7: :641–651. |
[9] | Azizi F , Ghanbarian A , Madjid M , Rahmani M . Distribution of blood pressure and prevelance of hypertension in Tehran adult population. Journal of Human Hypertension. (2002) ;16: :305–312. |
[10] | Lawes CM , Rodgers A , Bennet DA , Parag V , Suh I , Ueshima H . Blood pressure and cardiovascular disease in the Asia Pacific region. J Hypertens. (2004) ;21: (4):707–716. |
[11] | Dobrin PB . Mechanical properties of arteries. Physiol Rev. (1978) ;58: :397–449. |
[12] | SHEP Cooperative Research Group. Prevention of stroke by antihypertensive drug treatment in older persons with isolated systolic hypertension: Final results of the Systolic Hypertension in the Elderly Program (SHEP).. JAMA. (1991) ;265: :3255–3264. |
[13] | The Third National Health and Morbidity Survey. 2006. Abstracts: Hypertension and hypercholesteremia[Internet]. Available from: http://www.nih.gov.my./NHMS/abstracts_18.html. |
[14] | Rimm EB , Stampfer MJ , Giovannuci E . Body size and fat distribution as predictors of coronary heart disease among middle aged and older US men. Am J Epidemiol. (1995) ;141: :1117–1127. |
[15] | World Health Organization. (2004) Cameroon Burden of Diabetes (CamBoD) Project: Baseline survey report, Geneva: World Health Organisation. |
[16] | Harrison W , Marshall T . The epidemiology of blood pressure in East Asia. J Hum Hypertens. (2006) ;20: :97–99. |
[17] | Tsai AC , Liou JC , Chang MC . Interview to study the determinants of hypertension in older adults in Taiwan: A population based cross sectional survey. Asia Pac J Clin Nutr. (2007) ;16: (2):338–345. |
[18] | Walker R , Whiting D , Unwin N , Mugusi F , Swai M , Aris E . Stroke incidence in rural and urban Tanzania: A prospective, community-based study. Lancet Neurology. (2010) ;9: :786–792. |
[19] | Poulter NR , Khaw KT , Hopwood BE , Mugambi M , Peart WS , Rose G , et al. The Kenyan Luo igration study: Observations on the initiation of a rise in blood pressure. BMJ. (1990) ;300: :967–972. |
[20] | Grassi G , Seravalle G , Cattaneo BM , Bolla G , Lafranchi A , Colombo M , et al. Sympathetic activation in obese normotensive subjects. Hypertension. (1995) ;25: :560–563. |
[21] | Landsberg L , Krieger DR . Obesity, metabolism, and the sympathetic nervous system. Am J Hypertens. (1989) ;2: :1255–1325. |
[22] | Rocchini AP , Yang IQ , Gokee A . Hypertension and insulin resistance are not directly related in obese dogs. Hypertension. (2004) ;43: :1011–1016. |
[23] | Malaza A , Mossong J , Barnighausen T , Newell ML . Hypertension and obesity in adults living in a high HIV prevalence rural area in South Africa. PLoS ONE. (2012) ;7: :e47761. |
[24] | Dimeo F , Pagonas N , Seibert F , Arndt R , Zidek W , Westhoff TH . Aerobic exercise reduces blood pressure in resistant hypertension. Hypertension. (2012) ;60: :653–658. |
[25] | Tringler M , Rodriguez EM , Aguera D , Molina JD , Canziani GA , Diaz A . High blood pressure, overweight and obesity among rural scholars from the vela project: A population-based study from South America. High Blood Press Cardiovasc Prev. (2012) ;19: :41_6. 23. |
[26] | Hou DQ , Cheng H , Wang TY , Wang L , Zhao D , Zhang MM , et al. Study on the relationship of blood pressure with BMI,FMP and waist circumference among children and adolescents in Beijing. Chinese Journal of Practical Pediatrics. (2010) ;25: (7):4. |
[27] | Ribeiro JC , Guerra S , Oliveira J , Teixeira-Pinto A , Twisk JW , Duarte JA , et al. Physical activity and biological risk factors clustering in pediatric population. Prev Med. (2004) ;39: :596–601. |
[28] | ER Miller III , Erlinger TP , Young DR , Jehn M , Charleston J , Rhodes D ,et al. “Results of the diet, exercise, and weight loss intervention trial (DEWIT),” . Hypertension. (2002) ;40: (5):612–618. |
[29] | Hermansen K . “Diet, blood pressure and hypertension,” . British Journal of Nutrition. (2000) ;83: (1):113–119. |
[30] | Jonas MA , Oates JA , Ockene JK , Hennekens CH . Statement on smoking and cardiovascular disease for health care professionals: AHA Medical/ Scientific Statement. Circulation. (1992) ;86: :1664–1669. |
[31] | Kannel WB . Importance of hypertension as a risk factor in cardiovascular disease. In: Hypertension: Pathopsychology and Treatment. New York, NY: McGraw-Hill. (1977) ;888–910. |
[32] | Rahman MM , Laher I . Structural and functional alteration of blood vessels caused by cigarette smoking: An overview of molecular mechanisms. Curr Vasc Pharmacol. (2007) ;5: :276–292. |
[33] | Tuomilehto J , Elo J , Nissmen A . Smoking among patients with malignant hypertension. BMJ. (1982) ;1: :1086. |
[34] | Cappell CL , Herrmann J , McGee N , Rosenfeld D . The quality of life in the Chicago Collar counties: Work, family, and well-being. The Annual Meetings of the Midwest Sociological Society, St. Louis: April 6, 2001. |
[35] | Eaker ED , Sullivan LM , Kelly-Hayes M , D’Agostino RB , Benjamin EJ . Marital status, marital strain and risk of coronary heart disease or total mortality: The Framingham off spring study. Psychosom Med. (2007) ;69: :509–513. |
Figures and Tables
Fig.1
Prevalence of pre-HTN, HTN and normotensive individuals.
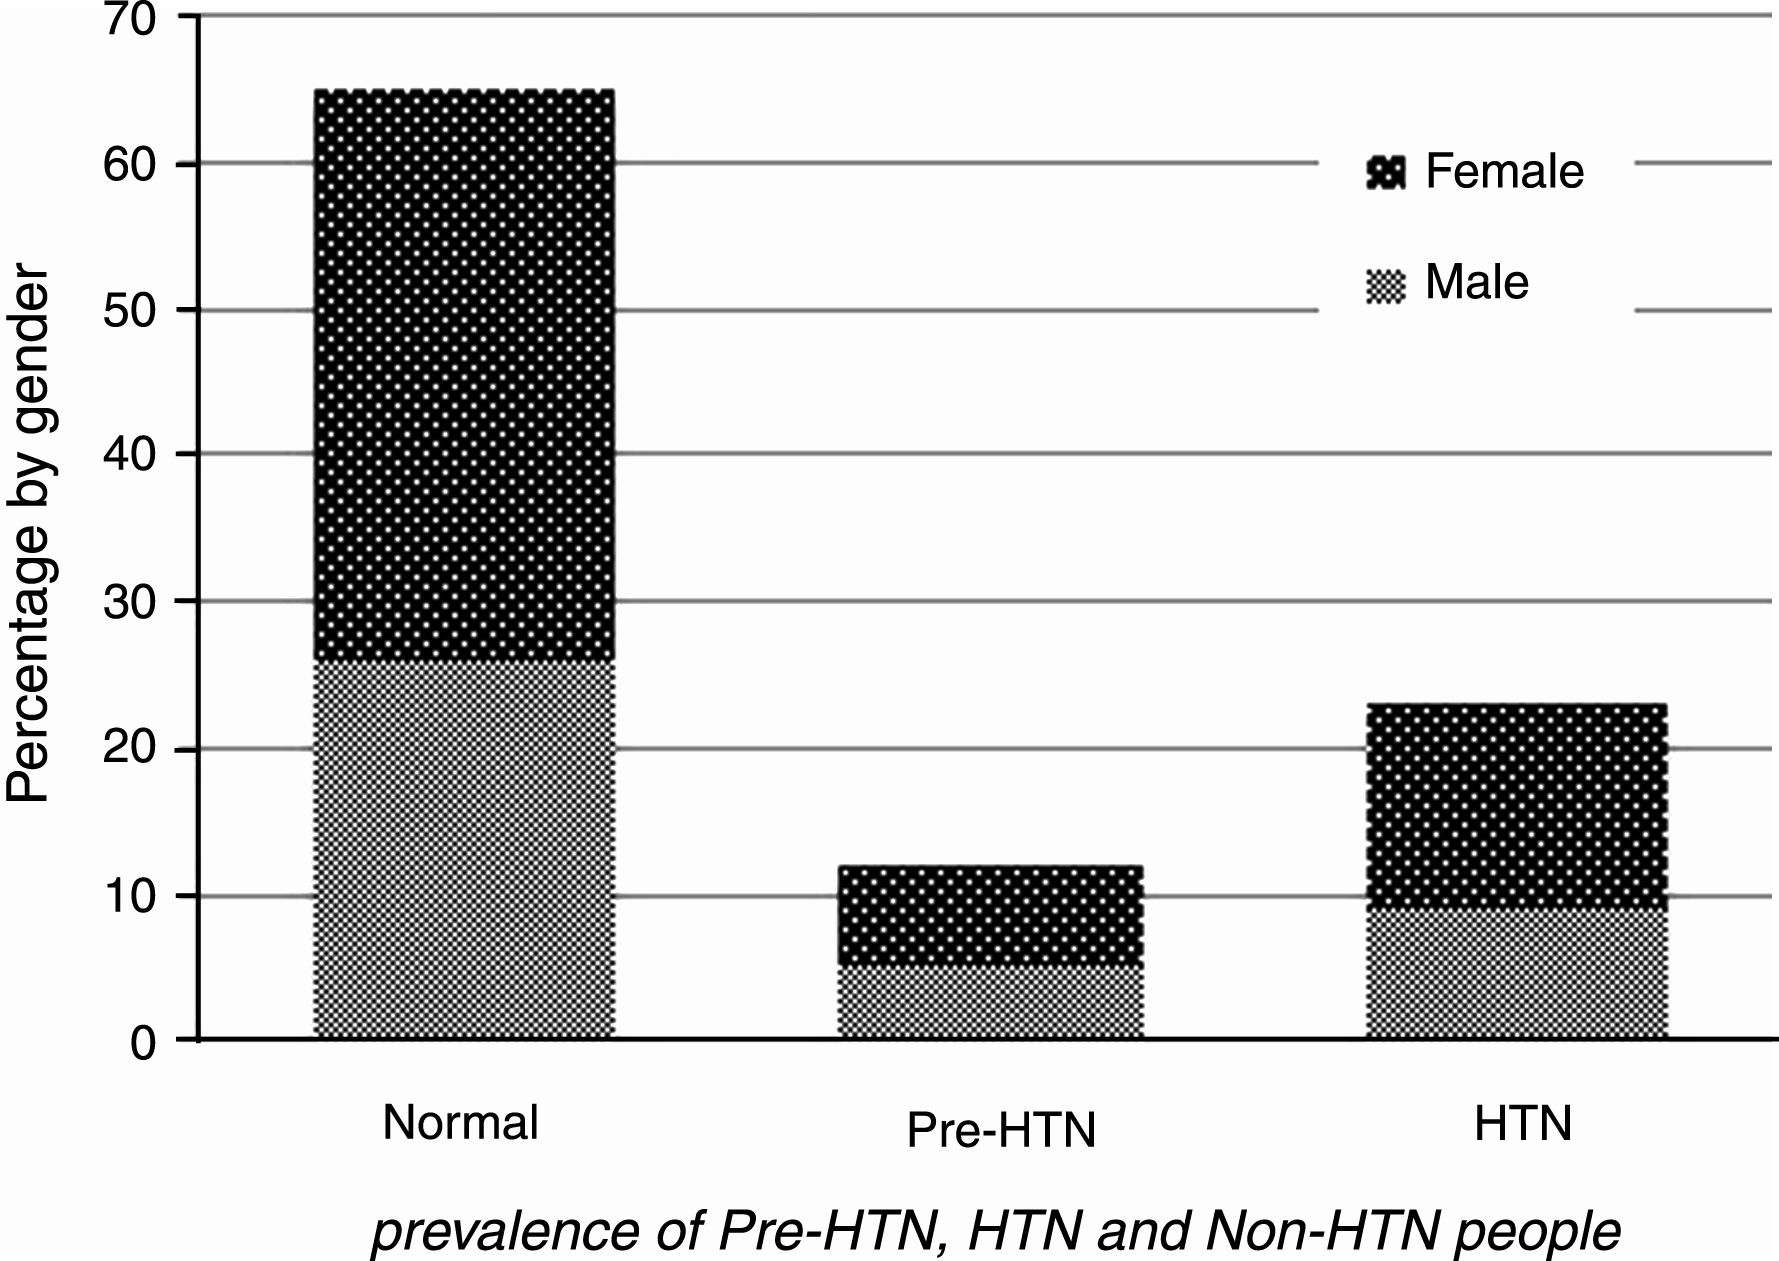
Table 1
Clinical and Biochemical features’ in blood pressure categories
| Variables | Normal | Pre-HTN | Un-HTN | HTN | p-value |
| Age(years) | 46.3±7.8 | 50.8±7.8b | 51.5±7.9b | 52.0±7.8b, * | <0.01 |
| Weight(kg) | 70.7±12.3 | 74.4±12.2b | 74.7±12.6b | 75.3±12.7b | 0.07 |
| BMI(kg/m2) | 27.4±4.5 | 28.7±4.4 | 29.0±4.5b | 29.3±4.5b | <0.01 |
| WC(cm) | 93.9±11.1 | 97.6±10.8a | 98.5±10.9b | 99.2±10.9b, * | <0.01 |
| WHR(cm/cm) | 0.91±007 | 0.9±0.06b | 0.9±0.07b | 0.9±0.08b, * | <0.01 |
| FBG(mg/dl) | 92.2±31.5 | 98.9±38.2b | 101.2±39.9b | 102.1±40.5b | <0.05 |
| HDL_C(mg/dl) | 43.9±9.1 | 43.3±8.6 | 43.8±9.0 | 44.0±9.1 | 0.08 |
| LDL_C(mg/dl) | 115.8±29.2 | 119.6±31.1 | 119.6±30.5 | 120.0±30.1a | 0.90 |
| TC(mg/dl) | 187.5±35.7 | 194.7±37.9a | 195.7±37.0a | 197.0±36.6a | 0.18 |
| TGs(mg/dl) | 117.0 (86–165) | 132 (95–184)b | 133.0 (97–181)b | 139 (99–184)b | 0.05 |
| PAL | 1.4±0.10 | 1.3±0.20b | 1.3±0.10b, * | 1.3±0.12b, * | <0.05 |
| Current Smoking (%) | 19.2% | 19.7% | 19.9% | 19.6% | 0.24 |
| DM (%) | 10.1% | 12.5% | 11.2% | 13% a | 0.41 |
Values expressed as mean±SD for normally distributed data, and median and interquartile range for non-normally distributed data. ANOVA One-way analysis of variance and Tukey test were used for comparison between groups. Compare with healthy subjects: a < 0.05, b < 0.01. Compare with Pre-HTN subjects: *<0.05. Compare with Un-HTN subjects: 1<0.05. TC = Total cholesterol, HDL-C = High density lipoprotein cholesterol, LDL-C = Low density lipoprotein cholesterol, TGs = Triglycerides, BMI = Body mass index, WHR = Waist to hip ratio, DM = Diabetes Mellitus, PAL = Physical Activity Level, WC = Waist Circumference, FBG = Fasting Blood Glucose.
Table 2
Correlation between Systolic and Diastolic blood pressure with Clinical and Biochemical factors
| Variables | Systolic Blood Pressure | Diastolic Blood Pressure |
| Age(years) | 0.36** | 0.27** |
| Weight(kg) | 0.20** | 0.23** |
| BMI(kg/m2) | 0.21** | 0.20** |
| WC(cm) | 0.26** | 0.23** |
| WHR(cm/cm) | 0.23** | 0.19** |
| FBG(mg/dl) | 0.19** | 0.13** |
| HDL_C(mg/dl) | –0.04 | –0.06 |
| LDL_C(mg/dl) | 0.08** | 0.07** |
| TC(mg/dl) | 0.14** | 0.13** |
| TGs(mg/dl) | 0.16** | 0.14** |
| PAL | –0.17** | –0.15** |
Correlations were assessed using Pearson correlation coefficients. For non-normally distributed data such as triglycerides Pearson correlations were used. **Correlation was significant at the <0.01 level (2-tailed). TC = Total cholesterol, HDL-C = High density lipoprotein cholesterol, LDL-C = Low density lipoprotein cholesterol, TGs = Triglycerides, BMI = Body mass index, WHR = Waist to hip ratio, DM = Diabetes Mellitus, PAL = Physical Activity Level, WC = Waist Circumference, FBG = Fasting Blood Glucose.
Table 3
Regression logistic between HTN or Pre-HTN and Clinical and Biochemical parameters
| Variable | HTN | Pre-HTN | ||
| OR(95% CI) | p-value | OR(95% CI) | p-value | |
| Gender | 0.73 (0.60–0.89) | 0.002 | 1.17 (0.92–1.48) | 0.17 |
| Age(years) | 1.08 (1.07–1.09) | 0.001 | 1.02 (1.00–1.03) | <0.01 |
| Weight(kg) | 12.68 (5.64–28.48) | 0.002 | 0.39 (0.15–1.03) | 0.05 |
| BMI(kg/m2) | 3.10 (1.5–8.12) | 0.003 | 0.63 (0.28–1.40) | 0.26 |
| WC(cm) | 0.70 (0.17–2.91) | 0.62 | 12.30 (2.09–69.58) | 0.004 |
| WHR(cm/cm) | 7.46 (1.66–33.51) | 0.001 | 0.12 (0.01–0.75) | 0.02 |
| FBG(mg/dl) | 1.67 (1.08–2.58) | 0.01 | 1.47 (0.86–2.50) | 0.13 |
| HDL_C(mg/dl) | 1.78 (1.12–2.83) | 0.007 | 0.88 (0.50–1.54) | 0.66 |
| LDL_C(mg/dl) | 0.84 (0.49–1.45) | 0.54 | 0.97 (0.47–1.89) | 0.93 |
| TC(mg/dl) | 1.47 (0.56–3.45) | 0.43 | 1.00 (0.30–3.91) | 0.99 |
| TGs(mg/dl) | 1.06 (0.85–1.33) | 0.55 | 0.96 (0.79–1.27) | 0.70 |
| PAL | 1.28 (0.72–2.28) | 0.41 | 0.679 (0.33–1.07) | 0.27 |
| Current Smoking | 0.84 (0.71–0.99) | 0.04 | 0.84 (0.69–1.03) | 0.10 |
| DM | 1.20 (0.83–1.75) | 0.31 | 0.97 (0.62–1.54) | 0.92 |
CI, confidence interval. OR, odds ratio, TC = Total cholesterol, HDL-C = High density lipoprotein cholesterol, LDL-C = Low density lipoprotein cholesterol, TGs = Triglycerides, BMI = Body mass index, WHR = Waist to hip ratio, FBG = Fasting blood Glucose, DM = Diabetes Mellitus, PAL = Physical Activity Level, WC = Waist Circumference.
Table 4
Demographic characteristics of the Non-HTN, Pre-HTN, undetected HTN and HTN groups
| Variables | Normal | Pre-HTN | Undetected-HTN | HTN | p-value | |
| BMI Status | Underweight + Normal | 30.8% | 19.9% | 18.2% | 16.9% | <0.01 |
| Overweight (25 ≤BMI <30.0, %) | 42.6% | 43.3% | 43.2% | 42.1% | ||
| Obesity (BMI ≥30.0, %) | 26.6% | 36% | 38.6% | 41% | ||
| Marital Status | Single + Divorced | 2.3% | 1.7% | 2% | 0.1% | <0.01 |
| Married | 93.7% | 92.8% | 93.9% | 90.7% | ||
| Widowed | 3.9% | 5.3% | 3.8% | 7.9% | ||
| Employment Status | Student | 0.2% | 0.2% | 0.2% | 0.1% | <0.01 |
| Employed | 39.7% | 37.6% | 39.9% | 30.0% | ||
| Un Employed | 54.1% | 50.6% | 50.7% | 55.1% | ||
| Retired | 7.8% | 11.4% | 9.1% | 14.6% |
Chi-squared tests were used for comparison between categorical parameters. HTN = Hypertension, BMI = Body Mass Index.
Table 5
Multifactorial analysis for SBP1
| Predictor | β | 95% CI | p-value |
| Age(years) | 0.711 | 0.65–0.76 | <0.01 |
| Weight(kg) | 10.49 | 6.95–14.03 | <0.01 |
| WC(cm) | 14.6 | 9.65–19.62 | <0.01 |
| FBG(mg/dl) | 5.83 | 4.15–7.51 | <0.01 |
| HDL_C(mg/dl) | 5.10 | 2.79–7.42 | <0.01 |
| TGs(mg/dl) | 2.22 | 1.19–3.24 | <0.01 |
| Current smoking | 2.39 | 1.36–3.43 | <0.01 |
1 = Stepwise regression was used. HDL-C = High density lipoprotein cholesterol, TGs = Triglycerides, FBG = Fasting blood Glucose, WC = Waist Circumference.
Table 6
Multifactorial analysis for DBP1
| Predictor | β | 95% CI | p-value |
| Age(years) | 0.29 | 0.25–0.32 | <0.01 |
| Weight(kg) | 13.50 | 11.82–15.18 | <0.01 |
| WHR(cm/cm) | 7.54 | 3.97–11.12 | <0.01 |
| FBG(mg/dl) | 1.08 | 0.02–2.13 | 0.04 |
| HDL_C(mg/dl) | 3.71 | 2.27–5.16 | <0.01 |
| TGs(mg/dl) | 1.30 | 0.66–1.94 | <0.01 |
| Current smoking | 1.33 | 0.68–1.98 | <0.01 |
1 = Stepwise regression was used. HDL-C = High density lipoprotein cholesterol, TGs = Triglycerides, WHR = Waist to hip ratio, FBG = Fasting blood Glucose.


