
Antioxidant activity of some non-conventional green leafy vegetables of North-East India
Abstract
Methanolic extracts of 15 traditionally consumed non-conventional green leafy vegetables were examined for in vitro antioxidant activity using three different assays. IC50 values measured by DPPH assay ranged from 8.98 to14.97 mg/L. In ABTS assay, trolox equivalent antioxidant capacity (TEAC) value varied from 18.3 to71.8 μM trolox/g of dry weight (dw). Ferric reducing antioxidant power (FRAP) values ranged from 107.7 to 275.6 μM Fe(II) per g dw). Total phenolic content (4.62 to 14.74 mg GAE/g dry dw), flavonoid content (0.65 to 7.72 mg QE/g of dw) and Vitamin C contents (35.79 to 106.7 mg/100 g dw) were evaluated by colorimetric methods. There was a positive linear correlation between the total phenolic content and antioxidant activities measured by three different methods.
1Introduction
Reactive oxygen species (ROS), such as superoxide (O2• - ), hydroxyl radical (OH•), peroxyl radical (ROO•), and singlet oxygen (1O2) are generated in the body either as a by-product of normal cellular aerobic respiration or exposure to environmental factors such as pollution, radiation, cigarette smoke and herbicides [1, 2]. In healthy individuals, production of ROS is controlled by an antioxidant defense system [3]. A serious imbalance between the production of ROS and antioxidant defense system is responsible for oxidative stress where excessive build-up of ROS results in damage to nucleic acids, proteins, enzymes and other biological molecules containing a lipid component of polyunsaturated fatty acids through oxidation [4, 5]. Oxidative damage and lipid peroxidation caused by the action of ROS may initiate and promote the progression of many diseases including cancer, liver disease, Alzheimer’s disease, ageing, inflammation, rheumatic disorder, diabetes, Parkinson’s disease, atherosclerosis and AIDS [6–8]. Dietary antioxidant nutrients, which include vitamin E, vitamin C, carotenoids and polyphenols/flavonoids, are believed to be effective in prevention of these oxidative stress related diseases [9, 10].
Antioxidants are mainly of two types, viz. synthetic and natural [11]. Synthetic antioxidants are synthesized in the laboratory. Some common synthetic antioxidants are phenolic compounds such as butylated hydroxyanisole (BHA), butylated hydroxytoluene (BHT), tert-butylhydroquinone (TBHQ) and propyl gallate (PG) which are most commonly used for food and pharmacological applications [12]. But synthetic antioxidants are suspected of being responsible for some severe toxic effects. Synthetic antioxidants are believed to play a role as promoter of carcinogenesis and liver swelling [8, 13]. Hence there is a rising interest amongst researchers to explore the potential natural antioxidants and establishing their association with health benefits. Natural antioxidants are found in almost all plants, microorganisms, fungi and even in animal tissues [12]. The major natural dietary antioxidants are vitamin C and E, carotenoids, and phenolic compounds especially flavonoids. Vegetables and fruits are the least expensive sources of such natural antioxidants. Epidemiological data have clearly shown an inverse relationship between consumption of plant-based foods, such as fruits, vegetables and legumes and chronic ailments such as cardiovascular diseases, cataract and macular degeneration and cancer [14]. Therefore there has been a considerable increase in interest to find natural antioxidants from medicinal plants, vegetables and fruits to replace synthetic antioxidants due to their presumed safety, nutritional and therapeutic values [15].
North-eastern region (NER) of India is rich in biodiversity. NER consists of eight states of India viz. Arunachal Pradesh, Assam, Manipur, Meghalaya, Mizoram, Nagaland, Tripura and Sikkim. It has the richest reservoir of plant diversity in India and is one of the ‘biodiversity hotspots’ of the world supporting about 50% of India’s biodiversity [16]. Ethno-botanical studies have reported that 200 plant species from Arunachal Pradesh, 286 plant species from Assam, 526 plant species from Nagaland and 194 plant species from Tripura are used for treatment of different diseases and ailments in these states [17]. In this study an effort has been made to study and report the antioxidant activities and total phenolic contents of some non-conventional vegetables of north east India. The relationship between phenolic content and antioxidant activity has also been investigated.
2Materials and methods
2.1Plant materials
The 15 leafy vegetables (Table 1) have been identified by a taxonomist (Dr. Dinesh Ch. Deka). Fresh vegetables are cleaned and external moisture blotted dry and non edible portions separated and discarded. The edible portions are cut into small pieces. 100 g of each cleaned fresh plant material is air dried in a well-ventilated room at room temperature under shade and ground into a fine powder by laboratory mill and samples kept at 20–25°C in dark until analysis.
2.2Preparation of extracts
The methanolic extract has been prepared as described by Proestos et al. [18] with some modification. Earlier 62.5% methanol was used but better results are achieved when the methanol concentration has been increased up to 80% . A 0.5 g of homogenized plant material has been mixed with 50 ml methanol (80% v/v) containing 0.1% HCl in a round bottom flask. The mixture is stirred for 30 minutes and then sonicated for 15 minutes. After sonication the mixture is bubbled with nitrogen and refluxed in a water bath at 90°C for 2 hours. After cooling it is concentrated under reduced pressure in a rotary evaporator (Buchi, R-200) and then lyophilized and dried. Dried material has been dissolved in the same solvent. The extract is purged with nitrogen and kept in a deep freezer (–20°C) until analysis.
2.3DPPH free radical scavenging assay
The radical scavenging activity for the DPPH assay is calculated by the previously described method [19]. Briefly, 3 ml of DPPH solution (10–4 M) has been added to 1 ml of sample and the mixture is then shaken and kept in dark at room temperature. The absorbance is measured after 5, 20 and 30 min against a blank (80% v/v methanol) by UV/Vis Spectrophotometer (Shimadzu, UV-1800).
A mixture of 1 ml methanol (80% ) and 3 ml DPPH solution is used as control. The radical activity is calculated by the following formula
% Inhibition = [(AB−AA)/AB]
where, AA and AB are the Absorbance (Abs) of test sample and control respectively.
IC50 values of the samples have been calculated from graph by plotting % inhibition against extract concentration (200, 100, 50, 25, 10 and 5 mg/L).
2.4ABTS cation scavenging assay
The ABTS assay described by Re et al. [20] is used to determine antioxidant capacity of the plant extracts. A calibration curve has been constructed using trolox as standard and the antioxidant capacities are expressed as μM trolox per g of dry weight (dw).
2.5Ferric reducing antioxidant power (FRAP) assay
Total antioxidant capacity has also been determined using FRAP assay by Benzine and Strain method [21]. A calibration curve is constructed using FeSO4.7H2O solution and results are expressed as μM Fe(II) per g dry weight (dw).
2.6Determination of total phenolic content
Total phenolic content has been estimated using Folin-Ciocalteu colorimetric method [19]. Results are expressed as mg of Gallic acid equivalent (GAE) per 100 g dry weight (dw).
2.7Determination of total flavonoid
Total flavonoid content has been estimated by colorimetric method described previously using quercetin [3]. Aliquot of 1 ml of dilute extract (1:10 v/v) is added to 5 ml of distilled water followed immediately by 0.3 ml of NaNO2 (5% ) and after 6 min 0.6 ml of 10% AlCl3 in ethanol is added followed by addition of 1M NaOH solution, and the total volume is made up to 10 ml. Absorbance of the resulting pink coloured solution is measured at 510 nm against a blank prepared from the same solvents. The flavonoid content has been expressed as mg of quercetin equivalent (QE) per g of dw.
2.8Determination of Vitamin C content
Vitamin C content of the vegetables has been determined by the method proposed by Al Duas et al. [22]. Comparing the absorbance of experimental samples with calibration curve, vitamin C content is estimated and the results are expressed as mg ascorbic acid per 100 g of sample.
2.9Statistical analysis
All the experiments have been done in triplicates (n = 3), and the results are expressed as mean±SD (standard deviation). SPSS (16.0) and Excel 2003 software have been used to perform statistical analyses.
3Results and discussion
3.1Antioxidant activity of the vegetables
The results of the three assays for antioxidant capacity are presented in Table 2. In the DPPH assay antioxidant capacity has been expressed as IC50 value, which is defined as the concentration of antioxidant required for 50% scavenging of DPPH radical in a specific time period [3]; a smaller IC50 value corresponds to a higher antioxidant activity of the plant extract. The antioxidant capacity measured by DPPH assay and expressed as IC50 values ranges from 89.8 to149.7 mg/L in the samples under study. The IC50 value of Houttuynia cordata is the lowest (89.8 mg/L) and hence it has the highest antiradical activity among all studied vegetables, followed by Achasma nigra (91.8 mg/L) and Lasia spinosa (99.8 mg/L) (Table 2). Similar results have been reported by other researchers for some traditional medicinal plants and for some Indian leafy vegetables [10, 23]. In ABTS assay, antioxidant capacity is expressed as trolox equivalent antioxidant capacity (TEAC) simply as μM trolox/g of dw. Table 2 shows TEAC value varying from 18.3 to 71.8 μM trolox/g of dw. Achasma nigra (71.8 μM trolox/g of dw) has the highest TEAC value followed by Houttuynia cordata (57.6 μM trolox/g of dw) and Amorphophallus paeoniifolius (54.9 μM trolox/g of dw). As indicated in Table 2, the FRAP values range from 107.7 to 275.6 μM Fe(II) per g dw. Houttuynia cordata (275.6 μM Fe(II)/g dw) has the highest FRAP values followed by Amorphophallus paeoniifolius (217.7 μM Fe(II)/g dw) and Achasma nigra (192 μM Fe(II)/g dw) whereas Polygonum microcephalum (107.7 μM Fe(II)/g dw) has the lowest FRAP value. These results are supported with the findings of many research groups who have reported similar data for antioxidant activities of other common vegetable samples measured by ABTS and FRAP assay [24, 25].
3.2Total phenolic, total flavonoid and vitamin C content in the vegetables
There is a variation in the total phenolic content of the vegetables investigated; the values range from 4.62 to 14.74 mg GAE/g dw of raw sample (Table 3). Achasma nigra (14.74 mg GAE/g of dw) has the highest phenolic content, followed by Houttuynia cordata (14.30 mg GAE/g of dw) and Amorphophallus paeoniifolius (13.24 mg GAE/g of dw). Similar results for total phenolic content have been reported by Sreeramulu and Raghunath [15] for some root tuber and vegetables consumed in India. The amount of flavonoid content is found in the range of 0.65 to 7.72 mg QE/g of dw of raw sample (Table 3). Houttuynia cordata (7.72 mg QE/g of dw) containes the highest flavonoid followed by Amorphophallus paeoniifolius (6.23 mg QE/ g of dw) and Achasma nigra (5.32 mg QE/g of dw). Similar findings for flavonoids contents of some Thai indigenous plants have been reported by Maisuthisakul et al. [26]. The ascorbic acid (vitamin C) content of the vegetables is found to be high, ranging from 35.79 to 106.7 mg/100 g dw (Table 3). Oxalis corniculata contains the highest vitamin C (106.7 mg/100 dw) followed by Oxalis debilis (104.1 mg/100 g dw) and Ardisia colorata (89.7 mg/100 g dw). Vitamin C is a water soluble antioxidant which is in a unique position to scavenge aqueous peroxy radicals before they damage the lipids.
3.3Correlations between phenolic content and antioxidant capacity
A positive correlation is observed between total phenolic content and antioxidant activity of the vegetables measured by all the three assays (Fig. 1). Highest correlation between total phenolic content and antioxidant activity (R2 = 0.87, p < 0.05) is observed in ABTS (TEAC) followed by DPPH assay (R2 = 0.73, p < 0.05) and FRAP assay (R2 = 0.71, p < 0.05). Therefore phenolic compounds contribute significantly to the antioxidant capacity of the investigated vegetables. These results are in agreement with the findings of many research groups who have reported such positive correlations between antioxidant activity and total phenolic content [1, 27].
4Conclusion
The antioxidant activity of investigated green vegetables is well correlated with total phenolic content. The phenolic compounds may contribute directly to antioxidative the major phenolic action. The linear positive correlation between total phenolic content and total flavonoid content indicates that flavonoids are compounds. Vitamin C content is also found to be high. Finally it can be concluded that the investigated non-conventional leafy vegetables are potential sources of natural antioxidants.
Acknowledgments
We are grateful to University Grant Commission (UGC), New Delhi, India, for financial supports for conducting this study. We also thank Dr. Dinesh Ch. Deka, Associate Professor, Department of Botany, Birjhora Mahavidalya, Bongaigaon, Assam for providing the scientific names of the vegetables.
References
1 | Tawaha K , Alali FQ , Gharaibeh M , Mohammad M , El-Elimat T . Antioxidant activity and total phenolic content of selected Jordanian plant species. Food Chem. (2007) ;104: :1372–8. |
2 | Thomas RH , Bernards MA , Drake EE , Guglielmo CG . Changes in the antioxidant activities of seven herb- and spice-based marinating sauces after cooking. J Food Compos Anal. (2010) ;23: :244–52. |
3 | Faudale M , Viladomat F , Bastida J , Poli F , Codina C . Antioxidant activity and phenolic composition of wild, edible, and medicinal fennel from different Mediterranean countries. J Agric Food Chem. (2008) ;56: :1912–20. |
4 | Priyaadarsini KI , Khopde SM , Kumar SS , Mohan H . Free radical studies of ellagic acid, a natural phenolic antioxidant. J Agric Food Chem. (2002) ;50: :2200–6. |
5 | Zeng LB , Zhang ZR , Luo ZH , Zhu JX . Antioxidant activity and chemical constituents of essential oil and extracts of Rhizoma Homalomenae. Food Chem. (2011) ;125: :456–63. |
6 | Stangeland T , Remberg SF , Lye KA . Total antioxidant activity in 35 Ugandan fruits and vegetables. Food Chem. (2009) ;113: :85–91. |
7 | Moon JK , Shibamoto T . Antioxidant assays for plant and food components. J Agric Food Chem. (2009) ;57: (5):1655–66. |
8 | Babbar N , Oberoi HS , Uppal DS , Patil RT . Total phenolic content and antioxidant capacity of extracts obtained from six important fruit residues. Food Res Int. (2011) ;44: :391–6. |
9 | Huang D , Ou B , Prior RL . The chemistry behind antioxidant capacity assays. J Agric Food Chem. (2005) ;53: :1841–56. |
10 | Acqua SD , Cervellati R , Loi MC , Innocenti G . Evaluation of in vitro antioxidant properties of some traditional Sardinian medicinal plants: Investigation of the high antioxidant capacity of Rubusulmifolius . Food Chem. (2008) ;106: :745–9. |
11 | Zhen W , Wang SY . Antioxidant activity and phenolic compounds in selected herbs. J Agric Food Chem. (2001) ;49: (11):5165–70. |
12 | Gülçin İ . Antioxidant activity of food constituents: An overview. Arch Toxicol. (2012) ;86: :345–91. |
13 | Jiangning G , Xinchu W , Hou W , Qinghua L , Kaishun B . Antioxidants from a Chinese medicinal herb – Psoraleacorylifolia L. Food Chem. (2005) ;91: :287–92. |
14 | Wang S , Melnyk JP , Tsao R , Marcone MF . How natural dietary antioxidants in fruits, vegetables and legumes promotevascular health. Food Res Inter. (2011) ;44: :14–22. |
15 | Sreeramulu D , Raghunath M . Antioxidant activity and phenolic content of roots, tubers and vegetables commonly consumed in India. Food Res Inter. (2010) ;43: :1017–20. |
16 | Mao AA , Hynniewta TM . Floristic diversity of North East India. J Assam Sci Soc. (2000) ;41: (4):255–66. |
17 | Mao AA , Hynniewta TM , Sanjappa M . Plant wealth of Northeast India with reference to ethnobotany. IJTK. (2009) ;8: (1):96–103. |
18 | Proestos C , Boziaris IS , Nychas GJE , Komaitis M . Analysis of flavonoids and phenolic acids in Greek aromatic plants: Investigation of their antioxidant capacity and antimicrobial activity. Food Chem. (2006) ;95: :664–71. |
19 | Papageorgiou V , Mallouchos A , Komaitis M . Investigation of the antioxidant behavior of air- and freeze-dried aromatic plant materials in relation to their phenolic content and vegetative cycle. J Agric Food Chem. (2008) ;56: (14):5743–52. |
20 | Re R , Pellegrini N , Proteggente A , Pannala A , Yang M , Rice-Evans C . Antioxidant activity applying an improved ABTS radical cation decolorization assay. Free Radical Biol & Medicine. (1999) ;26: :1231–7. |
21 | Benzie IFF , Strain JJ . The Ferric Reducing Ability of Plasma (FRAP) as a Measure of “Antioxidant Power”: The FRAP Assay. Anal Biochem. (1996) ;239: :70–6. |
22 | Al-duaias M , Hohbein J , Werner S , Bohm V , Jetschke G . Contents of vitamin C, carotenoids, tocopherols, and tocotrienols in the subtropical plant species Cyphostemmadigitatum as affected by processing. J Agric Food Chem. (2009) ;57: :5420–7. |
23 | Dasgupta N , De B . Antioxidant activity of some leafy vegetables of India: A comparative study. Food Chem. (2007) ;101: :471–4. |
24 | Luximon-Ramma A , Bahorun T , Soobrattee AM , Aruoma OI . Antioxidant activities of phenolic, proanthocyanidin, and flavonoid components in extracts of Cassia fistula. J AgricFood Chem. (2002) ;50: :5042–47. |
25 | Wojdylo A , Oszmiański J , Czemerys R . Antioxidant activity and phenolic compounds in 32 selected herbs. Food Chem. (2007) ;105: :940–9. |
26 | Maisuthisakul P , Suttajit M , Pongaswatmanit R . Assessment of Phenolic content and free radical-scavenging capacity of some Thai indigenous plants. Food Chem. (2007) ;100: :1409–18. |
27 | Cai Y , Luo Q , Sun M , Corke H . Antioxidant activity and phenolic compounds of 112 traditional Chinese medicinal plants associated with anticancer. Life Sci. (2004) ;74: :2157–84. |
Figures and Tables
Fig.1
Correlation between total phenolic content antioxidant activity. (a) Total phenolic content and DPPH antioxidant activity (1/IC50). Correlation coefficient R = 0.80 and coefficient of determination R2 = 0.73 (p < 0.05). (b) Total phenolic content and ABTS antioxidant activity (TEAC). Correlation coefficient R = 0.92 and coefficient of determination R2 = 0.87 (p < 0.05). (c) Total phenolic content and FRAP antioxidant activity. Correlation coefficient R = 0.84 and coefficient of determination R2 = 0.71 (p < 0.05).
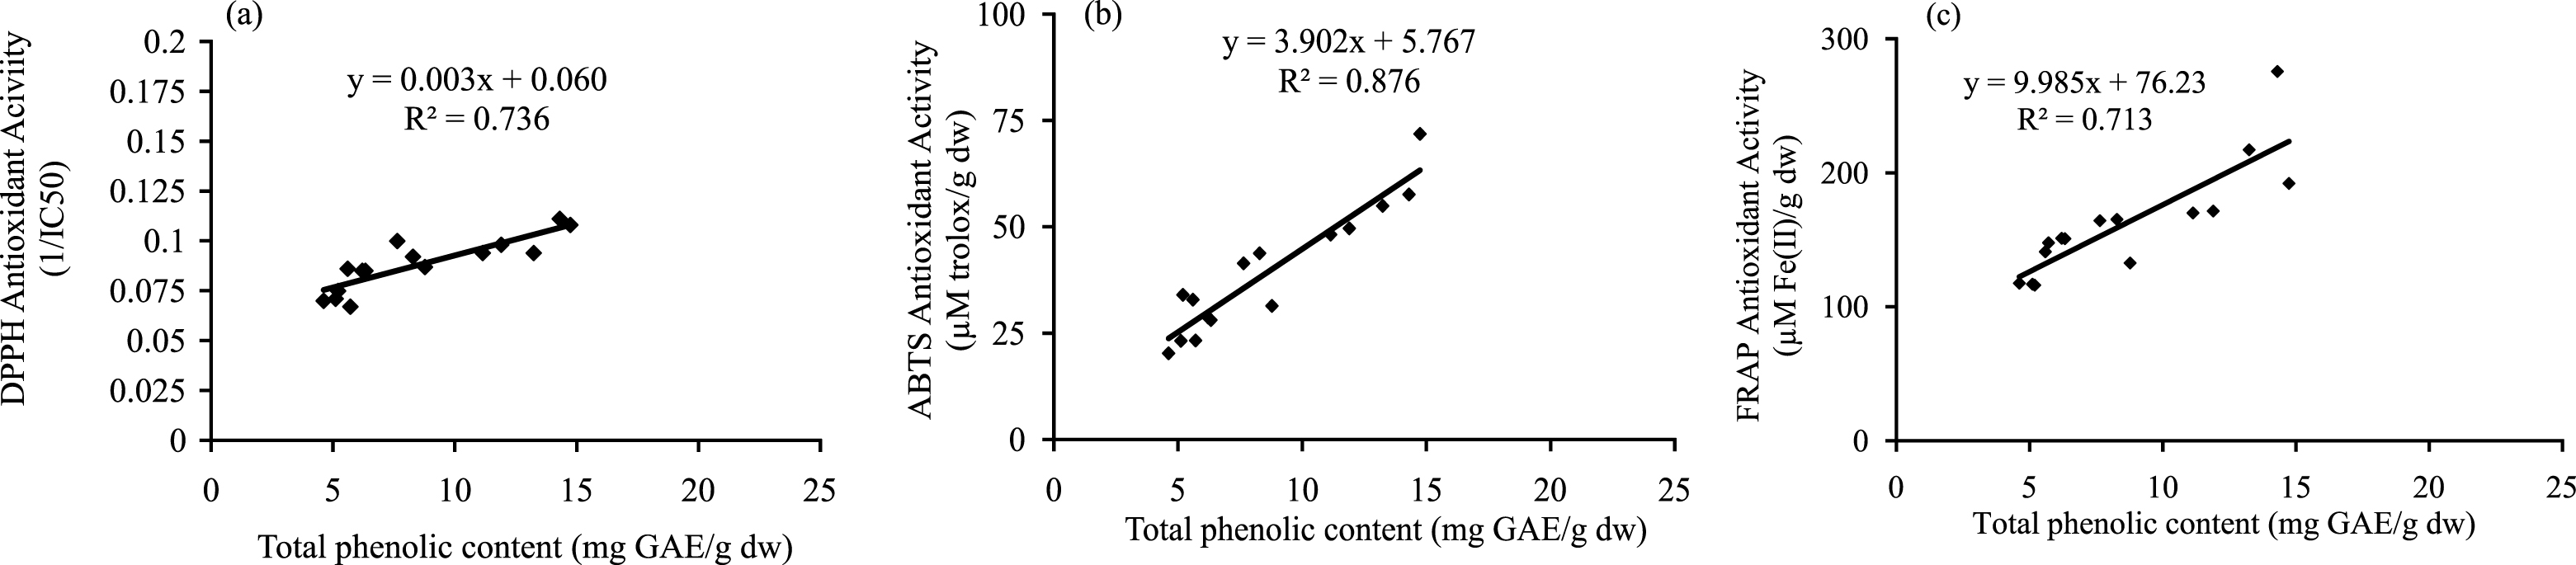
Table 1
List of vegetables
| Scientific name | Family | Local name (Assamese name) | Edible part used |
| Achasma nigra (Gaertn) Buru | Zingiberaceae | Tora | Stem, leaf |
| Alternanthera sesilis (L.) R. Br. ex DC. | Amaranthaceae | Matikanduri | Twigs |
| Amorphophallus paeoniifolius (Dennst.) Nicolson | Araceae | Olkasu | Whole plant |
| Ardisia colorata Roxb. | Primulaceae | Noltenga | Leaf |
| Centella asiatica (L.) Urban | Apiaceae | Bar manimoni | Whole plant |
| Enhydra fluctuans Lour. | Asteraceae | Helachi | Twigs |
| Houttuynia cordata Thunb | Saururaceae | Masandari | Leaf |
| Hydrocotyle sibthorpioides Lamk | Apiaceae | Sarumaninoni | Whole plant |
| Ipomoea aquatica Forssk | Convolvolaceae | Kalmou | Twigs |
| Lasia spinosa (L) Thw | Araceae | Sengmora | Whole plant |
| Oxalis corniculata L | Oxalidaceae | Sarutengesi | Whole plant |
| Oxalis debilis var. corymbosa (DC) Lour | Oxalidaceae | Bartengesi | Whole plant |
| Paederia scandens (Lour) Merr. | Rubiaceae | Vadailata | Leaf |
| Polygonum microcephalum D. Don | Polygonaceae | Madhusaleng | Twigs |
| Talinumtria ngulare (Jacq.) Willd. | Portulacaceae | Piralipaleng | Leaf |
Table 2
Total antioxidant capacity of vegetables. All data are the means±SD of triplicate experiment (n = 3)
| Samples | DPPH (IC50 value (mg/L) | ABTS ( μM trolox/g dw) | FRAP( μM Fe(II)/g dw) |
| Achasma nigra | 91.8 ± 1.5 | 71.8 ± 1.28 | 192.0 ± 0.57 |
| Alternanthera sesilis | 108.5 ± 1.3 | 43.8 ± 0.40 | 165.3 ± 0.49 |
| Amorphophallus paeoniifolius | 106.1 ± 1.3 | 54.9 ± 1.36 | 217.1 ± 1.63 |
| Ardisia colorata | 113.9 ± 6.1 | 31.4 ± 0.62 | 132.6 ± 0.40 |
| Centella asiatica | 105.3 ± 1.0 | 47.2 ± 0.89 | 170.1 ± 0.87 |
| Enhydra fluctuans | 139.0 ± 2.1 | 23.2 ± 0.32 | 116.9 ± 0.57 |
| Houttuynia cordata | 89.8 ± 1.5 | 57.6 ± 0.49 | 275.6 ± 2.14 |
| Hydrocotyle sibthorpioides | 101.8 ± 1.2 | 47.6 ± 0.44 | 171.5 ± 1.20 |
| Ipomoea aquatica | 132.2 ± 1.5 | 34.0 ± 0.54 | 116.2 ± 1.21 |
| Lasia spinosa | 99.2 ± 1.2 | 41.4 ± 0.46 | 164.2 ± 1.02 |
| Oxalis corniculata | 116.4 ± 1.8 | 28.1 ± 0.61 | 150.8 ± 0.57 |
| Oxalis debilis | 117.4 ± 2.8 | 28.6 ± 0.53 | 151.1 ± 1.00 |
| Paederia scandens | 116.2 ± 3.2 | 32.9 ± 0.61 | 141.1 ± 0.74 |
| Polygonum microcephalum | 149.7 ± 1.2 | 23.4 ± 0.24 | 147.7 ± 0.53 |
| Talinum triangulare | 142.6 ± 5.4 | 18.39 ± 0.24 | 117.5 ± 0.47 |
Table 3
Total phenolic content, total flavonoid content and the ascorbic acid content of the raw vegetables. All data are the means ± SD of triplicate experiment
| Samples | Total phenolic content (mg GAE/g dw) | Total flavonoid content (mg QE/g dw) | Vitamin C (mg/100 g dw) |
| Achasma nigra | 14.74 ± 0.17 | 5.32 ± 0.15 | 35.79 ± 0.76 |
| Alternanthera sesilis | 8.28 ± 0.54 | 2.17 ± 0.14 | 35.16 ± 1.69 |
| Amorphophallus paeoniifolius | 13.24 ± 0.48 | 6.23 ± 0.04 | 48.88 ± 0.87 |
| Ardisia colorata | 8.78 ± 0.19 | 3.74 ± 0.02 | 89.71 ± 4.21 |
| Centella asiatica | 11.14 ± 0.21 | 4.24 ± 0.12 | 75.72 ± 3.21 |
| Enhydra fluctuans | 5.11 ± 0.07 | 0.81 ± 0.04 | 52.16 ± 2.10 |
| Houttuynia cordata | 14.30 ± 0.45 | 7.72 ± 0.23 | 57.45 ± 2.78 |
| Hydrocotyle sibthorpioides | 11.90 ± 0.60 | 4.65 ± 0.29 | 50.54 ± 3.33 |
| Ipomoea aquatica | 5.20 ± 0.30 | 1.44 ± 0.16 | 67.97 ± 2.51 |
| Lasia spinosa | 7.64 ± 0.20 | 3.20 ± 0.04 | 49.57 ± 1.78 |
| Oxalis corniculata | 5.60 ± 0.28 | 1.12 ± 0.06 | 47.14 ± 2.11 |
| Oxalis debilis | 5.71 ± 0.79 | 2.63 ± 0.01 | 83.71 ± 3.45 |
| Paederia scandens | 6.33 ± 0.05 | 1.40 ± 0.14 | 106.7 ± 4.21 |
| Polygonum microcephalum | 6.21 ± 0.08 | 1.22 ± 0.06 | 104.1 ± 3.76 |
| Talinum triangulare | 4.62 ± 0.58 | 0.65 ± 0.02 | 46.71 ± 2.78 |


