
SETD2 Regulates the Methylation of Translation Elongation Factor eEF1A1 in Clear Cell Renal Cell Carcinoma1
Abstract
BACKGROUND:
SET domain-containing protein 2 (SETD2) is commonly mutated in renal cell carcinoma. SETD2 methylates histone H3 as well as a growing list of non-histone proteins.
OBJECTIVE:
Initially, we sought to explore SETD2-dependent changes in lysine methylation of proteins in proximal renal tubule cells. Subsequently, we focused on changes in lysine methylation of the translation elongation factor eEF1A1.
METHODS:
To accomplish these objectives, we initially performed a systems-wide analysis of protein lysine-methylation and expression in wild type (WT) and SETD2-knock out (KO) kidney cells and later focused our studies on eEF1A1 as well as the expression of lysine methyltransferases that regulate its lysine methylation.
RESULTS:
We observed decreased lysine methylation of the translation elongation factor eEF1A1. EEF1AKMT2 and EEF1AKMT3 are known to methylate eEF1A1, and we show here that their expression is dependent on SET-domain function of SETD2. Globally, we observe differential expression of hundreds of proteins in WT versus SETD2-KO cells, including increased expression of many involved in protein translation. Finally, we observe decreased progression free survival and loss of EEF1AKMT2 gene expression in SETD2-mutated tumors predicted to have loss of function of the SET domain.
CONCLUSION:
Overall, these data suggest that SETD2-mutated ccRCC, via loss of enzymatic function of the SET domain, displays dysregulation of protein translation as a potentially important component of the transformed phenotype.
INTRODUCTION
Renal cell carcinoma (RCC) is among the top ten most common cancers in the United States, with more than 70,000 new patients expected to be diagnosed in the next year [1]. Within RCC, the most common histological subtype is clear cell renal cell carcinoma (ccRCC), occurring in approximately 75% of cases [2]. ccRCC tumors follow a shared pathway of molecular pathogenesis, beginning with loss of the short arm of chromosome 3 (3p) [3]. Within 3p are numerous tumor suppressor genes (TSGs) that are commonly deleted in ccRCC, including VHL, PBRM1, SETD2, and BAP1. These 3p TSGs are thought to follow the two-hit hypothesis, with subsequent mutation or hypermethylation resulting in loss of function of the second allele. This is most commonly seen with VHL ( 90% of cases) [4]. Though the loss of VHL is considered to be necessary for tumorigenesis, it is not sufficient [5]. Biallelic VHL loss is usually followed by a mutation in the second, remaining copy of other 3p TSGs, including PBRM1, BAP1, SETD2, and/or KDM5C [6]. In ccRCC, inactivating mutation of the histone methyltransferase SETD2 occurs in roughly 12% of primary tumors and is likely lost in > 60% of metastatic tumors [7], suggesting its loss of function is important for disease progression.
SETD2 regulates chromatin structure by contributing to the histone code [8]. “Writers”, “readers”, and “erasers” constitute the histone code and contribute to the regulation of gene expression [9]. This code is primarily made up of various post-translational modifications (PTMs) applied to the histone tail and serve distinct purposes [8]. Some PTMs, such as the acetylation of histone 4 lysine (H4K12), are repressive marks, indicating a silenced gene. Other marks, such as the trimethylation of H3K36, are activation marks, indicating an actively transcribed gene. SETD2 is the only known methyltransferase capable of H3K36 trimethylation [10, 11] and influences diverse processes around transcribed genes including mRNA splicing [12], cryptic transcription [13], DNA repair [14], chromosomal segregation [15], and others. Despite its role in these numerous pathways, a full understanding of the mechanism whereby loss of SETD2 promotes tumor progression remains unclear.
Although protein methylation has predominantly been studied in the context of the histone code, the vast majority of the methylproteome includes non-histone proteins [16]. Other processes regulated by methylation include RNA metabolism, cell cycle progression, apoptosis, and protein translation [16]. Recently, lysine methylation has been shown to regulate protein translation in cancer, with METTL13-mediated lysine methylation of eEF1A1 being required for KRAS-driven tumors [17]. Other work has determined that methylation regulates proteins involved with peptide synthesis, including both ribosomal proteins and translation factors [18]. A key elongation factor in protein translation, eEF1A1, has 6 known lysine methylation sites [19]. However, how these sites regulate protein translation remains to be fully elucidated.
Many methyltransferases are known to have multiple targets [16]. SETD2 methylates multiple proteins, including alpha-tubulin [20], Signal transducer and activator of transcription 1 (STAT1) [21], and Enhancer of zeste homolog 2 (EZH2) [22]. We sought to perform a systems-wide analysis of SETD2-dependent changes in the tumor proteome. Here, we quantitatively measured changes in protein lysine methylation and expression in wild type (WT) and SETD2-knock out (KO) human kidney cells using mass spectrometry. Through this, we identified a novel role for SETD2 in regulating the methylation of eukaryotic elongation factor 1A (eEF1A1) as well as expression of proteins required for protein translation. In patient tumors, we observed up-regulation of protein translation genes in SETD2-mutated tumors. These data suggest a new potential mechanism whereby loss of SETD2 influences cell function during the progression of cancer.
MATERIALS AND METHODS
Cell culture
The HKC cell line was obtained from Dr. Lorraine Racusen (Johns Hopkins University, Baltimore, MD) [23]. 786-0 and 293T cell lines were obtained from the American Type Culture Collection (ATCC). SETD2-null cell lines were previously generated using transcription activator-like effector nucleases (TALEN) targeted to exon 3 of SETD2, as described [20, 24]. Truncated SETD2, a SET-domain mutant (R1625 C), and an SRI-domain mutant (R2510 H) were introduced in SETD2-deficient cells as previously described [24]. 786-0 cells were cultured in RPMI media (Gibco, catalogue no. 11875093), while HKC and 293T cells were cultured in DMEM media (Gibco, catalogue no. 11965092). All media contained 10% FBS and 1% penicillin/streptomycin. All cell lines were tested for mycoplasma contamination before use and at regular intervals during experimentation (ABM, catalogue no. G238). STR validation was performed on applicable cell lines.
Immunoblot analysis
Each adherent cell line was washed with 1X PBS. Cells were lysed in RIPA buffer (Sigma, catalogue no. R0278), followed with a 30-minute (min) incubation on ice. Whole cell lysate was collected after centrifugation at 20,000 g for 20 min. For each sample, 20μg of protein was run on a 4–20% SDS-PAGE gel and transferred onto polyvinylidene difluoride (PVDF) membranes. After blocking with 5% bovine serum albumin in TBST (50 mmol/L Tris pH 7.5, 150 mmol/L NaCl, and 0.1% Tween 20), membranes were probed overnight at 4°C with anti-SETD2 (Sigma, catalogue no. HPA042451) and anti-beta-actin (Cell Signaling Technology, catalogue no. 4970) antibodies. After washing with TBST, membranes were probed with either goat anti-mouse IgG-HRP (Promega, catalogue no. W4021) or goat anti-rabbit IgG-HRP (catalogue no. W4011). ImageJ software was used for blot intensity quantification.
Histone extraction
Histones were acid extracted overnight as previously described (www.Abcam.com), followed by acid neutralization with Tris-HCl, pH. 8.0. Histone post-translational modifications were then analyzed using 2.5μg of extract and anti-H3K36me3 (Cell Signaling Technology, catalogue no. 4909) and anti-pan H3 (Abcam, catalogue no. ab1791) antibodies through immunoblot analysis.
Detection of global lysine methylation through mass spectrometry
Cells were SILAC labeled per established protocols [25, 26]. Briefly, cells were cultured with either “light” media containing lysine and arginine with normal isotopic distribution or “heavy” media containing 13 C/15N-isotope labeled lysine and arginine. Cells were passaged 10 times and SILAC labelling efficiency checked via mass spectrometry prior to further analysis. Whole protein lysates were analyzed for total protein expression and lysine methylated peptides were enriched using reagents from Cell Signaling Technology (catalogue no. 14809). In short, lysate from SILAC-labelled isogenic SETD2 WT and KO HKC whole cell lysates were trypsin-digested, then immunoprecipated with anti-pan-methyl lysine antibody beads. Peptide eluate was then identified and quantified via LC-MS/MS. For whole proteome analysis, aliquots of the mixed SILAC-labeled lysates containing 20μg of protein were acetone precipitated, reduced, alkylated, and trypsin-digested. LC-MS/MS analysis of the peptides was performed using a Q Exactive mass spectrometer (Thermo Scientific). The peptides were loaded onto a self-packed biphasic C18/SCX MudPIT column using a Helium-pressurized cell (pressure bomb). LC-MS/MS was performed with an 11-step ammonium acetate salt pulse gradient. Peptides were eluted from the analytical column after each salt step with a 90-min reverse gradient (2–50% acetonitrile, 0.1% formic), followed by a 10-min equilibration at 2 % B, for the first 10 salt pulses. For the final salt step, a gradient consisting of 2–98% acetonitrile was used. Data were collected using a data-dependent method. Please see Supplemental Methods for further detail.
Mass spectrometry and pathway enrichment analyses
For both total protein and lysine-methylated peptide proteomics data analysis, the raw files were processed with the MaxQuant v1.5.8.3 [27] and searched with Andromeda search engine against the human UniProt database v20120610 (20245 entries) and integrated with FASTA sequences of 247 contamination proteins. The precursor ion mass deviations of first search and main search were set as 20 ppm and 10 ppm, while fragment mass deviation of 20 ppm was used. The minimum peptide length was set to 7 amino acids and strict specificity for trypsin cleavage was required, allowing up to two missed cleavage sites. Multiplicity of 2 was used, selecting arginine (+10 Da) and lysine (+8 Da) as heavy labels. Re-quantification and matching between runs were selected. Protein was identified with a minimum of one unique peptide. The false discovery rates at the protein, peptide and site level were set to 2%, 1% and 2%. Oxidation (M) was set as variable modification and Carbamidomethyl (C) was set as static modification. For the lysine-methylated peptide dataset, Methyl (K), Dimethyl (K) and Trimethyl (K) were also set as variable modifications. The chromatograph of identified methylated peptides were extracted using ProteomicsTools and manually validated based on light/heavy ion chromatograph correlation, distance between theoretical and observed peptide mass profile, and light/heavy isotopic profile cosine similarity [28]. The precursor mass is calculated dynamically based on sequence and modification with 10 ppm as a tolerance window. For total proteomics dataset, quantified proteins were ranked by mean of log ratio cross samples and gene set enrichment analysis was performed using GSEA package [29]. Then, the proteins quantified in only one sample or the proteins with inconsistent relative quantification change direction (knockout vs wild type) were discarded. This analysis algorithm includes more proteins and focuses on large gene sets rather than individual high scoring genes (which may be poorly annotated and may not be reproducible), and has been adapted for use in proteomics data sets [30, 31].
For RNA sequencing data, reads were aligned to the human b37 genome using STAR v2.5.3a [32]. Ensembl v75 gene annotations were provided to STAR to improve the accuracy of mapping. Quality control on raw reads was performed using FastQC (https://www.bioinformatics.babraham.ac.uk/projects/fastqc). FeatureCounts v1.15.2 [33] was used to count the number of mapped reads to each gene. Significantly differential expressed genes with FDR-adjusted p-value<0.05 and absolute fold change > 2.0 were detected by DESeq2 (v1.18.1) [34]. Heatmap3 [35] was used for cluster analysis and visualization. Genome Ontology and KEGG pathway over-representation analysis was performed on differentially expressed genes using the WebGestaltR package [36]. Gene set enrichment analysis was performed using GSEA package [29]. The FASTQ files were uploaded to NCBI Sequence Read Archive (https://www.ncbi.nlm.nih.gov/sra), submission SUB8418537.
Size enrichment of eEF1A1 proteins
SILAC-labeled protein lysates from SETD2-WT and -KO cells were mixed 1 : 1, and 50μg of the mixed lysates (25μg of WT lysate and 25μg KO lysate) were loaded onto a NuPAGE 10% Bis-Tris gel. The gel was stained with Coomassie stain, and the region corresponding to approximately 48 –52 kDa was excised and diced for in-gel digestion. Proteins were reduced, carbamidomethylated, destained, and trypsin digested. Peptides were extracted by gel dehydration, dried by speed vac centrifugation, and reconstituted in 0.1% formic acid and analyzed by LC-MS/MS via methods similar to those previously described. Peptides mass analysis was performed using a data-dependent method, with an inclusion list of specific m/z values corresponding to various forms of the eEF1A1 peptide MDSTEPPYSWKR. The inclusion list included methylated forms of the peptide in both light and heavy labeled conditions. Comparison of the heavy and light forms of eEF1A1 MDSTEPPYSQK(me3)R (eEF1A1_K318) peptide were conducted in WT and KO cells in two replicates independent of lysine methyl-peptide enrichment. See Supplemental Methods for further detail.
Synthetic heavy-labeled peptide-aided peptide quantification
A synthetic peptide labeled with heavy arginine (13 C, 15 N) was formulated for the MDSTEPPYSQK(me3)R (eEF1A1_K318) peptide (HeavyPeptide AQUA custom synthesis service, Life Technologies). Synthetic peptides were spiked into the WT and SETD2-KO lysates from the HKC and 786-O cells, allowing for relative quantification of the endogenous methylated peptide in non-SILAC-labeled cells. First, HKC and 786-O lysates (50μg) were separated on gel as described previously, and the eEF1A1 gel regions were excised and in-gel digested with trypsin. WT and KO lysates were prepared in triplicate for LC-MS/MS analysis of eEF1A1. Following in-gel digestion, the peptides were reconstituted in 20μL of 0.1% formic acid. Aliquots (8μL) of each digest from the triplicate WT and KO lysates were then spiked with the synthetic peptide to make a solution of 12μL containing 50 fmol/μL of the synthetic peptide. For LC-MS/MS, 2.5μL of the spiked in-gel digests were analyzed on a Q Exactive Plus mass spectrometer. The method consisted of both data-dependent and targeted PRM scan events. Following data-dependent MS2 scan events, the method included targeted PRM scans of m/z values corresponding to the light and heavy eEF1A1 peptide MDSTEPPYSWK(me3)R. Targeted m/z values included oxidized and unoxidized forms of the peptide in both light and heavy SILAC states. PRM data were imported into Skyline [37], product ions were evaluated, and integrated areas were calculated in Skyline for y-type ions, y6 –y11, for each peptide precursor. Areas were summed for the light precursors and heavy precursors separately, and then ratios of the summed areas for WT and KO samples were calculated and used to determine the difference in the relative amount of the peptide MDSTEPPYSWK(me3)R peptide. See Supplemental Methods for more detail.
RT-qPCR
Cells were harvested and RNA was extracted using the RNeasy Mini Kit (Qiagen, catalogue no. 74106). For each sample, a total of 500 ng of RNA was reverse transcribed into cDNA using oligo(dT) from the SuperScript IV First-Strand Synthesis System (Thermo Fisher, catalogue no. 18091050). After completion of cDNA synthesis, each reaction was diluted 1 : 10. qPCR was performed in triplicate, using 10μL of SYBR Green PCR Master Mix (Thermo Fisher, catalogue no. 4309155), 4 uL of diluted cDNA, 1μL of 10 uM primers, and 5μL of nuclease-free water. PCR plates were run on a CFX96 Touch Real-Time PCR Detection System (BioRad), with a program of 10 min at 95°C and 40 cycles of 95°C for 10 seconds and 62°C for 30 seconds. Amplification purity was tested by melt curve. Real-time PCR data was analyzed using the comparative CT method [38]. The beta-actin primer sequences are as follows (5’ to 3’): forward AGAGCTACGAGCTGCCTGAC and reverse AGCACTGTGTTGGCGTACAG. The EEF1AKTM2 primer sequences are as follows (5’ to 3’): forward TGGACCAAGGAAGAGTTGCT and reverse GGAGGCTGAAGTGGAAAAGA. The EEF1AKTM3 primer sequences are as follows (5’ to 3’): forward TGTGGGACGCGGCCCTGAG and reverse TGCCAAGATCCCCACGATGCC.
RNA-Seq
RNASeq libraries were generated using Ribo-Zero Plus rRNA Depletion Kit (Illumina) kits per manufacturer’s instructions. Individual libraries were assessed for quality using the Agilent 2100 Bioanalyzer and quantified with a Qubit Fluorometer. Paired-end sequencing of multiplexed libraries was performed on the Hiseq 4000 platform (Illumina) using PE75 read lengths by the Vanderbilt Technologies for Advanced Genomics (VANTAGE) core (Vanderbilt University, Nashville, TN). The FASTQ files for the RNA-seq data comparing gene expression in wild type versus SETD2 knock-out HKC cells have been uploaded to NCBI Sequence Read Archive (https://www.ncbi.nlm.nih.gov/sra), BioProjectID PRJNA675622.
Patient cohort analyses
TCGA kidney renal cell cancer datasets were downloaded from cbioportal.org. SET domain mutations were defined as non-synonymous mutations in the SET domain of SETD2, or truncating mutations in the 5’ region of the SET domain. Differentially expressed genes associated with SET domain mutations vs. WT samples were identified using t-test, and gene set enrichment analysis was performed using GSEA using MSigDB C5 genesets [29]. Analyses were performed using R version 3.6.0.
Statistical analyses
Statistical analyses, unless stated otherwise, were performed with GraphPad Prism version 9.0.0. Please see supplemental methods for details of statistics used in the analysis of RNA-seq data, proteomics data, and clinical data. An unpaired, two-tailed t test was used for comparison of lysine methylation in WT and SETD2-KO lysates (Fig. 2f). In the validation experiment (Fig. 2g), an unpaired, one-tailed t test was used as directionality was already established in the screen (Table 2). An unpaired, two-tailed t test was used for all comparisons in Fig. 3.
Fig. 2
Loss of SETD2 expression results in loss of eEF1A1 methylation. In order to validate MaxQuant peptide quantification, further analyses were conducted. The extracted ion chromatograms (EIC) were manually analyzed. The ratio of the a-b) eEF1A1_K318 peptide intensity was calculated in the WT and SETD2-KO lysates (AUC of the grey zones compared; vertical gold line corresponds to retention time at which the peptide was originally identified). c-d) EICs were also analyzed for the peptide eEF1A1_K165 WT/KO ratio. e) The ratio of eEF1A1_K165 was compared in SILAC-labelled lysate again (replicates “C” and “D”). However, instead of enrichment via immunoprecipitation with anti-Kme(1-3) antibody, the eEF1A1 protein was cut from a gel (i.e., enrichment based on protein size). f) The six above replicates were included for a pooled analysis, which demonstrates an increase in the WT/KO ratio for the K165me3 peptide relative to the K165me2 ratio. g) Synthetic peptide labeled with heavy arginine (13 C, 15 N) was formulated for eEF1A1_K165(me3). Synthetic peptides were spiked into WT and SETD2-KO lysates for HKC and 786-O, allowing for relative quantification of peptide in non-SILAC-labeled systems.
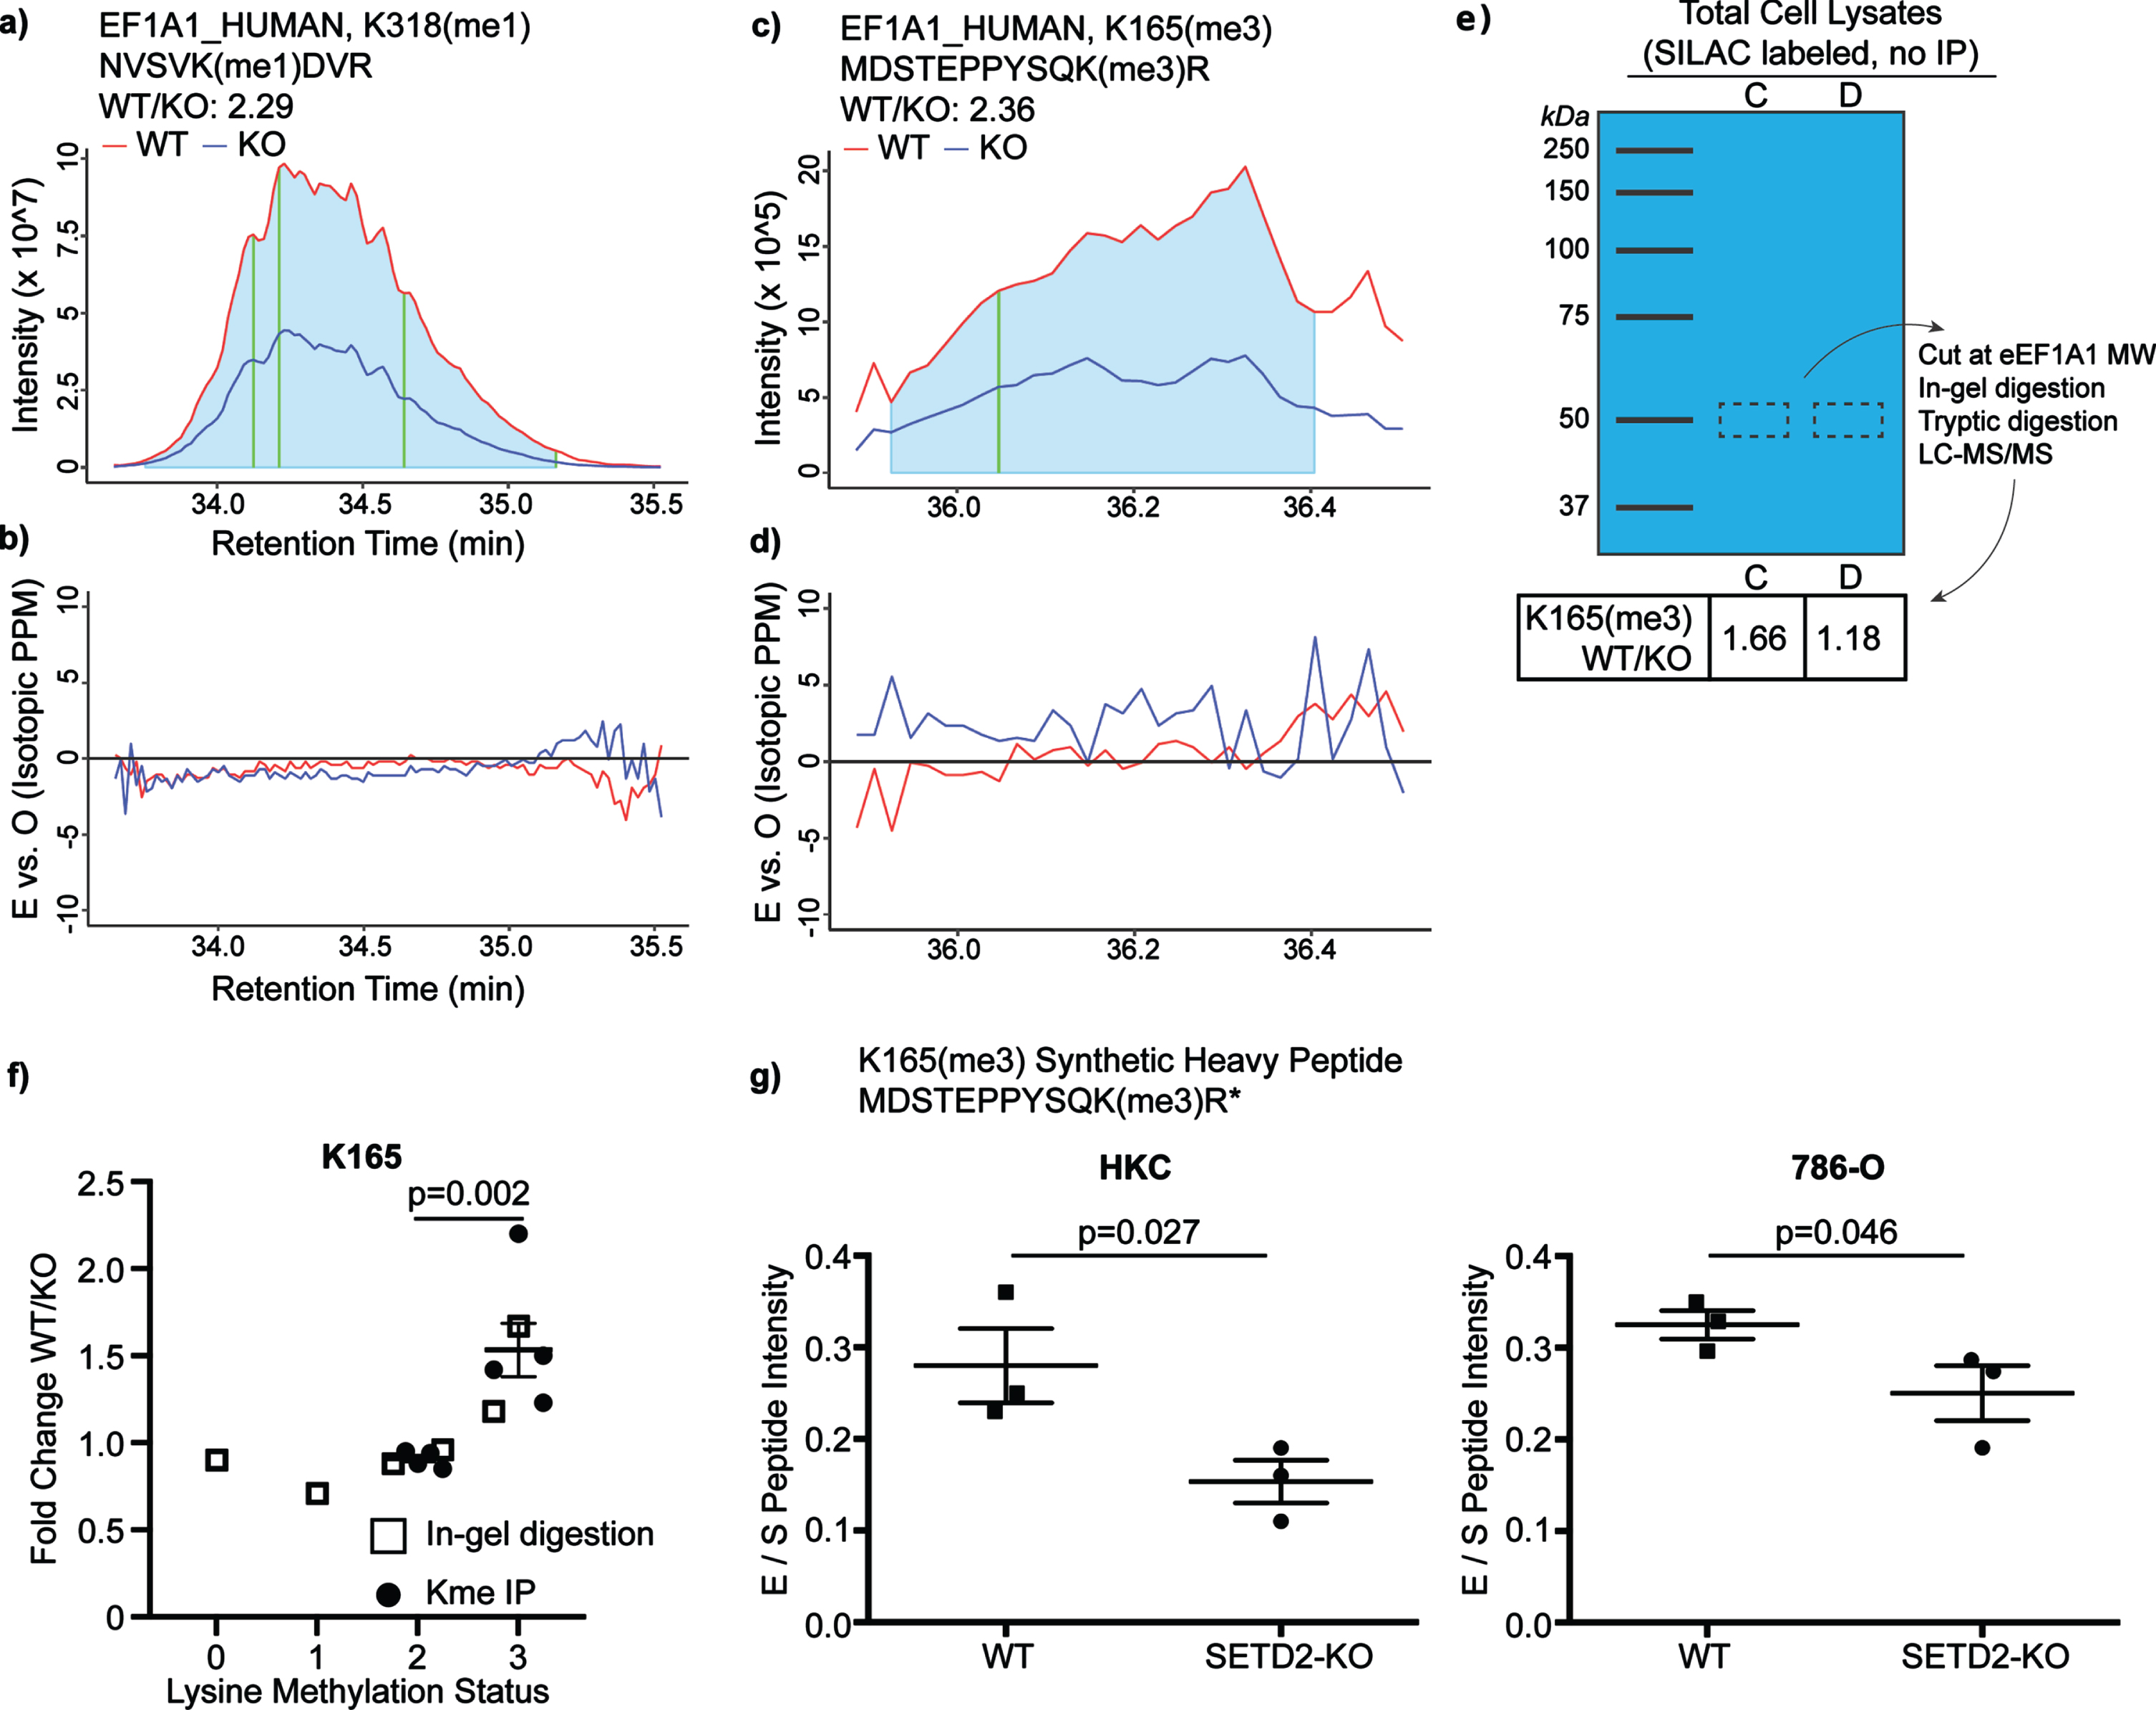
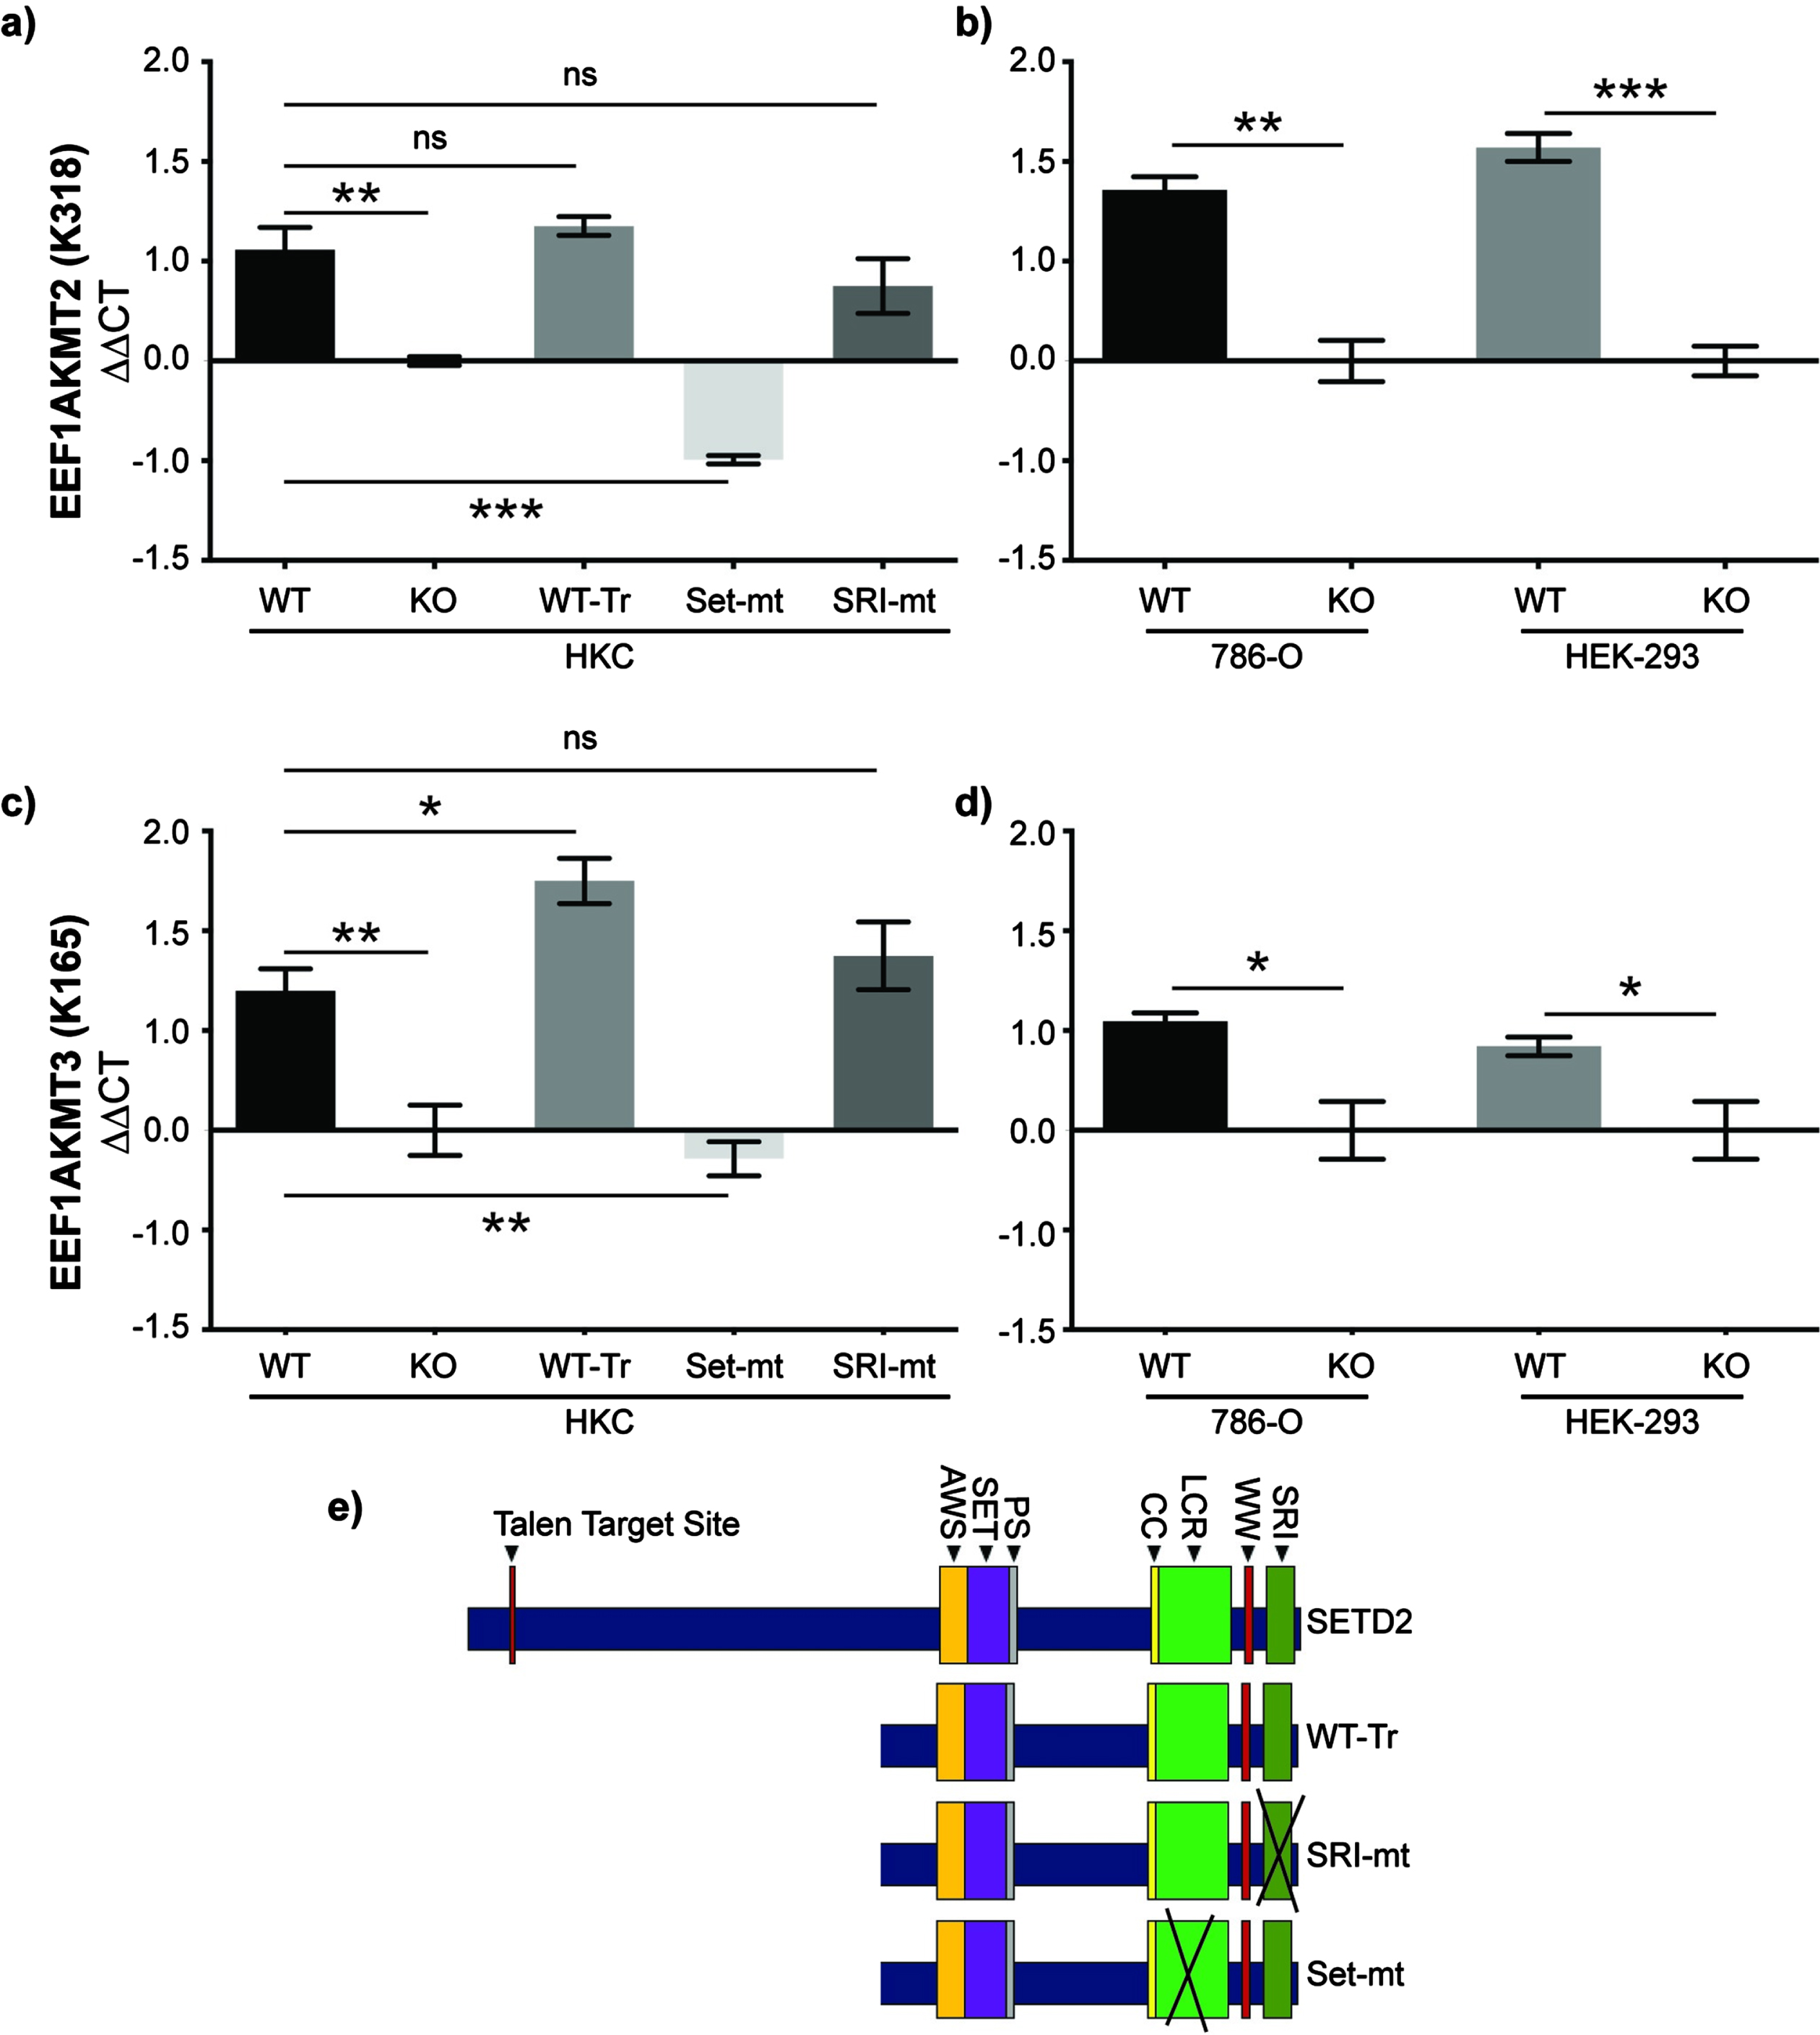
Fig. 3
SET domain function of SETD2 is necessary for expression of methyltransferases that target eEF1A1_K165 and eEF1A1_K318. a) RT-qPCR was performed in WT and SETD2-KO human proximal tubule (HKC) cells. Expression was also evaluated in SETD2-KO cells rescued with either truncated WT SETD2 (WT-Tr) or truncated SETD2 harboring mutations in the SRI (SRI-mt) or SET (Set-mt) domains. These rescue cell lines were developed by Hacker et al., J Biol Chem 2016. Gene expression of b) the K318 methyltransferase EEF1AKMT2 and c) the K165 methyltransferase EEF1AKMT3 was measured in these five cell lines. As validation, gene expression d) EEF1AKMT2 and e) EEF1AKMT3 was also measure in clear cell renal cell carcinoma (786-O) and human embryonic kidney (HEK 293FT) cell lines. Gene expression of EEF1AKMT2 and EEF1AKMT3 was normalized to SETD2-KO HKC cells. ns = p>0.05; *p<0.05; **p<0.01; ***p<0.001.
RESULTS
Loss of SETD2 results in decreased eEF1A1 methylation
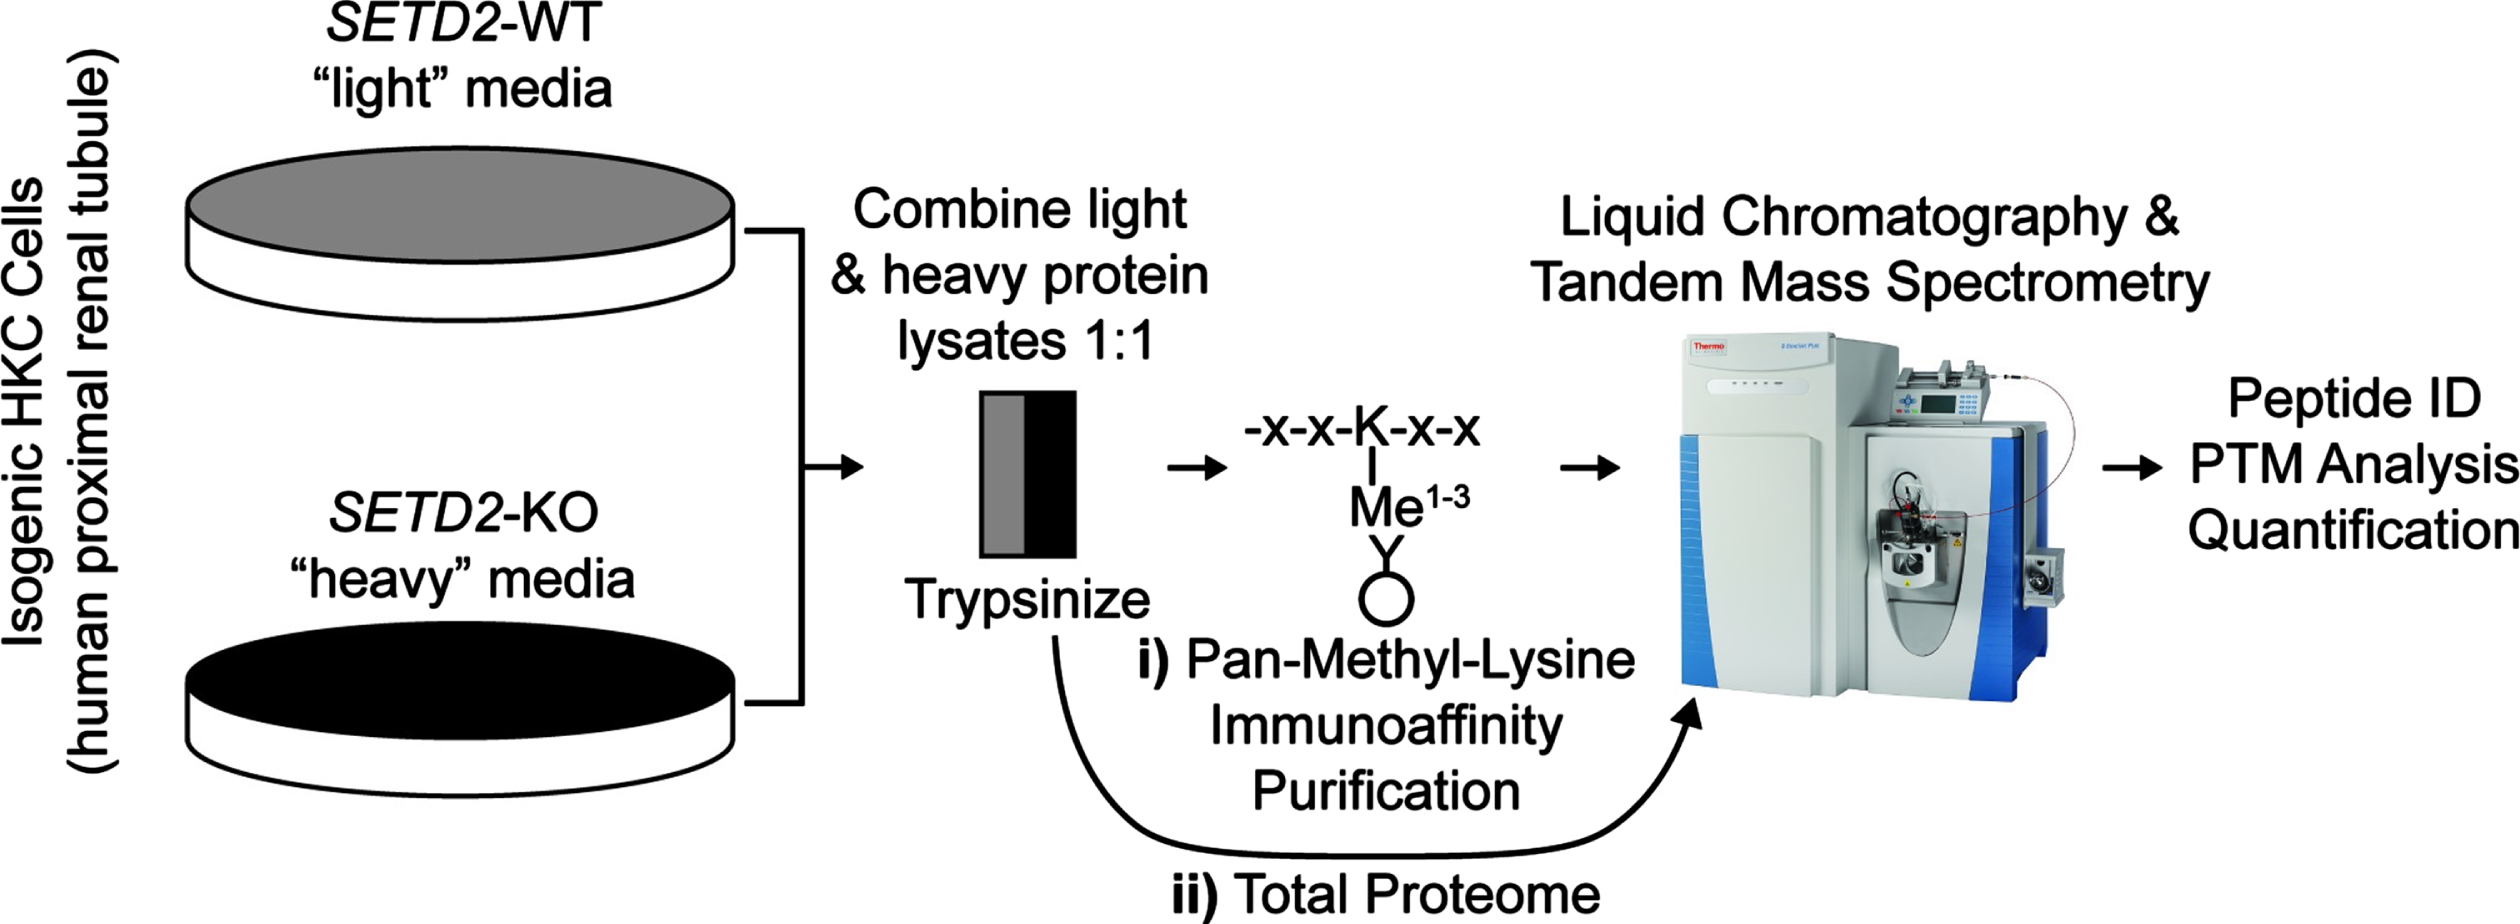
In order to study SETD2-dependent changes to lysine methylation in kidney cells, we performed immunoprecipitation (IP) followed by liquid chromatography-tandem mass spectrometry (LC-MS/MS) to catalog methyl lysine peptides in human SV40 immortalized proximal tubule kidney cells (HKC) either expressing endogenous protein or lacking SETD2 from a model generated by TALEN deletion (Fig. 1). The SETD2-knock out (KO) cell lines were previously created in our lab and are described elsewhere [24]. SETD2 status in HKC cell lines was validated by western blot (Sup Fig. 1). Protein extract without IP was analyzed for total protein expression. Peptide quantification was facilitated with the use of Stable Isotope Labeling with Amino acids in Cell culture (SILAC) [26] with global analysis demonstrating a normal distribution of heavy (labeled) and light (unlabeled) proteins (Sup Fig. 2).
Fig. 1
Workflow for the identification and quantification of peptides in wild type and SETD2-knock out human kidney cell lines. Above is the workflow for i) lysine methylated (lysine methylome) and ii) all peptides (total proteome). WT = wild type; KO = knock out. X = any amino acid; K = lysine. ID = identification. PTM = post-translational modification.
Four biological replicates with SILAC-label swapping were performed for both the lysine-methylome and total proteome workflows, quantifying roughly 45 and 5000 proteins in each replicate, respectively (Table 1). Peptides with a single methylated lysine whose WT/KO ratio was > 1 (signifying decreased methylation in KO) in all measured replicates and whose average was > 1.25 are shown (Table 2, see Sup Table 1 for complete list of identified peptides). Many peptides were identified. For example, EZH2 was shown to have decreased methylation in SETD2-KO cells at lysines known to be methylated by SETD2 (i.e., lysine 735) as well as other lysines corresponding to canonical SETD2 motifs (e.g., lysine 509 and 510) (Sup Table 1). However, in the current study, we focused on eEF1A1 given multiple lysines were identified in this screen, some in all four replicates, suggesting a robust and reproducible methylation phenotype.
Table 1
Total and lysine methylated peptides identified in wild type and SETD2-mutated human kidney cell lines. WT = wild type. KO = knock out. H = heavy. L = light. A-D refer to biological replicates. meK = lysine methylation. me1K=lysine monomethylation. me2K=lysine dimethylation. me3K=lysine trimethylation. IP = immunoprecipitation.
| Replicate | A | B | C | D |
| WT | H | L | L | H |
| KO | L | H | H | L |
| Total Protein | ||||
| Total Proteins Quantified | 4863 | 5190 | 5002 | 5283 |
| Total Peptides Quantified | 27069 | 31773 | 29817 | 29800 |
| meK IP | ||||
| meK Peptides Quantified | ||||
| me1k | 37 | 33 | 29 | 39 |
| me2k | 14 | 14 | 11 | 9 |
| me3k | 12 | 10 | 11 | 10 |
| meK Proteins Quantified | ||||
| me1k | 29 | 27 | 24 | 31 |
| me2k | 8 | 10 | 8 | 6 |
| me3k | 9 | 7 | 8 | 8 |
Table 2
Peptides demonstrating decreased lysine methylation in SETD2-KO human kidney cell lines. “Position” corresponds to location of methylated lysine residue within the full-length protein. “MeK” indicates whether the lysine residue was mono-, di-, or tri-methylated. “Methyl K Probabilities” indicates the relative probability that the indicated lysine residue was modified. A-D indicates the four biological mass spectrometry replicates and the ratio of the wild type (WT) and SETD2-knock out (KO) ratios (i.e., WT/KO ratio). If the lysine predicted to be modified corresponds to a canonical SETD2 methylation motif (i.e., KxP or KxxG), it was indicated with “x”. Only peptides with a single methylated lysine whose WT/KO ratio were > 1 in all replicates and whose average was > 1.25 are listed. See Sup Table 1 for the complete results
| Protein | UniProt ID | Position | MeK | Methyl (K) Probabilities | A | B | C | D | K Motif | KxP | KxxG |
| AHNK_HUMAN | Q09666 | 1208 | 1 | ISMPDVDLHLK(0.403)GPK(0.597) | 2.15 | KVKG | X | ||||
| AHNK_HUMAN | Q09666 | 2194 | 1 | ISMPDVNLNLK(0.854)GPK(0.146) | 2.16 | KGPK | X | ||||
| ANXA2_HUMAN | P07355 | 104 | 1 | SALSGHLETVILGLLK(1) | 1.58 | 1.83 | 1.17 | 1.35 | KTPA | X | |
| BCAR3_HUMAN | O75815 | 334 | 1 | ALSLK(1)AHQSESYLPIGCK | 1.91 | KAHQ | |||||
| EF1A1_HUMAN | P68104 | 55 | 1 | GSFK(1)YAWVLDK | 1.13 | 1.67 | 1.10 | KYAW | |||
| EF1A1_HUMAN | P68104 | 79 | 1 | GITIDISLWK(0.986)FETSK(0.014) | 1.47 | KFET | |||||
| EF1A1_HUMAN | P68104 | 79 | 2 | GITIDISLWK(1)FETSK | 1.47 | KFET | |||||
| EF1A1_HUMAN | P68104 | 84 | 1 | GITIDISLWK(0.5)FETSK(0.5)YYVTIIDAPGHR | 1.47 | KYYV | |||||
| EF1A1_HUMAN | P68104 | 84 | 2 | GITIDISLWK(0.5)FETSK(0.5)YYVTIIDAPGHR | 1.47 | KYYV | |||||
| EF1A1_HUMAN | P68104 | 165 | 3 | MDSTEPPYSQK(1)R | 1.23 | 1.50 | 2.20 | 1.42 | KRYE | ||
| EF1A1_HUMAN | P68104 | 318 | 1 | NVSVK(1)DVR | 1.26 | 3.87 | 1.96 | 1.09 | KDVR | ||
| EF1A1_HUMAN | P68104 | 318 | 2 | NVSVK(1)DVR | 1.30 | 2.83 | 1.69 | 1.04 | KDVR | ||
| GCN1_HUMAN | Q92616 | 1663 | 1 | DLAPYLPSVTPGLK(1)ASLLDPVPEVR | 1.30 | 1.87 | 1.65 | KASL | |||
| GRP78_HUMAN | P11021 | 585 | 3 | LGGK(1)LSSEDKETMEK | 1.48 | 1.40 | 1.43 | 1.05 | KLSS | ||
| H7BZC6_HUMAN | H7BZC6 | 58 | 1 | LK(1)GAILTTMLATR | 1.64 | KGAI | |||||
| HS90A_HUMAN | P07900 | 615 | 1 | IMK(1)AQALR | 1.24 | 1.50 | 1.57 | 1.45 | KAQA | ||
| HS90B_HUMAN | P08238 | 607 | 1 | IMK(1)AQALR | 1.24 | 1.50 | 1.57 | 1.45 | KAQA | ||
| K7EK07_HUMAN | K7EK07 | 37 | 2 | SAPSTGGVK(0.977)K(0.023)PHR | 1.23 | 1.55 | KKPH | X | |||
| K7EK07_HUMAN | K7EK07 | 38 | 2 | SAPSTGGVK(0.5)K(0.5)PHR | 1.55 | KKPH;KPHR | X | ||||
| RTF1_HUMAN | Q92541 | 587 | 1 | ALVAESHNMK(1)NQQMDPFTR | 1.14 | 1.67 | 1.54 | KNQQ |
As an additional analysis of eEF1A1 lysine methylation, we evaluated the extracted ion chromatograms from the mass spectrometry data. This evaluation also demonstrates that both K165 and K318 have decreased methylation in the SETD2-KO lysates (Fig. 2a–d). Next, we sought to validate the pattern of K165 methylation in WT and SETD2-KO lysates via an antibody-independent method to exclude any potential bias introduced by the lysine methylated peptide immunoprecipitation process. Thus, we performed size enrichment by running SILAC-labeled protein lysates from SETD2-WT and -KO cells on a NuPAGE 10% Bis-Tris gel and performing gel extraction at eEF1A1’s predicted migration distance (i.e., 50 kDa). Extracted peptides were then identified and quantitated by LC-MS/MS. This was performed for two of the four replicates (replicates “C” and “D” as labeled in Table 1). The K165 lysine methylated peptide abundance was compared in the SILAC-labeled protein lysates, again demonstrating decreased eEF1A1 K165me3 peptide in SETD2-KO cells (Fig. 2e). Next, data for all K165 methylation states was pooled across these six SILAC-labeled replicates (Fig. 2f; this analysis was expanded to include all detected lysine methylated peptides for the six replicates in Sup Fig. 3). While the ratios are very near 1 for K165me0-2, in all replicates less K165me3 was observed in the SETD2-KO sample relative to the WT sample. The EICs are shown for all methylation states of the K165-containing peptide from the C replicate (Sup Fig. 4). To validate decreased eEF1A1 methylation in SETD2-KO cells, we spiked gel extractions from non-SILAC labeled lysate with a synthetic heavy peptide containing K165 trimethylation. Using relative quantification, we again observe decreased K165 lysine methylated peptide with loss of SETD2 in HKC lysate (Fig. 2 g). Finally, to rule out clonal effects, isogenic WT and SETD2-KO lysate from the human ccRCC cell line 786-O was tested using the previous workflow, similarly showing decreased K165me3 in SETD2-KO (Fig. 2 g). Thus, in multiple cell lines and/or through multiple methods, we observe decreased eEF1A1 K165 trimethylation and K318 monomethylation in SETD2-KO cells.
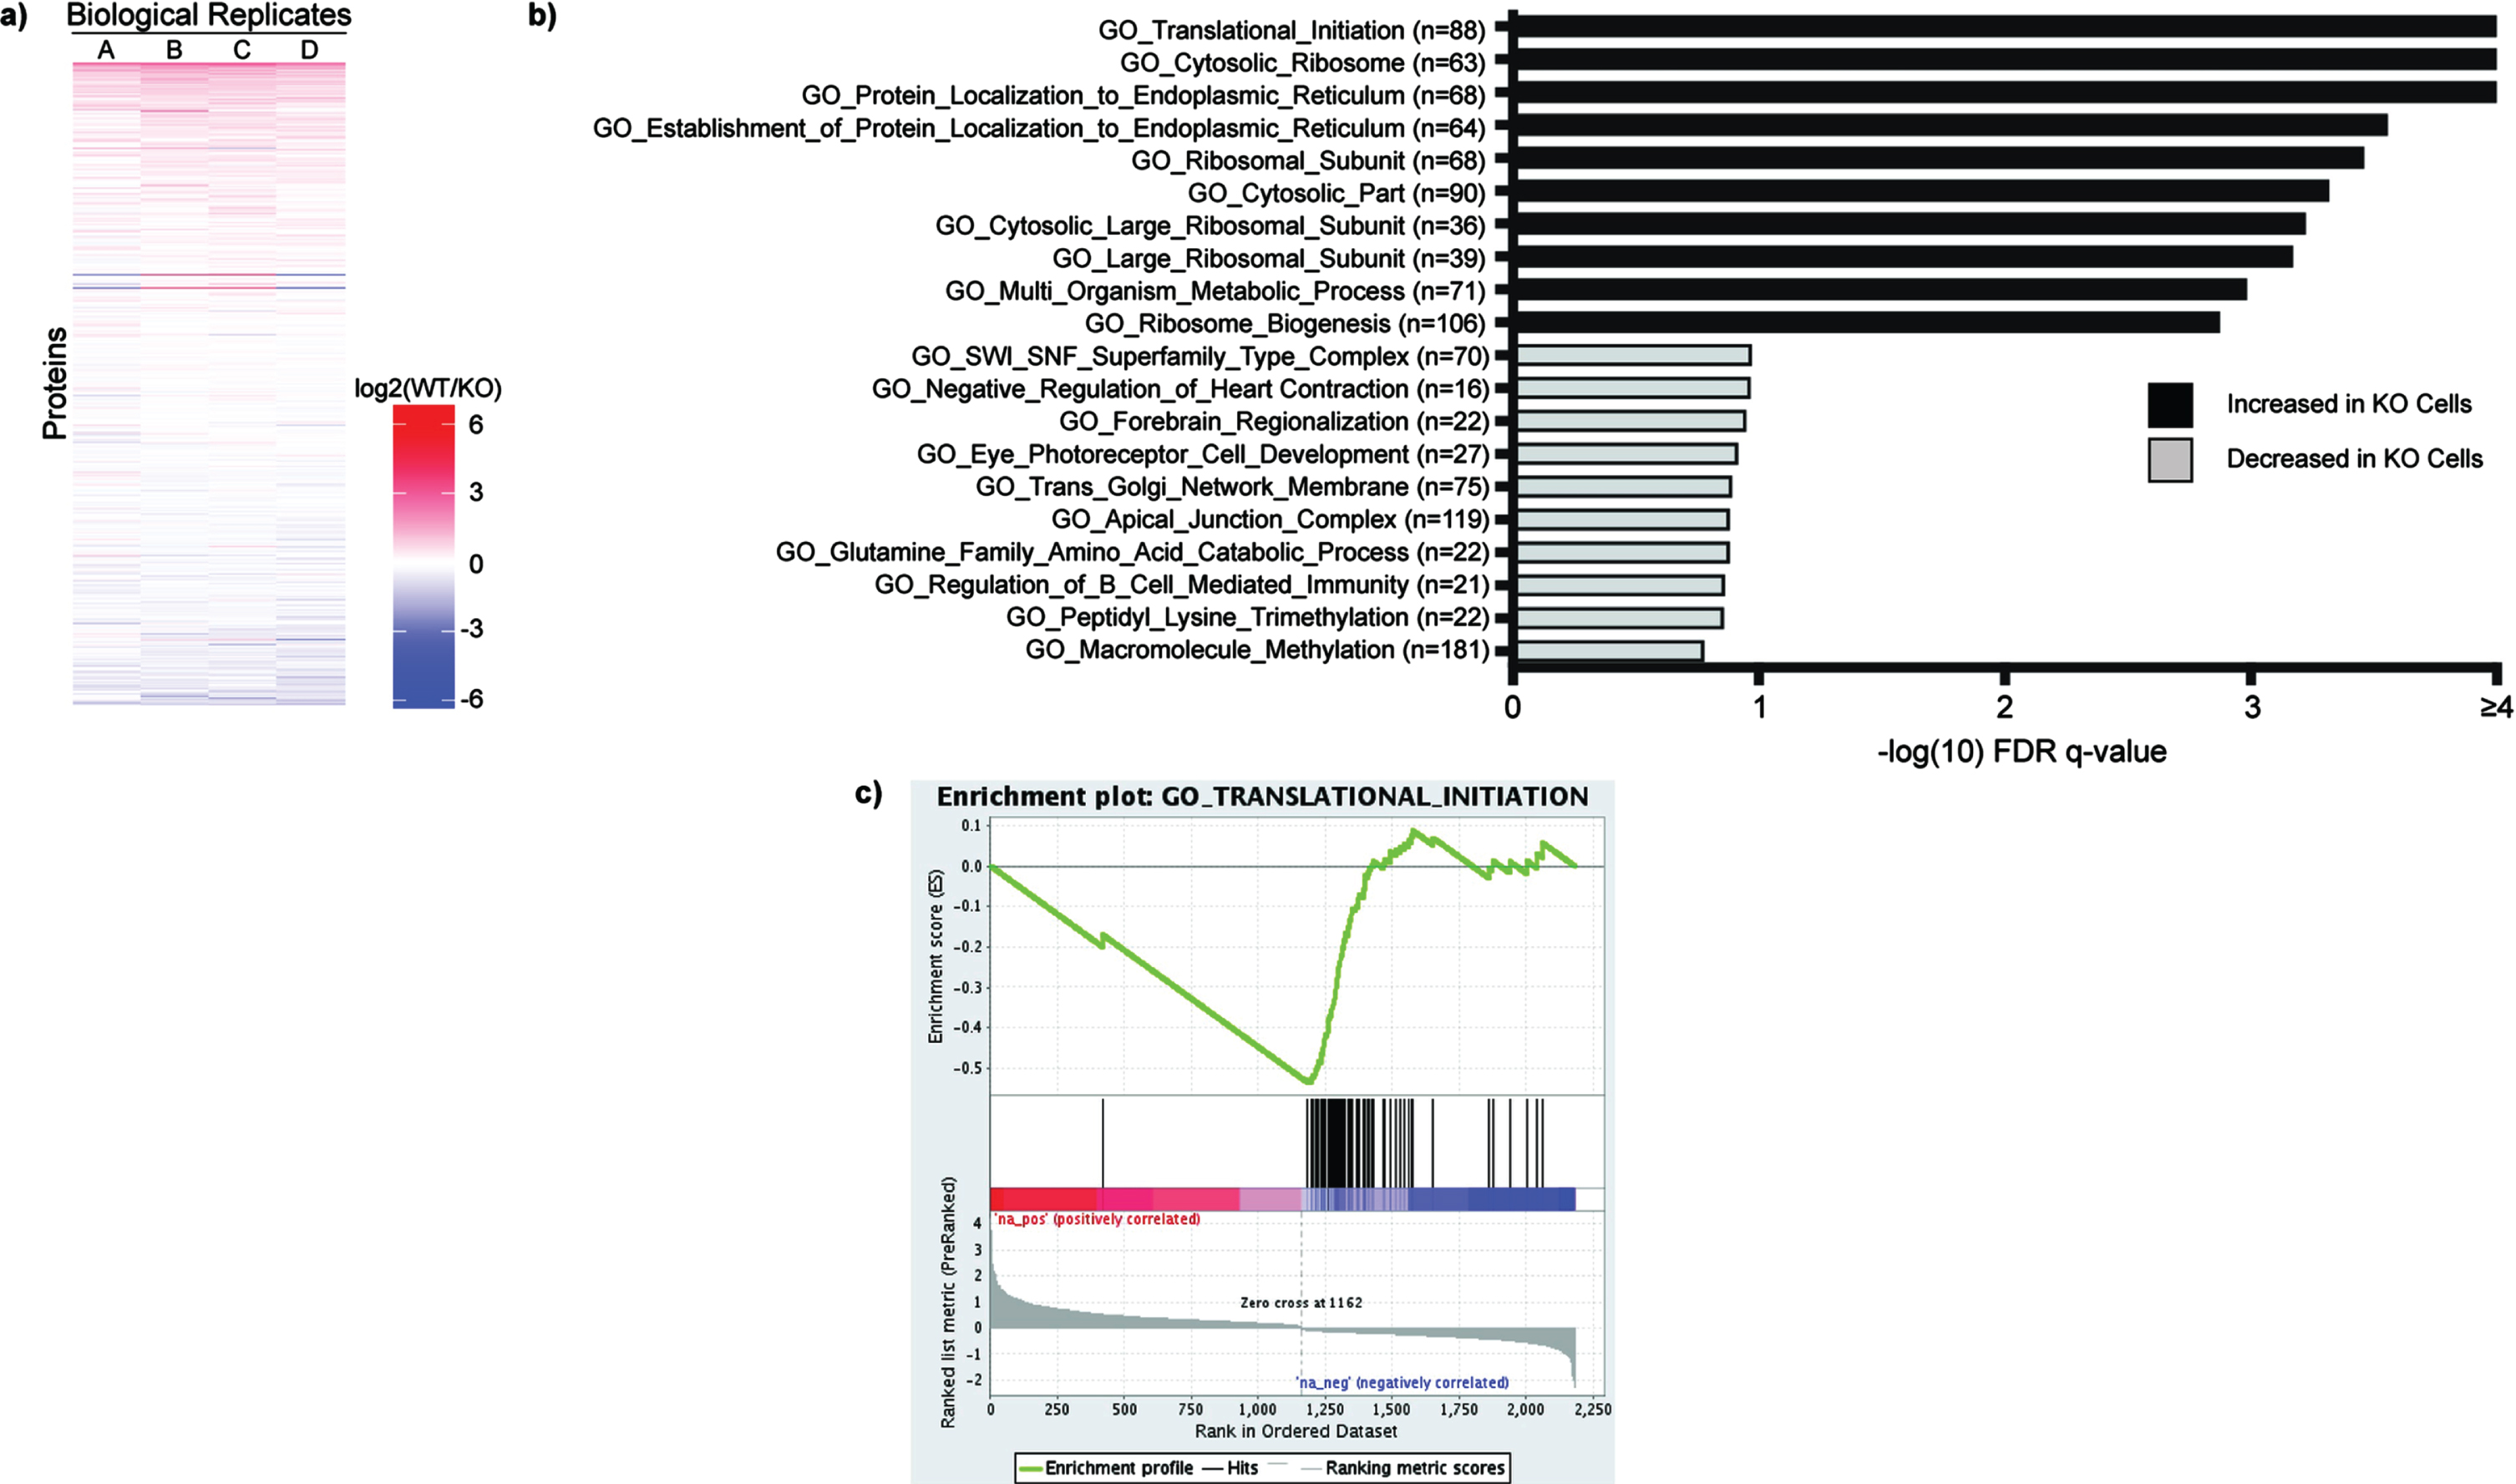
Fig. 4
Total Proteome Analysis Demonstrates Changes in Protein Translation in SETD2-KO Cells. a) Individual proteins are up- and down-regulated in WT versus SETD2-KO HKC cell lines. WT/KO protein ratios are ranked and evaluated for Gene Set Enrichment Analysis (GSEA) using the Gene Ontology datasets. Gene sets with an FDR q-value < 0.25 were considered to be significant (-log10 = 0.60). b) Displayed are the ten most significant gene sets that are increased and decreased in SETD2-KO cells relative to wild type cells. c) The Gene Ontology signature with the lowest FDR q-value is GO_Translational_Initiation, which demonstrates increased levels of several proteins involved in protein translation in the SETD2-KO cell lines.
Decreased eEF1A1 methyltransferase expression in SETD2-KO
While we have robust data that trimethylation of K165 and monomethylation of K318 on eEF1A1 decreases in SETD2-KO cells, neither lysine matches a known consensus sequence for SETD2-mediated lysine-methylation (i.e., KxP or KxxG) [10, 20, 21]. Furthermore, lysine methyltransferases responsible for these PTMs have previously been identified: EEF1AKMT3 methylates K165 and EEF1AKMT2 methylates K318 [39–41]. Therefore, we sought to evaluate whether the expression of these enzymes was dependent on SETD2 protein and, if so, gain insight into the mechanism of this regulation. To perform this analysis, we utilized WT and SETD2-KO HKC cells as well as SETD2-KO HKC cells with various SETD2 constructs and mutations (Fig. 3a). These cell lines were designed by Hacker et al. and include a truncated but functional SETD2 gene (WT-Tr), a SET-domain mutant (SET-mt), and an SRI-domain mutant (SRI-mt) [24]. To briefly summarize, SETD2-KO HKC cell lines were generated using TAL effector nucleases (TALENs) targeting exon 3 of SETD2. Individual clones of TALEN-treated cells were isolated and deletion confirmed by demonstrating loss of H3K36me3 on immunocytochemistry and verifying inactivation of both alleles of SETD2 via Sanger sequencing. We validated SETD2 status in HKC cell lines by western blot (Sup Fig. 1). Subsequently, a truncated wild-type FLAG-tagged form of SETD2 (amino acids 1323–2564; WT-Tr), which includes all known functional domains, was exogenously expressed in the SETD2-KO cells (full length SETD2 is very large thus making it difficult to express full length SETD2) [24]. The SET-mt (R1625 C) and an SRI-mt (R2510 H) were generated from truncated SETD2. Using RT-qPCR (see Materials and Methods for details), we observe that loss of SETD2 expression was associated with decreased expression of EEF1AKMT2 (Fig. 3b) and EEF1AKMT3 (Fig. 3c). Interestingly, the WT-Tr and SRI-mt constructs recover EEF1AKMT2/3 expression to wildtype levels, whereas the SET-mt does not in HKC cells (Fig. 3a-b). SETD2-dependent expression of EEF1AKMT2/3 was validated in the human ccRCC 786-O cells as well as HEK-293T cells (human embryonic kidney cells) (using similar methods as described above for generated SETD2-KO cells). These data suggest that SET domain function of SETD2 is necessary for the expression of EEF1AKTM2/3 in human kidney and kidney cancer cells.
System-wide changes to translation with loss of SETD2
Returning to the total proteome data, we observed marked system-wide changes in protein expression for wild type versus SETD2-KO HKC cells (Fig. 4a, Sup Table 2). WT/KO protein ratios were ranked and evaluated for Gene Set Enrichment Analysis (GSEA) using the Gene Ontology (GO) datasets. The most significant pathways to be increased in the SETD2-KO cell lines included GO_Translational_Initiation along with several other pathways pertaining to translation and/or ribosome function (Fig. 4b). Thus, along with decreased methylation of the translation elongation factor eEF1A1, our data suggests that loss of SETD2 results in increased levels of proteins associated with protein translation. Gene sets that are significantly decreased in the SETD2-KO cells include metabolic pathways, such as GO_NADH_Dehydrogenase_Complex (Fig. 4b). Shown is the enrichment plot for the most significantly increased pathway, GO_Translational_Initiation (Fig. 4c).
TCGA ccRCC cohorts have similarly dysregulated protein translation networks
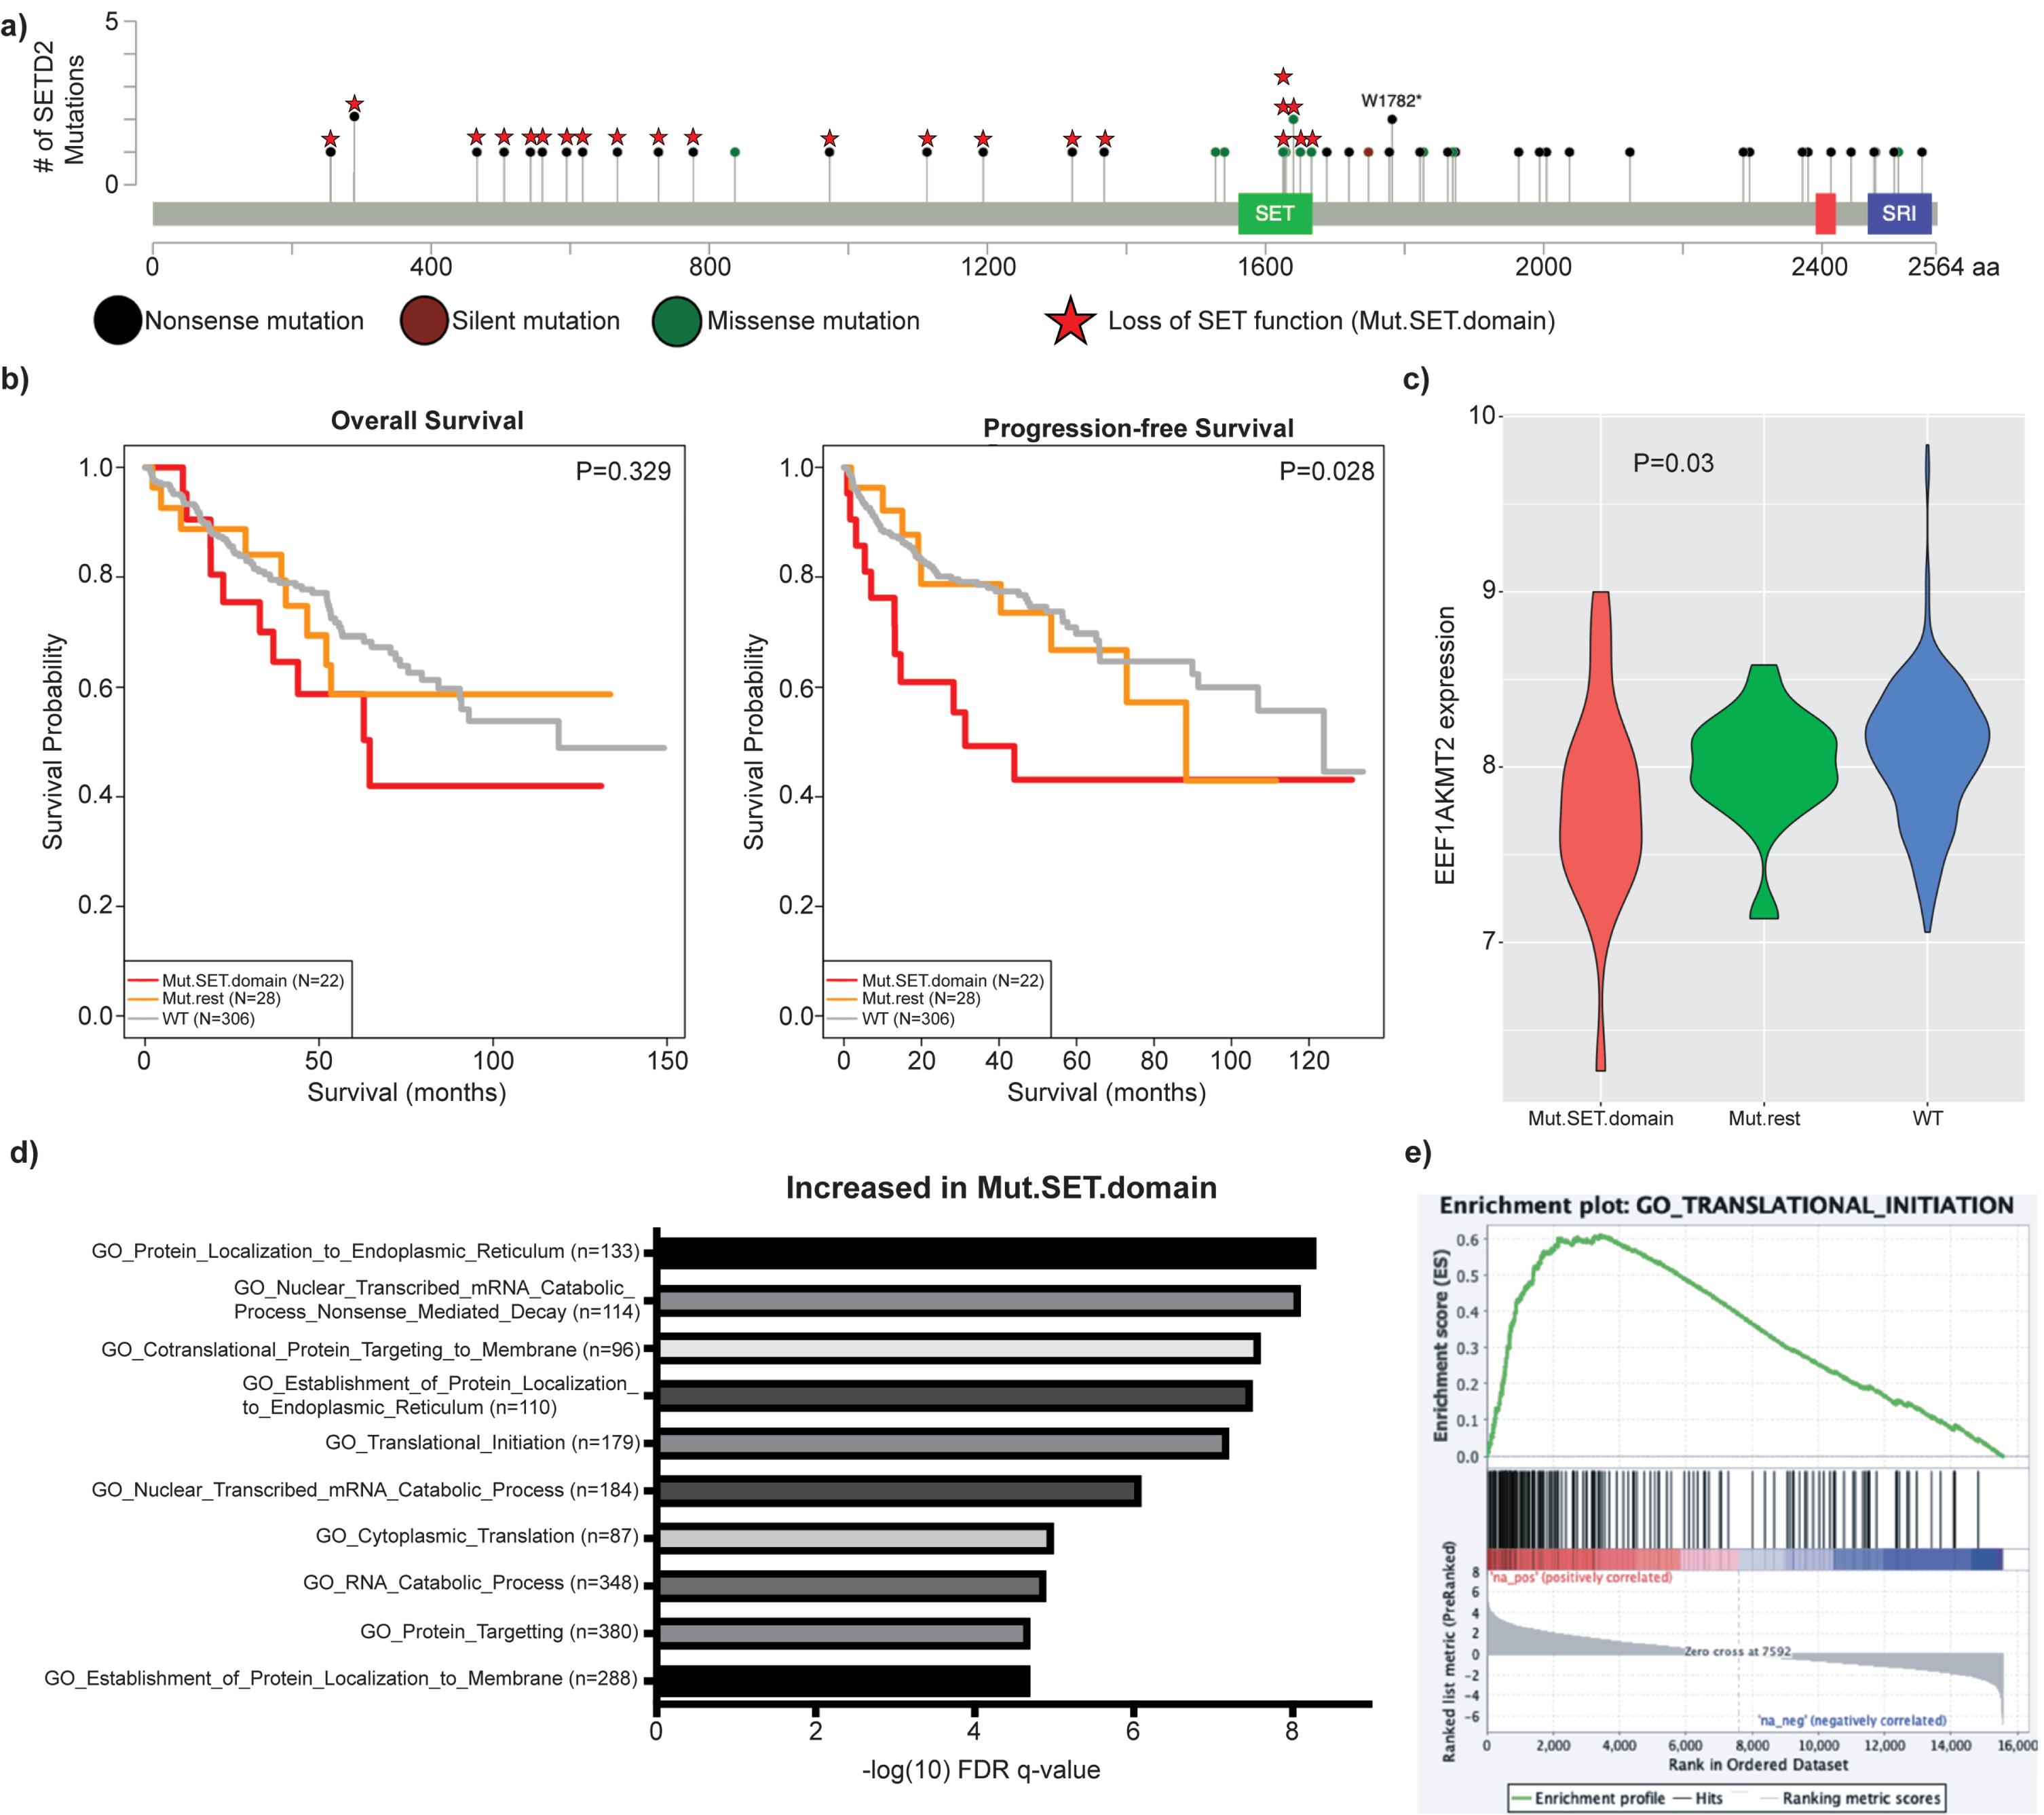
To determine if protein translation was likewise altered in SETD2-mutated tumors from patients, we analyzed data from the ccRCC cohort of the Cancer Genome Atlas (TCGA). As our earlier data demonstrated that the SET domain of SETD2 is responsible for modulating expression of EEF1AKMT2/3, the SETD2-mutant group was defined as patients with a SETD2 mutation predicted to abolish methyltransferase activity, either through a truncating mutation prior to the SET domain or a mutation within the domain (termed Mut.SET.domain) (Fig. 5a). The comparison groups were patients with wildtype SETD2 or the remaining SETD2 mutants not previously included. Mut.SET.domain patients demonstrated shorter progression free survival (PFS) and a trend towards decreased overall survival (OS) (Fig. 5b) as well as decreased expression of EEF1AKMT2 (p = 0.03) (Fig. 5c). Low expression of EEF1AKMT2 is associated with poor survival in these patients (Sup Fig. 5) [42]. Evaluation of the TCGA gene expression data demonstrates increased expression of genes associated with protein translation in the Mut.SET.domain tumors (Fig. 5d-e), just as the SETD2-KO cell lines demonstrated increased levels of proteins (Fig. 4b-c) and genes (Sup Fig. 6 and Sup Table 3) associated with protein translation. Overall, data from both human cell lines and human tumors suggest that loss of methyltransferase activity of SETD2 is associated with increased expression of genes and proteins associated with protein translation.
Fig. 5
SET domain deficient ccRCC patient tumors demonstrate decreased EEF1AKMT2 expression and upregulated translation gene sets. a) Mutated SET domain (Mut.SET.domain) was defined as patients with either mutated SET domain or truncating mutations prior to the domain (N = 24). The remainder of patients with SETD2 mutations were classified as Mut.rest (N = 28). Patients with wildtype SETD2 gene were labeled WT. b) Mut.SET.domain had significantly worse PFS than WT SETD2 patients, with a trend towards worse OS (2 patients in Mut.SET.domain were excluded due to missing survival data). c) EEF1AKMT2 expression is decreased in tumors with SETD2 SET domain mutations (p = 0.03). d) Displayed are the most significantly upregulated Gene Ontology signatures in Mut.SET.domain ccRCC. e) Similar to SETD2-KO cell line data, protein translation signatures are upregulated in SET domain deficient ccRCC, including GO_Translational_Initiation.
DISCUSSION
We utilized the immunoprecipitation and purification of lysine methylated peptides coupled with SILAC-based mass spectrometry as a method to explore how loss of SETD2 in human kidney cells perturbs the tumor proteome. We coupled this quantitative, PTM-focused approach with systems-wide analyses of gene and total protein expression to integrate changes in the methylproteome with global cellular function. Finally, we translated our discoveries by incorporating data from human ccRCC tumors into our final analysis. The resultant data implicates a previously undescribed role of SETD2 in the regulation of protein translation.
We show that the loss of SETD2 results in decreased trimethylation of eEF1A1 at K165 and monomethylation of K318 in multiple cell types, including a ccRCC-derived line. While SETD2 is unlikely to directly methylate eEF1A1 as it lacks the SETD2 methylation consensus sequence, our data suggest an indirect mechanism whereby SETD2 influences eEF1A1 methylation. We propose this decrease occurs through the decreased transcription of EEF1AKMT3 and EEF1AKMT2.
Interestingly, our data suggest that loss of SETD2 methyltransferase function leads to loss of K165 trimethylation whereas the other methylation states are relatively stable (Fig. 2f). These data suggest one of at least two possible scenarios. It is possible that EEF1AKMT3 selectively trimethylates K165 but other methyltransferases are capable of performing the mono- and dimethylation. Alternatively, EEF1AKMT3 may be more efficient at mono- and dimethylation of EEF1A1 relative to trimethylation. Thus, in SETD2-KO cells with reduced expression of EEF1AKMT3, there is sufficient enzyme to perform mono- and dimethylation but not trimethylation. Further work will be necessary to distinguish between these scenarios.
Recent research has identified the methyltransferases and methylation sites for human eEF1A1. Currently, there are six known methylated lysines on human eEF1A1: the N-terminus, K36, K55, K79, K165, and K318 [19]. The N-terminus and K55 are methylated by a single methyltransferase, METTL13, while others are methylated by EEF1AKMT1-4 [19, 43]. The only methyltransferase from this group whose expression correlates with ccRCC patient survival is the K318 methyltransferase EEF1AKMT2 (Sup. Fig. 5). Patients with decreased expression of EEF1AKMT2 exhibit decreased survival, suggesting it may be contributing to the poor outcomes observed in SETD2-mutant tumors predicted to have loss of SET-domain function (Fig. 5). Though one of the most methylated eukaryotic proteins, the consequences of eEF1A1 methylation are still poorly understood [19]. Studies have shown a range of possible effects to translation, including altering general translation rate, the specific transcripts translated, and even codon-specific rates [17, 40, 44]. Of the two eEF1A1 methylation states that we investigated, K165 methylation is best described. Loss of this methylation results in global reprogramming of peptide synthesis (i.e., translatome), with upregulation in translation of some mRNA molecules and down-regulation of others. Interestingly, pathway analysis of EEF1AKMT3-null cells reveals increased translation of mRNA molecules associated with protein translation, similar to what we observed in SETD2 SET domain-deficient cells [40], as well as increased expression of ribosomal proteins [39]. This provides further evidence that SETD2 may regulate protein translation through the indirect modulation of eEF1A1 methylation.
While we have not functionally investigated the consequences of eEF1A1 methylation in kidney cancer, pathway enrichment analysis reveals the upregulation of translation-associated proteins and genes with the loss of SETD2 in these cell lines. Interestingly, we similarly see an increase in expression of protein translation-associated transcripts with the loss of SETD2 catalytic activity in the TCGA ccRCC cohort, along with a decrease in EEF1AKMT2 expression. SETD2-mutated tumors represent an aggressive cohort of ccRCC tumors, and we show for the first time that those with predicted loss of function of the SET domain have inferior progression free survival. This correlation between increased protein translation in tumors with SETD2 mutations predicted to cause loss of SET domain function nominates dysregulation of protein translation as a factor contributing to tumor progression in SETD2-mutated tumors, possibly through a mechanism that includes altered methylation of eEF1A. Given the significant clinical relevance of SETD2 mutations in human malignancies, this correlation warrants further future investigation.
How eEF1A1 methylation impacts the tumor phenotype is complicated and may depend on both the individual lysine as well as the tumor context. For example, while our data suggests decreased expression of EEF1AKMT2/3 and subsequent decreased methylation at K165 and K318 in tumors lacking SETD2 enzymatic function, eEF1A1 methylation has been shown to serve as a tumor permissive PTM –albeit at a different site. Liu et al. found that Kras-driven cancers were reliant on the methylation of eEF1A1 by METTL13 at K55 [17]. Loss of this methyltransferase led to decreased proliferation and viability of these malignancies due to decreased peptide synthesis. This dependence appears to be malignancy specific, as METTL13 in bladder cancer opposingly may act as a tumor suppressor [45].
The methodology applied readily accounts for the inability to consistently measure the loss of lysine methylation of canonical SETD2 targets, such as histone H3 lysine 36 and alpha tubulin lysine 40. Lysine methylation leading to poor trypsin efficiency as well as the distribution of trypsin cleavage sites can produce peptide fragments that are suboptimal for LC-MS/MS identification and quantification. These features of the assay must also be taken into account in considering other methylation targets which may have been overlooked in this analysis.
Given that eEF1A1 has noncanonical roles outside of the translatome, such as emerging roles in apoptosis and cytoskeletal regulation, decreased eEF1A1 methylation in the context of SETD2 loss could have other unrelated tumor modulating properties [46]. In fact, the loss of EEF1AKMT2, though remaining to be described in humans, affects viral replication in plants [47]. Post translational modification of eEF1A1 is a highly dynamic process that is only beginning to be uncovered [40]. Much like the histone code that affects gene transcription, protein translation may be regulated by a “translation code” composed of PTM “readers”, “writers” and “erasers” that remain to be discovered. Given the dynamics of malignancy and protein translation, combined with emerging data on the role of eEF1A methylation in cancer, this translation code warrants further research.
ACKNOWLEDGMENTS
We acknowledge the patients and their families for contributing specimens and inspiring us every day. We would also like to thank the countless colleagues and lab members for their feedback, advice, and proofing.
FUNDING
This work was funded by an American Urological Associated Research Scholar Award (SMH), the Vanderbilt Institute for Clinical and Translational Research (UL1TR002243) (SMH), K08-CA241351 (SMH), and K12-CA090625 (SMH, WKR).
AUTHOR CONTRIBUTIONS
RH: performance, interpretation of data, writing; LV: performance; KLR: performance, interpretation of data; QS: interpretation of data; AR: interpretation of data; RP: performance; AJ: performance; WKR: conception, interpretation of data; SMH: conception, performance, interpretation of data, writing
CONFLICT OF INTEREST
Robert Hapke has no conflict of interest to report. Lindsay Venton has no conflict of interest to report. Kristie Lindsay Rose has no conflict of interest to report. Quanhu Sheng has no conflict of interest to report. Anupama Reddy has no conflict of interest to report. Angela Jones has no conflict of interest to report. W. Kimryn Rathmell is an Editorial Board Member of this journal, but was not involved in the peer-review process of this paper, nor had access to any information regarding its peer-review. Scott M. Haake has no conflict of interest to report.
SUPPLEMENTARY MATERIAL
[1] The supplementary material is available in the electronic version of this article: https://dx.doi.org/10.3233/KCA-220009.
REFERENCES
[1] | ACS. Cancer Facts&Figures 2021. Atlanta: American Cancer Society; 2022. |
[2] | Haake SM , Rathmell WK . Renal cancer subtypes: Should we be lumping or splitting for therapeutic decision making?. Cancer (2017) ;123: (2):200–9. |
[3] | Mitchell TJ , Turajlic S , Rowan A , Nicol D , Farmery JHR , O’Brien T , et al. Timing the Landmark Events in the Evolution of Clear Cell Renal Cell Cancer: TRACERx Renal, Cell (2018) ;173: (3):611–23.e17. |
[4] | Nickerson ML , Jaeger E , Shi Y , Durocher JA , Mahurkar S , Zaridze D , et al. Improved identification of von Hippel-Lindau gene alterations in clear cell renal tumors, Clin Cancer Res (2008) ;14: (15):4726–34. |
[5] | Mack FA , Rathmell WK , Arsham AM , Gnarra J , Keith B , Simon MC . Loss of pVHL is sufficient to cause HIF dysregulation in primary cells but does not promote tumor growth, Cancer Cell (2003) ;3: (1):75–88. |
[6] | Cancer Genome Atlas Research N. Comprehensive molecular characterization of clear cell renal cell carcinoma, Nature (2013) ;499: (7456):43–9. |
[7] | Ho TH , Park IY , Zhao H , Tong P , Champion MD , Yan H , et al. High-resolution profiling of histone h3 lysine 36 trimethylation in metastatic renal cell carcinoma, Oncogene (2016) ;35: (12):1565–74. |
[8] | Strahl BD , Allis CD . The language of covalent histone modifications, Nature (2000) ;403: (6765):41–5. |
[9] | Jenuwein T , Allis CD . Translating the histone code, Science (2001) ;293: (5532):1074–80. |
[10] | Edmunds JW , Mahadevan LC , Clayton AL . Dynamic histone H3 methylation during gene induction: HYPB/Setd2 mediates all H3K36 trimethylation, The EMBO Journal (2008) ;27: (2):406–20. |
[11] | Li J , Duns G , Westers H , Sijmons R , van den Berg A , Kok K . SETD an epigenetic modifier with tumor suppressor functionality, Oncotarget (2016) ;7: (31):50719–34. |
[12] | Simon JM , Hacker KE , Singh D , Brannon AR , Parker JS , Weiser M , et al. Variation in chromatin accessibility in human kidney cancer links H3K36 methyltransferase loss with widespread RNA processing defects, Genome Research (2014) ;24: (2):241–50. |
[13] | Neri F , Rapelli S , Krepelova A , Incarnato D , Parlato C , Basile G , et al. Intragenic DNA methylation prevents spurious transcription initiation, Nature (2017) ;543: (7643):72–7. |
[14] | Carvalho S , Vítor AC , Sridhara SC , Martins FB , Raposo AC , Desterro JM , et al. SETD2 is required for DNA double-strand break repair and activation of the p53-mediated checkpoint, Elife (2014) ;3: , e02482. |
[15] | Chiang YC , Park IY , Terzo EA , Tripathi DN , Mason FM , Fahey CC , et al. SETD2 Haploinsufficiency for Microtubule Methylation Is an Early Driver of Genomic Instability in Renal Cell Carcinoma, Cancer Res (2018) ;78: (12):3135–46. |
[16] | Biggar KK , Li SS . Non-histone protein methylation as a regulator of cellular signalling and function, Nature Reviews Molecular Cell Biology (2015) ;16: (1):5–17. |
[17] | Liu S , Hausmann S , Carlson SM , Fuentes ME , Francis JW , Pillai R , et al. METTL13 Methylation of eEF1A Increases Translational Output to Promote Tumorigenesis, Cell (2019) ;176: (3):491–504.e21. |
[18] | Polevoda B , Sherman F . Methylation of proteins involved in translation, Mol Microbiol (2007) ;65: (3):590–606. |
[19] | Hamey JJ , Wilkins MR . Methylation of Elongation Factor 1A: Where, Who, and Why? Trends in Biochemical Sciences (2018) ;43: (3):211–23. |
[20] | Park IY , Powell RT , Tripathi DN , Dere R , Ho TH , Blasius TL , et al. Dual Chromatin and Cytoskeletal Remodeling by SETD2, Cell (2016) ;166: (4):950–62. |
[21] | Chen K , Liu J , Liu S , Xia M , Zhang X , Han D , et al. Methyltransferase SETD2-Mediated Methylation of STAT1 Is Critical for Interferon Antiviral Activity, Cell (2017) ;170: (3):492–506.e14. |
[22] | Yuan H , Han Y , Wang X , Li N , Liu Q , Yin Y , et al. SETD2 Restricts Prostate Cancer Metastasis by Integrating EZH2 and AMPK Signaling Pathways, Cancer Cell (2020) ;38: (3):350–65.e7. |
[23] | Racusen LC , Monteil C , Sgrignoli A , Lucskay M , Marouillat S , Rhim JG , et al. Cell lines with extended in vitro growth potential from human renal proximal tubule: characterization, response to inducers, and comparison with established cell lines, J Lab Clin Med (1997) ;129: (3):318–29. |
[24] | Hacker KE , Fahey CC , Shinsky SA , Chiang YJ , DiFiore JV , Jha DK , et al. Structure/Function Analysis of Recurrent Mutations in SETD2 Protein Reveals a Critical and Conserved Role for a SET Domain Residue in Maintaining Protein Stability and Histone H3 Lys-36 Trimethylation, The Journal of Biological Chemistry (2016) ;291: (40):21283–95. |
[25] | Ong SE , Mann M . A practical recipe for stable isotope labeling by amino acids in cell culture (SILAC), Nature Protocols (2006) ;1: (6):2650–60. |
[26] | Ong SE , Blagoev B , Kratchmarova I , Kristensen DB , Steen H , Pandey A , et al. Stable isotope labeling by amino acids in cell culture, SILAC, as a simple and accurate approach to expression proteomics, Molecular & Cellular Proteomics: MCP (2002) ;1: (5):376–86. |
[27] | Cox J , Mann M . MaxQuant enables high peptide identification rates, individualized b, -range mass accuracies and proteome-wide protein quantification. Nat Biotechnol (2008) ;26: (12):1367–72. |
[28] | Vukoti K , Yu X , Sheng Q , Saha S , Feng Z , Hsu AL , et al. Monitoring newly synthesized proteins over the adult life span of Caenorhabditis elegans, Journal of Proteome Research (2015) ;14: (3):1483–94. |
[29] | Subramanian A , Tamayo P , Mootha VK , Mukherjee S , Ebert BL , Gillette MA , et al. Gene set enrichment analysis: a knowledge-based approach for interpreting genome-wide expression profiles, Proc Natl Acad Sci U S A (2005) ;102: (43):15545–50. |
[30] | Wu X , Hasan MA , Chen JY . Pathway and network analysis in proteomics, J Theor Biol (2014) ;362: :44–52. |
[31] | Lavall M , Rauniyar N , McClatchy DB , Yates JR , PSEA-Quant: A Protein Set Enrichment Analysis on Label-Free and Label-Based Protein Quantification Data, Journal of Proteome Research (2014) ;13: (12):5496–509. |
[32] | Dobin A , Davis CA , Schlesinger F , Drenkow J , Zaleski C , Jha S , et al. STAR: ultrafast universal RNA-seq aligner, Bioinformatics (Oxford, England) (2013) ;29: (1):15–21. |
[33] | Liao Y , Smyth GK , Shi W . featureCounts: an efficient general purpose program for assigning sequence reads to genomic features, Bioinformatics (Oxford, England) (2014) ;30: (7):923–30. |
[34] | Love MI , Huber W , Anders S . Moderated estimation of fold change and dispersion for RNA-seq data with DESeq2, Genome Biology (2014) ;15: (12):550. |
[35] | Zhao S , Guo Y , Sheng Q , Shyr Y . Advanced heat map and clustering analysis using heatmap3, BioMed Research International (2014) ;2014: :986048. |
[36] | Wang J , Vasaikar S , Shi Z , Greer M , Zhang B . WebGestalt a more comprehensive, powerful, flexible and interactive gene set enrichment analysis toolkit, Nucleic Acids Research (2017) ;45: (W1):W130–w7. |
[37] | MacLean B , Tomazela DM , Shulman N , Chambers M , Finney GL , Frewen B , et al. Skyline: an open source document editor for creating and analyzing targeted proteomics experiments, Bioinformatics (Oxford, England) (2010) ;26: (7):966–8. |
[38] | Schmittgen TD , Livak KJ . Analyzing real-time PCR data by the comparative C(T) method, Nature Protocols (2008) ;3: (6):1101–8. |
[39] | Hamey JJ , Wienert B , Quinlan KGR , Wilkins MR . METTL21B Is a Novel Human Lysine Methyltransferase of Translation Elongation Factor 1A: Discovery by CRISPR/Cas9 Knockout, Molecular & Cellular Proteomics: MCP (2017) ;16: (12):2229–42. |
[40] | Malecki J , Aileni VK , Ho AYY , Schwarz J , Moen A , Sorensen V , et al. The novel lysine specific methyltransferase METTL21B affects mRNA translation through inducible and dynamic methylation of Lys-165 in human eukaryotic elongation factor 1 alpha (eEF1A), Nucleic Acids Research (2017) ;45: (8):4370–89. |
[41] | Shimazu T , Barjau J , Sohtome Y , Sodeoka M , Shinkai Y . Selenium-based S-adenosylmethionine analog reveals the mammalian seven-beta-strand methyltransferase METTL10 to be an EF1A1 lysine methyltransferase, PLoS One (2014) ;9: (8):e105394. |
[42] | Chandrashekar DS , Bashel B , Balasubramanya SAH , Creighton CJ , Ponce-Rodriguez I , Chakravarthi B , et al. UALCAN: A Portal for Facilitating Tumor Subgroup Gene Expression and Survival Analyses, Neoplasia (New York, NY) (2017) ;19: (8):649–58. |
[43] | Jakobsson ME , Małecki JM , Halabelian L , Nilges BS , Pinto R , Kudithipudi S , et al. The dual methyltransferase METTL13 targets N terminus and Lys55 of eEF1A and modulates codon-specific translation rates, Nature Communications (2018) ;9: (1):3411. |
[44] | Jakobsson ME , Malecki J , Nilges BS , Moen A , Leidel SA , Falnes P . Methylation of human eukaryotic elongation factor alpha (eEF1A) by a member of a novel protein lysine methyltransferase family modulates mRNA translation, Nucleic Acids Research (2017) ;45: (14):8239–54. |
[45] | Zhang Z , Zhang G , Kong C , Zhan B , Dong X , Man X . METTL13 is downregulated in bladder carcinoma and suppresses cell proliferation, migration and invasion, Scientific Reports (2016) ;6: :19261. |
[46] | Li D , Wei T , Abbott CM , Harrich D . The unexpected roles of eukaryotic translation elongation factors in RNA virus replication and pathogenesis, Microbiol Mol Biol Rev (2013) ;77: (2):253–66. |
[47] | Li Z , Gonzalez PA , Sasvari Z , Kinzy TG , Nagy PD . Methylation of translation elongation factor 1A by the METTL10-like See1 methyltransferase facilitates tombusvirus replication in yeast and plants, Virology (2014) ;448: :43–54. |
[48] | Doerr A . DIA mass spectrometry, Nature Methods (2015) ;12: (1):35. |


