
Immune Gene Signature Expression Differs between African American and Caucasian Patients with Renal Cell Carcinoma
Abstract
BACKGROUND:
Predictive immune signatures such as the T-effector, the 26-gene “Renal 101 Immuno signature” and the 18-gene T-cell inflamed gene expression profile were developed in clinical trials enrolling predominantly Caucasians and there is a dearth of literature comparing tumor biology between African American (AA) and Caucasian patients.
OBJECTIVE:
To compare the immune gene signature expression in AA (n = 55) and Caucasian (n = 457) patients.
METHODS:
Raw gene expression count data were downloaded from the TCGA KIRC dataset and tumor samples from “white” and “black or AA” patients were selected. The gene expression values of the immune signatures were VST-transformed normalized counts and compared between the groups.
RESULTS:
There were 457 Caucasian and 55 AA patients in the TCGA. The immune gene expression in all three signatures was significantly lower in AA patients compared to Caucasians (p < 0.05). We validated our findings in an independent dataset using Nanostring Immune Profile Panel. Since the majority of AA tumors in TCGA were stage I (71%), we compared gene expression between stage I AA tumors (n = 39) with stage I Caucasian tumors (n = 220). Once again, the immune gene expression was significantly lower in AA patients compared to Caucasians (p < 0.05), indicating differences in tumor biology between the races.
CONCLUSIONS:
Low expression of predictive immune gene signatures in AA compared to Caucasian patients indicates a possible difference in the biology of their tumors. Future studies are needed to validate our findings in other datasets and to study the predictive role of these signatures in AA patients.
INTRODUCTION
Immune checkpoint inhibitors (ICIs) are key therapeutic agents to treat metastatic renal cell carcinoma (RCC). However, their benefits are limited to a subset of patients [1–3]. Markers such as tumor mutation burden, copy number alterations and PD-L1 expression have not been predictive for ICI response in RCC and mutations in PBRM1 correlated with ICI response in some but not all studies [1, 4, 5]. In an attempt to identify signatures predictive of response to ICI, several groups have performed gene expression profiling on tumor samples from clinical trials using ICI in metastatic RCC. The T-effector (TeffHigh) gene signature, the 26-gene “Renal 101 Immuno signature” and the 18-gene T-cell inflamed gene expression profile (GEP) are three such signatures that correlated with improved response to ICI-based combinations in first-line metastatic RCC trials [1–3]. In IMmotion150, a randomized phase 2 study of atezolizumab alone or combined with bevacizumab versus sunitinib in treatment-naïve metastatic RCC, high expression of Teff gene signature positively correlated with progression-free survival (PFS) benefit with atezolizumab/bevacizumab combination compared to sunitinib [1]. Likewise, in the JAVELIN Renal 101 trial, a randomized phase 3 study of avelumab with axitinib versus sunitinib in treatment-naïve metastatic RCC, a 26-gene “Renal 101 Immuno signature” was identified. Patients with higher Immuno signature expression had a longer PFS in the avelumab/axitinib arm but not in the sunitinib arm [2]. Additionally, the TeffHigh gene signature from IMmotion150, when applied to JAVELIN 101, also identified patients more likely to benefit from avelumab/axitinib. Finally, the 18–gene T-cell inflamed gene expression profile correlated with response to pembrolizumab in the single-arm phase 2 trial KEYNOTE-427 using first-line pembrolizumab in metastatic RCC patients [3].
However, these clinical trials primarily comprised of Caucasian patients and lacked subgroup analyses to determine the benefit of ICI-based combinations or the applicability of these signatures in African American (AA) patients. Although previous studies have shown that multiple factors such as cultural, socioeconomic, psychosocial, and healthcare access lead to higher cancer burden and poor disease outcomes in AA patients [6, 7], our knowledge of the extent to which tumor biology contributes to the reported level of disparities in RCC is limited. While studies comparing the immune microenvironment between the two races in other cancer types have identified significant biological differences, [8–11] there are few studies in the scientific literature exploring the differences in biology of RCC in AA patients compared to Caucasians. In one study, comparison of 19 AA patients with 400 Caucasian from the TCGA KIRC dataset revealed lower VHL mutations, lower expression of HIF and VEGF-associated pathways, and an enrichment of the aggressive ccB molecular subtype in the AA patients [12]. To further delve into the differences in tumor microenvironment between AA and Caucasian RCC tumors, here we compare the expression of the aforementioned predictive immune signatures in AA patients compared to Caucasians.
MATERIALS AND METHODS
Raw gene expression count data from the TCGA kidney clear cell (KIRC) data set were downloaded from the publicly available TCGA data portal, and tumor samples from “white” and “black or AA” patients were selected. The expression values of each of the genes in the T-eff, Renal 101 Immuno signature and 18-gene T-cell inflamed gene expression profile were VST-transformed normalized counts (this is a variance-stabilizing transformation defined in the R/Bioconductor package DESeq2 which yields log2-scaled expression values adjusted for different “size factors” in the samples) and compared between the AA and Caucasian patients. The displayed p-values are from Wilcoxon two-sample rank sum tests, with no adjustment for multiple comparisons (but note that in signatures with only 18–26 genes, a p-value of 0.001 will be significant even after accounting for multiplicity). We used the Wilcoxon test as it appropriately tests expression values displayed in boxplot(s), requires no distributional assumptions, and does not depend on terms other than race that were included in the model given to DESeq.
RESULTS
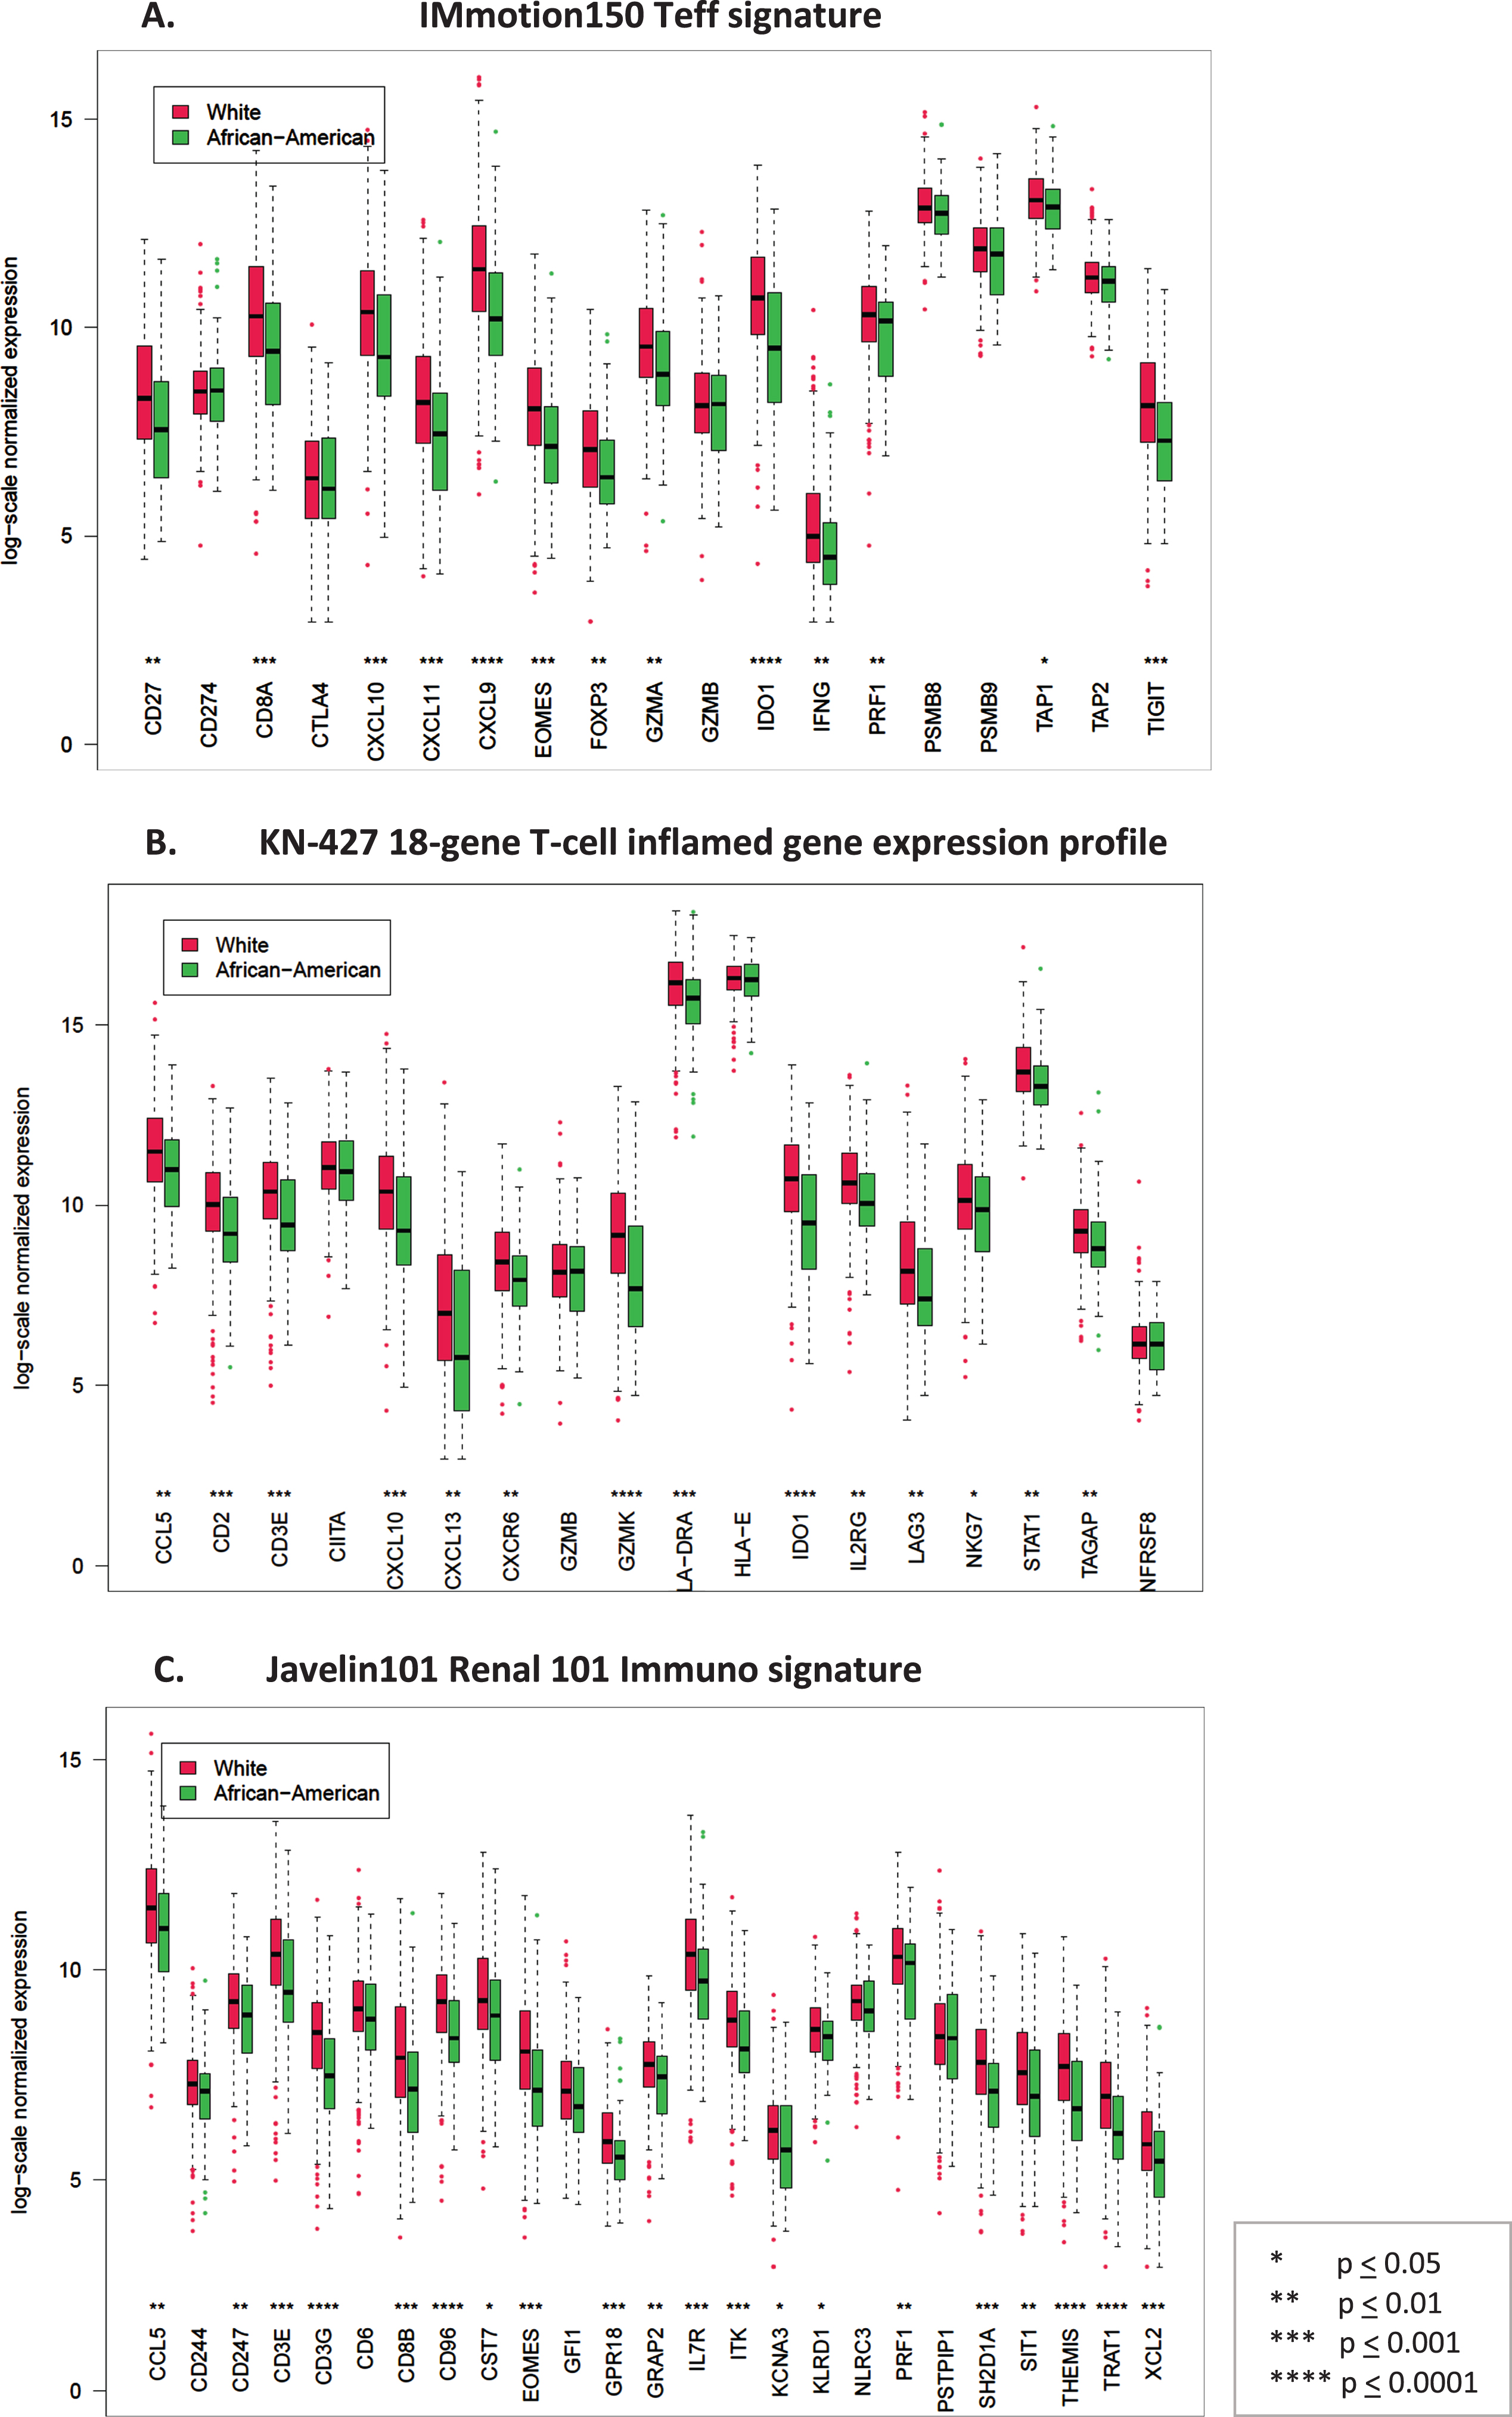
There were 457 Caucasian and 55 AA patients in the TCGA with non-missing tumor stage and available gene expression data. In the TCGA KIRC dataset most patients had non-metastatic disease and in all patients transcriptomic sequencing was performed in the primary tumor (Table 1). We found that the individual gene expression in each immune signature was significantly lower in AA patients compared to Caucasians in the TCGA dataset (p < 0.05) (Fig. 1). We validated this finding in an independent dataset of 100 Caucasian and 15 AA patients with stage T1b or higher RCC with available gene expression data using the Nanostring 770 Immune Profile Panel. A similar pattern of reduced median log-2 normalized gene expression in all but 1 gene was observed in AA patients (Supplemental Figure 1).
Table 1
Patient characteristics in the TCGA dataset
| African American (N = 56) | Caucasians (N = 459) | |
| Stage | ||
| T1N0M0 | 39 (69.6%) | 221 (48.1%) |
| T2N0M0 | 6 (10.7%) | 49 (10.7%) |
| T3N0M0 | 8 (14.2%) | 102 (22.2%) |
| T4N0M0 | 0 | 2 (0.4%) |
| anyTN+M0 | 0 | 10 (2.2%) |
| anyTN0M1 | 3 (5.3%) | 71 (15.5%) |
| anyTN + M1 | 0 | 4 (0.87%) |
| Synchronous | 4 (6.7%) | 0 |
| Metachronous | 47 (80%) | 395 (86%) |
| Not reported | 5 (10.2%) | 64 (14%) |
| Median age at diagnosis (yrs) | 59.5 | 61 |
| Metastatic | 3 (5.3%) | 75 (16.3%) |
| Non-metastatic | 53 (95%) | 384 (83.6%) |
| Gender | ||
| Male | 27 (48.2%) | 308 (67.1%) |
| Female | 29 (51.7%) | 151 (32.9%) |
Fig. 1
Box plots comparing log-scale normalized gene expression between African American (green) (N = 55) and Caucasian (red) (N = 457) patients in the TCGA dataset. A. Genes in the T-effector signature from IMmotion150 study, B. Genes in the 18-gene T-cell inflamed gene expression profile from KN-427 study, C. Genes in the Javelin101 Renal 101 Immuno signature from Javelin101 study.
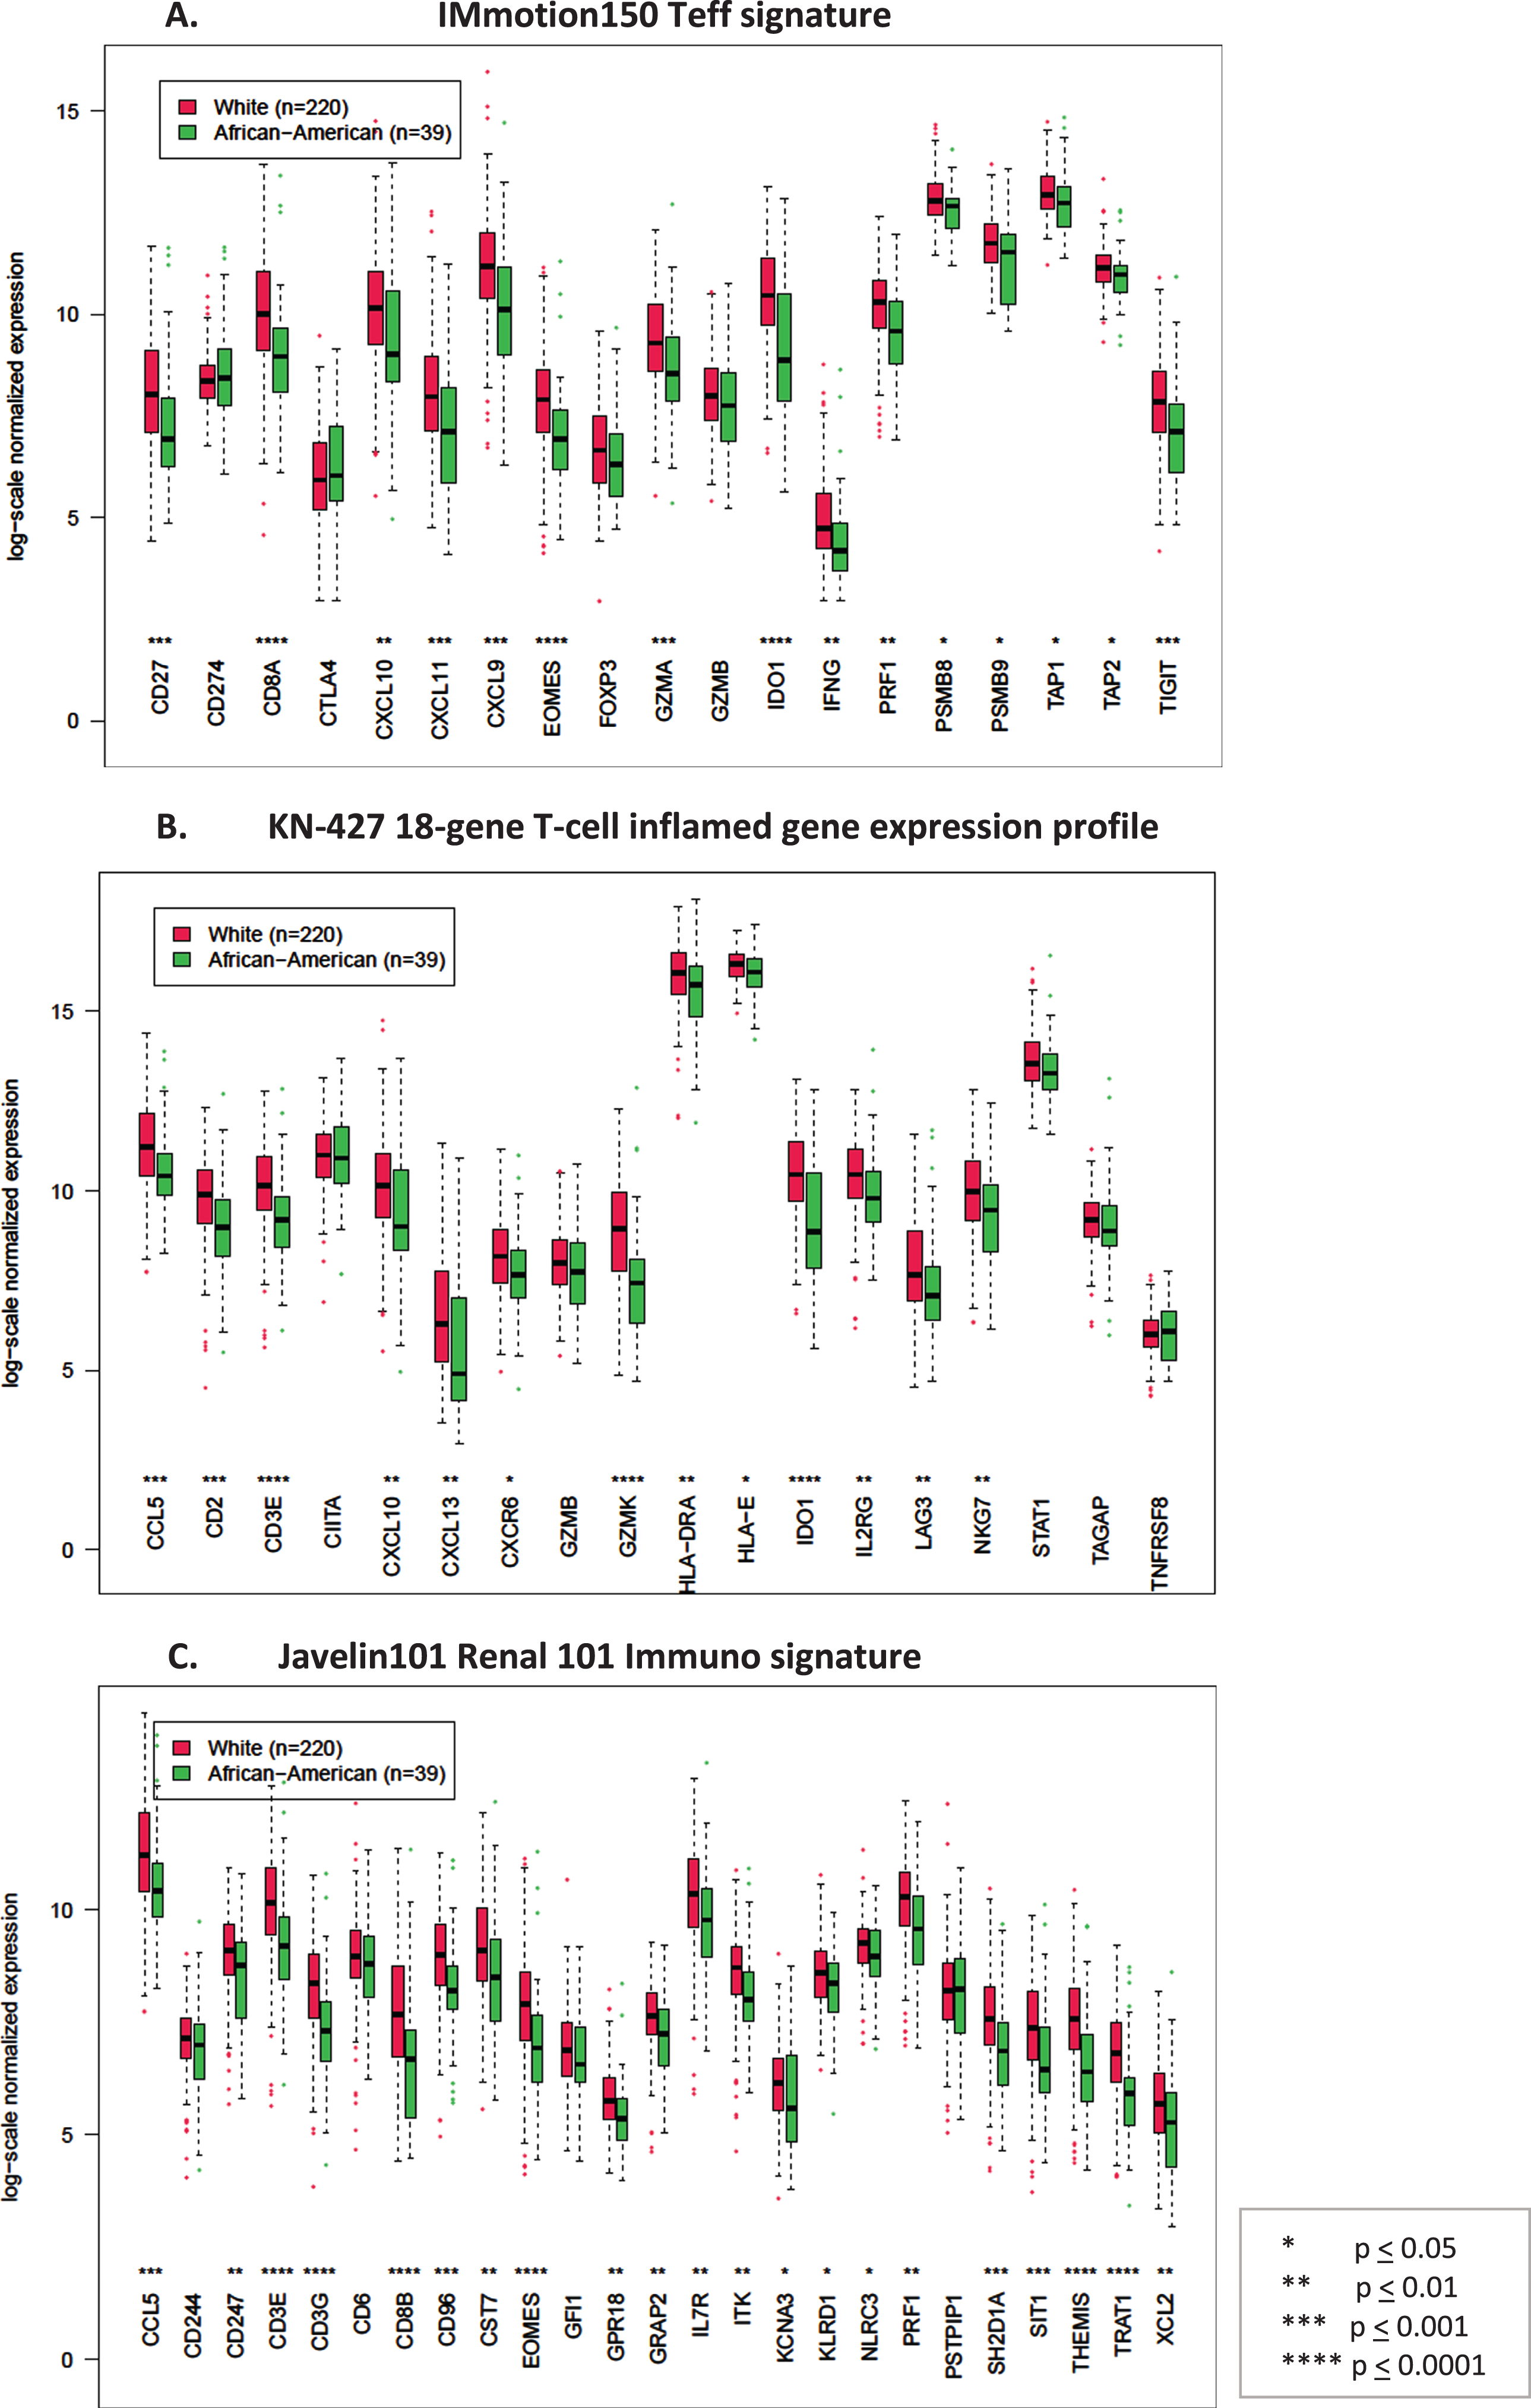
Since most (39 of 55 (71%)) AA patients in the TCGA dataset were stage I, compared to 220 of 457 (48%) Caucasians, we then evaluated if immune gene expression varies with tumor stage. Indeed, comparison of gene expression by stage (stage I vs stage II-IV) in the TCGA KIRC dataset showed significantly lower immune signature expression in low vs high stage tumors (Supplemental Figure 2). We then controlled for stage and compared immune signature gene expression between stage I AA and stage I Caucasian tumors in the TCGA. Consistent with our previous finding, stage I AA tumors still had a significantly lower expression of genes in each of the immune signatures compared to the stage I Caucasian tumors (Fig. 2).
Fig. 2
Box plots comparing log-scale normalized gene expression between African American (green) (N = 39) and Caucasian (red) (N = 220) patients in stage I tumors in the TCGA dataset. A. Genes in the T-effector signature from IMmotion150 study, B. Genes in the 18-gene T-cell inflamed gene expression profile from KN-427 study, C. Genes in the Javelin101 Renal 101 Immuno signature from Javelin101 study.
DISCUSSION
Our finding of low expression of predictive immune gene signatures in AA patients compared to Caucasians indicates a possible difference in the biology of the tumors between the races. The Teff signature included genes representing T-effector presence and function, IFN-γ response, checkpoint inhibitors, and antigen presentation, [1] the Renal 101 Immuno signature comprised regulators of both adaptive and innate immune responses (T cell and NK cell), cell trafficking, and inflammation but displayed limited overlap with the IMmotion 150 Teff signature [2]. The KN427 T-cell–inflamed GEP comprised of 18 genes indicative of a T-cell–activated TME, again with little overlap with the other two signatures [3]. Characterizing the inherent differences in tumor biology in AA patients will allow detection of molecular events that are enriched in this population as well as identify immune signatures predictive for ICI response specifically in AA patients.
The finding that immune gene expression varies with tumor stage indicates that the choice of tumor specimen used for signature testing may influence the ability of the signature to be predictive of ICI response. This is interesting because 63% of tumor specimens in Javelin101 were collected from archival nephrectomy samples, and in KN427, archival tissue sample < 3 years prior to study enrollment were encouraged but not mandated. Future studies are needed to validate our findings in other datasets and to study the published predictive immune signatures specifically in AA patients.
ACKNOWLEDGMENTS
The authors have no acknowledgements
FUNDING
The authors report no funding
AUTHOR CONTRIBUTIONS
Conception: PG, MS
Acquisition, analysis: PG, AS, MS
Writing (original draft or revision for important intellectual content): PG, AS, MS
Supervision: PG, MS
All authors had access to the data
CONFLICT OF INTEREST
Pooja Ghatalia has no conflicts of interest.
Aangi Shah has no conflicts of interest.
Michael Slifker has no conflicts of interest.
SUPPLEMENTARY MATERIAL
[1] The supplementary material is available in the electronic version of this article: https://dx.doi.org/10.3233/KCA-220003.
REFERENCES
[1] | McDermott DF , Huseni MA , Atkins MB , Motzer RJ , Rini BI , Escudier B , et al. Clinical activity and molecular correlates of response to atezolizumab alone or in combination with bevacizumab versus sunitinib in renal cell carcinoma. Nat Med. (2018) ;24: (6):749–57. |
[2] | Motzer RJ , Robbins PB , Powles T , Albiges L , Haanen JB , Larkin J , et al. Avelumab plus axitinib versus sunitinib in advanced renal cell carcinoma: biomarker analysis of the phase 3 JAVELIN Renal 101 trial. Nat Med. (2020) ;26: (11):1733–41. |
[3] | McDermott DF , Lee J-L , Donskov F , Tykodi SS , Bjarnason GA , Larkin JMG , et al. Association of gene expression with clinical outcomes in patients with renal cell carcinoma treated with pembrolizumab in KEYNOTE-427. Journal of Clinical Oncology. (2020) ;38: (15_suppl):5024. |
[4] | Miao D , Margolis CA , Gao W , Voss MH , Li W , Martini DJ , et al. Genomic correlates of response to immune checkpoint therapies in clear cell renal cell carcinoma. Science. (2018) ;359: (6377):801–6. |
[5] | Braun DA , Ishii Y , Walsh AM , Van Allen EM , Wu CJ , Shukla SA , et al. Clinical Validation of PBRM1 Alterations as a Marker of Immune Checkpoint Inhibitor Response in Renal Cell Carcinoma. JAMA Oncol. (2019) ;5: (11):1631–3. |
[6] | Chow WH , Shuch B , Linehan WM , Devesa SS . Racial disparity in renal cell carcinoma patient survival according to demographic and clinical characteristics. Cancer. (2013) ;119: (2):388–94. |
[7] | Berndt SI , Carter HB , Schoenberg MP , Newschaffer CJ . Disparities in treatment and outcome for renal cell cancer among older black and white patients. J Clin Oncol. (2007) ;25: (24):3589–95. |
[8] | King Thomas J , Mir H , Kapur N , Singh S . Racial Differences in Immunological Landscape Modifiers Contributing to Disparity in Prostate Cancer. Cancers (Basel). (2019) ;11: (12). |
[9] | Abdou Y , Attwood K , Cheng TD , Yao S , Bandera EV , Zirpoli GR , et al. Racial differences in CD8. Breast Cancer Res. (2020) ;22: (1):62. |
[10] | Rayford W , Beksac AT , Alger J , Alshalalfa M , Ahmed M , Khan I , et al. Comparative analysis of African-American and European-American men with prostate cancer identifies distinct genomic and immunological differences. Commun Biol. (2021) ;4: (1):670. |
[11] | Curran T , Sun Z , Gerry B , Findlay VJ , Wallace K , Li Z , et al. Differential immune signatures in the tumor microenvironment are associated with colon cancer racial disparities. Cancer Med. (2021) ;10: (5):1805–14. |
[12] | Krishnan B , Rose TL , Kardos J , Milowsky MI , Kim WY . Intrinsic Genomic Differences Between African American and White Patients With Clear Cell Renal Cell Carcinoma. JAMA Oncol. (2016) ;2: (5):664–7. |
[13] | Love MI , Huber W , Anders S . Moderated estimation of fold change and dispersion for RNA-seq data with DESeq2. Genome Biol. (2014) ;15: (12):550. |


