
Real-World Utilization of Oral Anticancer Agents and Related Costs in Older Adults with Metastatic Renal Cell Carcinoma in the United States
Abstract
BACKGROUND:
Substantial racial and socioeconomic disparities in metastatic RCC (mRCC) have persisted following the introduction of targeted oral anticancer agents (OAAs). The relationship between patient characteristics and OAA access and costs that may underlie persistent disparities in mRCC outcomes have not been examined in a nationally representative patient population.
METHODS:
Retrospective SEER-Medicare analysis of patients diagnosed with mRCC between 2007–2015 over age 65 with Medicare part D prescription drug coverage. Associations between patient characteristics, OAA receipt, and associated costs were analyzed in the 12 months following mRCC diagnosis and adjusted to 2015 dollars.
RESULTS:
2,792 patients met inclusion criteria, of which 32.4%received an OAA. Most patients received sunitinib (57%) or pazopanib (28%) as their first oral therapy. Receipt of OAA did not differ by race/ethnicity or socioeconomic indicators. Patients of advanced age (> 80 years), unmarried patients, and patients residing in the Southern US were less likely to receive OAAs. The mean inflation-adjusted 30-day cost to Medicare of a patient’s first OAA prescription nearly doubled from $3864 in 2007 to $7482 in 2015, while patient out-of-pocket cost decreased from $2409 to $1477.
CONCLUSION:
Race, ethnicity, and socioeconomic status were not associated with decreased OAA receipt in patients with mRCC; however, residing in the Southern United States was, as was marital status. Surprisingly, the cost to Medicare of an initial OAA prescription nearly doubled from 2007 to 2015, while patient out-of-pocket costs decreased substantially. Shifts in OAA costs may have significant economic implications in the era of personalized medicine.
BACKGROUND
Renal cell carcinoma (RCC) has historically been the leading cause of years of life lost among genitourinary malignancies [1]. However, multiple oral targeted anticancer agents have been approved for treatment of mRCC [2] since 2005. As of 2010, most privately insured patients under sixty-five with mRCC who received systemic therapy used an oral anticancer agent as their first line of therapy, with first line cytotoxic chemotherapy and cytokine treatments being used in less than 10%of patients [3].
Epidemiologic studies of patients with mRCC in the U.S. have documented that overall mRCC survival has improved following the introduction of these targeted therapies [4]; however, some patient groups continue to show persistent disparities in mRCC outcomes. Even in the targeted therapy era, black patients continue to have a higher mortality risk than white patients [4–6]. Delayed or restricted access to these new therapies may contribute to disparities in outcomes, which in turn may be influenced by OAA costs. However, neither OAA access nor costs have been examined within a nationally-representative population of patients with mRCC. Costs of these oral agents following their initial adoption in privately insured patients were high, with median monthly OAA drug costs reaching $4,686 from 2004–2010 and median monthly out of pocket costs totaling $215 [3]. High drug costs, particularly high out-of-pocket costs for patients, could disproportionately affect treatment decisions across patient socioeconomic status. The primary goal of this study was to investigate the association between patient and clinical characteristics and the utilization and associated costs of OAAs in SEER-Medicare patients aged 65 + diagnosed with mRCC.
METHODS
Study population
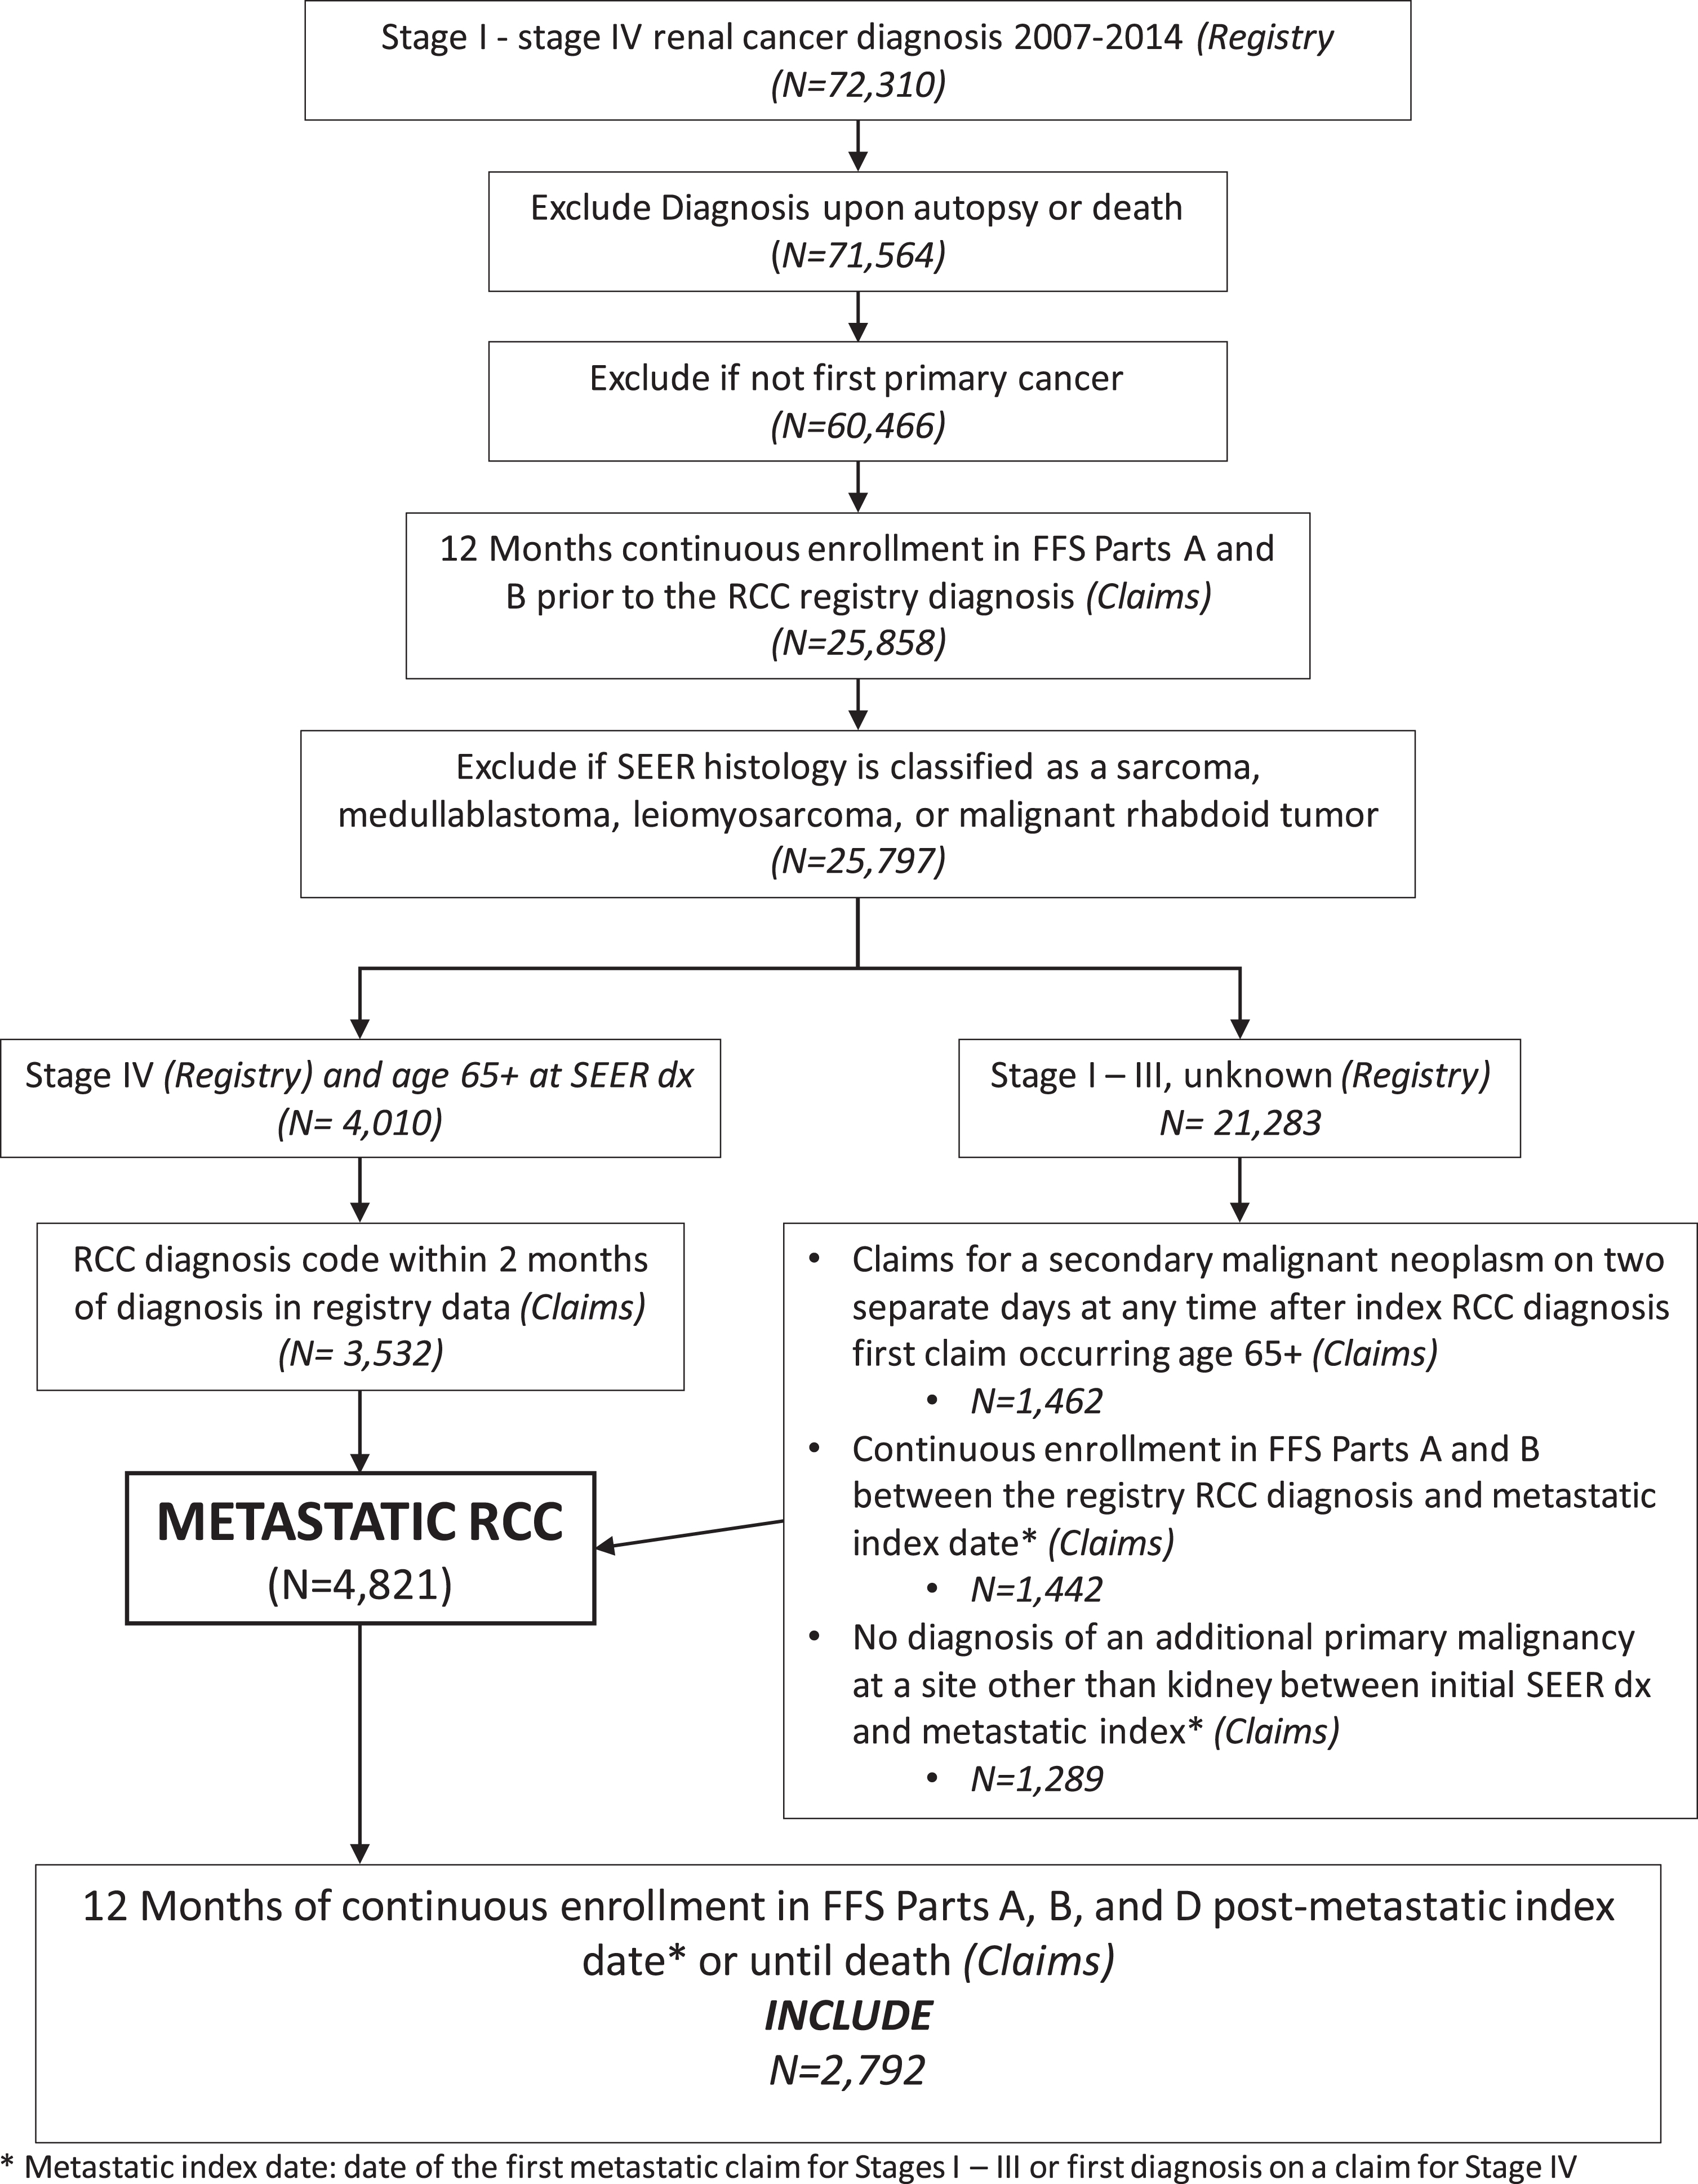
This was a retrospective cohort study of SEER-Medicare patients diagnosed with mRCC from 2007–2015 who were enrolled in Medicare Part D for at least 1 year after diagnosis or until death (Fig. 1). Full cohort selection details are described in the Supplemental Appendix file. Patients were required to have at least 12 months of continuous enrollment in Medicare fee-for-service parts A and B before the SEER RCC diagnosis, and for Parts A, B, and D for 12 months after the metastatic index date or until death. Patients were excluded if their metastatic diagnosis occurred at autopsy or death, if they were < age 65 at metastatic index date, or if they had a second primary diagnosis of cancer at another site between the initial SEER RCC diagnosis date and their metastatic index date.
Fig. 1
Cohort inclusion and exclusion criteria diagram.
Patient characteristics
We examined patient and clinical characteristics including race/ethnicity, age at metastatic diagnosis, sex, stage at initial RCC diagnosis, histology at initial RCC diagnosis, marital status, geographic region of residence, metropolitan residence, and zip code socioeconomic characteristics. We used validated coding algorithms to assess patient comorbidities of interest in the 12 months prior to the metastatic index date using diagnosis codes (Supplemental Appendix B) from inpatient, outpatient, and carrier Medicare claims files [7, 8].
Use of oral anticancer agents
Utilization of an OAA was determined by a Part D prescription drug claim for any of the following OAAs that were FDA-approved by 2015: sorafenib, sunitinib, pazopanib, everolimus, and axitinib. Utilization was treated as a binary indicator if a patient filled a prescription in 12 months following the mRCC diagnosis.
Patient total, cancer-specific, and OAA-specific Medicare costs
Total Medicare costs in the year following diagnosis were obtained by summing line-item Medicare reimbursements from all outpatient, inpatient, home health, skilled nursing, durable medical equipment, hospice, and carrier claims for patients diagnosed with that cancer type over each calendar year. All Part D prescription reimbursement costs were calculated by subtracting the patient payment from the total cost for all Part D prescription claims in the evaluation period.
Cancer-specific costs were calculated from the subset of a patient’s claims that listed a primary RCC or metastatic cancer diagnosis code (ICD-9/ICD-10) or that had a procedure code for a cancer treatment procedure (Supplemental Appendix A). Part D cancer drug costs were calculated for the subset of a patient’s Part D claims for drugs approved to treat RCC.
OAA costs to Medicare were calculated by subtracting Medicare Part D patient payments from the total prescription claim cost for OAA prescription claims. Out-of-pocket costs for OAAs were defined as the patient payment amounts on OAA prescription claims. Costs were calculated for the patient’s first fill standardized to a 30 day supply, and summed for all of their fills in the 12 months following metastatic diagnosis.
Statistical methods
We examined differences in patient and clinical characteristics by receipt of OAA, year, and drug over time. Continuous variables were described using mean (SD) or median (IQR). Categorical variables were described using frequencies and percentages. Group differences were tested using t-tests and Cochran-Mantel-Haenszel tests for nonzero correlation. For each OAA of interest, we calculated the percentage receiving an OAA within the 12 months following their metastatic diagnosis. Univariable and multivariable log-binomial regression analyses were used to assess patient characteristics associated with OAA utilization within 12 months of metastatic diagnosis.
Costs were adjusted to 2015 dollars using the Consumer Price Index Medical Care component. Associations between costs and receipt of an OAA with adjustment for patient race, demographics, clinical characteristics, and year of metastatic diagnosis were modeled using multivariable generalized linear modeling with a gamma distribution and log-link. Multivariable models were also adjusted for a patient’s total Medicare costs, per $1000, in the baseline year before diagnosis to provide adjustment for baseline healthcare costs.
For patients who received an OAA, cost to Medicare and out of pocket costs for the patient’s first OAA fill standardized to a 30 day supply, and their total 12-month Medicare and out of pocket costs for OAAs were modeled using generalized linear modeling with a gamma distribution and log link with adjustment for patient race, demographics, clinical characteristics, and year of metastatic diagnosis.
Study approval
This study was approved by the Duke University Institutional Review Board (Protocol # Pro00101962).
RESULTS
Study population
Our study cohort included 2,792 patients with mRCC diagnosed from 2008–2015 (Table 1). The majority had an initial diagnosis of Stage 4 cancer (71.2%), while the remainder of the cohort’s RCC were initially diagnosed at a lower stage (Table 1). 76.2%of patients were of non-Hispanic white race (N = 2,103), 7%were non-Hispanic black race (N = 195), 10.8%were identified as Hispanic (N = 302), with 192 remaining patients of other races (Table 1). Black and Hispanic patients in the study were more likely to live in zip codes with higher poverty rates and lower educational attainment than white patients, and black patients were nearly half as likely as patients of other races to be married (Table 1). Black patients were less likely to have clear cell histology than other patients, and had higher rates of multiple comorbidities at diagnosis including hypertension, congestive heart failure, COPD, diabetes, end stage renal disease, and peripheral vascular disease (Table 1).
Table 1
Baseline Characteristics of All Included Metastatic RCC Patients Stratified by Patient Race
| Non-Hispanic White | Non-Hispanic Black | Hispanic | Other | p-value | |
| N | 2,103 | 195 | 302 | 192 | |
| Characteristics | |||||
| Age at metastatic diagnosis | 0.208 | ||||
| 66– 70 | 523 (24.8) | 56 (28.7) | 99 (32.8) | 41 (21.3) | |
| 71– 75 | 546 (25.9) | 47 (24.1) | 69 (22.8) | 55 (28.6) | |
| 76– 80 | 458 (21.8) | 41 (21.0) | 60 (19.9) | 40 (20.8) | |
| 81+ | 576 (27.4) | 51 (26.2) | 74 (24.5) | 56 (29.1) | |
| Sex | 0.699 | ||||
| Female | 878 (41.7) | 90 (46.1) | 128 (42.4) | 81 (42.2) | |
| Male | 1,225 (58.2) | 105 (53.8) | 174 (57.6) | 111 (57.8) | |
| Tumor stage at initial SEER diagnosis | 0.884 | ||||
| I | 214 (10.2) | 17 (8.7) | 29 (9.6) | 18 (9.3) | |
| II | 68 (3.2) | <11* | <11* | <11* | |
| III | 267 (12.7) | 16 (8.2) | 43 (14.2) | 24 (12.5) | |
| IV | 1,494 (71.0) | 149 (76.4) | 210 (69.5) | 136 (70.8) | |
| Unknown | 60 (2.8) | <11* | <15* | <11* | |
| Histology | 0.002 | ||||
| Other | 370 (17.6) | 52 (26.7) | 43 (14.2) | 27 (14.1) | |
| Clear cell histology | 1,733 (82.4) | 143 (73.3) | 259 (85.8) | 165 (85.9) | |
| Married | 1,118 (53.2) | 59 (30.2) | 154 (51.0) | 113 (58.8) | <0.001 |
| Lives in metropolitan area | 1,624 (77.2) | 157 (80.5) | 271 (89.7) | 171 (89.1) | <0.001 |
| Geographic region | <0.001 | ||||
| Midwest | 306 (14.5) | 23 (11.8) | <11* | <11* | |
| Other | 183 (8.7) | 28 (14.4) | <11* | <11* | |
| Northeast | 493 (23.4) | 26 (13.3) | 26 (8.6) | 18 (9.4) | |
| South | 413 (19.6) | 71 (36.4) | <11* | <11* | |
| West | 708 (33.7) | 47 (24.1) | 261 (86.4) | 164 (85.4) | |
| Dual enrolled | 412 (19.6) | 119 (61.0) | 209 (69.2) | 115 (59.9) | <0.001 |
| Highest quartile: black race | 482 (22.9) | 155 (79.5) | 30 (9.9) | 18 (9.4) | <0.001 |
| Highest quartile: adults 25+ with less than high school education | 380 (18.1) | 84 (43.1) | 163 (54.0) | 58 (30.2) | <0.001 |
| Highest quartile: households living below poverty level | 406 (19.3) | 116 (59.5) | 120 (39.7) | 43 (22.4) | <0.001 |
| Nephrectomy in 12 months prior | 0.310 | ||||
| Partial | 37 (1.7) | <11* | <11* | <11* | |
| Radical | 195 (9.3) | <11* | 30 (9.9) | <20* | |
| Myocardial infarction | 213 (10.1) | 24 (12.3) | 28 (9.3) | 20 (10.4) | 0.740 |
| Hypertension | 1,801 (85.6) | 185 (94.9) | 256 (84.8) | 171 (89.1) | 0.002 |
| Peripheral vascular disease | 564 (26.8) | 72 (36.9) | 74 (24.5) | 51 (26.6) | 0.014 |
| Congestive heart failure | 468 (22.2) | 70 (35.9) | 57 (18.9) | 57 (29.7) | <0.001 |
| Dementia | 93 (4.4) | <15* | <15* | <11* | 0.873 |
| Cardiovascular disease | 482 (22.9) | 59 (30.2) | 68 (22.5) | 41 (21.3) | 0.113 |
| Chronic obstructive pulmonary disease | 679 (32.3) | 78 (40.0) | 90 (29.8) | 61 (31.8) | 0.107 |
| Cardiovascular disease | 482 (22.9) | 59 (30.3) | 68 (22.5) | 41 (21.3) | 0.113 |
| Rheumatologic disease | 104 (4.9) | <11* | 22 (7.3) | <11* | 0.133 |
| Peptic ulcer disease | 55 (2.6) | <11* | <15* | <15* | 0.021 |
| Mild liver disease | 291 (13.8) | 39 (20.0) | 53 (17.5) | 37 (19.3) | 0.016 |
| End stage renal disease | 602 (28.6) | 75 (38.4) | 103 (34.1) | 62 (32.3) | 0.009 |
| Diabetes | 815 (38.7) | 118 (60.5) | 171 (56.6) | 104 (54.2) | <0.001 |
| Diabetes with complications | 278 (13.2) | 50 (25.6) | 79 (26.1) | 38 (19.8) | <0.001 |
| Hemiplegia or paraplegia | 46 (2.2) | <11* | <11* | <11* | 0.070 |
| Year of metastatic diagnosis | 0.227 | ||||
| 2007 | 176 (8.4) | 22 (11.3) | 29 (9.6) | 19 (9.9) | |
| 2008 | 193 (9.2) | 14 (7.2) | 35 (11.6) | 20 (10.4) | |
| 2009 | 190 (9.0) | 27 (13.8) | 27 (8.9) | 13 (6.8) | |
| 2010 | 189 (9.0) | 20 (10.2) | 35 (11.6) | 23 (12.0) | |
| 2011 | 244 (11.6) | 17 (8.7) | 36 (11.9) | 23 (11.9) | |
| 2012 | 257 (12.2) | 16 (8.2) | 42 (13.9) | 22 (11.4) | |
| 2013 | 300 (14.3) | 36 (18.5) | 35 (11.6) | 21 (10.9) | |
| 2014 | 302 (14.4) | 23 (11.8) | 35 (11.6) | 29 (15.1) | |
| 2015 | 252 (12.0) | 20 (10.2) | 28 (9.3) | 22 (11.4) |
*Cell sizes less than 11 are suppressed in accordance with SEER-Medicare cell size suppression polices.
OAA utilization in metastatic RCC
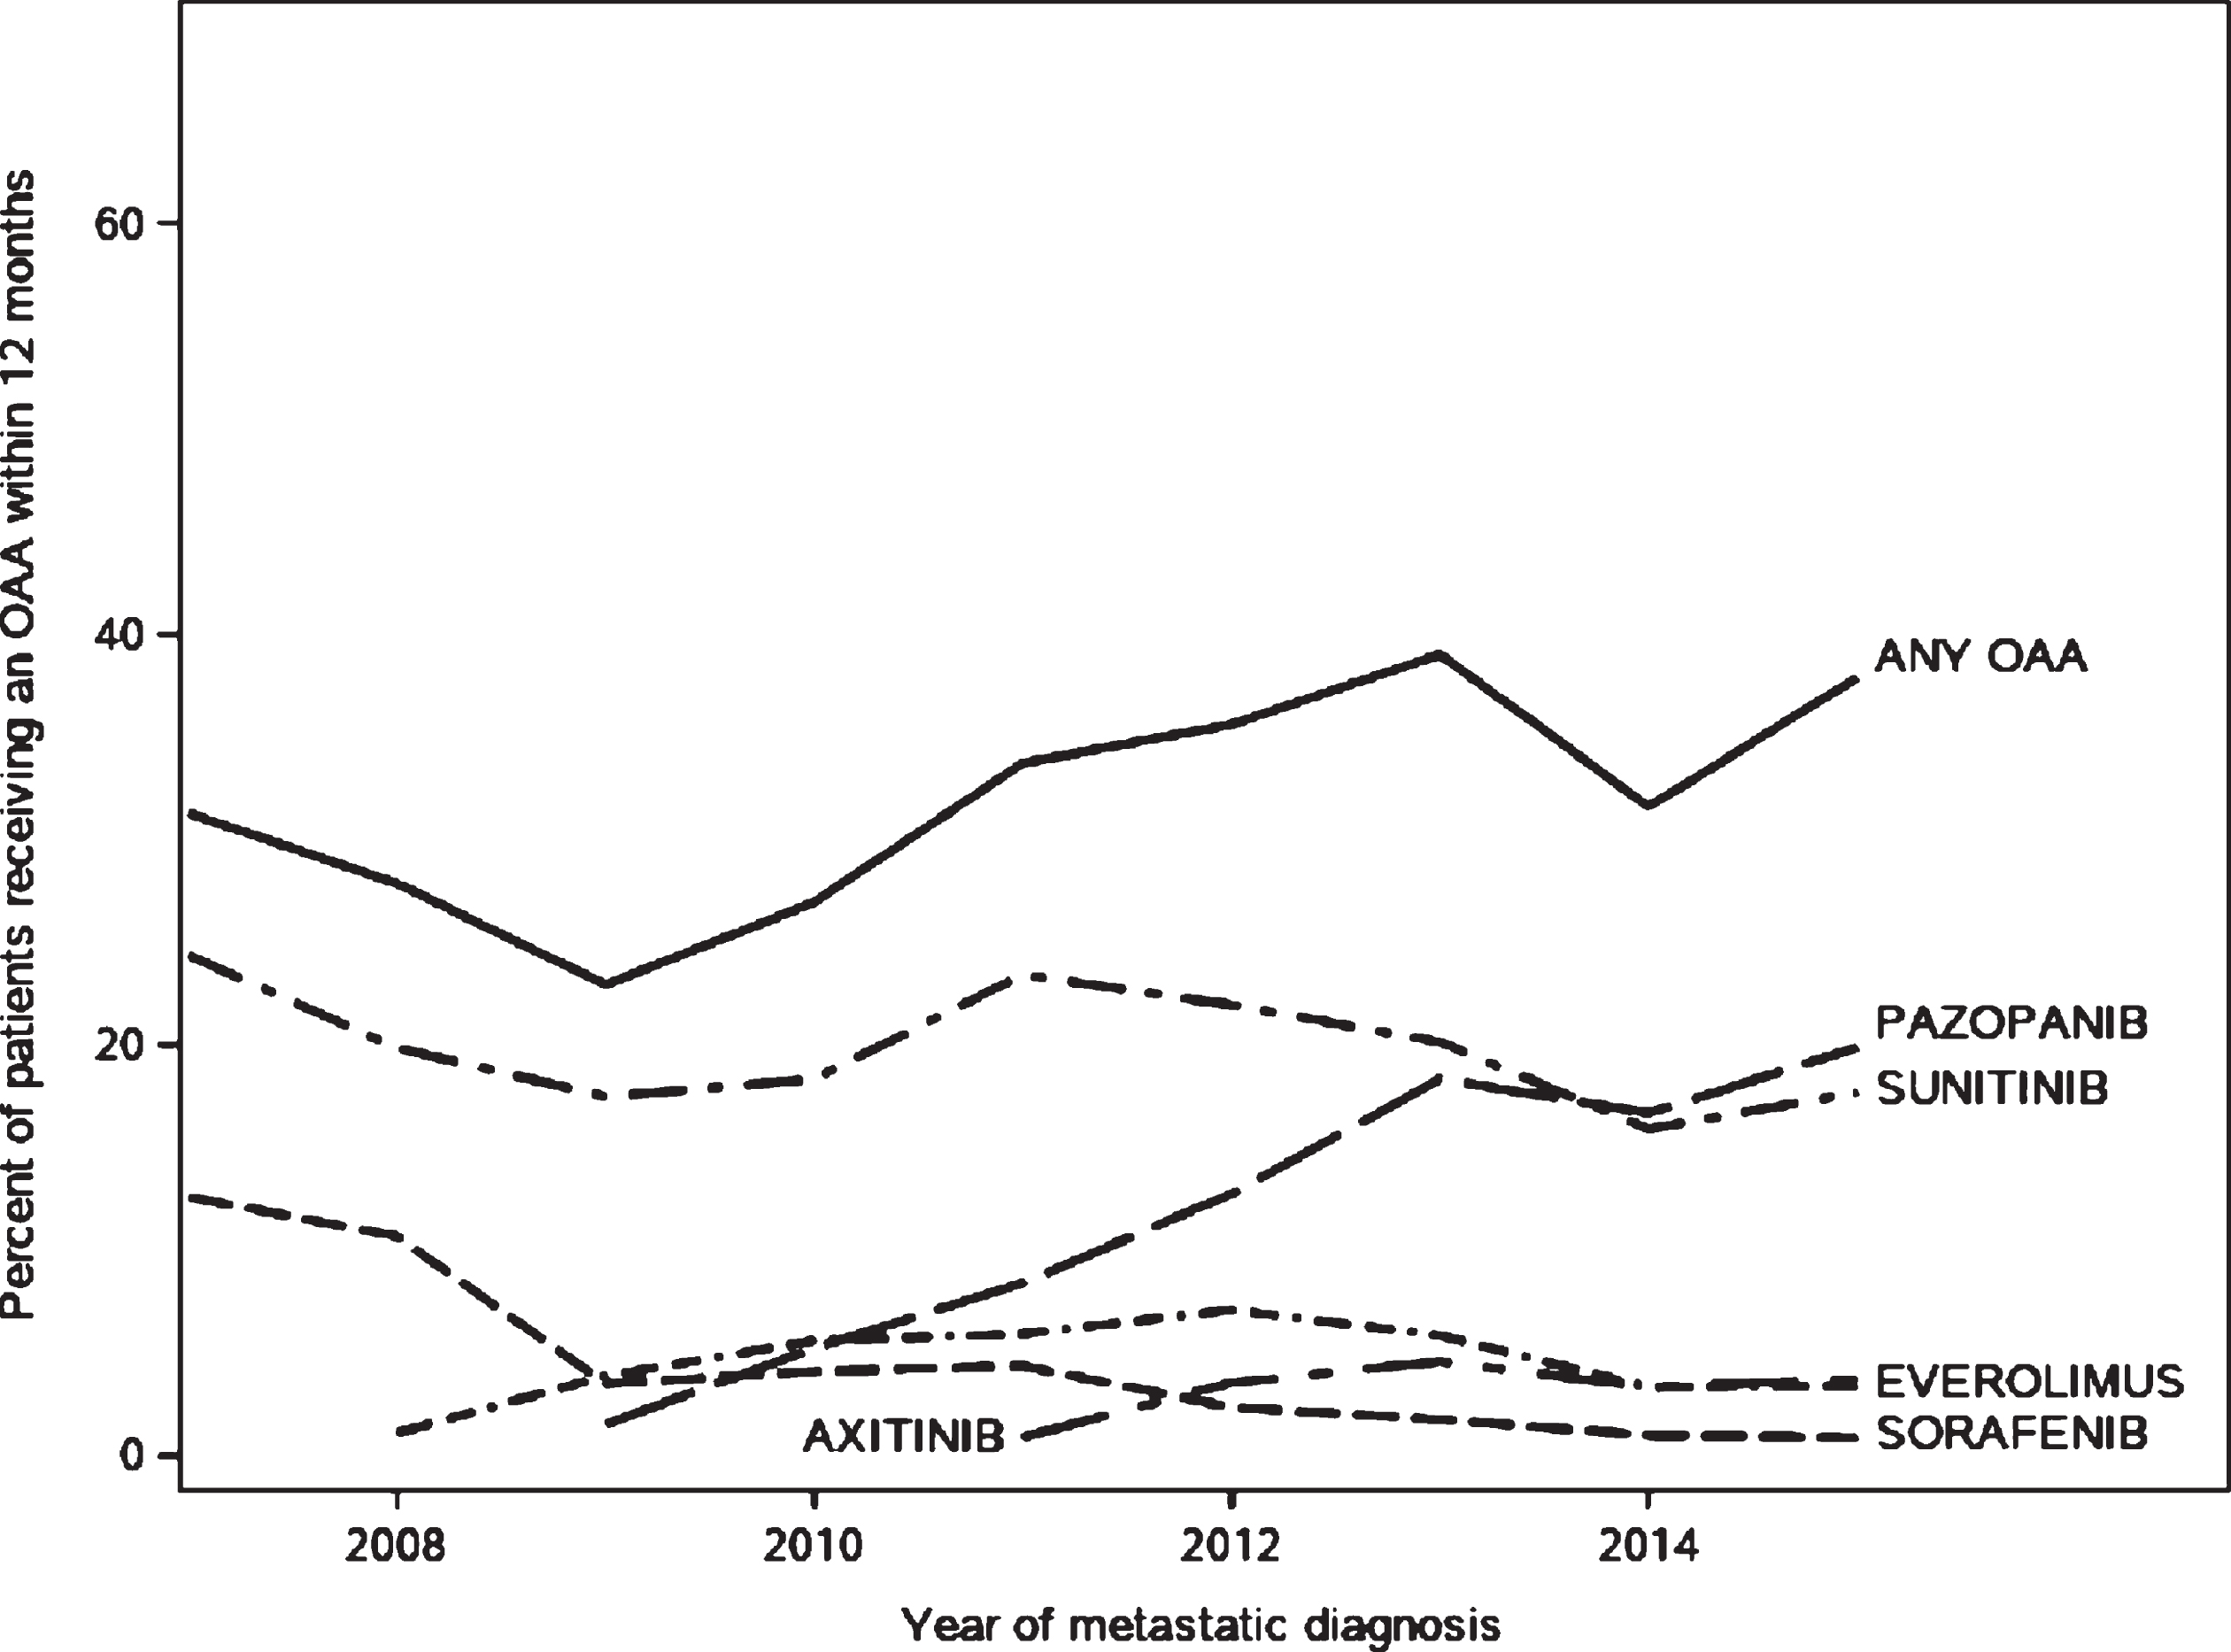
Thirty-two percent of patients filled an OAA prescription in the 12 months following their mRCC diagnosis (Table 2). Between 50–60%of the cohort did not receive any systemic therapy in the 12 months following their diagnosis, with slightly higher rates of systemic treatment receipt in later study years (Supplemental Figure 1). OAAs were the most commonly used drug class for patients receiving therapy. Rates of OAA utilization in the mRCC cohort increased from 2007 (31%of patients) to 2015 (37%, trend p value < 0.001) (Fig. 2, Table 2). Sunitinib and pazopanib accounted for the majority of OAA use (Fig. 2). Among patients who received at least one OAA prescription, 57.6%received sunitinib as their first OAA, and 27.8%percent received pazopanib (Supplemental Table 1). Black Non-Hispanic patients had the lowest rate of OAA use compared to patients of other races (25%of black patients receiving OAAs vs 31%of Non-Hispanic rates patients, p value < 0.001, Table 2). The median time from diagnosis of mRCC to receipt of an OAA was 49 days (IQR 24–103 days); time to OAA receipt was shorter in patients with dual enrollment in Medicaid (–14 days, SE 3.04, p < 0.001) but did not differ by any other examined patient characteristics.
Table 2
Baseline Characteristics of All Metastatic RCC Patients by Utilization of an Oral Anticancer Drug in the 12 Months Following Metastatic Diagnosis (N = 2792)
| Variable | OAA use | No OAA use | p-value |
| N (row %) | 907 (32.5%) | 1,885 (68.5%) | |
| Characteristics | |||
| Age at metastatic diagnosis | < 0.001 | ||
| 66–70 | 288 (40.1) | 431 (59.9) | |
| 71–75 | 278 (38.8) | 439 (61.2) | |
| 76–80 | 207 (34.6) | 392 (65.4) | |
| 81+ | 134 (17.7) | 623 (82.3) | |
| Race/ethnicity | < 0.001 | ||
| Black Non-Hispanic | 48 (24.6) | 147 (75.4) | |
| Hispanic | 114 (37.7) | 188 (62.3) | |
| White Non-Hispanic | 665 (31.6) | 1438 (68.4) | |
| Other | 80 (41.7) | 112 (58.3) | |
| Sex | < 0.001 | ||
| Female | 337 (28.6) | 840 (71.4) | |
| Male | 570 (35.3) | 1045 (64.7) | |
| Initial Stage at SEER dx | < 0.001 | ||
| I | 77 (27.7) | 201 (72.3) | |
| II | 29 (31.5) | 63 (68.5) | |
| III | 149 (42.6) | 201 (57.4) | |
| IV | 621 (31.2) | 1368 (68.8) | |
| Unknown | 31 (37.3) | 52 (62.6) | |
| Histology | < 0.001 | ||
| Other | 99 (20.1) | 393 (79.9) | |
| Clear cell histology | 808 (35.1) | 1492 (64.9) | |
| Married | 536 (37.1) | 908 (62.9) | < 0.001 |
| Lives in metropolitan area | 731 (32.9) | 1492 (67.1) | 0.375 |
| Geographic region | < 0.001 | ||
| Midwest | 106 (31.0) | 236 (69.0) | |
| Other | 68 (31.6) | 147 (68.4) | |
| Northeast | 156 (27.7) | 407 (72.3) | |
| South | 141 (28.6) | 351 (71.3) | |
| West | 436 (36.9) | 744 (63.1) | |
| Medicaid Dual enrolled | 277 (32.4) | 578 (67.6) | 0.947 |
| Residential zip code-level characteristics | |||
| Highest quartile: residents of black race | 195 (28.5) | 490 (71.5) | 0.010 |
| Highest quartile: adults 25 + with less than high school education | 242 (35.3) | 443 (64.7) | 0.067 |
| Highest quartile: households living below poverty level | 211 (30.8) | 474 (69.2) | 0.279 |
| Nephrectomy in 12 months prior to metastatic dx | 0.044 | ||
| Partial | 17 (34.7) | 32 (65.3) | |
| Radical | 100 (39.4) | 154 (60.6) | |
| Myocardial infarction | 87 (30.5) | 198 (69.5) | 0.456 |
| Hypertension | 803 (33.3) | 1610 (66.7) | 0.024 |
| Peripheral vascular disease | 221 (29.0) | 540 (71.0) | 0.017 |
| Congestive heart failure | 187 (28.7) | 465 (71.3) | 0.018 |
| Dementia | 13 (10.4) | 112 (89.6) | < 0.001 |
| Cardiovascular disease | 177 (27.2) | 473 (72.8) | 0.001 |
| Chronic obstructive pulmonary disease | 285 (31.4) | 623 (68.6) | 0.390 |
| Cardiovascular disease | 177 (27.2) | 473 (72.8) | 0.001 |
| Rheumatologic disease | 42 (30.2) | 97 (69.8) | 0.557 |
| Peptic ulcer disease | 28 (32.2) | 59 (67.8) | 0.951 |
| Mild liver disease | 147 (35.0) | 273 (65.0) | 0.232 |
| End stage renal disease | 259 (30.8) | 583 (69.2) | 0.200 |
| Diabetes with complications | 159 (35.7) | 286 (64.3) | 0.110 |
| Hemiplegia or paraplegia | 15 (21.1) | 56 (78.9) | 0.038 |
| Year of metastatic diagnosis | < 0.001 | ||
| 2007 | 77 (31.3) | 169 (68.7) | |
| 2008 | 73 (27.9) | 189 (72.1) | |
| 2009 | 59 (22.9) | 198 (77.0) | |
| 2010 | 72 (27.0) | 195 (73.0) | |
| 2011 | 108 (33.7) | 212 (66.3) | |
| 2012 | 120 (35.6) | 217 (64.4) | |
| 2013 | 153 (39.0) | 239 (61.0) | |
| 2014 | 123 (31.6) | 266 (68.4) | |
| 2015 | 122 (37.9) | 200 (62.1) |
Fig. 2
Trends in receipt of oral anticancer agents in the 12 months following diagnosis with metastatic renal cell carcinoma among SEER-Medicare patients aged 65 and older.
After multivariable adjustment (Table 3), patient age at diagnosis, stage at initial cancer diagnosis, tumor histology, geographic region of residence, and certain comorbidities were associated with a patient’s likelihood of OAA receipt. Patients over age 81 years were half as likely to receive an OAA (RR 0.50 95%CI 0.42–0.60) compared to patients aged 66–70 years at diagnosis. Clear cell histology (RR 1.65 95%CI 1.38–1.98) and being stage 3 cancer at initial SEER diagnosis (RR 1.18 95%CI 1.01–1.37) were associated with higher likelihood of receiving OAAs, while patients initially diagnosed at Stage 1 were less likely to receive an OAA (RR 0.80 95%CI 0.65–0.98). Patients living in the Southern US were less likely to receive an OAA compared to patients living in the West (RR 0.83 95%CI 0.70–0.98), and patients who were married were 13%more likely to receive an OAA than unmarried patients (RR 1.13 95%CI 1.01–1.27). Patients with hypertension were more likely to receive an OAA (RR 1.32 95%CI 1.11–1.57), whereas patients with dementia were less than half as likely to receive an OAA (0.44 95%CI 0.26–0.74). Black patients had nominally lower relative risk of OAA utilization compared to white patients, but the association was not statistically significant in multivariable-adjusted models (RR 0.88 95%CI 0.68–1.15). When modeled with an interaction term for geographic region of residence and race, the interaction term was not statistically significant, indicating there was no evidence for the association between patient race and OAA utilization differing across geographic regions. There was also no evidence of interaction between zip code-level measures of SES and geographic region.
Table 3
Unadjusted and Multivariable-Adjusted Associations Between Patient Characteristics and OAA Receipt (N = 2,792)
| Parameter | Unadjusted RR (95%CI) | Multivariable-adjusted RR (95 %CI) |
| Race/ethnicity (ref. White Non-Hispanic) | ||
| Black Non-Hispanic | 0.78 (0.60–1.00) | 0.88 (0.68–1.15) |
| Hispanic | 1.19 (1.02–1.40) | 0.99 (0.83–1.19) |
| Other | 1.32 (1.10–1.58) | 1.16 (0.96–1.39) |
| Age at metastatic diagnosis (ref. 66–70) | ||
| 71–75 | 0.97 (0.85–1.10) | 0.92 (0.81–1.04) |
| 76–80 | 0.86 (0.75–0.99) | 0.90 (0.78–1.03) |
| 81+ | 0.44 (0.37–0.53) | 0.50 (0.42–0.60) |
| Male sex | 1.23 (1.10–1.38) | 1.10 (0.99–1.23) |
| Stage at initial SEER Diagnosis (ref. Stage IV) | ||
| I | 0.89 (0.73–1.08) | 0.80 (0.65–0.98) |
| II | 1.01 (0.74–1.37) | 0.85 (0.63–1.14) |
| III | 1.36 (1.19–1.57) | 1.18 (1.01–1.37) |
| Unknown | 1.20 (0.90–1.59) | 1.21 (0.92–1.59) |
| Clear cell histology | 1.75 (1.45–2.10) | 1.65 (1.38–1.98) |
| U.S. Region of residence (ref. West) | ||
| Midwest | 0.84 (0.70–1.00) | 0.92 (0.77–1.10) |
| Other | 0.86 (0.69–1.06) | 0.98 (0.79–1.22) |
| Northeast | 0.75 (0.64–0.87) | 0.87 (0.74–1.01) |
| South | 0.78 (0.66–0.91) | 0.83 (0.70–0.98) |
| Married | 1.35 (1.21–1.50) | 1.13 (1.01–1.27) |
| Lives in metropolitan area | 1.06 (0.93–1.22) | 1.08 (0.94–1.24) |
| Dual enrollment | 1.00 (0.89–1.12) | 1.03 (0.90–1.17) |
| Residential zip code-level characteristics | ||
| Highest quartile: black race | 1.12 (0.99–1.26) | 1.13 (0.98–1.30) |
| Highest quartile: adults 25 + with less than high school education | 0.84 (0.74–0.96) | 0.95 (0.82–1.10) |
| Highest quartile: households living below poverty level | 0.93 (0.82–1.06) | 0.95 (0.82–1.09) |
| Nephrectomy (ref. No nephrectomy) | ||
| Partial | 1.09 (0.74–1.61) | 1.06 (0.72–1.55) |
| Radical | 1.24 (1.05–1.46) | 1.05 (0.88–1.25) |
| Myocardial infarction | 0.93 (0.78–1.12) | 0.97 (0.81–1.16) |
| Hypertension | 1.21 (1.02–1.44) | 1.32 (1.11–1.57) |
| Peripheral vascular disease | 0.86 (0.76–0.98) | 0.99 (0.87–1.13) |
| Congestive heart failure | 0.85 (0.74–0.98) | 0.93 (0.81–1.07) |
| Dementia | 0.31 (0.18–0.52) | 0.44 (0.26–0.74) |
| Cardiovascular disease | 0.80 (0.70–0.92) | 0.88 (0.77–1.01) |
| Chronic obstructive pulmonary disease | 0.93 (0.72–1.20) | 0.99 (0.79–1.25) |
| Cardiovascular disease | 0.99 (0.73–1.35) | 1.09 (0.81–1.46) |
| Rheumatologic disease | 1.09 (0.95–1.26) | 1.08 (0.94–1.24) |
| Peptic ulcer disease | 0.93 (0.82–1.04) | 0.89 (0.79–1.01) |
| Mild liver disease | 1.07 (0.96–1.19) | 0.96 (0.85–1.08) |
| End stage renal disease | 1.12 (0.98–1.29) | 1.12 (0.96–1.30) |
| Diabetes with complications | 0.64 (0.41–1.01) | 0.74 (0.48–1.15) |
| Year of diagnosis (ref 2007) | ||
| 2008 | 0.89 (0.68–1.16) | 0.82 (0.63–1.06) |
| 2009 | 0.73 (0.55–0.98) | 0.79 (0.59–1.04) |
| 2010 | 0.86 (0.66–1.13) | 0.87 (0.67–1.13) |
| 2011 | 1.08 (0.85–1.37) | 1.07 (0.86–1.35) |
| 2012 | 1.14 (0.90–1.44) | 1.17 (0.93–1.46) |
| 2013 | 1.25 (1.00–1.56) | 1.26 (1.02–1.56) |
| 2014 | 1.01 (0.80–1.28) | 1.02 (0.81–1.28) |
| 2015 | 1.21 (0.96–1.53) | 1.20 (0.96–1.49) |
OAA utilization and total and cancer-specific healthcare spending
In multivariable-adjusted models, receipt of an OAA was associated with 36%higher total Medicare spending in the 12 months following metastatic diagnosis (RCR 1.36 95%CI 1.28–1.45), and 47%higher cancer-specific spending (RCR 1.47 95%CI 1.34–1.61) compared to no OAA receipt (Table 4). Hispanic race was associated with approximately 20%higher total costs (RCR 1.19 95%CI 1.06–1.33) and cancer-specific costs (RCR 1.20 95%CI 1.01–1.41), even after adjusting for receipt of an OAA. There was no difference in inpatient admission cost by race. When modeled with an interaction term for geographic region of residence and race, the interaction term was not statistically significant, indicating there was no evidence for the association between patient race and costs differing across geographic regions.
Table 4
Unadjusted and Multivariable-Adjusted Relative Cost Ratios for OAA Use and Race Associations for Total Medicare Costs, Total Cancer-specific Medicare Costs, and Total Inpatient Admission-specific Medicare Costs in the 12 Months Following a Patient’s Metastatic RCC Diagnosis
| Parameter | Unadjusted Relative Cost Ratios RCR (95%CI) | Multivariable-adjusted Relative Cost Ratiosa RCR (95%CI) |
| Total Costs in 12 months post-dx | ||
| OAA Use (ref. none) | 1.40 (1.31–1.49) | 1.36 (1.28–1.45) |
| Race (ref. White Non-Hispanic) | ||
| Black Non-Hispanic | 0.86 (0.76–0.97) | 1.00 (0.88–1.14) |
| Hispanic | 1.08 (0.98–1.20) | 1.19 (1.06–1.33) |
| Other | 0.99 (0.88–1.12) | 1.04 (0.92–1.18) |
| Cancer-specific Costs in 12 months post-dx | ||
| OAA Use (ref. none) | 1.48 (1.35–1.62) | 1.47 (1.34–1.61) |
| Race (ref. White Non-Hispanic) | ||
| Black Non-Hispanic | 0.68 (0.57–0.81) | 0.92 (0.76–1.11) |
| Hispanic | 1.01 (0.88–1.17) | 1.20 (1.01–1.41) |
| Other | 0.96 (0.80–1.14) | 1.02 (0.85–1.22) |
| Inpatient Admission Costs in 12 months post-dx | ||
| OAA Use (ref. none) | 1.13 (1.06–1.22) | 1.08 (1.01–1.16) |
| Race (ref. White Non-Hispanic) | ||
| Black Non-Hispanic | 1.06 (0.93–1.20) | 1.07 (0.93–1.23) |
| Hispanic | 1.25 (1.13–1.40) | 1.09 (0.97–1.23) |
| Other | 1.25 (1.09–1.42) | 1.08 (0.94–1.24) |
aMultivariable models additionally adjusted for patient age, sex, cancer stage at initial diagnosis, tumor histology, region of residence, residence in metropolitan area, year of metastatic diagnosis, Medicaid dual enrollment status, zip code characteristics, patient comorbidities, and patient’s prior year total Medicare spending.
OAA-specific spending
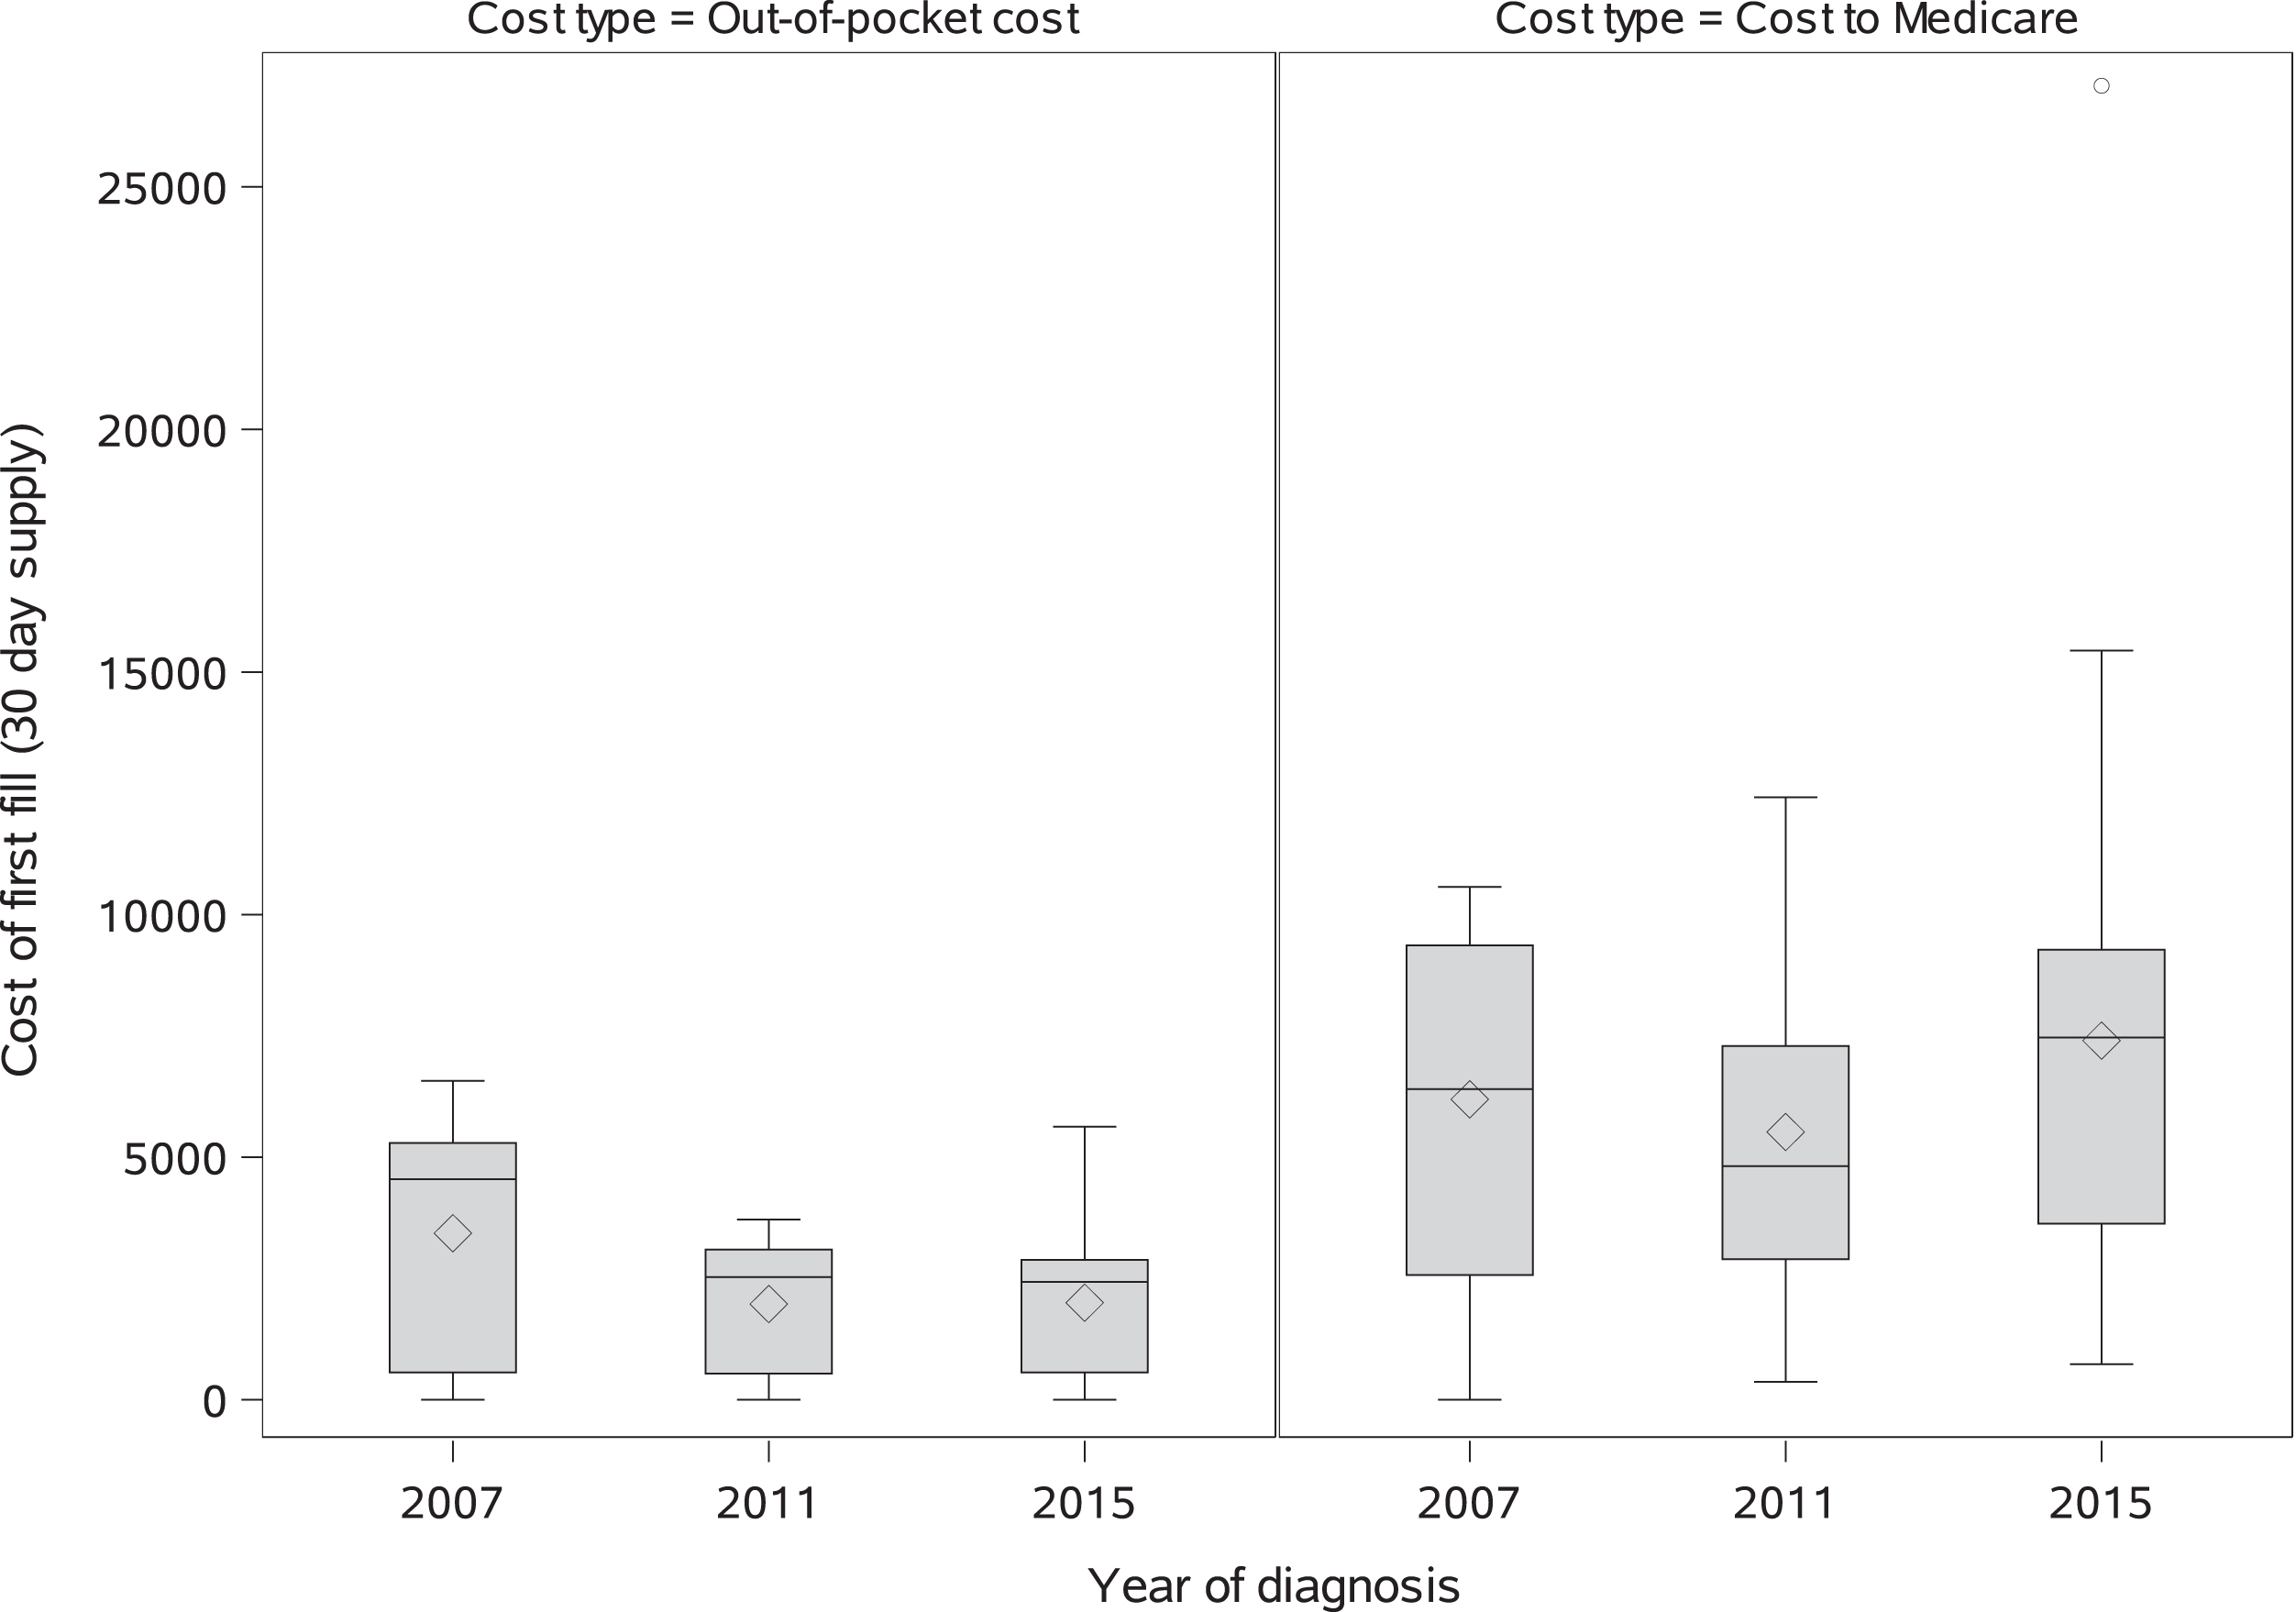
Among patients who received an OAA in the 12 months following their metastatic cancer diagnosis (Table 5, N = 907), multivariable-adjusted per-patient Medicare spending on both the first OAA prescription and total spending on OAAs for mRCC in the 12 months following metastatic diagnosis increased 6%per year beyond inflation from 2008–2015 (Initial prescription cost standardized to a 30 day supply to Medicare: RCR 1.06 95%CI 1.04–1.08; Total OAA cost to Medicare: RCR 1.06 95%CI 1.05–1.08;). Conversely, patient out-of-pocket spending for the initial prescription (Fig. 3) and total 12-month patient out-of-pocket spending on OAAs decreased approximately 9-10%per year (initial OOP prescription cost standardized to a 30 day supply: RCR 0.91 95%CI 0.88–0.95; total 12 month OAA cost to patient: RCR 0.90 95%CI 0.86–0.93). 9.2%of patients had zero out-of-pocket costs for their OAA fill; the distribution of out of pocket costs paid by patients for a 30 day supply shifted downward for each drug type from 2007–2015, though in 2015 more than half of patients were still paying > $1000 out of pocket for a thirty day supply. Medicare spending on both the first OAA fill and spending over 12 months was consistently lower for patients receiving pazopanib or sorafenib at their first fill compared to patients who initially received sunitinib. Patient out-of-pocket costs were 23%lower for patients receiving pazopanib at their first prescription and more than three times higher for patients receiving everolimus compared to patients who received sunitinb (Table 5). Out-of-pocket spending for both the first prescription fill standardized to a 30 day supply and over 12 months were consistently lower in patients of black, Hispanic, or other races compared to Non-Hispanic White patients; however, spending on OAAs by Medicare for the index fill and over 12 months did not differ across patient race/ethnicity categories (Table 5).
Table 5
Multivariable-adjusted Relative Cost Ratiosa for Associations between Race, Diagnosis Year, and Total 12-month OAA-specific Costs to Medicare, Total 12-month OAA-specific Patient Out-of-Pocket Costs, Medicare cost for the Patient’s First OAA Prescription, and Out-of-Pocket Costs for the Patient’s First OAA Prescription
| Parameter | Multivariable-adjusted Relative Cost Ratiosb RCR (95%CI) | |
| Cost to Medicare | Patient out-of-pocket costs | |
| Total OAA costs in 12 months post-DX | ||
| Race (ref. White Non-Hispanic) | ||
| Black Non-Hispanic | 1.02 (0.87–1.20) | 0.46 (0.30–0.72) |
| Hispanic | 1.05 (0.94–1.18) | 0.46 (0.34–0.62) |
| Other | 1.00 (0.88–1.14) | 0.43 (0.30–0.60) |
| Drug prescribed at first fill (ref. Sunitinib) | ||
| Sorafenib | 0.86 (0.76–0.98) | 0.65 (0.47–0.91) |
| Pazopanib | 0.75 (0.69–0.81) | 0.91 (0.73–1.13) |
| Everolimus | 0.96 (0.81–1.14) | 3.34 (1.84–6.08) |
| Axitinib | 1.03 (0.80–1.31) | 0.80 (0.43–1.51) |
| Year of metastatic diagnosis | ||
| 1 year increase | 1.06 (1.05–1.08) | 0.90 (0.86–0.93) |
| Cost for patient’s first OAA fill standardized to a 30-day supply | ||
| Race (ref. White Non-Hispanic) | ||
| Black Non-Hispanic | 1.05 (0.89–1.24) | 0.45 (0.29–0.69) |
| Hispanic | 1.13 (1.00–1.28) | 0.31 (0.24–0.41) |
| Other | 1.03 (0.90–1.19) | 0.31 (0.22–0.42) |
| Drug prescribed at first fill (ref. Sunitinib) | ||
| Sorafenib | 0.81 (0.70–0.93) | 0.69 (0.51–0.94) |
| Pazopanib | 0.59 (0.54–0.64) | 0.77 (0.62–0.95) |
| Everolimus | 0.97 (0.81–1.17) | 3.69 (2.07–6.56) |
| Axitinib | 0.92 (0.71–1.18) | 0.77 (0.41–1.43) |
| Year of metastatic diagnosis | ||
| 1 year increase | 1.06 (1.04–1.08) | 0.91 (0.88–0.95) |
aLimited to patients initiating an OAA. bMultivariable models additionally adjusted for patient age, sex, cancer stage at initial diagnosis, tumor histology, region of residence, residence in metropolitan area, Medicaid dual enrollment status, zip code characteristics, patient comorbidities, and patient’s prior year total Medicare spending.
Fig. 3
Distributions of out of pocket costs and costs to Medicare: inflation-adjusted and standardized to a 30 day supply for patient’ first OAA prescription by diagnosis year.
DISCUSSION
We report the first nationally representative analysis of the initial utilization and costs associated with OAAs in patients with newly diagnosed incident or subsequent metastatic RCC. There was no observed association between race, ethnicity, or SES and OAA receipt, suggesting that initial OAA access (i.e. receipt of at least one OAA prescription within a year of mRCC diagnosis) is not a substantive driver of mRCC disparities. Consistent with prior literature, individuals who were unmarried, over age 80, or that resided within the Southern U.S did see lower OAA initiation. [9, 10]. Surprisingly, the 30-day standardized cost to Medicare of a patient’s initial OAA nearly doubled from 2007 to 2015, increasing at roughly 6%per year, which may have significant economic implications in the era of personalized medicine. By 2015, 37%of patients with mRCC received an OAA within 12 months of their diagnosis, with pazopanib and sunitinib accounting for the majority of prescriptions filled.
Regional differences in receipt of quality cancer treatment across the US have previously been reported [11, 12]. Although we failed to observe a direct association between race and OAA utilization, we did observe lower rates of OAA utilization within the South, where the majority of black U.S. citizens reside [13]. There may be an opportunity for targeted interventions to improve equitable access to emerging cancer treatments focused on the Southern US.
Patients who were married at the time of their metastatic diagnosis were more likely to receive treatment with OAAs. A previous analysis of SEER data for patients with RCC (2004–2013) found that married patients had better 5-year all cause and cancer-specific survival than unmarried patients [14]. Marital status has previously been associated with higher likelihood of treatment receipt and improved survival in multiple cancers [15, 16]. While prior work has hypothesized that that these associations are driven by psychological benefits due to social support [17], encouragement from spouses to seek more definitive treatment [18], better medication adherence [19], and increased access to care [20], our results suggest that higher receipt of effective treatment may also be contributing to this survival benefit. In this study, black mRCC patients were less likely to be married at the time of diagnosis than patients of other races, indicating that marital status might be contributing to reported disparities in mRCC survival in studies without adjustment for marital status [6] via improved treatment access for married patients.
Patient receipt of an OAA was associated with increased total, cancer-specific, and inpatient admission-specific Medicare spending in the 12 months following metastatic diagnosis. This increased spending is consistent with the high costs of these agents and the likelihood that patients receiving OAAs are receiving more aggressive treatment than other patients. It is also possible that management and treatment of resulting drug toxicities are contributing to the higher costs for these patients.
Among patients who filled at least one OAA prescription, we observed evidence of growth in the cost of OAAs to Medicare beyond inflation by approximately 6%per year, which is consistent with prior reports of price inflation in OAAs [21]; however, out-of-pocket costs to patients decreased over time, suggesting that the burden of growing costs was not falling on patients. However, the cost of these agents is still high for many patients, with over half of patients paying > $1000 for a 30 day supply in 2015. Lower observed costs for patients receiving pazopanib is consistent with a previous analysis of claims data reporting lower monthly costs for those receiving pazopanib as a first line therapy compared to sunitinib [22]. In future analyses, we will extend this work by examining the relationships between adherence, survival, and costs by drug type.
This study provides a valuable look at real-world OAA utilization and costs in older adults with metastatic RCC, but it is subject to the limitations inherent to retrospective analyses of registry and claims databases. Administrative claims data do not provide the full clinical picture that physicians use to make treatment recommendations such as patient performance status and perceived ability to adhere to or tolerate these medications, nor can they capture patient preferences for treatment. SEER registries do not conduct follow-up on metastases occurring after diagnosis, so all metastatic tumors initially diagnosed at Stage < IV are identified using Medicare claims only, which do not have high sensitivity or specificity for identification of metastatic disease. Utilization and cost trends may not be generalizable to patients with other types of prescription drug insurance or who are without prescription drug coverage altogether; it is likely that socioeconomic disparities in access to OAAs would be more pronounced in patients without any prescription drug coverage Additionally, SEER registries capture cancer cases in specific geographic locations; these results may not be fully generalizable to regions of the US not included in the SEER-Medicare database, and our ability to fully assess regional differences may be limited by small sample sizes. A further limitation of this study is that the SEER-Medicare database does not provide any direct measures of individual socioeconomic status (SES), which may be very influential in receipt of these high-cost agents. We include zip code-levels measures of poverty rates and educational attainment, as well as patient dual-enrollment in Medicaid, but these are imperfect measures that do not capture a truly accurate picture of individual household SES.
Treatment modalities for renal cell carcinoma have evolved substantially since 2015, but due to the lag in data availability, these were the most recent years of data available for analysis in SEER-Medicare. The introduction of immunotherapies and other targeted oral therapies after 2015 such as cabozantinib have shifted recommended first line therapies for metastatic RCC, though both sunitinib and pazopanib remain recommended first line therapies for Stage IV patients with good prognosis [24]. Further research using data from more recent years is needed to determine whether these utilization patterns are similar in the era of immunotherapies and combination therapies.
This analysis demonstrated that among patients with a diagnosis of mRCC from 2007–2015, older age, residence in the Southern region of the United States, and being unmarried at diagnosis were associated with reduced likelihood of receiving an OAA in the 12 months following diagnosis, while race/ethnicity and neighborhood-level measures of SES were not. Patients receiving OAAs had higher total, cancer-specific, and inpatient admission-specific costs of care. Medicare spending for a 30 day supply of OAAs increased 6%beyond the pace of inflation per year, resulting in near doubling of Medicare payments for the same therapy from 2007 to 2015, while patient out-of-pocket costs decreased. Shifts in targeted cancer therapy costs have substantial implications for the economics of cancer health care costs and warrant further investigation.
ACKNOWLEDGMENTS
This study used the linked SEER-Medicare database. The ideas and opinions expressed herein are those of the author(s) and endorsement by the State of California Department of Public Health, the National Cancer Institute, and the Centers for Disease Control and Prevention or their Contractors and Subcontractors is not intended nor should be inferred. The interpretation and reporting of these data are the sole responsibility of the authors. The authors acknowledge the efforts of the National Cancer Institute; the Office of Research, Development and Information, CMS; Information Management Services (IMS), Inc.; and the Surveillance, Epidemiology, and End Results (SEER) Program tumor registries in the creation of the SEER-Medicare database.
AUTHOR CONTRIBUTIONS
LEW, LS, JP, MAG, CDS, CDB, DK, DJG, TZ, SBW, and MAD all contributed to the conception and design of the study, interpretation of the results, and manuscript review and revision. LEW conducted the statistical analysis and drafted the manuscript. MAD secured the funding for the study and served as the principal investigator.
FUNDING
This work was fully supported by funding from the National Cancer Institute (Grant Number 5R01CA226842-02). The content is solely the responsibility of the authors and does not necessarily represent the official views of the National Institutes of Health.
CONFLICTS OF INTEREST
Dr. George has relationships with Pfizer Inc., Bayer AG, Astellas, BMS, Calithera, Exelixis, Janssen, Novartis, Sanofi, and AstraZeneca. Dr. Zhang has relationships with Pfizer Inc., Bayer AG, BMS, Genomic Health, Janssen, Novartis, Astellas, Sanofi, Merck, Capio Biosciences and Calithera. The authors have no other conflicts of interest to report.
SUPPLEMENTARY MATERIAL
[1] The supplementary material is available in the electronic version of this article: https://dx.doi.org/10.3233/KCA-210119.
REFERENCES
[1] | Siegel RL , Miller KD , Jemal A . Cancer statistics, 2016. CA Cancer J Clin. (2016) ;66: (1):7–30. |
[2] | Shih YC , et al. Economic burden of renal cell carcinoma in the US: Part II–an updated analysis. Pharmacoeconomics. (2011) ;29: (4):331–41. |
[3] | Geynisman DM , et al. Treatment Patterns and Costs for Metastatic Renal Cell Carcinoma Patients With Private Insurance in the United States. Clinical Genitourinary Cancer. (2015) ;13: (2):e93–e100. |
[4] | Li P , et al. Survival among patients with advanced renal cell carcinoma in the pretargeted versus targeted therapy eras. Cancer Med. (2016) ;5: (2):169–81. |
[5] | Vaishampayan U , et al. The effect of targeted therapy on overall survival in advanced renal cancer: a study of the national surveillance epidemiology and end results registry database. Clin Genitourin Cancer. (2014) ;12: (2):124–9. |
[6] | Rose TL , et al. Racial disparities in survival among patients with advanced renal cell carcinoma in the targeted therapy era. Cancer. (2016) ;122: (19):2988–95. |
[7] | Klabunde CN , Warren JL , Legler JM . Assessing comorbidity using claims data: an overview. Med Care. (2002) ;40: (8 Suppl):Iv-26–35. |
[8] | Quan H , et al. Coding algorithms for defining comorbidities in ICD-9-CM and ICD-10 administrative data. Med Care. (2005) ;43: (11):1130–9. |
[9] | Motzer RJ , et al. Nivolumab plus Ipilimumab versus Sunitinib in Advanced Renal-Cell Carcinoma. N Engl J Med. (2018) ;378: (14):1277–90. |
[10] | Motzer RJ , et al. Pazopanib versus sunitinib in metastatic renal-cell carcinoma. N Engl J Med. (2013) ;369: (8):722–31. |
[11] | Sariego J . Regional variation in breast cancer treatment throughout the United States. Am J Surg. (2008) ;196: (4):572–4. |
[12] | Farrow NE , et al. Disparities in guideline-concordant treatment for node-positive, non–small cell lung cancer following surgery. The Journal of Thoracic and Cardiovascular Surgery. (2020) ;160: (1):261–271.e1. |
[13] | Rastogi S , Johnson TD , Hoeffel E , Drewery M Jr. , The Black Population: 2010. 2011. |
[14] | Miao T , et al. Marital status and survival of patients with kidney cancer. Oncotarget. (2017) ;8: (49):86157–67. |
[15] | Aizer AA , et al. Marital Status and Survival in Patients With Cancer. Journal of Clinical Oncology.. (2013) ;31: (31):3869–76. |
[16] | Osborne C , et al. The Influence of Marital Status on the Stage at Diagnosis, Treatment, and Survival of Older Women with Breast Cancer. Breast Cancer Research and Treatment. (2005) ;93: (1):41–7. |
[17] | Goldzweig G , et al. Psychological distress among male patients and male spouses: what do oncologists need to know? Annals of Oncology. (2010) ;21: (4):877–83. |
[18] | Aizer AA , et al. Multidisciplinary Care and Pursuit of Active Surveillance in Low-Risk Prostate Cancer. Journal of Clinical Oncology. (2012) ;30: (25):3071–6. |
[19] | Cohen SD , et al. Social Support and Chronic Kidney Disease: An Update. Advances in Chronic Kidney Disease. (2007) ;14: (4):335–44. |
[20] | Aizer AA , et al. Marital status and survival in patients with cancer. J Clin Oncol. (2013) ;31: (31):3869–76. |
[21] | Shih YT , et al. Rising Prices of Targeted Oral Anticancer Medications and Associated Financial Burden on Medicare Beneficiaries. J Clin Oncol. (2017) ;35: (22):2482–9. |
[22] | Vogelzang NJ , et al. Clinical and Economic Outcomes in Elderly Advanced Renal Cell Carcinoma Patients Starting Pazopanib or Sunitinib Treatment: A Retrospective Medicare Claims Analysis. Adv Ther. (2017) ;34: (11):2452–65. |
[23] | Trogdon JG , et al. Medical costs associated with metastatic breast cancer in younger, midlife, and older women. Breast Cancer Res Treat. (2020) ;181: (3):653–65. |
[24] | National Comprehensive Cancer Network, NCCN guidelines for patients: Kidney Cancer 2020. https://www.nccn.org/patients/guidelines/content/PDF/kidney-patient.pdf. |


