
PD-L1 Expression and Treatment Implications in Metastatic Clear Cell Renal Cell Carcinoma: A Systematic Review
Abstract
BACKGROUND:
Over the past decade, immune checkpoint inhibitors (ICIs) have increasingly become the standard of care for various advanced malignancies, including metastatic clear cell renal cell carcinoma (mccRCC). Most ICIs currently used in clinical practice inhibit the interaction between the programmed cell death protein-1 (PD-1) and programmed death ligand-1 (PD-L1) complex. A deeper understanding of this interaction and PD-L1 expression in tumors has led to more effective therapies in the treatment of advanced cancers, but the debate regarding the utility of PD-L1 as a biomarker continues.
OBJECTIVE:
We aimed to systematically evaluate the role of PD-L1 in mccRCC in terms of expression and treatment implications.
METHODS:
Following PRISMA guidelines, we performed a systematic literature search using PubMed and Embase through August 31, 2020. Titles and abstracts were screened to identify articles for full-text review. A hand search was also performed using Google Scholar and the bibliography to relevant studies.
RESULTS:
A total of 26 articles were identified, and relevant data were extracted and organized. The available information regarding PD-L1 expression in mccRCC from both prospective clinical trials and retrospective studies were summarized. We discussed the utility of PD-L1 as a predictive and prognostic biomarker in mccRCC, its association with other potential biomarkers, and the pattern and level of expression of PD-L1 in primary versus metastatic tumors.
CONCLUSIONS:
Although significant progress has been made, much more remains to be learned regarding the differences between PD-L1+ and PD-L1- ccRCC tumors, in terms of both the underlying biology and clinical responses to immunotherapy and other agents.
INTRODUCTION
Kidney cancer ranks among the top 10 most com-mon cancer diagnoses in men and women worldwide [1]. Clear cell renal cell carcinoma (ccRCC) makes up about 80% of all kidney cancer cases [2]. Over the years, the pathogenesis and development of ccRCC, which involves the serine/threonine kinase mTOR pathway leading to angiogenesis, has become more understood [3]. This knowledge leveraged the development of several targeted therapies including anti-angiogenic therapies and mTOR inhibitors [4].
Programmed cell death protein 1 (PD-1) (CD279) and cytotoxic T-lymphocyte-associated protein 4 (CTLA-4) (CD152) are expressed on T-cells and are neg-ative regulators of T-cell immune function [5]. PD-1 is activated by programmed death ligand 1 (PD-L1) (also known as CD274 or B7-H1), which is expre-ssed on antigen-presenting cells (APCs) including immune cells and on tumor cells. When PD-L1 binds to PD-1, the downstream signaling leads to apoptosis of the T-cell and consequent immune tolerance to the tumor. This interaction has been studied extensively since inhibiting it with immune checkpoint inhibitors (ICIs) upregulates the response of the immune system against cancer cells.
Over the past decade, ICI therapy has emerged as a very important treatment option in the armamentar-ium available against many solid malignancies inclu-ding metastatic ccRCC (mccRCC) [6]. Several phase 3 clinical trials have demonstrated that ICIs alone or in combination with a tyrosine kinase inhibitor (TKI) are superior to traditional agents such as vascular endothelial growth factor (VEGF) inhibitors (i.e., sunitinib) and mTOR inhibitors (i.e., everolimus) in the frontline or second-line setting [7–11].
In this systematic review, we report the assays used to determine PD-L1 status, frequency of PD-L1 expression in patients with mccRCC, its predictive and prognostic value for treatment with traditional front-line therapy as well as with ICI therapy, and the association of PD-L1 expression between matched primary and metastatic sites. We further discuss the potential use of PD-L1 as a biomarker for response to treatment and comment on other possible biomarkers for mccRCC.
METHODS
Search strategy
We conducted a systematic literature search acc-ording to the PRISMA (Preferred Reporting Items for Systematic Reviews and Meta-Analyses) guidelines [12] to identify studies reporting PD-L1 in mccRCC in PubMed and Embase databases through August 31, 2020. These two databases were searched using the following keywords and MeSH terms (if available): programmed death ligand 1, metastatic clear cell renal cell carcinoma, advanced renal cell carcinoma, ipilimumab, nivolumab, durvalumab, avelumab, atezolizumab, tremelimumab, pembrolizumab.
The first and second authors independently conducted the selection process in two stages. The initial inclusion of titles in the first stage was performed via screening the content of the title and abstract. The second stage was done via full-text reading of the remaining articles, as well as a manual search of publications in relevant articles to avoid missing other eligible studies. The first and second authors individually performed both stages of the selection process. Afterwards, any discrepancies were resolved upon discussion and reviewed by the third author for the final decision. Finally, a hand search of articles was performed using Google Scholar, with the terms “PD-L1” and “clear cell renal cell carcinoma,” as well as a hand search of references from relevant articles to try to avoid missing any other eligible studies.
Exclusion criteria
The following titles were excluded: non-English articles, non-original articles (i.e., review articles with or without systematic review or meta-analy-sis, editorials, opinions, commentaries, case reports, etc.), abstracts, and repeated publications on the same cohort to avoid publication bias. Articles were exc-luded if >25% of RCC cases were not of clear cell histology, if >50% of cases were not metastatic, or if the article did not discuss the PD-L1 gene/protein. Of note, publications describing long-term follow up from clinical trials whose original published reports were already included in the systematic review were excluded, but the data in these articles were still applied in this systematic review when appropriate.
Data extraction
The following variables were extracted: type of study, number of patients, type of first-line or second-line treatment, frequency of PD-L1 expression, obje-ctive response rate (ORR) to treatment, progression-free survival (PFS), overall survival (OS), association with other putative biomarkers, and expression patterns between primary and metastatic sites.
Data synthesis
The outcome measures in this systematic literat-ure review were not combined because the final artic-les included in this review were very heterogeneous, including diverse patient populations, types of studies, and treatment strategies. Collected data were organized and summarized. Clinical trials were organized by IO-IO (two immunotherapy agents), IO-TKI (immunotherapy agent with a tyrosine kinase inhibitor), and TKI only.
RESULTS
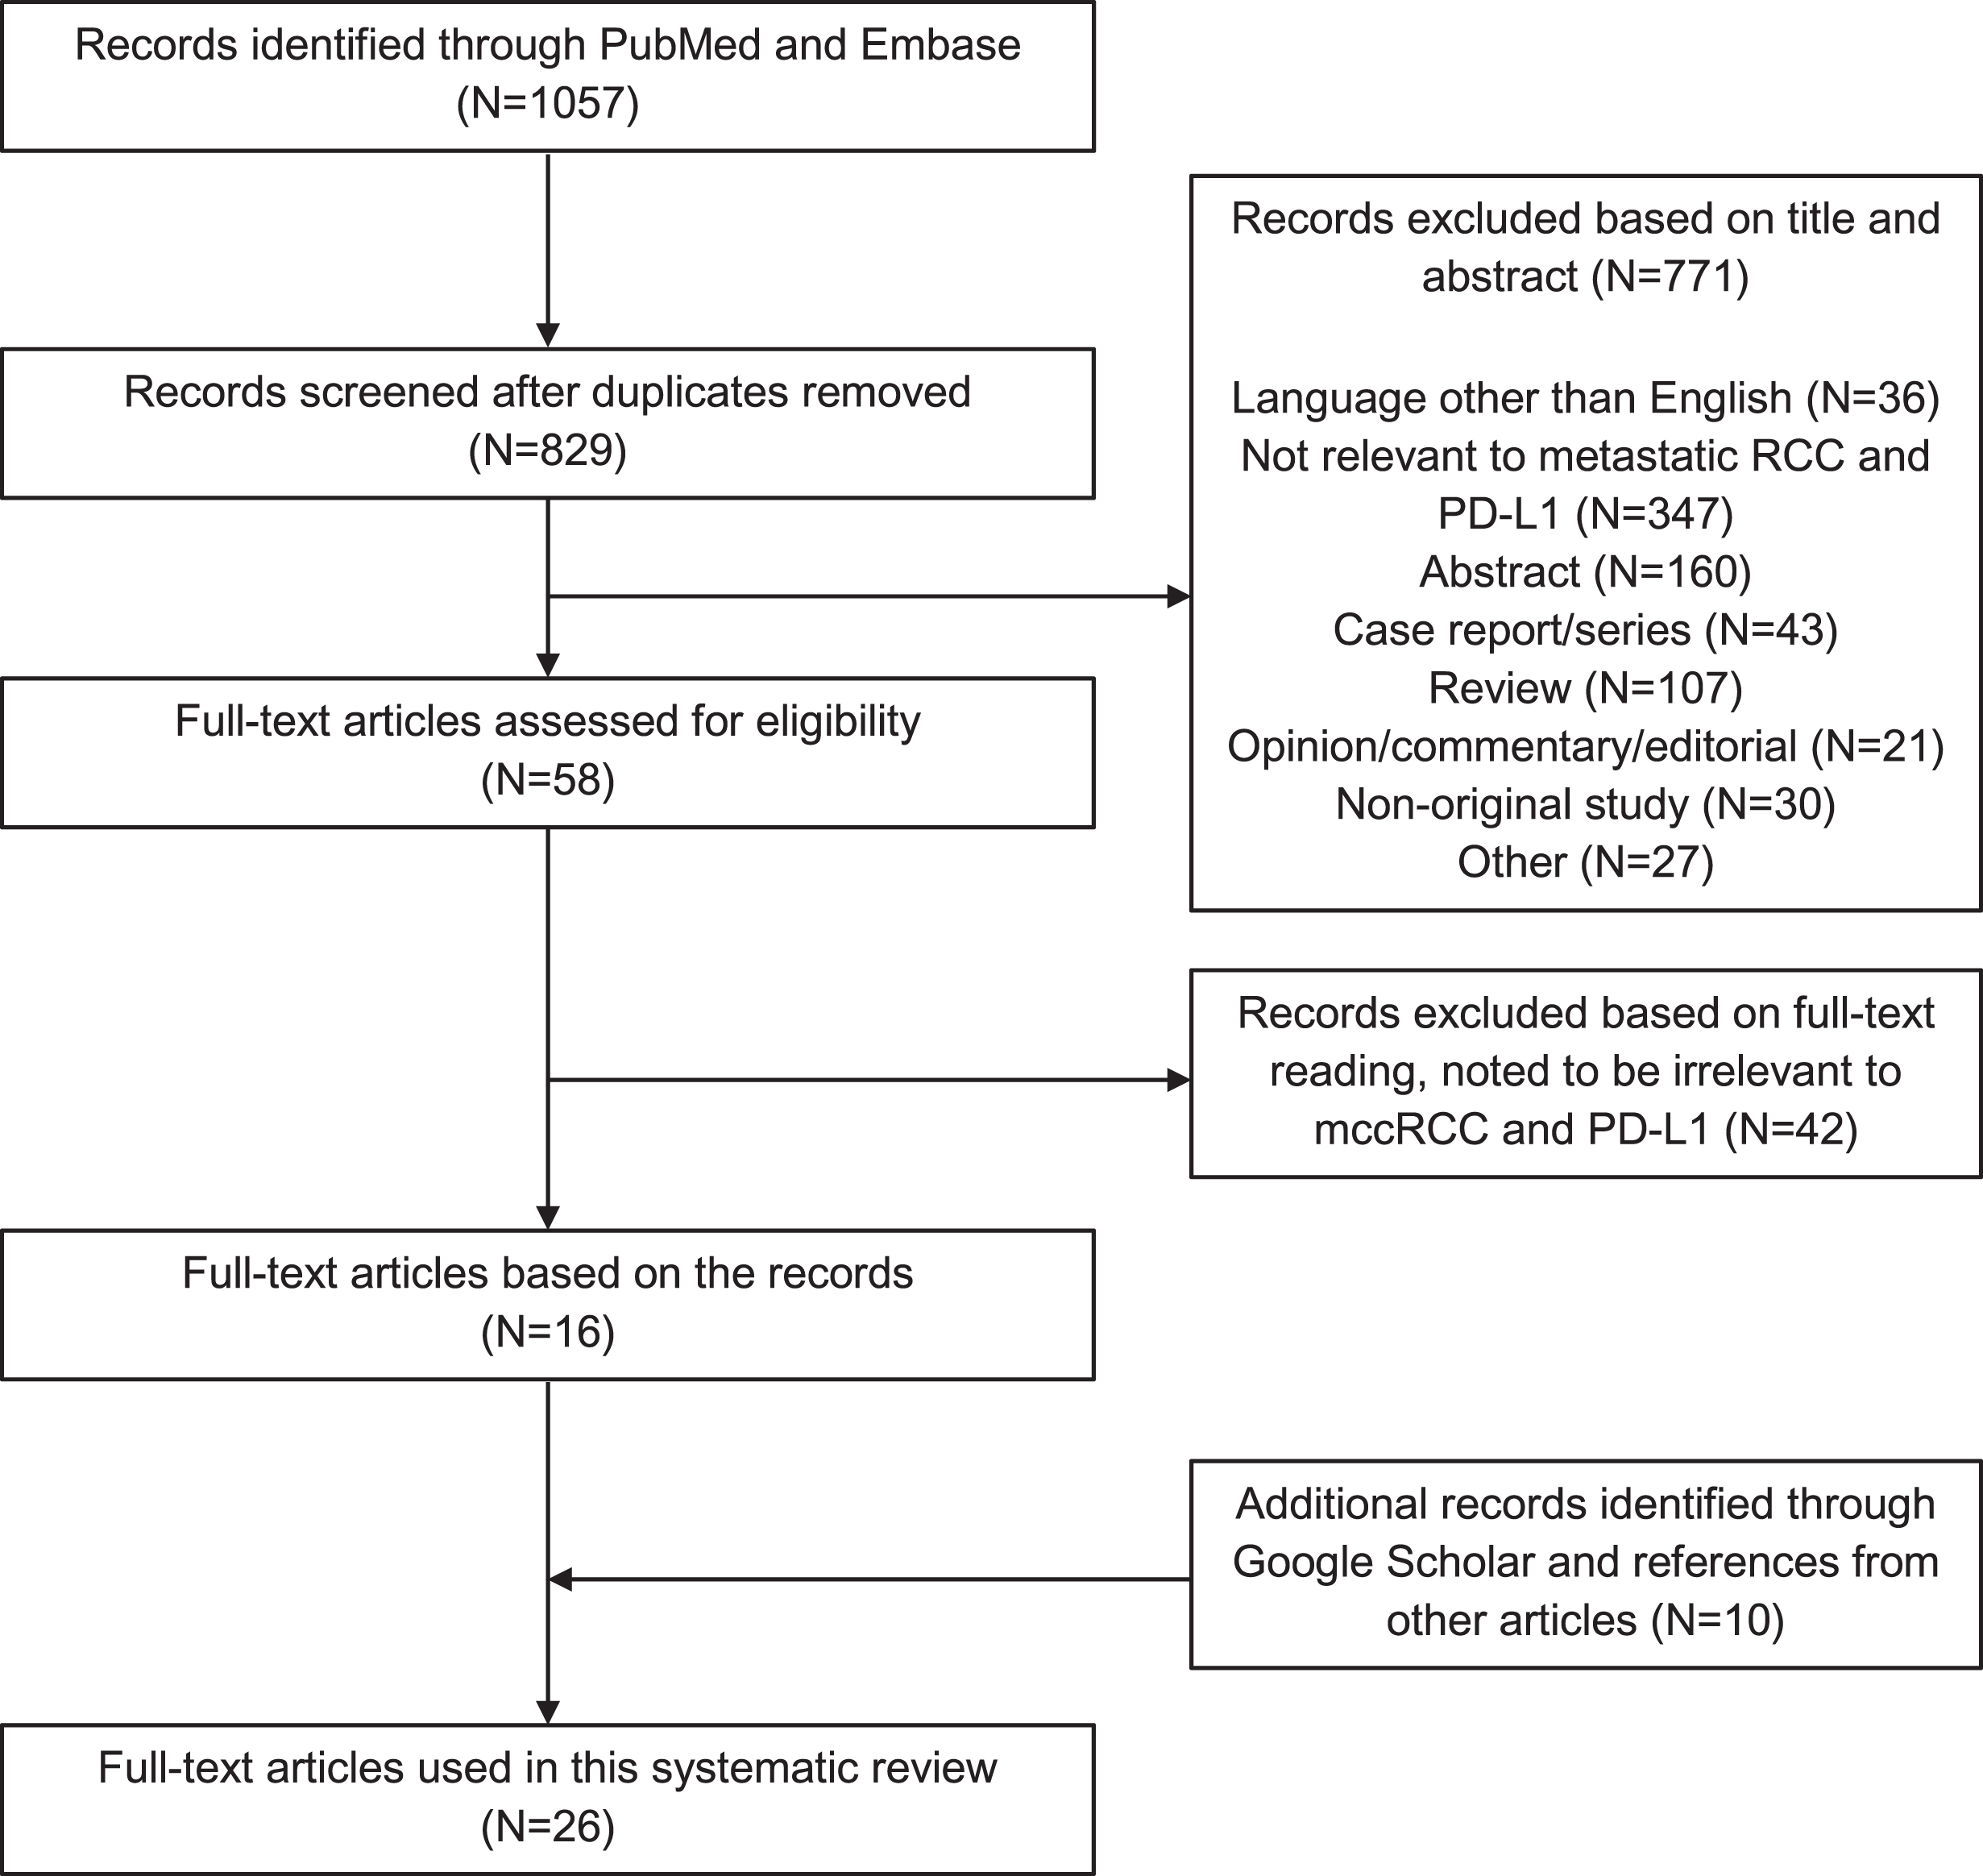
Search results are summarized in Fig. 1. Database search yielded a total of 1057 citations, of which the title and abstract were screened for relevance. From these citations, 58 were subjected to full-text review, resulting in 16 articles that met criteria for inclusion. A manual search using references to articles of interest and Google Scholar resulted in the inclusion of 10 additional articles, for a total of 26 articles.
Fig. 1
PRISMA flow chart.
Treatment lines
PD-L1 was analyzed in the first-line treatment setting in the following studies: atezolizumab with and without bevacizumab [10, 13], axitinib with pembrolizumab [8, 14], axitinib with avelumab [9, 15], pazopanib [16], nivolumab with ipilimumab [7], cabozantinib (CABOSUN trial) [17], and sunitinib or other VEGF-TKI [18–21]. PD-L1 was analyzed in the second-line treatment setting using nivolumab [11, 22, 23], atezolizumab [24], and cabozantinib (METEOR trial) [17].
PD-L1 assays used and frequency of PD-L1 expression
Immunohistochemistry was used to determine the status of PD-L1 expression in patient tumor samples in all the included studies. Various antibodies were used, as well as different scoring systems to account for PD-L1 positivity, including using either tumor cells (TCs), immune cells (ICs), or both, as summarized in Table 1. The frequency of PD-L1 expression varied widely based on the study and how PD-L1 positivity was determined, as above; if multiple cutoffs were noted in the study, the lowest cutoff (generally 1%) was used. For studies of frontline treatment, for the one IO-IO study the frequency of PD-L1 positivity was 24% [7], for the IO-TKI studies the range was 21-79% [8–10, 13–15] and for TKI only studies the range was 19–73% [16, 17, 19, 21]. For second line treatment using IO, the range was 17% to 63% [11, 22–24], and using TKI was 29% [17].
Table 1
Articles used in this systematic review
| Article | Clinical trial | Treatment | Line of treatment | PD-L1 assay | Cutoff used for PD-L1 positivity | Frequency of PD-L1 expression in available patient samples |
| Atkins et al. [14] | Phase 1 | Pembrolizumab plus axitinib | First | PD-L1 mouse monoclonal 22C3 DAKO | ≥1% of tumor cells | 9/42 (21%) |
| Choueiri et al. [15] | Phase 1 | Avelumab plus axitinib | First | Ventana PD-L1 (SP263) assay | ≥1%, 5%, 25%, or 50% positive (combined tumor cells and/or immune cells) | 41/52 (79%) |
| McDermott et al. [24] | Phase 1 | Atezolizumab | Second | PD-L1 monoclonal antibody (Clone SP142, Spring Bioscience, Pleasanton, CA) | ≥1% of immune cells | 39/62 (63%) |
| Choueiri et al. [57] | Phase 1 | Nivolumab | NA | Bristol-Myers Squibb/Dako assay using the 28-8 antibody | ≥5% of tumor cells | 18/56 (32%) |
| McDermott et al. [13] | Phase 2 | Atezolizumab vs. atezolizumab plus bevacizumab vs. sunitinib | First | IHC staining using the SP142,>1% on IC=PD-L1+ | ≥1% of immune cells | 164/305 (54%) |
| Motzer et al. [22] | Phase 2 | Nivolumab | Second | Rabbit antihuman PD-L1 monoclonal antibody (clone 28-8; by Dako Denmark A/S) | ≥1% and 5% of tumor cells | 43/107 (40%) had≥1%; 29/107 (27%) had≥5% |
| Motzer et al. [7] | Phase 3 | Nivolumab plus ipilimumab vs. sunitinib | First | Dako PD-L1 IHC 28-8 PharmDx | ≥1% of tumor cells | 240/1002 (24%) |
| Rini et al. [8] | Phase 3 | Pembrolizumab plus axitinib vs. sunitinib | First | PD-L1 IHC 22C3 PharmDx assay | PD-L1 combined positive score ≥1 (combined tumor cells and/or immune cells) | 497/822 (60%) |
| Motzer et al. [9] | Phase 3 | Avelumab plus axitinib vs. sunitinib | First | Ventana PD-L1 SP263 assay | ≥1% of immune cells staining positive within the tumor area of the tested tissue sample | 560/812 (69%) |
| Rini et al. [10] | Phase 3 | Atezolizumab plus bevacizumab vs. sunitinib | First | Ventana PD-L1 SP142 assay | ≥1% of tumor-infiltrating immune cell | 362/915 (40%) |
| Choueiri et al. [16] | Phase 3 | Pazopanib vs. sunitinib | First | Monoclonal anti-PD-L1 mouse IgG1 antibody (clone 5H1) on the Leica automated IHC platform | Histo scores (HS)>0 of tumor cells | 163/453 (36%) |
| Flaifel et al. [17] | Phase 3 | Cabozantinib vs. everolimus (METEOR) and cabozantinib vs. sunitinib (CABOSUN) | Second (METEOR) and first (CABOSUN) | PD-L1 (405. 9A11 mouse monoclonal antibody, 1 : 100, 13 mg/mL, Cell Signaling Technology) | ≥1% of tumor cells;≥1% and 5% of immune cells and combined scores | 88/306 (29%) in METEOR, 25/110 (23%) in CABOSUN based on 1% tumor cell cutoff |
| Motzer et al. [11] | Phase 3 | Nivolumab vs. everolimus | Second | Dako PD-L1 IHC | ≥1% and 5% of tumor cells | 181/756 (24%) |
| McFarlane et al. [23] | Phase 3b/4 | Nivolumab 28-8 PharmDx | Second | Dako PD-L1 IHC | ≥1% of tumor cells | 14/82 (17%) |
| Liu et al. [20] | NA | Sunitinib | First | NA | NA | NA |
| Hara et al. [19] | NA | Sunitinib or sorafenib | First | Antihuman PD-L1 monoclonal antibody (R&D systems, Minneapolis, MN) | >5% in tumor cells | 12/62 (19%) |
| Kammerer-Jacquet et al. [21] | NA | Sunitinib | First | PD-L1 (anti-PD-L1 antibody, clone 130021, dilution 1/200, RD System, Minneapolis, MN) | Moderate/strong expression | 66/90 (73%) |
| Ascierto et al. [36] | NA | Nivolumab PD-L1 mAb 5H1 | NA | Murine anti-human | ≥5% of tumor cells | 13/13 (100%) |
| Ueda et al. [30] | NA | Unspecified molecular targeted therapies | NA | PD-L1(x500, clone EPR1161(2), abcam, Cambridge, MA, USA) | ≥5% of tumor cells | 9/33 (27%) |
| Shin et al. [18] | NA | VEGF-TKI anti-PD-L1 (1:100; E1L3 N; rabbit monoclonal; Cell Signaling Technology, Danvers, MA) | NA | Ventana Benchmark XT | ≥5% of tumor cells | 16/91 (18%) |
| Mischinger et al. [35] | NA | Interferon therapy | First | Anti-B7-H1 rabbit antibody (Novus Biologicals, NBP1-03220; 1:200) | NA | 20% median expression for 44 patient samples |
| Jilaveanu et al. [37] | NA | NA | NA | Mouse monoclonal anti-PD-L1 antibody (5H1 clone); measured fluorescence with Automated Quantitative Analysis (tumor cells) | NA | NA |
| Callea et al. [31] | NA | NA | NA | Anti-PD-L1 mouse monoclonal antibody (405.9A11) | >0% of tumor cells | 17/53 (32%) in primary tumors, 12/53 (23%) in metastatic tumors |
| Lalani et al. [34] | NA | NA | NA | Anti-PD-L1 mouse monoclonal antibody (405.9A11) | >0% of tumor cells | 13/45 (29%) |
| Zhang et al. [33] | NA | NA | NA | Anti-PD-L1 monoclonal antibody (Zhongshan Golden Bridge, clone number: ZM-0170) | >5% of tumor cells and “moderate” or “strong” expression | 53/163 (33%) |
| Eckel-Passow et al. [32] | NA | NA | NA | Mouse anti-human PD-L1 | >0% positive (either immune cells or tumor cells) | 25% of 97 primary tumors; 18/140 (13%) metastatic tumors |
Predictive value of PD-L1
Available median PFS, median OS, and ORR for PD-L1+, PD-L1-, and intention to treat (ITT) groups from the clinical trials containing ICIs are summarized and reported in Table 2. Outcomes for single agent TKIs and smaller clinical trials are summarized and reported in Table 3.
Table 2
Outcomes for trials comparing ICI (immune checkpoint inhibitor) or ICI+TKI (tyrosine kinase inhibitor) therapy to traditional TKI therapy
| Clinical Trial | Treatment + Arms | mPFS PD-L1+ | mPFS ITT | mPFS PD-L1- | ORR PD-L1+ | ORR ITT | ORR PD-L1- | mOS PD-L1+ | mOS ITT | mOS PD-L1- |
| CheckMate 214 (IMDC high/intermediate) [7, 25, 26] | Nivolumab plus ipilimumab vs. sunitinib | 22.8 vs. 5.9 months, HR 0.46* | 11.2 vs. 8.3 months, HR 0.74 | 11.0 vs. 10.4 months, HR 1.00 | 58 vs. 22%, p<0.001* | 42 vs. 27%, p<0.001* | 37 vs. 28%, p = 0.025 | NR vs. 19.6 months (14.8-NE), HR 0.45* | 48.1 vs. 26.6 months, HR 0.65* | NR (28.2-NE) vs. NR (24.0-NE), HR 0.73* |
| IMmotion 150 [13] | Atezolizumab plus bevacizumab vs. sunitinib | 14.7 vs. 7.8 months, HR 0.64 | 11.7 vs. 8.4 months, HR 1.00 | – | – | – | – | – | – | – |
| IMmotion 151 [10] | Atezolizumab plus bevacizumab vs. sunitinib | 11.2 vs. 7.7 months, HR 0.74* | 11.2 vs. 8.4 months, HR 0.83* | 11.2 vs. 9.5 months, HR 0.89 | 43 vs. 35%, p=0.122 | 37 vs. 33%, p=0.295 | 33 vs. 32%, p=0.928 | 34.0 vs. 32.7 months, HR 0.84 | 33.6 vs. 34.9 months, HR 0.93 | – |
| JAVELIN Renal 101 [9, 27] | Avelumab plus axitinib vs. sunitinib | 13.8 vs. 7.0 months, HR 0.62* | 13.3 vs. 8.0 months, HR 0.69* | HR 0.84 (mPFS values not listed) | 55.9 vs. 27.2%, OR 3.39* | 52.5 vs. 27.3%, OR 3.00* | 49.2 vs. 29.2%, OR 2.36* | NE (NE-NE) vs. 28.6 (27.4-NE) months, HR 0.83 | NE (30.0-NE) vs. NE (27.4-NE) months, HR 0.80 | HR 0.73 (mOS values not listed) |
| KEYNOTE-426 [8, 28] | Pembrolizumab plus axitinib vs. sunitinib | PFS values not listed, HR 0.66* | 15.4 vs. 11.1 months, HR 0.71* | PFS values not listed, HR 0.86 | 62 vs. 40%, p<0.001 | 60 vs. 40%, p<0.001* | 58 vs. 42.3% † | OS values not listed, HR 0.68* | NR vs. 35.7 months, HR 0.68* | OS values not listed, HR 0.77 |
| CheckMate 025 [11, 29] | Nivolumab vs. everolimus (second-line therapy) | – | 4.2 vs. 4.5 months, HR 0.84* | – | – | 22.9 vs. 4.1%, OR 6.86* | – | 21.8 vs. 18.8 months, HR 0.79 | 25.8 vs. 19.7 months, HR 0.73* | 27.4 vs. 21.2 months, HR 0.77* |
mPFS –median progression free survival; ITT –intention to treat; ORR –objective response rate; mOS –median overall survival; NR –not reached; NE –not estimable. *Denotes statistical significance. †Denotes no significance data reported from sourced article.
Table 3
Outcomes for trials comparing PD-L1+ with PD-L1- disease with single therapy
| Article | Treatment | mPFS (PD-L1+ vs. PD-L1-) | OS (PD-L1+ vs. PD-L1-) | ORR (PD-L1+ vs. PD-L1-) |
| Choueiri et al. (COMPARZ) [16] | Sunitinib or pazopanib | Sunitinib –4.0 vs. 8.4 months; Pazopanib –3.1 vs. 10.2 months, overall p=0.017* | Sunitinib –15.3 vs. 27.8 months; Pazopanib –15.1 vs. 35.6 months; overall p=0.03* | – |
| Flaifel et al. (CABOSUN) [17] | Sunitinib or cabozantinib | 5.5 vs. 8.3 months, p=0.051 on univariate analysis; p=0.419 after adjustment | 20.8 vs. 28.1 months, p=0.047 on univariate analysis; p=0.209 after adjustment | – |
| Shin et al. [18] | Unspecified VEGF-TKI | p=0.013* (significantly worse for PD-L1+, values not reported) | p=0.038* (significantly worse for PD-L1+, values not reported) | 12.5% vs. 46.7%, p=0.012* |
| Hara et al. [19] | Sunitinib or sorafenib | p<0.001* (significantly worse for PD-L1+, values not reported) | p=0.0012* (significantly worse for PD-L1+, values not reported) | – |
| Ueda et al. [30] | Unspecified molecular targeted therapies | 6.6 vs. 7.8 months, p=0.5919 | 20.1 vs. 27.7 months, p=0.1542 | – |
| Flaifel et al. (METEOR) [17] | Cabozantinib or everolimus (second-line therapy, VEGF-TKI refractory patients) | 5.3 vs. 7.2 months, p=0.027 on univariate analysis; p=0.301 after adjustment | 15.1 vs. 21.3 months, p=0.003 on univariate analysis; p=0.078 after adjustment | – |
| Motzer et al. [22] | Second-line nivolumab | 4.9 vs. 2.9 months† | NR (95% CI 13.4 months-NR) vs. 18.2 months (95% CI 12.7–26.0)† | 31 vs. 18% † |
| McFarlane et al. [23] | Second-line nivolumab | – | NR (95% CI 5.7-NE) vs. NR (95% CI 15.7-NE) | – |
| McDermott et al. [24] | Second-line atezolizumab | 5.6 vs. 4.5 months† | 1-year survival: 81% vs. 80% 2-year survival: 65% vs. 51% † | 18 vs. 9% † |
*Denotes statistical significance. †Denotes no significance data reported from sourced article.
Frontline IO-IO
CheckMate 214 followed mccRCC patients treated with either the combination of nivolumab plus ipilimumab or sunitinib [7]. In the extended four-year follow-up, for the ITT group encompassing all IMDC risk categories, there was no significant difference in median PFS (12.2 vs. 12.3 months, HR 0.89; 95% CI 0.76–1.05) between treatment arms [25]. However, patients did have significantly better ORR (39 vs. 32%, p=0.0134) and OS (NR vs. 38.4 months, HR 0.69; 95% CI 0.59–0.81) when treated with nivolumab plus ipilimumab compared with sunitinib. Patients with IMDC intermediate/poor-risk disease had significantly better median PFS (11.2 vs. 8.3 months, HR 0.74; 95% CI 0.62–0.88), ORR (42 vs. 27%, p<0.001), and median OS (48.1 vs. 26.6 months, HR 0.65; 95% CI 0.54–0.78) when treated with nivolumab plus ipilimumab compared with sunitinib. In the original analysis, the effect of PD-L1 expression on differential response to these therapies among the IMDC intermediate/poor-risk group was reported. PD-L1+ patients had significantly better median PFS (22.8 vs. 5.9 months, HR 0.46; 95% CI 0.31–0.67) and ORR (58 vs. 22%, p<0.001) when treated with nivolumab plus ipilimumab compared with sunitinib [7]. For PD-L1- patients, there was no significant difference in median PFS (11.0 vs. 10.4 months, HR 1.00; 95% CI 0.80–1.26) or ORR (37 vs. 28%, p=0.025) between treatment arms, as the authors had a pre-specified threshold for significance of alpha level 0.001. Regarding OS in the PD-L1+ cohort, the rate of death over a median follow-up of 25.2 months in patients receiving nivolumab and ipilimumab was 28/100 (28%) as compared to 57/114 (50%) in patients receiving sunitinib (HR 0.45; 95% CI 0.29–0.71). In the PD-L1- cohort, the deaths were 93/284 (33%) versus 114/278 (41%) (HR 0.73; 95% CI 0.56–0.96), respectively. Importantly, in the post-hoc multivariable model on extended follow-up of at least 30 months, baseline tumor PD-L1 expression≥1% was associated with inferior OS for patients treated with sunitinib but not for patients treated with nivolumab with ipilimumab [26].
Frontline IO-TKI
Several studies have evaluated PD-L1 as a predi-ctive marker for differential response to frontline the-rapy with ICIs plus TKIs versus sunitinib in patients with previously untreated mccRCC. In IMmotion150, though not statistically significant, median PFS was longer for PD-L1+ patients treated with the com-bination of atezolizumab plus bevacizumab compa-red with sunitinib (14.7 vs. 7.8 months, HR 0.64; 95% CI 0.38–1.08, p=0.095) [13]. No difference in median PFS was observed between treatment arms for the overall ITT group (11.7 vs. 8.4 months; HR 1.00; 95% CI 0.69–1.45, p=0.982). No subgroup analysis of PD-L1- patients was performed.
Expanding upon these results, IMmotion151 in-cluded a much larger sample and found that PD-L1+ patients had significantly improved median PFS when treated with atezolizumab plus bevacizumab compared with sunitinib (11.2 vs. 7.7 months, HR 0.74; 95% CI 0.57–0.96, p=0.0217) [10]. This association persisted for the overall ITT group (11.2 vs. 8.4 months, HR 0.83; 95% CI 0.70–0.97, p=0.0219). There was no significant difference in median PFS between treatment arms for PD-L1- patients (11.2 vs. 9.5 months, HR 0.89; 95% CI 0.72–1.10). PD-L1+ patients also had better, though not statistically significant, ORR when treated with atezolizumab plus bevacizumab compared with sunitinib (43 vs. 35%, p=0.122). There was likewise no difference in ORR for the ITT group (37 vs. 33%, p=0.295) or for PD-L1- patients (33 vs. 32%, p=0.928). There was no significant difference in median OS for PD-L1+ patients receiving atezolizumab plus bevacizumab compared to sunitinib (34.0 vs. 32.7 months, HR 0.84; 95% CI 0.62–1.15). There was also no significant difference in median OS between treatment arms in the ITT group (33.6 vs. 34.9 months, HR 0.93; 95% CI 0.76–1.14). There were no OS data reported for the PD-L1- population.
In JAVELIN Renal 101, median PFS was signifi-cantly longer for PD-L1+ patients treated with avel-umab plus axitinib compared with sunitinib (13.8 vs. 7.0 months, HR 0.62; 95% CI 0.49–0.78, p<0.001) [9, 27]. This association persisted for the ITT group (13.3 vs. 8.0 months, HR 0.69; 95% CI 0.57–0.83, p<0.001). There was no significant difference in median PFS between treatment arms for PD-L1- patients (HR 0.84, 95% CI 0.60–1.17). PD-L1+ pat-ients also had significantly better ORR when treated with the combination of avelumab plus axitinib compared with sunitinib (55.9 vs. 27.2%, OR 3.39; 95% CI 2.35–4.90, p<0.001). This association persisted for the ITT group (52.5 vs. 27.3%, OR 3.00; 95% CI 2.23–4.00, p<0.001). Patients with PD-L1- disease also had significantly better ORR when treated with avelumab plus axitinib compared with sunitinib (49.2 vs. 29.2%, OR 2.36; 95% CI 1.36–4.11). Regarding OS, there was no significant difference between treatment arms for PD-L1+ (HR 0.83; 95% CI 0.60–1.15), ITT (HR 0.80; 95% CI 0.62–1.03), or PD-L1- (HR 0.73; 95% CI 0.45–1.17) disease.
In KEYNOTE-426, median PFS was significantly longer for PD-L1+ patients treated with pembro-lizumab plus axitinib compared with sunitinib (PFS values not listed, HR 0.66; 95% CI 0.52–0.82, p<0.001) [8]. This association persisted for the ITT group (15.4 vs. 11.1 months, HR 0.71; 95% CI 0.60–0.84, p<0.001). There was no significant difference in median PFS between treatment arms for PD-L1- patients (PFS values not listed, HR 0.86; 95% CI 0.64–1.15). PD-L1+ patients also had significantly better ORR when treated with pembrolizumab plus axitinib compared with sunitinib (62 vs. 40%, p<0.001). This association persisted for the ITT group (60 vs. 40%, p<0.001). Patients with PD-L1- disease also had better ORR (58 vs. 42.3%) with pem-brolizumab plus axitinib, although no statistical comparison was performed. Regarding OS, there was a benefit with pembrolizumab plus axitinib for both PD-L1+ (OS values not listed, HR 0.68; 95% CI 0.51–0.90) and the ITT group (NR vs. 35.7 months, HR 0.68; 95% CI 0.55–0.85, p=0.0003). However, there was no significant difference between treatment arms for PD-L1- patients on extended follow-up of median 30.6 months (OS values not listed, HR 0.77; 95% CI 0.52–1.16) [28].
Frontline TKI
In the COMPARZ trial comparing frontline sunitinib and pazopanib, patients with PD-L1 HS>55 had significantly decreased median PFS compared to patients with PD-L1 HS≤55 regardless of treatment with pazopanib (3.1 vs. 10.2 months) or sunitinib (4.0 vs. 8.4 months) (p=0.017) [16]. Additionally, PD-L1 patients with HS>55 had significantly decreased OS compared to HS≤55 regardless of receiving pazopanib (15.1 vs. 35.6 months) or sunitinib (15.3 vs. 27.8 months) (p=0.03); higher HS scores were correlated with decreased OS.
In the CABOSUN clinical trial, median PFS was significantly shorter for PD-L1+ patients than for PD-L1- patients on univariate analysis (5.5 vs. 8.3 months, p=0.051) [17]. However, this association did not persist with multivariable analysis. Median OS in CABOSUN for PD-L1+ versus PD-L1- patients was 20.8 versus 28.1 months (p=0.05), respectively. A comparison of clinical outcomes in patients with mccRCC treated with VEGF-targeted therapy also suggested that PD-L1+ patients had significantly inferior PFS compared to PD-L1- patients (p=0.013) [18]. In the same study, PD-L1+ patients had an ORR of 12.5% to VEGF-TKI therapy while PD-L1- patients had an ORR of 46.7% (p=0.012), and increased PD-L1 expression correlated negatively with ORR. OS for patients receiving VEGF-TKI was also impacted by PD-L1 status, as 16 PD-L1+ patients had decreased OS compared to 75 PD-L1- patients based on the Kaplan-Meier curve (p=0.04).
Hara et al. [19] showed PD-L1- patients receiving frontline TKI therapy had significantly longer median PFS compared to PD-L1+ patients (HR 7.80, p<0.001). OS was also significantly worse in PD-L1+ patients based on the Kaplan-Meier curve (p<0.002). In a study of 33 patients who received unspecified molecular targeted therapies, Ueda et al. [23] found no significant difference in median PFS between PD-L1+ and PD-L1- patients, although the sample size was very small (6.6 vs. 7.8 months, p=0.5919). PD-L1 trended toward worse OS but was not statistically significant (20.1 vs. 27.7 months, p=0.15). Finally, Kammerer-Jacquet et al. [21] examined the association between PD-L1 positivity and long-term response (LTR) to sunitinib and found that PD-L1 positivity was significantly associated with non-LTR (p=0.02); 16 of 28 patients with LTR were positive for PD-L1, while 50 of 62 patients without LTR were positive for PD-L1. No comparisons between PFS, ORR, or OS in PD-L1+ versus PD-L1- patients were performed.
Second-line
Fewer studies examined the predictive value of PD-L1 in response to second-line therapy. In the METEOR clinical trial comparing cabozantinib to evero-limus in VEGF-refractory patients, PD-L1+ pati-ents also had significantly shorter PFS relative to PD-L1- patients on univariate analysis (5.3 vs. 7.2 months, p=0.027), but like CABOSUN, this association did not persist with multivariate analysis [17]. For PD-L1+ versus PD-L1- patients in METEOR, median OS was 15.1 versus 21.3 months (p=0.003). Notably, with METEOR and CABOSUN trials pooled together (416 patients total, and 211 received cabozantinib), for PD-L1+ versus PD-L1-, overall survival adjusted HR was 1.39 (95% CI 1.03–1.87, p=0.03), and for cabozantinib-only patients, it was 1.63 (95% CI 1.03–2.60, p=0.04) [17].
A dose-finding trial for nivolumab in mccRCC examined response to second-line ICI and found that PD-L1+ patients had better PFS compared to PD-L1- patients (4.9 vs. 2.9 months). PD-L1+ patients also had better ORR compared to PD-L1- patients (31 vs. 18%) [22]. OS for PD-L1+ patients (>5% expression) was NR (95% CI, 13.4 months-NR) while median OS for PD-L1- patients <5% PD-L1 group was 18.2 months (95% CI, 12.7–26.0). No statistical significance determinations were presented in this article. McDermott et al. [24] followed patients treated with second-line atezolizumab and found that PD-L1+ patients had a median PFS of 5.6 versus 4.5 months compared to PD-L1- patients. PD-L1+ patients also had better ORR compared to PD-L1- patients (18 vs. 9%). OS was 81% after one year for PD-L1+ patients versus 80% for PD-L1- patients, and 65% after two years for PD-L1+ patients versus 51% for PD-L1- patients. No statistical significance determinations were presented in this article.
In CheckMate 025, a phase 3 trial comparing nivo-lumab to everolimus in treatment-refractory mccRCC patients, the ITT group had significantly better PFS probabilities with nivolumab compared to everolimus after an extended follow-up of minimum 64 months, although median PFS between the two groups were similar (4.2 vs. 4.5 months, HR 0.84; 95% CI 0.72–0.99, p=0.0331) [29]. No analysis of PFS by PD-L1 expression was performed. The ITT group had significantly better ORR with nivolumab compared to everolimus (22.9 vs. 4.1%, OR 6.86; 95% CI 4.01–11.74, p<0.001). No analysis of ORR by PD-L1 expression was performed. The ITT group also had significantly better median OS with nivolumab (25.8 vs. 19.7 months, HR 0.73; 95% CI 0.62–0.85, p<0.001). In the initial analysis published in 2015, there was no significant difference in median OS between treatment arms for PD-L1+ patients (21.8 vs. 18.8 months, HR 0.79; 95% CI 0.53–1.17); however, PD-L1- patients had significantly better median OS with nivolumab compared to eve-rolimus (27.4 vs. 21.2 months, HR 0.77; 95% CI 0.60–0.97) [11]. No data was published comparing median OS between treatment arms by PD-L1 expression in the most recent updated results, although it was noted that tumor PD-L1 expression was not an independent prognostic factor for OS on univariate analysis with either nivolumab (p=0.8554) or eve-rolimus (p=0.266) separately [29].
A phase 3b/4 study, CheckMate 374, validated the safety and efficacy of nivolumab in patients with pre-viously treated, advanced/metastatic RCC [23]. Nin-ety-seven of 150 patients had clear cell pathology, and these patients were analyzed independently. There was a confirmed 22.7% ORR (95% CI 14.8–32.3%) and median PFS of 3.6 months (95% CI 2.0–5.5 months). No direct comparisons were made between the 68 PD-L1+ versus 14 PD-L1- patients besides median OS, which were not reached for either group.
Prognostic value of PD-L1 and association with adverse pathologic features
PD-L1 expression is associated with several agg-ressive clinicopathological features in mccRCC. Ueda et al. [30] noted that PD-L1 positivity was significantly associated with increased primary tumor size (p=0.0055), sarcomatoid features (p=0.0065), and higher Fuhrman Nuclear Grade (p=0.0105). Shin et al. [18] noted that PD-L1 positivity was significantly associated with sarcomatoid features (p=0.014) and International Society of Urological Pathology (ISUP) grade 3 or 4 (p=0.031). Callea et al. [31] determined that TC PD-L1 positivity was significantly associated with advanced T stage (p=0.03) and higher Fuhrman Nuclear Grade (p<0.01). Hara et al. [19] demonstrated that TC PD-L1 positivity was significantly associated with multiple metastases (p=0.022), but there was no association with Memorial Sloan-Kettering Cancer Center (MSKCC) or IMDC risk classification (p=0.51 and p=0.79, respectively), or with sarcomatoid features (p=0.18).
Flaifel et al. [17] found that PD-L1 positivity was significantly associated with elevated IMDC risk in both the METEOR and CABOSUN trials. In METEOR, patients in the IMDC poor risk group were more likely to express PD-L1 on TC and IC than patients in the IMDC favorable or intermediate risk groups (p=0.013 for TC and p=0.019 for IC). In CABOSUN, patients in the IMDC poor risk group were more likely to express PD-L1 on TC than patients in the IMDC intermediate risk group (p=0.009), and there was a trend towards increased PD-L1 expression on IC for patients in the IMDC poor risk group (p=0.092). Likewise, in CheckMate 214, patients with IMDC intermediate or poor risk were significantly more likely to express PD-L1 on TC than patients with IMDC favorable risk (p<0.001) [7].
In studies that compared primary and metastatic ccRCC, Eckow-Passow et al. [32] did not observe a statistically significant association between metas-tatic tumor expression of PD-L1 and ccRCC-speci-fic survival (HR 1.37; 95% CI 0.75–2.53, p=0.31); no similar comparison for PD-L1 expression on pri-mary tumor and ccRCC-specific survival was rep-orted. Similarly, Zhang et al. [33] did not observe a significant association between OS and PD-L1 exp-ression in tumor metastases, but there was a significantly shorter OS associated with increased PD-L1 expression in the primary tumor (HR 2.55; 95% CI 1.06–6.15, p=0.04).
Several studies additionally explored the association between PD-L1 expression and the extent and site of metastases. Hara et al. [19] found PD-L1 positivity was significantly associated with increased brain and lymph node metastases (p=0.030 and p=0.016, respectively). Zhang et al. [33] determined PD-L1 positivity was significantly associated with increased bone and lymph node metastases (p=0.002 and p=0.02, respectively). On the other hand, Eck-ow-Passow et al. [32] found no correlation between PD-L1 expression and site of metastasis.
PD-L1 association with other putative biomarkers
PD-L1 expression is associated with expression of several other biomarkers in mccRCC. Eckow-Passow et al. [32] found that all PD-L1+ primary tumors (n=22) in their analysis also expressed PD-1, and the overall association between PD-1 and PD-L1 in primary tumors was significant (p=0.042). Similarly, 18 of 19 PD-L1+ metastatic tumors also expressed PD-1, and the overall association between PD-1 and PD-L1 in metastatic tumors was significant (p<0.0001). Ueda et al. [30] determined significant positive associations between PD-L1 positivity and CD4+ tumor infiltrating lymphocytes (TILs) (p<0.0001), CD8+ TILs (p=0.0328), and FOXP3+ TILs (p=0.0033), but no association with CD20+ TILs (p=0.5628). Notably, Choueiri et al. [16] found that patients who were both PD-L1+ and had high intra-tumor CD8+ cell counts had the worst OS with eit-her pazopanib or sunitinib compared to any other combination of PD-L1 and CD8 status. Additionally, Flaifel et al. [17] found that PD-L1 expression was greater in MET-positive tumors compared to MET-negative tumors (p=0.0003). Patients expressing either MET, PD-L1, or both had significantly shorter OS after multivariable analysis (HR 1.35; 95% CI 1.02–1.80, p=0.039) but only a trend towards decreased PFS (adjusted HR 1.27; 95% CI 0.97–1.65, p=0.078) when compared to patients with no expression of either protein. Lalani et al. [34] suggested that MET expression was greater in PD-L1+ tumors compared to PD-L1- tumors for both primary and metastatic sites (p=0.34 and p=0.45, respectively), although these differences were not statistically significant. Mischinger et al. [35] found a significant correlation with increased PD-L1 expression with metastasectomy (p=0.02) but did not find its expression level correlating with survival of 44 mccRCC patients during long term follow-up. Liu et al. [20] studied outcomes in mccRCC patients with various genetic polymorphisms in PD-L1 and failed to identify a variant allele significantly associated with PFS or OS; however, a variant in CTLA-4, CTLA-4 rs231775, showed a significant association with OS (HR 0.83; 95% CI 0.72–0.95, p=0.008). Ascierto et al. [36] reported that PD-L1+ tumors expressing genes involved in metabolic and solute transport fun-ctions, such as UGT1A family members, were more likely to fail treatment with ICIs (p=0.007), while tumors overexpressing immune markers such as BACH2 (p=0.027) and CCL3 (p=0.038) were more likely to have responses to ICI treatments.
PD-L1 expression patterns between primary and metastatic sites
Multiple studies have correlated primary tumor PD-L1 expression with expression in metastatic sites. Eckow-Passow et al. [32] determined 78% concordance of PD-L1 expression between patient-matched primary and metastatic tumors (Kappa=0.27; 95% CI 0.09–0.46). Greater expression was demonstrated in the primary tumors, and most of the discordance was related to PD-L1+ primary tumors with corresponding PD-L1- metastases. Callea et al. [31] found 79% concordance of PD-L1 expression between patient-matched primary and metastatic tumors when PD-L1 positivity was defined as>0% (Kappa=0.48; 95% CI 0.23–0.74). Concordance was 89% when PD-L1 positivity was defined as≥5%. Again, primary tumors had greater PD-L1 expression than their corresponding metastases, and most of the discordance was related to PD-L1+ primary tumors with corresponding PD-L1- metastases. Jilaveanu et al. [37], using Automated Quantitative Analysis (AQUA) scores to quantify PD-L1 expression, calculated only a weak correlation (R=0.24) between PD-L1 expression in matched primary and metastatic specimens. However, in this study, PD-L1 expression was greater in metastatic tumors than the corresponding primary tumor, and discordance was largely due to PD-L1- primary tumors giving rise to PD-L1+ metastases. Finally, Zhang et al. [33], in agreement with Jilaveanu et al., determined 67% concordance between patient-matched primary and metastatic tumors with greater PD-L1 expression in metastatic tumors than the corresponding primary tumor (χ2=4.66, p=0.03).
Intra-tumor heterogeneity of PD-L1 expression was evaluated in several studies. Jilaveanu et al. [37] calculated composite median absolute deviation (MAD) scores for individual tumors by utilizing tissue microarray (TMA) cores as surrogates for core biopsy specimens. MAD scores varied widely, with some tumors showing almost no heterogeneity to others with a high degree of heterogeneity. Overall, there was no difference in heterogeneity between primary and metastatic tumors (p=0.48). Callea et al. [31] found that both primary and metastatic tumors had high degrees of heterogeneity for PD-L1 positivity. Additionally, PD-L1 expression was found to be significantly positively associated with areas of Fuhrman nuclear grade 3 or 4 versus areas of grade 1 or 2 (p<0.001). Primary tumors were more likely than metastatic tumors to have both areas of low nuclear grade and high nuclear grade; therefore, PD-L1 heterogeneity was greater in primary tumors than metastatic tumors.
There is limited data for inter-tumor heterogeneity of PD-L1 expression for patients with multiple metastatic sites. Eckow-Passow et al. [32] found that seven of 36 patients with multiple metastatic sites had discordant PD-L1 expression between tumors. Callea et al. [31] found that only one of 14 patients with multiple metastatic sites had discordant PD-L1 expression between metastases.
DISCUSSION
In this systematic review, we summarize the studies reporting on PD-L1 expression in mccRCC, its utility as a prognostic and predictive marker with various treatments including ICIs and its associa-tion with pathologic features and other putative biomarkers. In all trials included in this review, PD-L1+ patients treated with ICIs or ICI combinations with TKIs had significantly improved ORR and PFS compared to those treated with sunitinib (Table 2). However, among patients known to be PD-L1-, there was no significant difference in PFS between treatment arms in any study, but there remained a positive correlation between ICI therapy and improved PFS (Table 2). This suggests that all patients may potentially benefit from ICIs, but PD-L1+ patients may derive the greatest benefit, particularly in terms of PFS. Differences in ORR for PD-L1- patients were more variable. JAVELIN Renal 101 [9] reported significantly improved ORR with ICI plus TKI versus sunitinib in patients with PD-L1- disease, while CheckMate 214 [7] reported a statistically nonsignificant improvement in ORR with ICIs versus sunitinib. In contrast, IMmotion 151 found no significant difference in ORR between treatment arms in this subgroup [10]. Notably, we also report several studies which evaluated predictive value of PD-L1 expression for treatment with frontline VEGF-TKI. For all trials included in this analysis, PD-L1 positivity was a reliable predictor of worse PFS and/or ORR when treated with traditional VEGF-TKI therapy.
The prognostic value of PD-L1 is more difficult to assess based on results from these clinical trials as the reported survival outcomes were treatment-specific and did not strictly compare outcomes in PD-L1+ and PD-L1- patients. The included phase 2 and phase 3 trials showed that mccRCC patients had improved OS when receiving immunotherapy combinations versus sunitinib, but this benefit was generally maintained in both PD-L1+ and PD-L1- patients. In studies of VEGF-TKIs, PD-L1 positivity was a reliable poor predictor of outcomes, with OS consistently being shorter for PD-L1+ patients compared to PD-L1- patients. Thus, there is some evidence suggesting that PD-L1 expression may be a poor prognostic marker in ccRCC tumors treated with non-ICI therapies since intact PD-L1 expression allows them to escape immune surveillance [38]. Therefore, the currently available data does not allow us to reliably select mccRCC patients for immunotherapy treatment based on solely their PD-L1 status, or to withhold this treatment from patients whose tumors do not express PD-L1.
In a recent meta-analysis of five phase 3 trials and one phase 2 trial, which are all included in this systematic review, differential expression of PD-L1 on tumor samples could be used to select a subset of patients who would derive a PFS benefit from administered treatments [39]. However, a similar subset of patients who would derive an OS benefit could not be identified, as both PD-L1+ and PD-L1- patients had superior outcomes with immunotherapy treatments and there was not a statistically significant difference in OS between these two groups. The search for other potential biomarkers continues [40], but efforts to find biomarkers predicting efficacy with anti-angiogenic therapy have overall yielded mixed results [41]. Various circulating biomarkers may have the potential to guide therapies in mccRCC [42]. One notable phase 2 trial, BIONIKK, is an active biomarker-driven trial in mccRCC patients receiving either nivolumab, nivolumab with ipilimumab, or a TKI [43]. In this trial, patients were divided into four molecular subgroups of mccRCC based on a gene signature and were randomized to receive nivolumab versus nivolumab with ipilimumab versus sunitinib or pazopanib, and promising preliminary results presented at the 2020 European Society for Medical Oncology Virtual Congress suggested molecular profiling of mccRCC to guide treatment is plausible and feasible [44].
The following studies have suggested that inc-reased PD-L1 expression in primary ccRCC tumors is associated with increased aggressiveness and poor prognosis. Thompson et al. [45] were among the first to demonstrate that PD-L1 expression was an indic-ator for tumor aggressiveness and an important potential treatment target. Among 196 primary ccRCC specimens, PD-L1 expression was measured in TCs and/or ICs, and patients with high tumor and/or lymphocyte expression of PD-L1 were 4.5 times more likely to die. PD-L1 expression was also associated with larger primary tumor size and nuclear grade (p<0.01). The authors later supported their findings with a larger study that used 306 patient specimens with a longer median follow-up [46]. Leite et al. [47] concluded from 115 primary ccRCC specimens that PD-L1 expression was significantly correlated with a higher nuclear Fuhrman grade (p=0.021) and microvascular invasion (p=0.039). Similarly, Abbas et al. [48] analyzed 177 primary ccRCC samples and determined that PD-L1 expression was associated with lymph node metastasis (p=0.004) and distant metastasis (p=0.002), higher stage (p=0.004) and advanced disease (p<0.001). Our literature review of PD-L1 expression and aggressive features in met-astatic disease largely agreed with the above for localized disease. PD-L1 expression was significantly associated with increased Fuhrman or ISUP nuclear grade. Additionally, PD-L1 expression in mccRCC may be positively associated with increased sarcomatoid features, advanced T stage, primary tumor size, IMDC or MSKCC risk classification, and the presence of multiple metastases, although these associations are less clear [18, 19, 21, 30–34, 45–48].
We additionally discussed studies revealing associations between PD-L1 expression and expression of other biomarkers in mccRCC patients. Eckow-Passow et al. [32] determined that nearly all PD-L1+ tumors, both primary and metastatic, concurrently expressed PD-1 (n=22). Additionally, several studies have determined that tumors expressing c-Met, a pro-oncogenic tyrosine-protein kinase, express PD-L1 to a greater degree than do c-Met negative tumors. This would suggest that c-Met positive patients may benefit from ICI therapy, and potentially from combinations of ICI and c-Met inhibitors like cabozantinib. The combination was recently investigated in the CheckMate 9ER trial showing a benefit of nivolumab/cabozantinib combination relative to sunitinib in treatment-naïve mccRCC, although full results have not yet been reported [49].
PD-L1 expression in non-ccRCC (nccRCC) is much less studied due to lower prevalence compa-red to ccRCC. Choueiri et al. [50] were among the first to evaluate PD-L1 expression in tumor cell and tumor-infiltrating mononuclear cells of 110 nccRCC patients; results were limited based on several different types of nccRCC used in the study, and PD-L1 expression varied by tumor type, but PD-L1+ nccRCC had a trend towards higher tumor stage and grade and worse clinical outcomes. On the other hand, Abbas et al. [51] concluded from 64 nccRCC cases that PD-L1+ tumors had a trend for increased overall survival, and in general PD-L1 positivity did not affect tumor aggressiveness or clinical impact. Larger studies on nccRCC are needed to make stronger conclusions.
No standard exists for the optimal PD-L1 assay, the optimal cutoff for determining positivity of PD-L1 status, and whether TCs, ICs, or both should be used in determining PD-L1 expression. This pattern is seen across clinical trials presented in our review, and in other malignancies like lung and bladder cancers where PD-1/PD-L1 is also an established target. In a meta-analysis of diagnostic accuracy, in which most studies evaluated were for non-small cell lung cancer, laboratory-developed assays were comparable to the original Food and Drug Administration-approved assay [52]. In another study of four PD-L1 assays (VENTANA SP142 and SP263, and DAKO 22C3 and 28-8) with whole tissue section slides in ccRCC, there was reproducibility of IC positivity results among all four assays and TC positivity in three of the four assays [53]. Still despite the similarities, such comparisons must be interpreted with caution given the different scoring systems and cutoffs used to determine PD-L1 positivity.
It is important to point out there are different methods to prepare tumor specimens for PD-L1 staining, which include TMAs and whole tissue section. TMAs are produced with small punches from different tissue blocks, and therefore tissue from multiple blocks or patients can be studied with the same slide [54]. The heterogeneity of PD-L1 expression in malignancy and staining results produced by TMAs may produce misleading false positive or negative results [55, 56]. In this systematic review, four articles explicitly stated the use of TMAs to determine PD-L1 status [18, 31, 32, 34].
There are numerous limitations in this systematic review. While performing the search, it was evident that there were not enough studies involving only metastatic RCC or clear cell RCC to obtain meaningful data. Inclusion cutoffs with minimum 75% ccRCC and 50% metastatic cases were then applied. Therefore, some studies presented included non-metastatic cases and/or cases with non-clear cell RCC subtypes. Additionally, several clinical trials are currently ongoing, and preliminary results have been published in abstracts which were excluded from our analysis. As discussed above, there was also considerable inter-study heterogeneity for both the definition of PD-L1+ as well as the test used to determine PD-L1 expression.
In summary, despite the different methods used to assess PD-L1 status, multiple studies have demonstrated that PD-L1 positivity is associated with a more aggressive disease course in mccRCC. PD-L1+ patients are likely to respond poorly to VEGF-TKIs compared to PD-L1- patients. On the other hand, PD-L1+ patients appear to respond better to anti-PD-1/PD-L1 agents compared to PD-L1- patients, although both groups benefit significantly with ICI combination treatments over sunitinib. Although inc-reased PD-L1 expression appears predictive of res-ponse to checkpoint inhibitors, the use of PD-L1 as a prognostic marker for mccRCC remains unresolved. More studies of this complex but highly relevant clinical topic are needed as the search for optimal biomarkers continues.
FUNDING
The authors report no funding.
AUTHOR CONTRIBUTIONS
AJ, PLS: performance, interpretation of data; PCB, VSK: conception, interpretation of data.
CONFLICT OF INTEREST
PCB has served in a consulting or advisory role for Bayer, Bristol-Myers Squibb, Pfizer, EMD Sorono, Eisai, Caris Life Sciences, Clovis, and Dendreon. PCB has also received research funding from Blue Earth Diagnostics.
VSK has served in a consulting or advisory role for AstraZeneca, Clovis, Janssen, Pfizer, EMD Serono, Seattle Genetics and Dendreon and has received research funding (for the institution) from Endocyte, Nektar, Clovis and Janssen.
The other authors have no conflicts of interest to declare.
ACKNOWLEDGMENTS
The authors have no acknowledgements.
REFERENCES
[1] | Siegel RL , Miller KD , Jemal A . Cancer statistics, 2020. CA Cancer J Clin. (2020) ;70: (1):7–30. |
[2] | Cairns P . Renal cell carcinoma. Cancer Biomark. (2010) ;9: (1-6):461–73. |
[3] | Nabi S , Kessler ER , Bernard B , Flaig TW , Lam ET . Renal cell carcinoma: a review of biology and pathophysiology. FRes. (2018) ;7: :307. |
[4] | Barata PC , Rini BI . Treatment of renal cell carcinoma: Current status and future directions. CA Cancer J Clin. (2017) ;67: (6):507–24. |
[5] | Buchbinder EI , Desai A . CTLA-4 and PD-1 Pathways: Similarities, Differences, and Implications of Their Inhibition. Am J Clin Oncol. (2016) ;39: (1):98–106. |
[6] | Vaddepally RK , Kharel P , Pandey R , Garje R , Chandra AB . Review of Indications of FDA-Approved Immune Checkpoint Inhibitors per NCCN Guidelines with the Level of Evidence. Cancers (Basel). (2020) ;12: (3). |
[7] | Motzer RJ , Tannir NM , McDermott DF , Arén Frontera O , Melichar B , Choueiri TK , et al Nivolumab plus Ipilimumab versus Sunitinib in Advanced Renal-Cell Carcinoma. N Engl J Med. (2018) ;378: (14):1277–90. |
[8] | Rini BI , Plimack ER , Stus V , Gafanov R , Hawkins R , Nosov D , et al Pembrolizumab plus Axitinib versus Sunitinib for Advanced Renal-Cell Carcinoma. N Engl J Med. (2019) ;380: (12):1116–27. |
[9] | Motzer RJ , Penkov K , Haanen J , Rini B , Albiges L , Campbell MT , et al Avelumab plus Axitinib versus Sunitinib for Advanced Renal-Cell Carcinoma. N Engl J Med. (2019) ;380: (12):1103–15. |
[10] | Rini BI , Powles T , Atkins MB , Escudier B , McDermott DF , Suarez C , et al Atezolizumab plus bevacizumab versus sunitinib in patients with previously untreated metastatic renal cell carcinoma (IMmotion151): a multicentre, open-label, phase 3, randomised controlled trial. Lancet. (2019) ;393: (10189):2404–15. |
[11] | Motzer RJ , Escudier B , McDermott DF , George S , Hammers HJ , Srinivas S , et al Nivolumab versus Everolimus in Advanced Renal-Cell Carcinoma. N Engl J Med. (2015) ;373: (19):1803–13. |
[12] | Moher D , Liberati A , Tetzlaff J , Altman DG . Preferred reporting items for systematic reviews and meta-analyses: the PRISMA statement. PLoS Med. (2009) ;6: (7):e1000097. |
[13] | McDermott DF , Huseni MA , Atkins MB , Motzer RJ , Rini BI , Escudier B , et al Clinical activity and molecular correlates of response to atezolizumab alone or in combination with bevacizumab versus sunitinib in renal cell carcinoma. Nat Med. (2018) ;24: (6):749–57. |
[14] | Atkins MB , Plimack ER , Puzanov I , Fishman MN , McDermott DF , Cho DC , et al Axitinib in combination with pembrolizumab in patients with advanced renal cell cancer: a non-randomised, open-label, dose-finding, and dose-expansion phase 1b trial. Lancet Oncol. (2018) ;19: (3):405–15. |
[15] | Choueiri TK , Larkin J , Oya M , Thistlethwaite F , Martignoni M , Nathan P , et al Preliminary results for avelumab plus axitinib as first-line therapy in patients with advanced clear-cell renal-cell carcinoma (JAVELIN Renal 100): an open-label, dose-finding and dose-expansion, phase 1b trial. Lancet Oncol. (2018) ;19: (4):451–60. |
[16] | Choueiri TK , Figueroa DJ , Fay AP , Signoretti S , Liu Y , Gagnon R , et al Correlation of PD-L1 tumor expression and treatment outcomes in patients with renal cell carcinoma receiving sunitinib or pazopanib: results from COMPARZ, a randomized controlled trial. Clin Cancer Res. (2015) ;21: (5):1071–7. |
[17] | Flaifel A , Xie W , Braun DA , Ficial M , Bakouny Z , Nassar AH , et al PD-L1 Expression and Clinical Outcomes to Cabozantinib, Everolimus, and Sunitinib in Patients with Metastatic Renal Cell Carcinoma: Analysis of the Randomized Clinical Trials METEOR and CABOSUN. Clin Cancer Res. (2019) ;25: (20):6080–8. |
[18] | Shin SJ , Jeon YK , Cho YM , Lee JL , Chung DH , Park JY , et al The Association Between PD-L1 Expression and the Clinical Outcomes to Vascular Endothelial Growth Factor-Targeted Therapy in Patients With Metastatic Clear Cell Renal Cell Carcinoma. Oncologist. (2015) ;20: (11):1253–60. |
[19] | Hara T , Miyake H , Fujisawa M . Expression pattern of immune checkpoint-associated molecules in radical nephrectomy specimens as a prognosticator in patients with metastatic renal cell carcinoma treated with tyrosine kinase inhibitors. Urol Oncol. (2017) ;35: (6):363–9. |
[20] | Liu X , Swen JJ , Diekstra MHM , Boven E , Castellano D , Gelderblom H , et al A Genetic Polymorphism in CTLA-4 Is Associated with Overall Survival in Sunitinib-Treated Patients with Clear Cell Metastatic Renal Cell Carcinoma. Clin Cancer Res. (2018) ;24: (10):2350–6. |
[21] | Kammerer-Jacquet SF , Brunot A , Lefort M , Bayat S , Peyronnet B , Verhoest G , et al Metastatic Clear-cell Renal Cell Carcinoma With a Long-term Response to Sunitinib: A Distinct Phenotype Independently Associated With Low PD-L1 Expression. Clin Genitourin Cancer. (2019) ;17: (3):169–76.e1. |
[22] | Motzer RJ , Rini BI , McDermott DF , Redman BG , Kuzel TM , Harrison MR , et al Nivolumab for Metastatic Renal Cell Carcinoma: Results of a Randomized Phase II Trial. J Clin Oncol. (2015) ;33: (13):1430–7. |
[23] | McFarlane JJ , Kochenderfer MD , Olsen MR , Bauer TM , Molina A , Hauke RJ , et al Safety and Efficacy of Nivolumab in Patients With Advanced Clear Cell Renal Cell Carcinoma: Results From the Phase IIIb/IV CheckMate 374 Study. Clin Genitourin Cancer. (2020) ;18: (6):469–76.e4. |
[24] | McDermott DF , Sosman JA , Sznol M , Massard C , Gor-don MS , Hamid O , et al Atezolizumab, an Anti-Prog-rammed Death-Ligand 1 Antibody, in Metastatic Renal Cell Carcinoma: Long-Term Safety, Clinical Activity, and Immune Correlates From a Phase Ia Study. J Clin Oncol. (2016) ;34: (8):833–42. |
[25] | Albiges L , Tannir NM , Burotto M , McDermott D , Plimack ER , Barthélémy P , et al Nivolumab plus ipilimumab versus sunitinib for first-line treatment of advanced renal cell carcinoma: extended 4-year follow-up of the phase III CheckMate 214 trial. ESMO Open. (2020) ;5: (6). |
[26] | Motzer RJ , Rini BI , McDermott DF , Arén Frontera O , Hammers HJ , Carducci MA , et al Nivolumab plus ipilimumab versus sunitinib in first-line treatment for advanced renal cell carcinoma: extended follow-up of efficacy and safety results from a randomised, controlled, phase 3 trial. Lancet Oncol. (2019) ;20: (10):1370–85. |
[27] | Choueiri TK , Motzer RJ , Rini BI , Haanen J , Campbell MT , Venugopal B , et al Updated efficacy results from the JAVELIN Renal 101 trial: first-line avelumab plus axitinib versus sunitinib in patients with advanced renal cell carcinoma. Ann Oncol. (2020) ;31: (8):1030–9. |
[28] | Powles T , Plimack ER , Soulières D , Waddell T , Stus V , Gafanov R , et al Pembrolizumab plus axitinib versus sunitinib monotherapy as first-line treatment of advanced renal cell carcinoma (KEYNOTE-426): extended follow-up from a randomised, open-label, phase 3 trial. Lancet Oncol. (2020) ;21: (12):1563–73. |
[29] | Motzer RJ , Escudier B , George S , Hammers HJ , Srinivas S , Tykodi SS , et al Nivolumab versus everolimus in patients with advanced renal cell carcinoma: Updated results with long-term follow-up of the randomized, open-label, phase 3 CheckMate 025 trial. Cancer. (2020) ;126: (18):4156–67. |
[30] | Ueda K , Suekane S , Kurose H , Chikui K , Nakiri M , Nishihara K , et al Prognostic value of PD-1 and PD-L1 expression in patients with metastatic clear cell renal cell carcinoma. Urol Oncol. (2018) ;36: (11), 499.e9-.e16. |
[31] | Callea M , Albiges L , Gupta M , Cheng SC , Genega EM , Fay AP , et al Differential Expression of PD-L1 between Primary and Metastatic Sites in Clear-Cell Renal Cell Carcinoma. Cancer Immunol Res. (2015) ;3: (10):1158–64. |
[32] | Eckel-Passow JE , Ho TH , Serie DJ , Cheville JC , Houston Thompson R , Costello BA , et al Concordance of PD-1 and PD-L1 (B7-H1) in paired primary and metastatic clear cell renal cell carcinoma. Cancer Med. (2020) ;9: (3):1152–60. |
[33] | Zhang X , Yin X , Zhang H , Sun G , Yang Y , Chen J , et al Differential expressions of PD-1, PD-L1 and PD-L2 between primary and metastatic sites in renal cell carcinoma. BMC Cancer. (2019) ;19: (1):360. |
[34] | Lalani AA , Gray KP , Albiges L , Callea M , Pignon JC , Pal S , et al Differential expression of c-Met between primary and metastatic sites in clear-cell renal cell carcinoma and its association with PD-L1 expression. Oncotarget. (2017) ;8: (61):103428–36. |
[35] | Mischinger J , Fröhlich E , Mannweiler S , Meindl C , Absenger-Novak M , Hutterer GC , et al Prognostic value of B7-H1, B7-H3 and the stage, size, grade and necrosis (SSIGN) score in metastatic clear cell renal cell carcinoma. Cent European J Urol. (2019) ;72: (1):23–31. |
[36] | Ascierto ML , McMiller TL , Berger AE , Danilova L , Anders RA , Netto GJ , et al The Intratumoral Balance between Metabolic and Immunologic Gene Expression Is Associated with Anti-PD-1 Response in Patients with Renal Cell Carcinoma. Cancer Immunol Res. (2016) ;4: (9):726–33. |
[37] | Jilaveanu LB , Shuch B , Zito CR , Parisi F , Barr M , Kluger Y , et al PD-L1 Expression in Clear Cell Renal Cell Carcinoma: An Analysis of Nephrectomy and Sites of Metastases. J Cancer. (2014) ;5: (3):166–72. |
[38] | Mikami S , Mizuno R , Kondo T , Shinohara N , Nonomura N , Ozono S , et al Clinical significance of programmed death-1 and programmed death-ligand 1 expression in the tumor microenvironment of clear cell renal cell carcinoma. Cancer Sci. (2019) ;110: (6):1820–8. |
[39] | Carretero-González A , Lora D , Martín Sobrino I , Sáez Sanz I , Bourlon MT , Anido Herranz U , et al The Value of PD-L1 Expression as Predictive Biomarker in Metastatic Renal Cell Carcinoma Patients: A Meta-Analysis of Randomized Clinical Trials. Cancers (Basel). (2020) ;12: (7). |
[40] | Deleuze A , Saout J , Dugay F , Peyronnet B , Mathieu R , Verhoest G , et al Immunotherapy in Renal Cell Carcinoma: The Future Is Now. Int J Mol Sci. (2020) ;21: (7). |
[41] | D’Aniello C , Berretta M , Cavaliere C , Rossetti S , Facchini BA , Iovane G , et al Biomarkers of Prognosis and Efficacy of Anti-angiogenic Therapy in Metastatic Clear Cell Renal Cancer. Front Oncol. (2019) ;9: :1400. |
[42] | Zhang T , Zhu J , George DJ , Nixon AB . Metastatic clear cell renal cell carcinoma: Circulating biomarkers to guide antiangiogenic and immune therapies. Urol Oncol. (2016) ;34: (11):510–8. |
[43] | Epaillard N , Simonaggio A , Elaidi R , Azzouz F , Braychenko E , Thibault C , et al BIONIKK: A phase 2 biomarker driven trial with nivolumab and ipilimumab or VEGFR tyrosine kinase inhibitor (TKI) in naïve metastatic kidney cancer. Bull Cancer. (2020) ;107: (5s):eS22–eS7. |
[44] | Vano Y , Elaidi R , Bennamoun M , Chevreau C , Borchiellini D , Pannier D , et al LBA25 Results from the phase II biomarker driven trial with nivolumab (N) and ipilimumab or VEGFR tyrosine kinase inhibitor (TKI) in naïve metastatic kidney cancer (m-ccRCC) patients (pts): The BIONIKK trial. Annals of Oncology. (2020) ;31: :S1157. |
[45] | Thompson RH , Gillett MD , Cheville JC , Lohse CM , Dong H , Webster WS , et al Costimulatory B7-H1 in renal cell carcinoma patients: Indicator of tumor aggressiveness and potential therapeutic target. Proc Natl Acad Sci U S A. (2004) ;101: (49):17174–9. |
[46] | Thompson RH , Kuntz SM , Leibovich BC , Dong H , Lohse CM , Webster WS , et al Tumor B7-H1 is associated with poor prognosis in renal cell carcinoma patients with long-term follow-up. Cancer research. (2006) ;66: (7):3381–5. |
[47] | Leite KR , Reis ST , Junior JP , Zerati M , Gomes Dde O , Camara-Lopes LH , et al PD-L1 expression in renal cell carcinoma clear cell type is related to unfavorable prognosis. Diagn Pathol. (2015) ;10: :189. |
[48] | Abbas M , Steffens S , Bellut M , Eggers H , Großhennig A , Becker JU , et al Intratumoral expression of programmed death ligand 1 (PD-L1) in patients with clear cell renal cell carcinoma (ccRCC). Med Oncol. (2016) ;33: (7):80. |
[49] | Choueiri T , Powles T , Burotto M , Bourlon M , Zurawski B , Juárez VO , et al 696O_PR Nivolumab+ cabozantinib vs sunitinib in first-line treatment for advanced renal cell carcinoma: First results from the randomized phase III CheckMate 9ER trial. Annals of Oncology. (2020) ;31: :S1159. |
[50] | Choueiri TK , Fay AP , Gray KP , Callea M , Ho TH , Albiges L , et al PD-L1 expression in nonclear-cell renal cell carcinoma. Ann Oncol. (2014) ;25: (11):2178–84. |
[51] | Abbas M , Steffens S , Bellut M , Becker JU , Großhennig A , Eggers H , et al Do programmed death 1 (PD-1) and its ligand (PD-L1) play a role in patients with non-clear cell renal cell carcinoma? Med Oncol. (2016) ;33: (6):59. |
[52] | Torlakovic E , Lim HJ , Adam J , Barnes P , Bigras G , Chan AWH , et al “Interchangeability” of PD-L1 immunohistochemistry assays: a meta-analysis of diagnostic accuracy. Mod Pathol. (2020) ;33: (1):4–17. |
[53] | Sommer U , Eckstein M , Ammann J , Braunschweig T , Macher-Göppinger S , Schwamborn K , et al Multicentric Analytical and Inter-observer Comparability of Four Clinically Developed Programmed Death-ligand 1 Imm-unohistochemistry Assays in Advanced Clear-cell Renal Cell Carcinoma. Clin Genitourin Cancer. (2020) ;18: (5):e629–e42. |
[54] | Wan WH , Fortuna MB , Furmanski P . A rapid and efficient method for testing immunohistochemical reactivity of monoclonal antibodies against multiple tissue samples simultaneously. J Immunol Methods. (1987) ;103: (1):121–9. |
[55] | Li C , Huang C , Mok TS , Zhuang W , Xu H , Miao Q , et al Comparison of 22C3 PD-L1 Expression between Surgically Resected Specimens and Paired Tissue Microarrays in Non-Small Cell Lung Cancer. J Thorac Oncol. (2017) ;12: (10):1536–43. |
[56] | Gagné A , Enlow W , Pigeon MA , Orain M , Turcotte S , Bossé Y , et al Comprehensive Assessment of PD-L1 Staining Heterogeneity in Pulmonary Adenocarcinomas Using Tissue Microarrays: Impact of the Architecture Pattern and the Number of Cores. Am J Surg Pathol. (2018) ;42: (5):687–94. |
[57] | Choueiri TK , Fishman MN , Escudier B , McDermott DF , Drake CG , Kluger H , et al Immunomodulatory Activity of Nivolumab in Metastatic Renal Cell Carcinoma. Clin Cancer Res. (2016) ;22: (22):5461–71. |

