
Comparing the Responses of Osseous Versus Soft-Tissue Metastases of Renal Cell Carcinoma to Receptor Tyrosine Kinase Inhibitors and Immunotherapy
Abstract
BACKGROUND:
Checkpoint inhibitors and receptor tyrosine kinase inhibitors (RTKIs) have changed the standard of care for metastatic renal cell carcinoma (mRCC). Anecdotal evidence suggests these therapies may be less effective for treating bone than soft-tissue metastases.
PURPOSE:
We performed a retrospective review evaluating the relative clinical responses in soft-tissue and bone metastases in patients undergoing therapy using RTKIs and anti-programmed death-1 (PD-1) agents for mRCC.
METHODS:
Of the 2,212 patients in our institutional cancer registry with renal cell carcinoma (1997–2017), 68 (82 disease courses) were identified with measurable bone and soft-tissue metastases treated with RTKIs and/or PD-1s. Extent of metastasis was quantified at the time of therapy initiation (baseline) and at 3 months, 6 months, and 1 year. Changes in disease status were categorized as complete response, partial response, stable, mixed, or progression of disease according to RECIST v1.1 and MD Anderson criteria. These categories were further organized into “response to treatment” or “evidence of progression” to generate a generalized linear effects model with soft-tissue response as the independent variable and bone response as the dependent variable. Alpha = 0.05.
RESULTS:
Soft-tissue response correlated with bone response at 3 months (76 disease courses, p = 0.005) and 6 months (48 disease courses, p = 0.017). Of the patients with controlled soft-tissue disease, only 14 (19%) and 15 (32%) had progression in bone at 3 and 6 months, respectively.
CONCLUSION:
Contrary to anecdotal reports, osseous metastases do not appear to respond worse than soft-tissue metastases to treatment with these agents.
INTRODUCTION
Renal cell carcinoma (RCC) represents approximately 3.8% of all newly diagnosed malignancies in the United States, and approximately 20%–30% of patients with metastatic RCC (mRCC) ultimately develop osseous metastases. [1] The prognosis associated with distant metastatic disease is poor at baseline, with a 5-year survival rate of 8%–12%, [2] but patients with osseous metastases often have a worse prognosis. Additionally, the prevalence of osseous metastases among patients with RCC has increased, likely because of improvements in imaging modalities and advances in systemic therapeutic options.
Since the approval of vascular endothelial growth factor (VEGF)/receptor tyrosine kinase inhibitor (RTKI) sunitinib in 2006, [3] the National Comprehensive Cancer Network Clinical Practice Guidelines in Oncology recommend VEGF/RTKI therapy as first-line treatment for mRCC. [4] Since approval, RTKI therapies have rapidly become more common, being used as first-line treatment in 70%–90% of cases of mRCC. [2] In 2018, the options for first-line treatment shifted again with the approval of immunotherapy agents (nivolumab plus ipilimumab), which showed superior overall survival and objective response rates compared with sunitinib. [5] Currently, biologic agents (RTKI and immunotherapy agents) are used routinely in the treatment of metastatic disease, including for patients with bone metastases. [6]
Although these agents have improved disease progression outcomes and patient survival, osseous metastases remain a marker of poor prognosis for patients with mRCC. In 2011, Abel et al. [7] identified bone metastases as a significant predictor of shorter survival among patients receiving sunitinib for mRCC. In 2014, McKay et al. [8] drew a similar conclusion from data on more than 2,700 patients receiving sorafenib, sunitinib, and/or axitinib. In 2011, Beuselinck et al. [6] studied 233 patients receiving first-line sunitinib and found that median progression-free survival and overall survival were shorter in patients with bone metastases than in those without. [6] However, anecdotal evidence suggests that the response to these agents is greater in soft-tissue metastases than in bone. A divergent response may improve the patient’s overall prognosis for survival without concomitant stabilization of osseous disease. Thus, patients may be at higher risk for progression of osseous metastatic disease, leading to more skeletal-related adverse events, such as fractures, spinal cord compression, bone pain, and hypercalcemia. These complications are likely to compromise quality of life and may affect overall survival. Lack of efficacy in osseous metastases is of particular concern in radioresistant tumors, for which few options exist other than targeted therapy.
This suggestion of a dichotomy between osseous and soft-tissue metastatic response to targeted therapy has not been proven. To our knowledge, no comprehensive study has directly compared the efficacy of biologic agents between the sites of metastatic involvement, partly because of the difficulty in quantifying bone metastases. The Response Evaluation Criteria in Solid Tumors, version 1.1, (RECIST 1.1) criteria classify bone metastases as unmeasurable unless a soft-tissue component is present. [9] In this study, we aim to address this gap in knowledge by evaluating the relative clinical responses in soft-tissue and osseous sites of disease in patients undergoing therapy using RTKIs and anti-programmed death-1 (PD-1) agents for mRCC.
METHODS
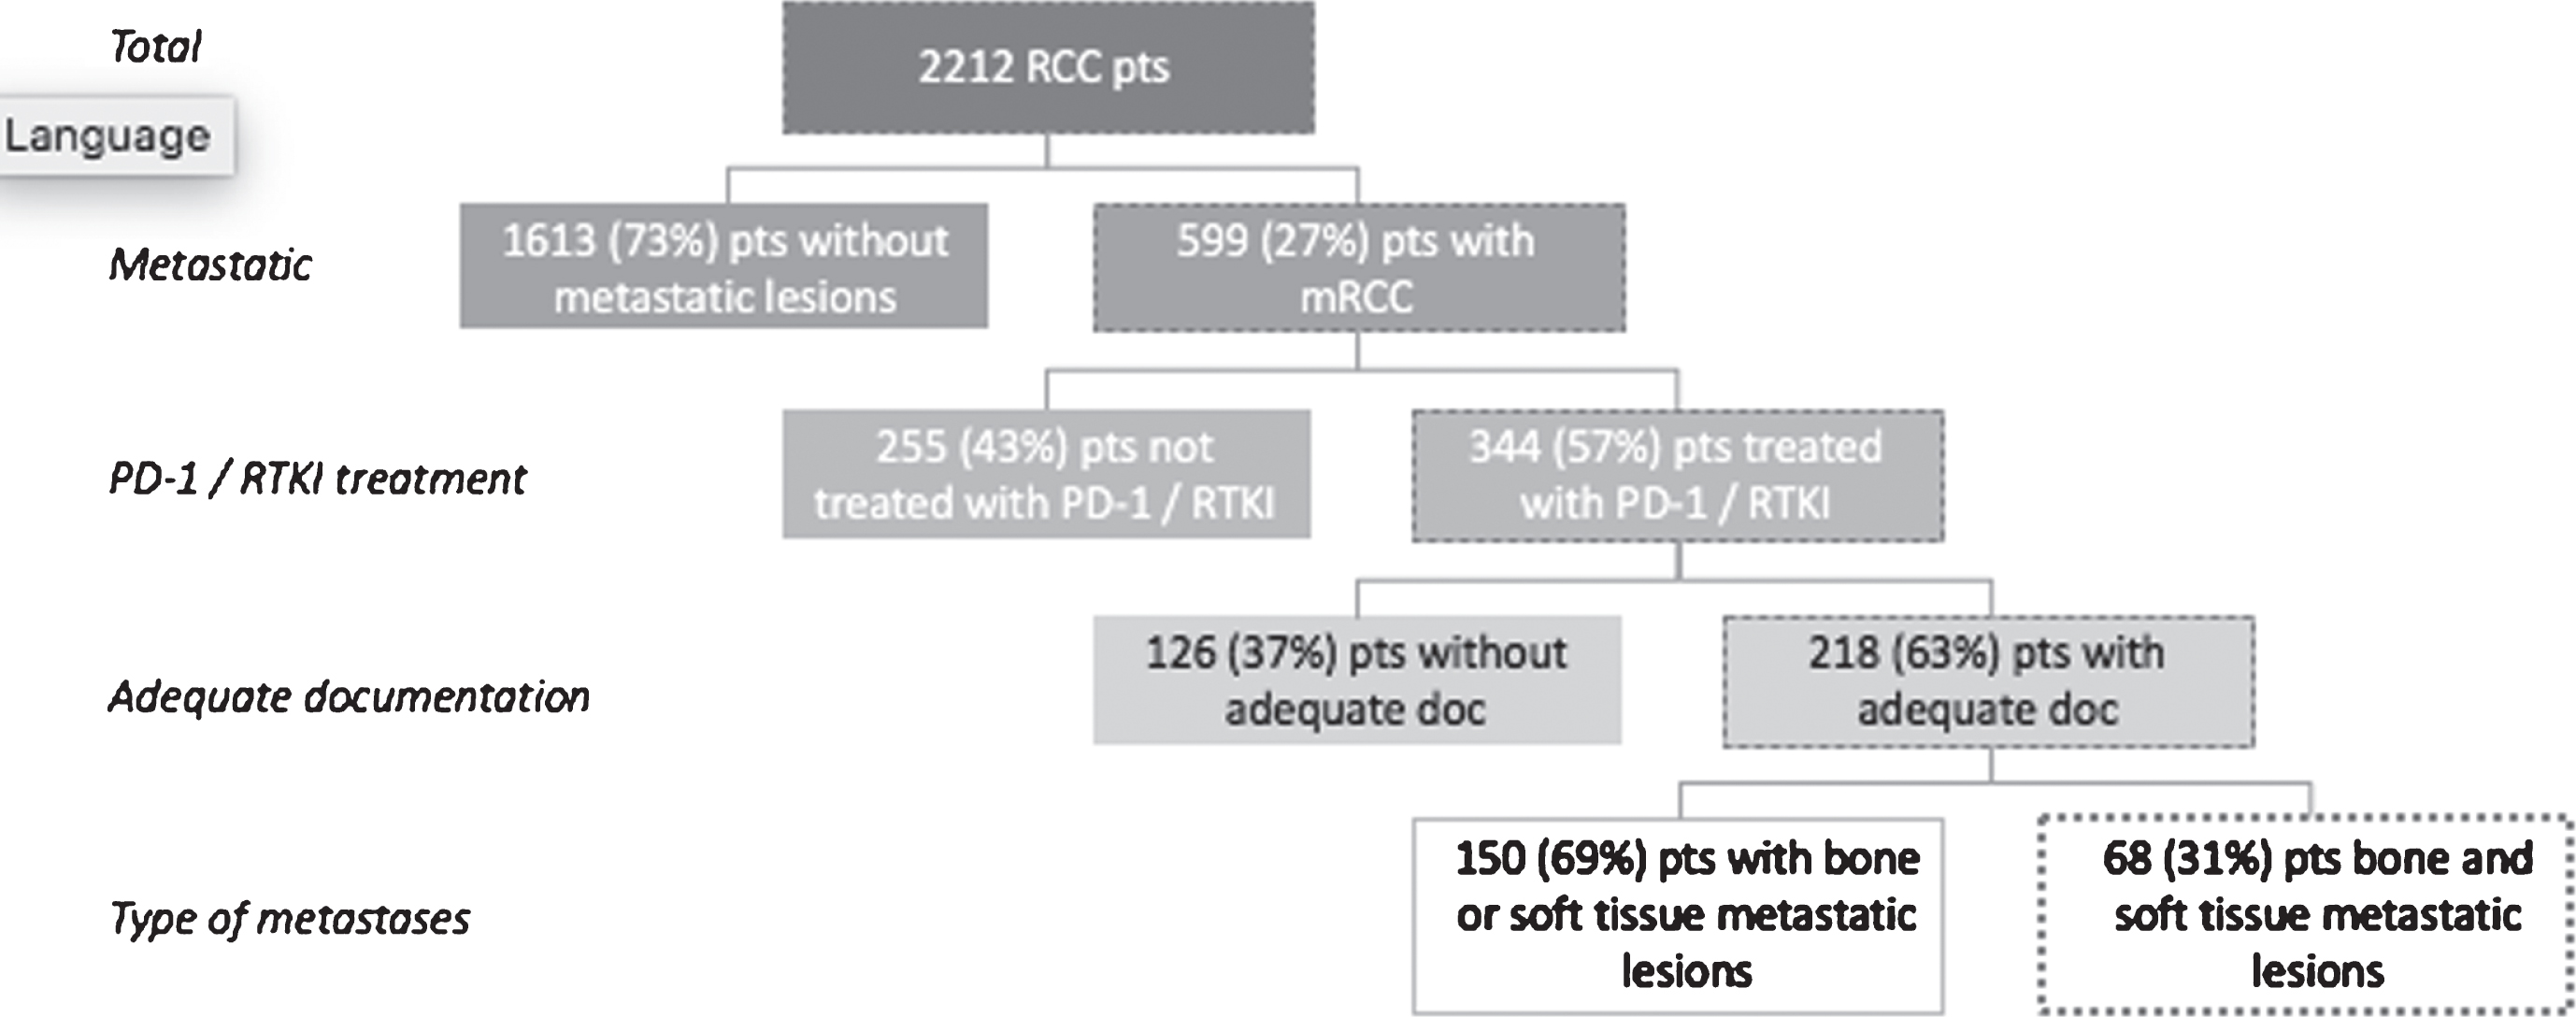
This study was approved by our institutional review board (IRB00170728), and patients were identified via the cancer registry at the Cancer Center database at the Sidney Kimmel Comprehensive Cancer Center at The Johns Hopkins University). A waiver of the requirement for signed consent for this study was granted by our institutional review board because of the nature of the inquiry and its anonymized data reviewed. All 2,212 patients treated for RCC by The Johns Hopkins University Departments of Orthopaedic Surgery, Oncology, and Radiation Oncology between January 1997 and December 2017 were considered for inclusion. We included adults (18 years or older) with metastatic bone and soft-tissue involvement from RCC treated with RTKI (sunitinib, pazopanib, cabozantinib, axitinib, sorafenib, and/or lenvatinib) and/or PD-1 inhibitors (nivolumab, pembrolizumab, atezolizumab, durvalumab, and/or avelumab). We excluded patients with bone or soft-tissue lesions secondary to primary neoplastic processes or metastases from another primary malignancy. We also excluded those who underwent radiation or surgery for metastatic lesions before or during RTKI or PD-1 treatment (only the site that received radiation or surgery was excluded from evaluation). Overall, 218 patients met the inclusion criteria, of whom 68 patients had both identifiable bone and soft-tissue metastatic disease, and 150 had bone or soft-tissue metastases but not both. We included only the 68 patients with both bone and soft-tissue metastatic disease in our study (Fig. 1).
Fig. 1
Inclusion and exclusion criteria applied to renal cell carcinoma (RCC) patient database. Adequate documentation (doc) refers to measurable metastases documented at baseline and at one or more follow-up time points. (mRCC, metastatic renal cell carcinoma; PD-1, programmed death-1; pts, patients; RTKI, receptor tyrosine kinase inhibitors).
Data collection
Medical records were reviewed for patient characteristics, treatment course, and disease progress. Imaging, pathology test results, and clinical reports were used to confirm the presence of metastases, as well as the treatment modalities used, their duration, and dosing. The dimensions of target soft-tissue and bone metastatic lesions were collected from radiographic imaging studies at baseline (when treatment was initiated) and at least one other time point (3 months, 6 months, and/or 1 year after treatment initiation). Lesions were measured independently by at least two researchers. Most imaging consisted of computed tomography scans, although bone scan images and magnetic resonance imaging studies were also referenced.
Our study is isolated to lesion changes after the first course RTKI or PD-1 therapy. Of the 68 qualified patients, 14 received both RTKI and anti-PD-1 therapy at different times. In such cases, we analyzed both the first course of RKTI and the first course of anti-PD-1 therapy.
We used the RECIST 1.1 [9] criteria to assess soft-tissue metastases and the MD Anderson (MDA) criteria [10] to assess bone metastases, because the RECIST 1.1 criteria classify bone metastases as unmeasurable disease unless a soft-tissue component is present (Table 1). In accordance with RECIST 1.1 criteria, soft-tissue metastases were measured in one dimension, with a cutoff of 1 cm in the longest dimension. The exception to this was lymph nodes, for which the cutoff was 1.5 cm in the shortest dimension. Furthermore, only the two largest lymph nodes present at baseline were considered target lesions and followed. For the MDA criteria, measurement of two perpendicular dimensions was required with a cutoff of 1 cm in the longest dimension. The dimensions were summed when considering disease change over time.
Table 1
MD Anderson and RECIST criteria applied for assessing bone and soft-tissue metastases, respectively
| Parameter | MD Anderson Criteria | RECIST Criteria |
| Size threshold | None specified (applied cut-off of 1 cm in longest diameter) | 1 cm in longest diameter (1.5 cm for lymph node in short diameter) |
| Required measurements | Sum of two perpendicular dimensions | Longest diameter (short diameter for lymph node) |
| Response | ||
| Complete response | Complete resolution | Complete resolution |
| Progression of disease | ≥25% increase | ≥20% increase |
| Partial response | ≥30% decrease | ≥50% decrease |
RECIST, Response Evaluation Criteria in Solid Tumors, version 1.1.
Statistical analysis
At each time point, the sizes of individual osseous or soft-tissue target lesions were aggregated and compared with baseline. The percentage change from baseline was categorized as complete response, partial response, stable, progression of disease, or mixed response. The thresholds for these categorizations often varied between bone and soft-tissue in accordance with the criteria against which they were measured.
Target lesions had to resolve completely to be categorized as having complete response for either bone or soft-tissue. For partial response, MDA criteria require the cumulative size of bone metastases to reach a 50% or greater reduction in size, whereas RECIST criteria define partial response as a 30% reduction in overall soft-tissue lesion size. For progression of disease, bone metastases must grow by 25% or more, and soft-tissue metastases must grow by at least 20%. [9, 10] Stable disease in bone or soft-tissue lesions thus represents the range between partial response and progression of disease. Mixed response was further defined as partial or complete response with new measurable metastatic lesions.
If a lesion was unmeasurable at a particular time point, that lesion was excluded from the calculation for that time point. Similarly, target lesions treated with surgery or radiation were excluded from analyses after their local treatment.
After establishing the disease status, we used a generalized linear mixed effects model to determine significance. Bone metastasis response was used as the independent variable, and soft-tissue metastasis response, time point, and their interaction were the dependent variables. For all assessments, significance was considered at p < 0.05.
RESULTS
Patient and disease characteristics
Of the 68 patients, 14 were treated with both RTKI and anti-PD-1 therapy; therefore, we analyzed 82 total disease courses (Table 2). Of these, 63% represented treatment by RKTI and 37% by anti-PD-1 therapy. Regarding histologic subtypes, most cases were the clear cell subtype (74%). Other subtypes included papillary carcinoma (6%) and sarcomatoid carcinoma (4%), with the remainder consisting of various combinations of subtypes.
Table 2
Characteristics of 82 disease courses (in 68 patients) with metastatic spread to both bone and soft-tissue, treated with RTKI and/or PD-1, 1997–2017
| Characteristic | N (%) |
| Female sex | 18 (22) |
| Drug class | |
| Anti-PD-1 | 30 (37) |
| RTKI | 52 (63) |
| Smoking | |
| Never | 29 (35) |
| Unknown | 27 (33) |
| Former | 21 (26) |
| Current | 5 (6) |
| Disease type | |
| Clear cell | 50 (74) |
| Not available | 6 (9) |
| Sarcomatoid | 4 (6) |
| Papillary | 3 (4) |
| Chromophobe | 2 (3) |
| Clear cell and papillary features | 2 (3) |
| Clear cell with sarcomatoid features | 1 (1) |
| Unique lesions | |
| Soft-tissue† | 4.7±2.6* |
| Bone‡ | 2.8±2.7* |
Anti-PD-1, anti-programmed death-1; RTKI, receptor tyrosine kinase inhibitor. *Data presented as mean±standard deviation. †A total of 389 unique soft-tissue lesions were recorded. ‡A total of 229 unique osseous lesions were recorded.
At the 3-month point, 76 disease courses were tracked. Six disease courses were unmeasurable at 3 months because either bone or soft-tissue metastases had not developed. At 6 months, there were 34 evaluable patients (48 disease courses), and at 12 months there were 26 evaluable patients (22 disease courses). At 6 months, the most common reason for attrition was progression of disease (71%), followed by death (15%), progression and adverse effects (9%), and loss to follow-up (6%). At 12 months, the most common reason for attrition was also progression of disease (69%), followed by death (15%), progression and adverse effects (8%), adverse effects alone (4%), and loss to follow-up (4%).
Each disease course included a mean (±standard deviation) of 4.7±2.6 evaluable soft-tissue lesions, resulting in a total of 398 unique soft-tissue lesions. The most common sites for soft-tissue lesions were the lung (33% of total lesions), lymph nodes (28%), and liver (15%). A total of 229 unique osseous lesions were identified and followed. For osseous metastases, each disease course included a mean of 2.8±2.7 unique lesions, with the most common sites of metastases being the pelvis (35% of total osseous lesions), vertebrae (29%), and ribs (19%).
Disease response
The disease response of osseous and soft-tissue metastatic burden was followed at three time points. Figure 2 provides a descriptive view of the response for bone and soft-tissue analyses, but no statistical analyses comparing bone and soft-tissue categorically were conducted.
Fig. 2
Renal cell carcinoma soft-tissue and bone metastasis response to receptor tyrosine kinase inhibitors or programmed death-1 therapy at (A) 3 months, (B) 6 months, and (C) 12 months after initial treatment classified by Response Evaluation Criteria in Solid Tumors, version 1.1, and MD Anderson criteria, respectively, and compared with baseline measurements. (CR, complete response; Diff, difference; PD, progression of disease; PR, partial response).
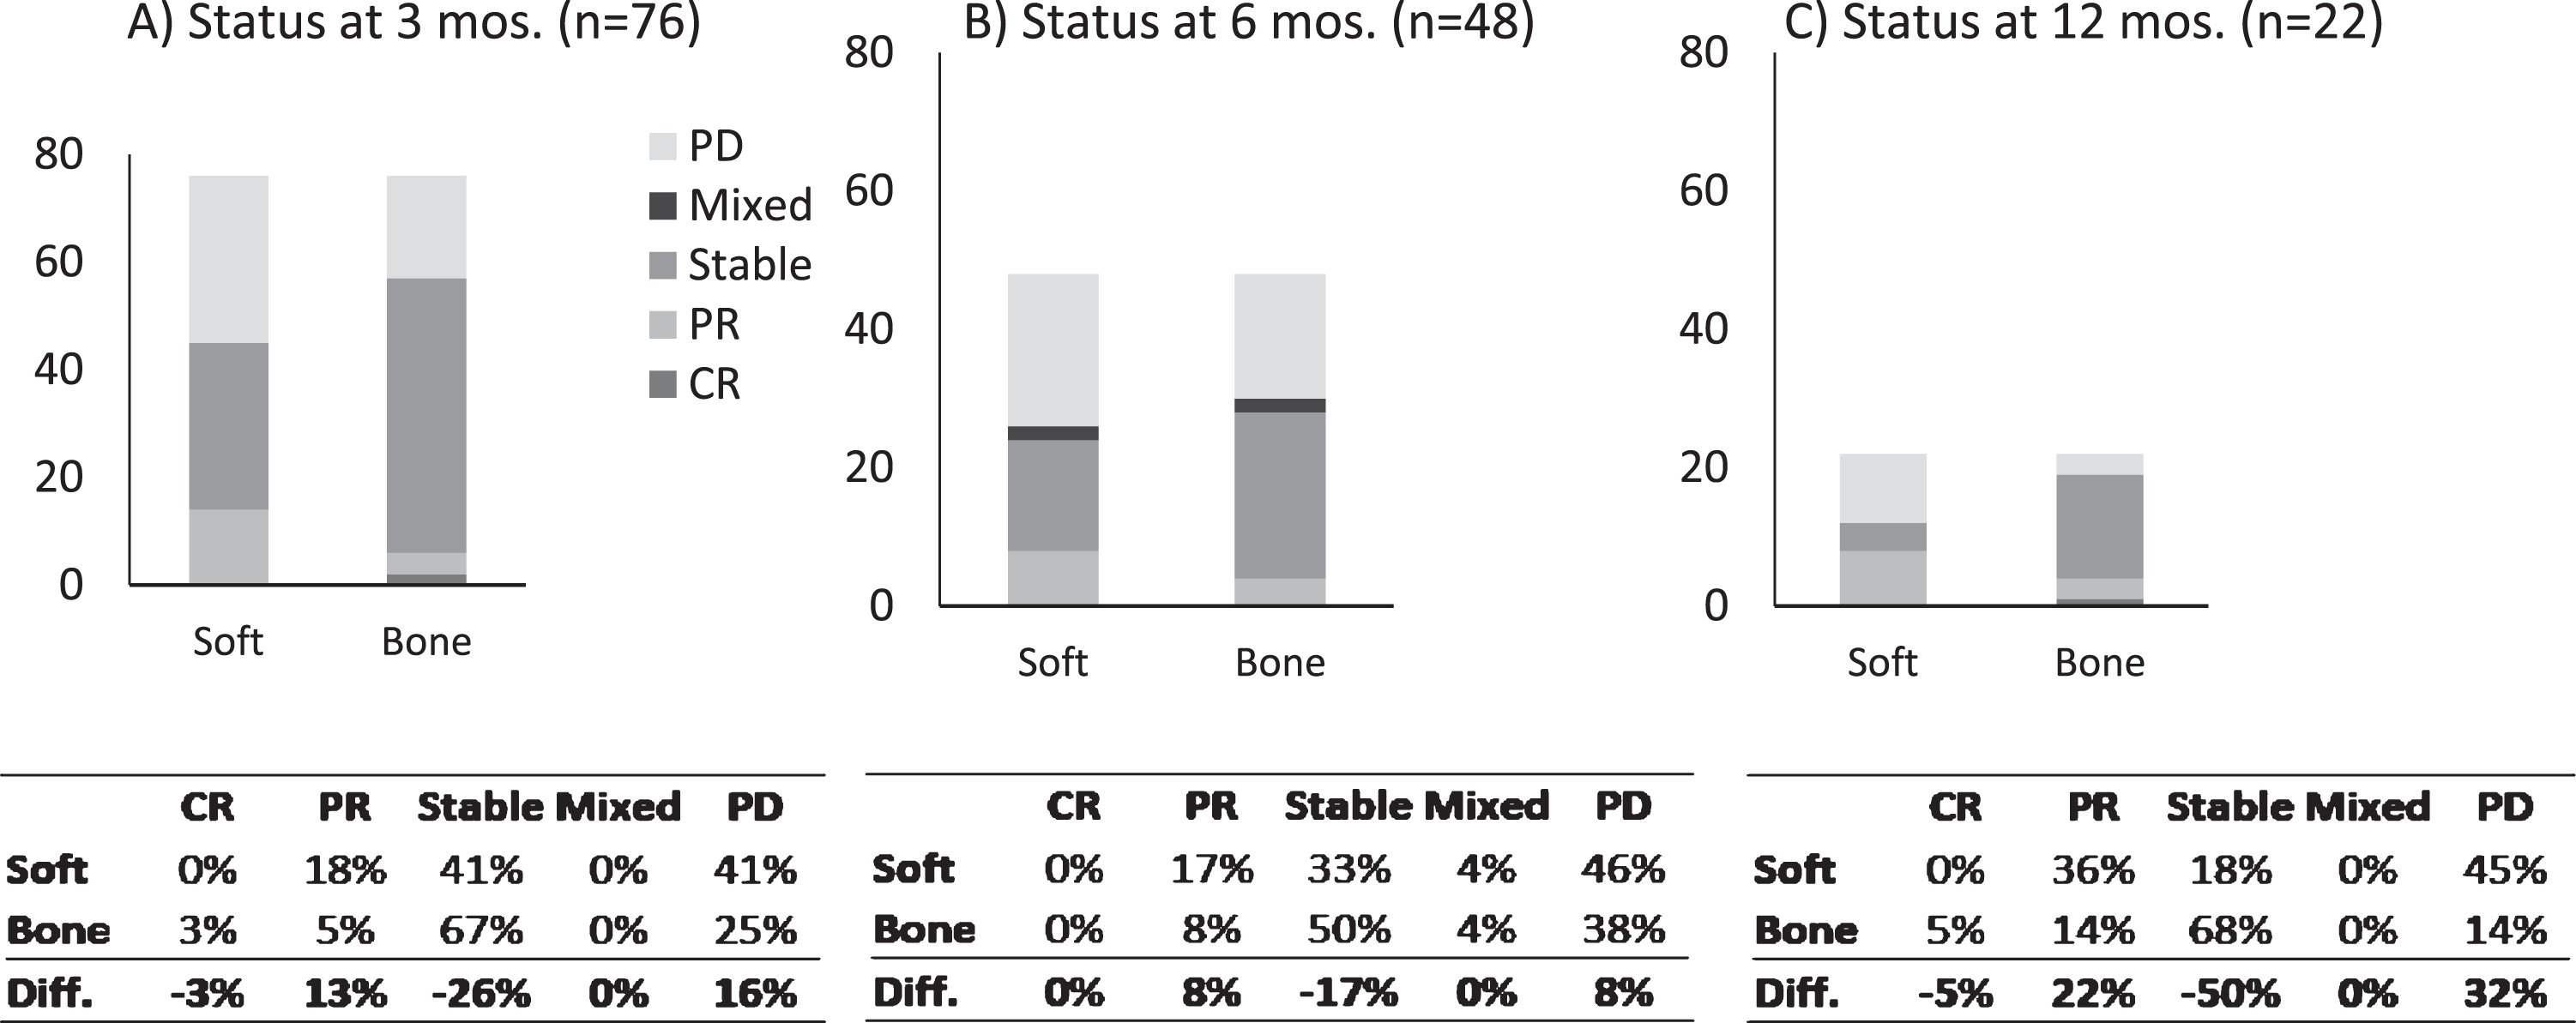
For bone metastases, stable disease was the most common response, representing 67% at 3 months, 50% at 6 months, and 68% at 12 months. When comparing osseous sites of metastases with soft-tissue sites, the proportion with stable disease was 26% greater at 3 months in the osseous sites. Conversely, a 16% greater proportion of soft-tissue metastases had progression of disease at 3 months compared with osseous metastases. However, a 13% greater proportion of soft-tissue metastatic lesions also exhibited a partial response to therapy compared with osseous metastatic lesions.
The numbers of disease courses in each of the five disease status categories were inadequate to power the model and thus were reclassified as response to treatment (partial response, complete response, or stable) or evidence of progression (progression of disease or mixed) (Fig. 2). At 3 months, 34 of 42 patients with soft-tissue response also had bone response, and 8 had bone progression. Similarly, at 6 months, 13 of 19 patients with soft-tissue response also had bone response, and 6 had bone progression. At 6 months, 29 patients had soft-tissue progression, of whom 20 also had bone progression, and 9 had bone response. Similarly, at 12 months, 9 of the 11 patients with soft-tissue response also had bone response, and 2 had bone progression.
Results of tests of association
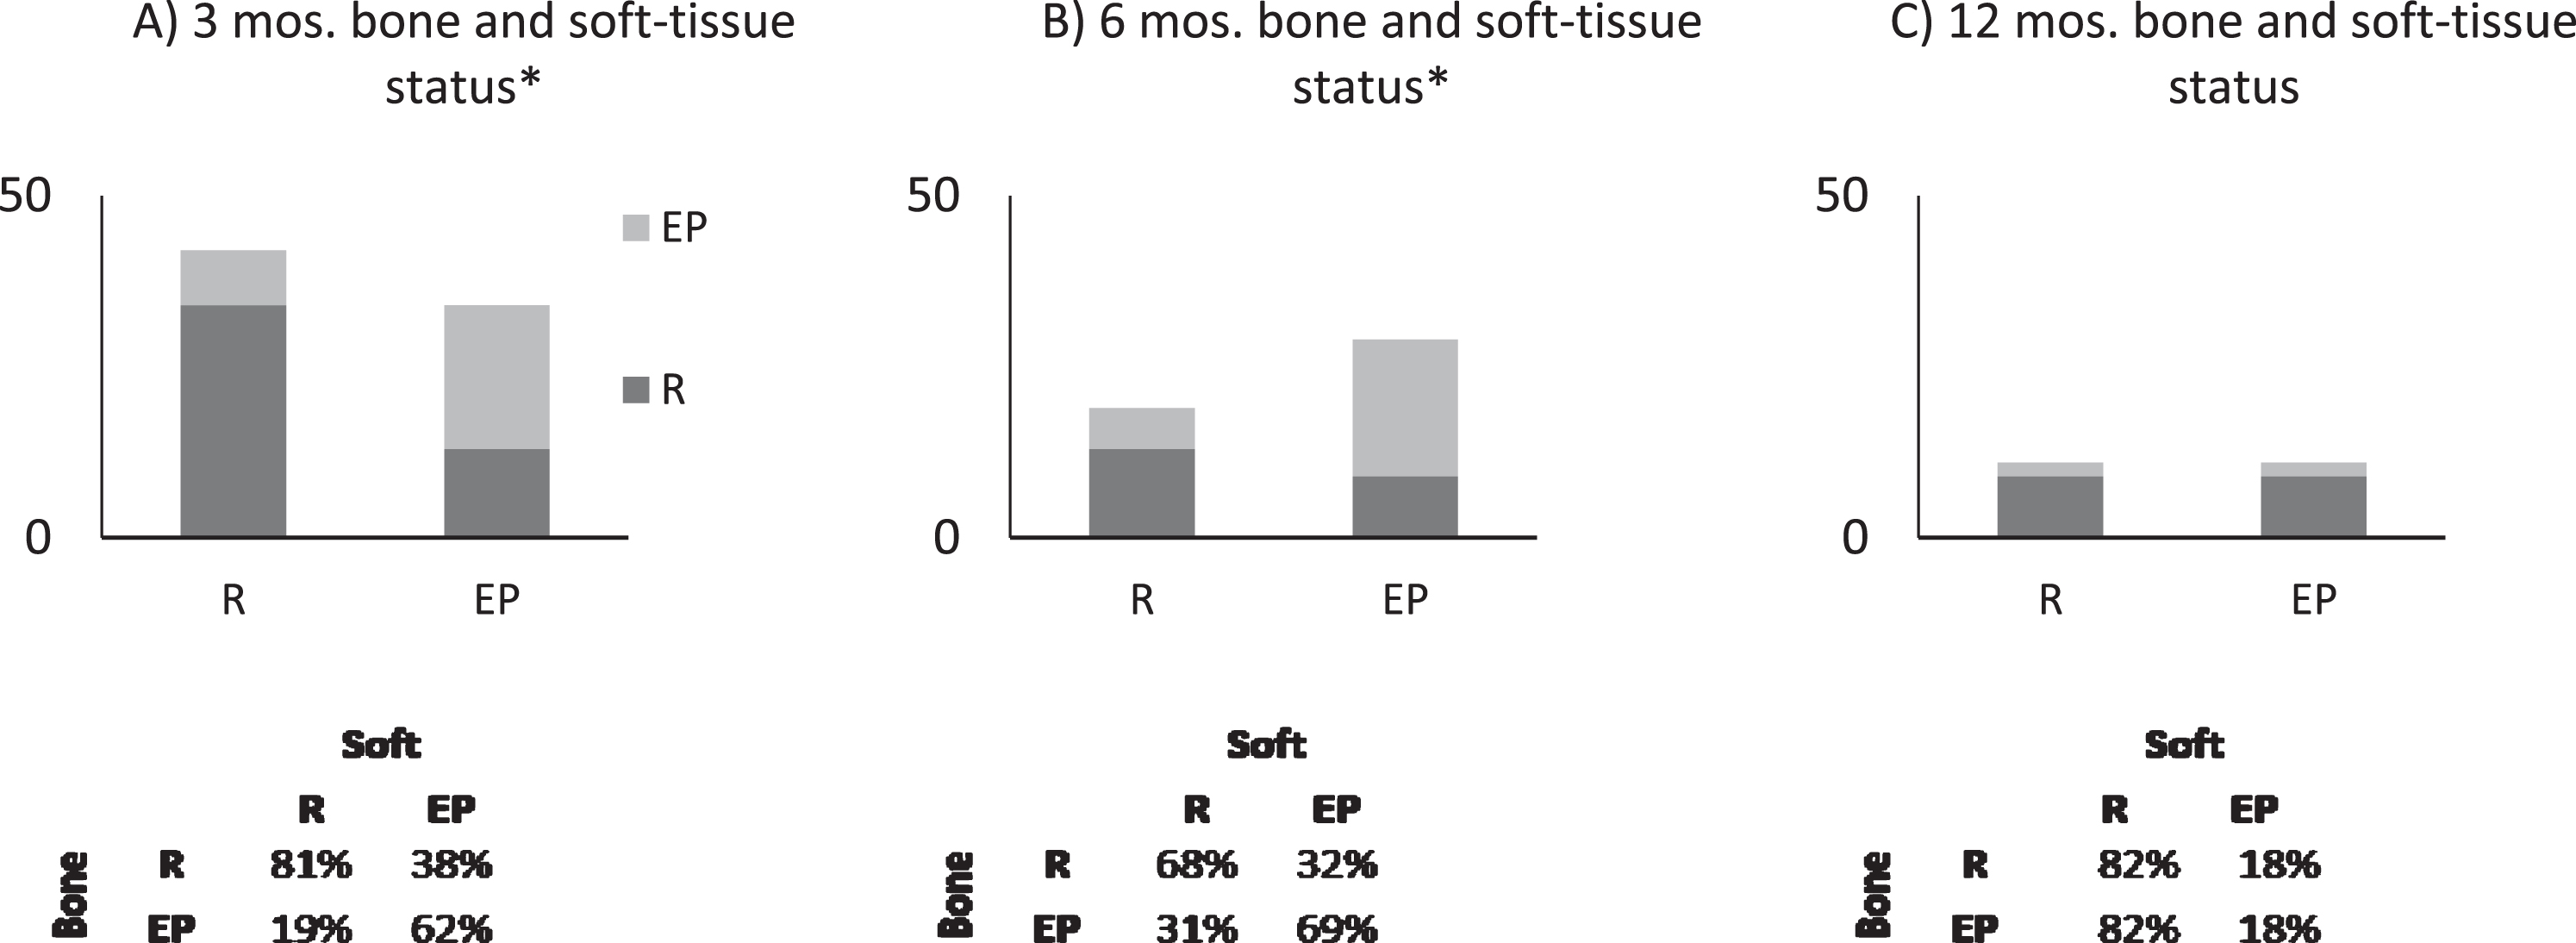
We found a positive association between soft-tissue metastasis response and bone response at 3 months (p = 0.005). The model indicates that if a patient has evidence of progression in soft-tissue metastases, the odds of that patient also having progression in bone are 18 times greater than having response in bone. We also found a positive association at 6 months (p = 0.017), with the model indicating that if a patient has evidence of progression in soft-tissue metastases, the odds of that patient also having progression in bone are 10 times greater than having response in bone (Fig. 3). No significant association between soft-tissue response and bone response was found at 12 months (p = 0.772).
Fig. 3
Generalized linear model indicates that soft-tissue response correlates with bone metastasis response at (A) 3 months and (B) 6 months (*p < 0.05) but not at (C) 12 months. Graphs show the proportion of response (R) and evidence of progression (EP) of disease in bone if a patient has R or EP in soft-tissue (x-axis).
DISCUSSION
The poorer prognosis associated with osseous metastatic disease reported in previous studies raised the possibility that bone metastases may respond differently than soft-tissue metastases to RTKIs. Anecdotal reports also indicate that bone metastases may not respond as well to these biologic agents. The results we report herein indicate that, at least early in the disease course (<6 months), bone metastases do not respond significantly differently than soft-tissue metastases to RTKI and immunotherapy agents. Contrary to anecdotal suggestion, patients with soft-tissue metastases that respond to therapy are likely to have bone metastases that respond similarly. However, a sizeable proportion of patients with controlled soft-tissue metastases did show progression in bone (19% at 3 months and 32% at 6 months). Also, among patients whose soft-tissue metastases were not controlled, approximately one-third had disease control in bone (38% at 3 months and 31% at 6 months). Although bone metastases may not necessarily have an inferior response to treatment compared with soft-tissue metastases, they often respond differently.
This observation is further supported by the finding that a greater proportion of soft-tissue metastases had response and progression than did bone metastases. Similarly, a greater proportion of bone metastases remained stable than did soft-tissue metastases. These results may reflect the different measurement criteria between the sites of metastasis, although the dichotomous findings raise questions about why the presence of bone metastases remains an independent predictor of overall survival in patients with mRCC treated with these agents.
While our study examines a similar patient population to those of Beuselinck et al. [6] and Zolnierek et al., [11] we attempted to examine response on an individual patient level to better control for confounding factors within the patient population. We included only patients who had both bone and soft-tissue metastases and compared each patient’s response in bone metastases with their response in soft-tissue metastases. This represents a novel method of analyzing this patient population compared with previous studies that aggregated patient data and performed categorical analyses, which may be skewed by outliers and confounding variables.
Additionally, Beuselinck et al. [6] and Zolnierek et al. [11] relied solely on the RECIST 1.1 criteria. Because these criteria allow only the soft-tissue extension of osseous lesions to be used as measurable disease, most osseous lesions become unmeasurable. We are concerned that this does not allow for the most accurate tracking of bone metastasis response; thus, we opted to use the MDA criteria to track progression of bone metastases.
Beuselinck et al. [6] suggested that the underlying mechanism may involve osteoclast activation in the presence of malignant cells that liberate cytokines, such as transforming growth factor-beta (TGF-β), insulin-like growth factor, and fibroblast growth factor, that further stimulate other malignant cells, similar to the vicious cycle of lytic bone metastases proposed by Mundy. [12] We recognize the interplay between TGF-β, for example, and T-cell immunity, and a means of overcoming such an increase in TGF-β may be critical to improving the efficacy of checkpoint inhibition. [13] We did not evaluate the potentially confounding role of antiresorptive therapy in patients with osseous metastatic disease. Although antiresorptive therapy has not been shown to influence overall survival in patients with mRCC, its effect on skeletal-related events and ability to decrease the osteoclast-mediated release of TGF-β are clearly described. [14]
Similarly, we are currently evaluating whether the soft-tissue and osseous lesions in this patient population respond differently from those lesions in patients with only bone or soft-tissue lesions, but not both. An understanding of differences in barriers of defense to the spread of disease could lead to identification of better predictors of and treatments for RCC. [15]
Although we analyzed a large cohort of patients with RCC, our study has several limitations, largely because of patient population size and strict inclusion criteria. To limit confounding patient-related and tumor-related factors, we evaluated only patients who had both bone and soft-tissue metastases to compare lesion progression within individual patients. We also did not include lesions treated with radiotherapy. Furthermore, because of attrition over time, the number of eligible patients declined. As a result of the limited patient population, we had insufficient statistical power to analyze drug classes (RTKI and PD-1) individually. Similarly, the study was underpowered to evaluate a more granular response pattern (e.g., complete vs. partial response). A more detailed evaluation of therapy classes or response gradation would likely require a multi-institutional analysis. Another limitation concerns our use of both the RECIST 1.1 and MDA criteria, which specify different cut-offs for evaluating disease progression. Thus, our results rely on the relative clinical validity of each of these criteria.
CONCLUSIONS
Bone and soft-tissue metastatic lesions responded similarly to targeted therapy in patients with mRCC who had both bone and soft-tissue metastases. Our study provides a foundation for further investigation into the role of targeted therapy for bone metastases in mRCC.
FUNDING
The authors report no funding.
AUTHOR CONTRIBUTIONS
Katherine Yuxi Tai: Acquisition, analysis, interpretation of data, drafting the work, final approval, agreement to be held accountable for the work
Jad M. El Abiad: Acquisition, analysis, interpretation of data, drafting the work, final approval, agreement to be held accountable for the work
Carol D. Morris: Interpretation of data, drafting the work, final approval, agreement to be held accountable for the work
Mark Christopher Markowski: Interpretation of data, drafting the work, final approval, agreement to be held accountable for the work
Adam S. Levin: Acquisition, analysis, interpretation of data, drafting the work, final approval, agreement to be held accountable for the work
CONFLICT OF INTEREST
The authors have no conflict of interest to report.
ACKNOWLEDGMENTS
The authors would like to thank Gayane Yenokyan, PhD from The Johns Hopkins Bloomberg School of Public Health for her assistance with this manuscript.
REFERENCES
[1] | Jemal A , Siegel R , Ward E , Hao Y , Xu J , Murray T , Thun MJ . Cancer statistics, 2008. CA Cancer J Clin. (2008) ;58: (2):71–96. |
[2] | Pal S , Gong J , Mhatre SK , Lin SW , Surinach A , Ogale S , Vohra R , Wallen H , George D . Real-world treatment patterns and adverse events in metastatic renal cell carcinoma from a large US claims database. BMC Cancer. (2019) ;19: (1):548. |
[3] | Verhagen PC . Re: Sunitinib versus interferon alfa in metastatic renal-cell carcinoma. Eur Urol. (2007) ;51: (5):1444. |
[4] | National Comprehensive Cancer Network. NCCN Clincial Practice Guidelines in Oncology (NCCN Guidelines): Kidney Cancer, version 4.2018. Available at https://www2.tri-kobe.org/nccn/guideline/urological/english/kidney.pdf Accessed on Aug 13. 2019. |
[5] | Motzer RJ , Tannir NM , McDermott DF , Aren Frontera O , Melichar B , Choueiri TK , Plimack ER , Barthelemy P , Porta C , George S et al. Nivolumab plus Ipilimumab versus Sunitinib in Advanced Renal-Cell Carcinoma. N Engl J Med. (2018) ;378: (14):1277–90. |
[6] | Beuselinck B , Oudard S , Rixe O , Wolter P , Blesius A , Ayllon J , Elaidi R , Schoffski P , Barrascout E , Morel A et al. Negative impact of bone metastasis on outcome in clear-cell renal cell carcinoma treated with sunitinib. Ann Oncol. (2011) ;22: (4):794–800. |
[7] | Abel EJ , Culp SH , Tannir NM , Tamboli P , Matin SF , Wood CG . Early primary tumor size reduction is an independent predictor of improved overall survival in metastatic renal cell carcinoma patients treated with sunitinib. Eur Urol. (2011) ;60: (6):1273–9. |
[8] | McKay RR , Lin X , Perkins JJ , Heng DY , Simantov R , Choueiri TK . Prognostic significance of bone metastases and bisphosphonate therapy in patients with renal cell carcinoma. Eur Urol. (2014) ;66: (3):502–9. |
[9] | Eisenhauer EA , Therasse P , Bogaerts J , Schwartz LH , Sargent D , Ford R , Dancey J , Arbuck S , Gwyther S , Mooney M et al. New response evaluation criteria in solid tumours: revised RECIST guideline (version 1. 1). Eur J Cancer. (2009) ;45: (2):228–47. |
[10] | Costelloe CM , Chuang HH , Madewell JE , Ueno NT . Cancer Response Criteria and Bone Metastases: RECIST 1. 1, MDA and PERCIST. J Cancer. (2010) ;1: , 80–92. |
[11] | Zolnierek J , Nurzynski P , Langiewicz P , Oborska S , Wasko-Grabowska A , Kuszatal E , Obrocka B , Szczylik C . Efficacy of targeted therapy in patients with renal cell carcinoma with pre-existing or new bone metastases. J Cancer Res Clin Oncol. (2010) ;136: (3):371–8. |
[12] | Mundy GR . Mechanisms of bone metastasis. Cancer. (1997) ;80: (8):1546–56. |
[13] | Ungefroren H . Blockade of TGF-beta signaling: a potential target for cancer immunotherapy? Expert Opin Ther Targets. (2019) ;23: (8):679–93. |
[14] | Beuselinck B , Wolter P , Karadimou A , Elaidi R , Dumez H , Rogiers A , Van Cann T , Willems L , Body JJ , Berkers J et al. Concomitant oral tyrosine kinase inhibitors and bisphosphonates in advanced renal cell carcinoma with bone metastases. Br J Cancer. (2012) ;107: (10):1665–71. |
[15] | Massague J , Obenauf AC . Metastatic colonization by circulating tumour cells. Nature. (2016) ;529: (7586):298–306. |


