
The Pan-Omics Landscape of Renal Cell Carcinoma and Its Implication on Future Clinical Practice
Abstract
Renal cell carcinoma has traditionally been classified based on histological features. Contemporary studies have identified genomic, transcriptomic, epigenomic, and metabolomic signatures that correspond to or even transcend histological subtypes. Much remains to be learned about improving the algorithm of pan-omics integration for precision oncology, which will not only advance our understanding of RCC pathobiology and treatment response but also result in novel therapeutic opportunities. Accordingly, this review focuses on recent RCC multi-omics literature. Encouragingly, a few reports on omics integration into routinely employed prognostic risk models have shown early promise that could lay the foundation for future development of precision kidney cancer therapies. Hence, this article serves as a primer on what we have learned and how we might better realize the clinical potential of the burgeoning pan-omics data.
INTRODUCTION
The field of renal cell carcinoma (RCC) has undergone rapid transformation in the past few decades, from the Dark Age (∼2004) when <10% of patients achieved a therapeutic response through the Modern Age (2005-2014) with a ∼30% response rate to the Golden Age (2015∼) when a >50% response rate and a ∼90% disease control rate are anticipated [1–6]. However, despite such progress, approximately 14,830 RCC patients are expected to succumb to the disease in 2020 in the United States, where RCC is the 6th most commonly diagnosed cancer in men and 8th in women [7].
Prior to 2005, RCC was managed with either surgical resection for localized disease or systemic immunotherapy using IL-2 or IFN-α for metastatic RCC (mRCC) [5, 8]. Patients treated with IL-2 or IFN-α commonly experienced severe toxicities such as hypotensive shock necessitating vasopressors, respiratory distress requiring ventilator support, dehydration requiring large volume intravenous fluid support, and/or psychosis needing antipsychotics [2, 4, 9–11]. Only ∼10% of patients achieved therapeutic response, among whom a small proportion experienced durable long-term response for >5years. Proposed mechanisms underlying the observed treatment response included activation of cytotoxic T cells [4, 8], natural killer cells, dendritic cells, and macrophages [12].
Clear cell RCC (ccRCC) is the most common RCC subtype, and metastatic ccRCC accounts for most kidney cancer fatalities. Cloning of the VHL gene, the most commonly mutated gene in ccRCC, and its subsequent functional characterizations rendered new therapeutic opportunities. VHL is a key regulator of the hypoxia-sensing pathway, where the inhibition of VHL results in the stabilization of HIF1α and HIF2α, which in turn activate hypoxia-inducible genes including vascular endothelial growth factor (VEGF), platelet-derived growth factor (PDGF), and TGF-α, and c-MET [5, 8, 13–18]. Multiple approaches have been undertaken to develop inhibitors of HIF1α, HIF2α, and downstream signaling pathways [19]. The class of small molecule VEGF Receptor 2 (VEGFR2) inhibitors includes sorafenib, sunitinib, pazopanib, axitinib, cabozantinib, and lenvatinib [20]. Clinical trials of VEGF pathway inhibitors demonstrated ∼30% response rate and overall survival benefit over IL-2 and IFN-α. Following VEGF inhibitors [20–24], small molecule inhibitors of mTORC1, everolimus and temsirolimus, were subsequently approved [25–29]. The development of these targeted therapeutic agents initiated the “Modern Age” era of mRCC treatment starting from 2005. However, like other kinase inhibitors used in other cancers, VEGF inhibitors alone fail to eradicate tumor cells and their discontinuation near universally results in relapse.
The success of the immune checkpoint inhibitor (ICI) ipilimumab, an anti-CTLA-4 monoclonal antibody, in treating metastatic melanoma who failed standard care, led to its approval in 2011 [30], and the subsequent approval of additional ICIs that target PD-1 and PD-L1 quickly revolutionized the modern therapeutic landscape of other metastatic solid tumors including renal cell carcinoma [31]. Nivolumab, a PD-1 antibody, was approved as a second line treatment for mRCC in 2015, inaugurating the “Golden Age” era. The combination of ipilimumab and nivolumab resulted in ∼10% complete and ∼30% overall response rates in mRCC, which led to its approval as a front-line treatment in 2018. This represents the watershed moment where the best therapeutic outcome shifted from temporary containment to long-enduring remission. Furthermore, the use of anti-VEGF small molecular tyrosine kinase inhibitors with ICIs showed that a combinatorial approach further improved response rate and prolonged survival. For example, the combination of axitinib plus pembrolizumab, an anti-PD-1 antibody, induced a 59% response rate with overall survival benefit over sunitinib [24]. Since PD-1 or PD-L1 status does not predict outcome, there is a serious lack of predictive biomarkers the guide the use of ICIs [24]. Of note, ICIs typically induce response in people whose tumors have a high tumor mutational burden (TMB), whereas ccRCC tumors do not typically exhibit high TMB [18, 24, 32].
Traditional risk stratification models do not take into account the modern molecular features identified in individual RCC tumors. The University of California Los Angeles Integrated Staging System Model (UISS Model), the Mayo Clinic Stage, Size, Grade and Necrosis Model (SSIGN Model), and the Leibovich Score, a modified SSIGN model, are commonly used for localized RCC prognostication, relying on performance status, tumor histology, nephrectomy type, TNM stage, and tumor characteristics including size, grade and presence of necrosis [33]. For mRCC, commonly employed prognostication models include the Memorial Sloan Kettering Cancer Center (MSKCC) and the International Metastatic Renal Cell Carcinoma Database Consortium (IMDC) [34, 35], relying on performance status, time to systemic treatment, levels of hemoglobin, neutrophil, platelet, calcium and lactate dehydrogenase. Although recent studies have demonstrated that the correlation between certain molecular features of RCC and treatment/survival outcomes, the incorporation of these molecular characteristics into current prognostic models is at its infancy [8, 33, 36, 37].
This review pays special attention to papers published between January 2017 and October 2019 onRCC in the context of multi-omics and its implications on risk stratification, treatment response prediction, and clinical decision-making.
METHODS
Search was performed using PubMed with results restricted to English language journal articles published between January 2017 and October 2019. Search terms combined renal cell carcinoma with genomics, epigenetics, transcriptomics, metabolomics, multi-omics, pan-omics, and precision medicine.
RESULTS
Subtype classification
RCC is comprised of multiple subtypes that are histologically distinct and carry different genetic signatures. Clear cell RCC (ccRCC) is the most prevalent RCC subtype (∼75%). Papillary RCC (pRCC) and chromophobe RCC (chRCC) comprise approximately 15% and 5%, respectively. Other less common subtypes include medullary RCC, collecting duct RCC, TFE-translocation RCC, FH-loss HLRCC, RSC-loss RCC angiomyolipoma, and SDH-loss RCC. Each of these classifications is associated with specific histological, molecular and pathological profiles, and RCC tumors that do not fit any of the above categorization or are heavily heterogenous are placed in the unclassified RCC (uRCC) category [5, 38, 39].
Genetics
DNA sequencing has been commonly applied to study RCC. Individual RCC subtypes exhibit distinct histologic and genomic or copy number alterations that contribute to cancer initiation and progression (Table 1). Mutations of tumor suppressor genes TP53, PTEN and CDKN2A can be identified across all 3 major RCC subtypes [39]. However, the relative low mutation rate (<10%) of these genes favors their role as secondary, tertiary or progressing mutations in RCC.
Table 1
Genomics have enabled us to identify alterations at both the gene and chromosome level and how these influence survival or treatment response
| Gene alterations | Pathways | Chromosome alterations | Outcome influences | |
| ccRCC | VHL (>80%) | PI3K-AKT-mTOR | Chromosome 3 translocation with: | Worse cancer-specific survival: BAP1, SETD2, TP53, TERT alterations |
| PBRM1 (29–46%) | (>25%) | •Chromosome 2 (11%) | Better treatment response: PBRM1 alterations, PI3K pathway dysregulation | |
| BAP1 (6–19%) | •Chromosome 5 (20–43%) | |||
| SETD2 (8–30%) | •Chromosome 8 (7%) | |||
| TP53 (<10%) | •Other chromosomes (33%) | |||
| PTEN (<10%) | Chromosome 3p loss (>90%) | |||
| CDKN2A (<10%) | ||||
| CD163L | ||||
| DNMT1 | ||||
| KDM5C | ||||
| pRCC | Type 1 and 2: | HIPPO | Type 1 and 2: | Worse survival: TP53, PBRM1 alterations |
| •TP53, PTEN, CDKN2A (type 1 and type 2) | •Chromosome 7 and 17 gain | |||
| Type 1 | Type 2: | |||
| •MET, PBRM1 | •Chromosome 12 and 16 gain | |||
| Type 2 | ||||
| •CDKN2A, SETD2, NF2, CUL3, TERT, FH | ||||
| chRCC | TP53 | n/a | Set of losses: | Increased risk of metastasis: |
| PTEN | •Chromosome 1, 2, 6, 10, 13, 17 | TP53, PTEN and > 3 | ||
| CDKN2A | (85%) | chromosomal alterations | ||
| •Other chromosomal losses: 3, 5, 8, 9, 11, 18, or 21 (12–58%) |
ccRCC: More than 80% of ccRCC carry mutation or promoter methylation of the VHL gene [19]. The loss of chromosome 3p where VHL resides occurs in >90% of ccRCC. Other common tumor suppressors include PBRM1 (29–46%), BAP1 (6–19%), and SETD2 (8–30%) that all locate on 3p [14]. Genetic studies position VHL loss as the initial truncal driver event, followed by PBRM1 mutation, and completed with mTORC1 activation [40].
BAP1, SETD2, and TP53 mutations were associated with a worse survival outcome [39, 41, 42], whereas PBRM1 mutations associated with a better response to all treatment modalities [6, 43] including anti-PD1/anti-PD-L1 immunotherapy, possibly secondary to an aberrant JAK-STAT immune signaling activity [40]. Mutations in the promoter region of TERT are associated with worse cancer-specific survival (CSS) but had no impact on recurrence-free survival or overall survival [44]. Pathway mutations involving the PI3K-AKT-mTOR signaling cascade were also identified in more than a quarter of ccRCC tumors but did not correlate with worse survival [15, 39, 43, 45, 46]. However, low PTEN protein expression in ccRCC demonstrated better response to everolimus treatment as a single agent [47]. Gene expression signatures from the JAVELIN Renal 101 trial suggested that mutations in CD1631L, PTEN and DNMT1 also influenced progression-free survival and response to avelumab plus axitinib. Overall, an angiogenesis enriched signature correlated with improved progression-free survival in the sunitinib treatment group though did not influence survival in the avelumab plus axinitib group. Enrichment for immune gene expression signature increased progression-free survival in the avelumab plus axitinib group compared to sunitinib alone [48].
In addition to alterations of specific genes, chromosomal rearrangement was also a common event in ccRCC, occurring in over 60% of tumors. Chromosome 3p, where VHL is located, is the predominantly involved chromosome and is most commonly trans located with chromosome 5 (20–43%), chromosome 2 (11%), and chromosome 8 (7%). Another 33% of tumors harbor chromosome 3 translocations with one of the other chromosomes [49, 50].
ccRCC is known for high intratumoral heterogeneity (ITH) [51, 52]. Rapidly progressive ccRCC was characterized by less ITH, BAP1 mutation, and more somatic events detected in the primary kidney. Those with attenuated progression had higher ITH and PBRM1 loss followed by SETD2 loss or PI3K pathway dysregulation. Overall, tumors from metastatic sites exhibited less tumor heterogeneity [53, 54]. However, high tumor mutational burden may not impact progression-free survival with respect to specific treatment regimens such as avelumab plus axitinib versus sunitinib alone [48].
Studies that incorporated individual mutated genes into current risk stratification models have demonstrated that their inclusion could improve prognostic values. One model incorporated 6 commonly altered genes in ccRCC – BAP1, PBRM1, TP53, TERT, KDM5C, and SETD2 – into the MSKCC prognostic model. The addition of genomic information improved the prognostic accuracy in both progression free and overall survival [55].
pRCC: Papillary RCC consists of two subtypes, types 1 and 2, based on histological features. CpG island methylator phenotype-associated pRCC (CIMP-pRCC) has been described, exhibiting a unique epigenetic signature and foretelling a worse clinical outcome [39]. MET and PBRM1 mutations [38, 39] as well as chromosome gains of 7 and 17 [39] were more commonly seen with type 1 pRCC. In contrast, alterations in CDKN2A, SETD2, NF2, CUL3 and TERT, and copy number gains of chromosomes 7, 12, 16, and 17 were associated with type 2 pRCC [38]. HIPPO pathway mutations and loss of the SWI/NSF complex components were more frequently detected in type 2 pRCC [39]. Interestingly, MET alterations associate with hereditary type 1 pRCC; where as fumarate hydratase (FH) mutations associate with hereditary type 2 pRCC syndrome (hereditary leiomyoma RCC; HLRCC) [38]. TP53 mutations correlated with worse survival in both type 1 and type 2 pRCC whereas PBRM1 mutations only correlated with type 1 pRCC [39].
chRCC: chRCC carries pathognomonic losses of a set of chromosomes rather than mutations of specific genes [38, 56, 57]. The concurrent loss of a 6-chromosome set, i.e., 1, 2, 6, 10, 13, and 17, was detected in >85% of chRCC. Additional chromosomal losses of 3, 5, 8, 9, 11, 18, or 21 were detected in 12–58%. Interestingly, only half of the eosinophilic chRCC variants exhibited classical chromosome losses. Although only 5–10% chRCC eventually metastasized, TP53 and PTEN mutations and duplication of more than 3 chromosomes were risk factors for developing metastasis [39, 57].
Epigenetics
Among RCC subtypes, somatic mutations of epigenetic genes are common. These modify the expression of genes through meythylation, demeythylation, acetylation or his tone modification without changing the sequence of the gene. Mutations of SWI/SNF chromatin remodeling complex genes including PBRM1, ARID1A, SMARCA4 and SMARCB1 are detected in ∼50% of ccRCC, ∼25% of pRCC, and ∼4% of chRCC. Mutations of histone methyltransferases including SETD2 and KMT2C/2D occurred in ∼25% of ccRCC, ∼25% of pRCC, and ∼8% of chRCC. Mutations of acetyltransferase mutations are less common at ∼5% of ccRCC and ∼7% of pRCC. Mutations of demethylases including KDM4C, KDM5C, and KDM6A are detected in ∼13% of ccRCC, ∼17% of pRCC, and ∼5% of chRCC. Mutations of BAP1 and ASXL1, members of the polycomb repressive deubiquitinase complex, were altered in ∼12% of ccRCC, ∼7% of pRCC, and ∼1% of chRCC [39]. Furthermore, DNA hypermethylation was detected in ∼35% ccRCC, ∼12% pRCC, and ∼20% of chRCC tumors, which is associated with a worse survival [39]. DNA hypermethylation concentrated at the WNT pathway genes, SFRP1 and DKK1, was observed, and CDKN2A promoter methylation occurred in 4.2% of TCGA RCC tumors across all studied subtypes [39].
There also has been recent work on sub-typing RCCs based only on genomic signatures rather than histological appearance or cell of origin to better characterize the implications on survival of alterations of specific genomic pathways and improve risk stratification [42, 58].
Transcriptomics
Transcriptome analysis, which studied RNA signatures, was performed across all subtypes of RCC and found distinct mRNA, miRNA and lncRNA signatures for each subtype. Transcriptome analysis have found increased angiogenesis signatures in ccRCC as expected since VHL mutation leads to HIF stabilization and the induction of vasculogenic and angiogenic growth factors. Immune system activation and an increase in cellular metabolism and mitosis genes were also appreciated. Meanwhile, pRCC tumors were enriched with a cilium signature. NRF2-antioxidant response pathway activation was also seen in type 2 but not type 1 pRCC. Increased expression of ion membrane transport pathway genes was seen in chRCC [39]. Transcriptome signatures have also been used to predict survival in RCC [15].
One of the first multi-gene studies used to classify ccRCC into good and poor prognosis sub-groups defined by disease-specific survival employed 110 genes in its signature set and was able to successfully classify tumors based on these transcriptomic signatures [36]. ClearCode34 was another RNA signature set that was developed for risk stratification in patients with localized ccRCC. It comprised of 34 genes that further sub-classified ccRCC into a ccA good prognosis sub-type or a ccB poor prognosis sub-type. Use of this gene signature set was able to successfully stratify patients who experienced longer recurrence-free survival and overall survival. Moreover, use of this gene set more accurately risk-stratified patients than both the commonly used UISS and SSIGN risk stratification models [59]. Additionally, integration of the ClearCode34 predictive model with the IMDC risk stratification model allowed for better prediction of survival than each alone [60]. Analysis of gene expression data from the Phase 3 ccRCC COMPARZ trial identified 4 distinct clusters, of which cluster 4 is associated with an increase in inflammatory makers, PD-L1+ expression, and macrophage infiltration and a worse clinical outcome [61].
Proteomics
Proteomics has also been used to study differences in protein expression in RCC. Alterations in protein signatures were seen in ccRCC tumors that were not appreciated in normal adjacent tissue. Interestingly, these alterations in protein level were not reflected by transcriptome analysis and occurred primarily in tumor tissue and not normal adjacent tissue. This dysregulation of protein expression seemed to be mainly driven by chromosomal copy number variation or translation. Chromosome 3p loss was associated with an increase in hypoxia, glycolysis and cell cycle protein expression but a decrease in fatty acid metabolism, Krebs cycle, and oxidative phosphorylation protein expression. Alterations of other chromosomes including chromosome 5q gain, 7p gain, 9p loss, or 14q loss led to increased mTORC1 and myc pathway proteins, epithelial-mesenchymal transition proteins and interferon gamma responses and decreased chromatin organization [49]. Further investigation of phosphorylation status in cell cycle signaling showed increase in phosphorylation of proteins associated with progression through S-phase and G2/M checkpoints, especially in tumors with increased aggression. Moreover, phosphoproteomic analysis identified a subset of signatures involving cell cycle control and angiogenesis that correlated to genomic instability and tumor grade. Interestingly, the phosphorylation status of these proteins did not correlate with transcriptome or proteome expression [49].
Tumor Immune Microenvironment
The immune system plays a critical role in cancer progression and response to therapy. Immune cell infiltration of kidney tumors have been investigated by assessing gene expression contribution from individual immune cell types. ccRCC tumors have higher immune infiltration than pRCC and chRCC [39]. ccRCC tumors have increased regulatory T cells, cytotoxic T cells, TH2 helper cells, TH17 cells, B cells and dendritic cells [13, 39]. pRCC have increased NK cell infiltration and IL-8 activation. chRCC is associated with TH17 activation. Presence of an enriched TH2 signature was a poor prognostic indicator for ccRCC, pRCC and chRCC [39]. In a study that integrated transcriptome and proteome data, four tumor subtypes were defined. The CD8+ inflamed subset was characterized by increased CD8+ T-cell infiltration; increased expression of PD-1, PD-L1/2, and CTLA4; increased interferon-γ signaling, which can lead to T-cell exhaustion; and immune invasion. The CD8-inflamed tumors and the VEGF immune desert tumors were enriched for stromal components and for endothelial cells with increased angiogenesis, respectively. The metabolic immune desert tumors demonstrated increased mTORC1 signaling and increased mitochondrial, oxidative phosphorylation and glycolysis profiles but suppressed immune and stromal signaling [62].
Up to a third of RCC samples have enhanced PD-L1 expression while more than half of tumor-infiltrating cells expressed PD-1 [63, 64]. Additionally, the expression of PD-1 and CTLA correlated with worse survival [65]. The JAVELIN Renal 101 trial demonstrated that patients with PD-L1-expressing tumors responded particularly well to avelumab and axitinib compared to sunitinib only with longer progression-free survival and higher objective response rates. High PD-L1 expression was also associated with poor progression-free survival in the sunitinib group, suggesting that patients with high PD-L1 expression may have better outcomes when treated with avelumab and axinitinib [48, 66]. Patients with PD-L1-expressing tumors had an increased progression-free survival in the atezolizumab plus bevacizumab treatment group compared to sunitinib alone or atezolizumab alone groups in the IM motion trials [62, 67]. However, PD-L1 expression did not correlate with treatment response in the KEYNOTE-426 trial comparing pembrolizumab plus axitinib with sunitinib [24].
DISCUSSION
Renal cell carcinoma is composed of diverse sub-types of diseases with each exhibiting unique genomic, transcriptomic, epigenomic, metabolomic and immune signatures that in turn impact metastatic progression and therapeutic outcome. This is particularly exciting in the “Golden Age” era of both targeted therapies and immune checkpoint inhibitors, with multiple options within each class. Learning more about the mutational landscape of RCC and integrating this with the wealth of information gained from pan-omics will help us enter the “Diamond Age” to improve our risk stratification of patients and deliver precision medicine-based treatments where a specific treatment option is tailored to each individual patient’s disease.
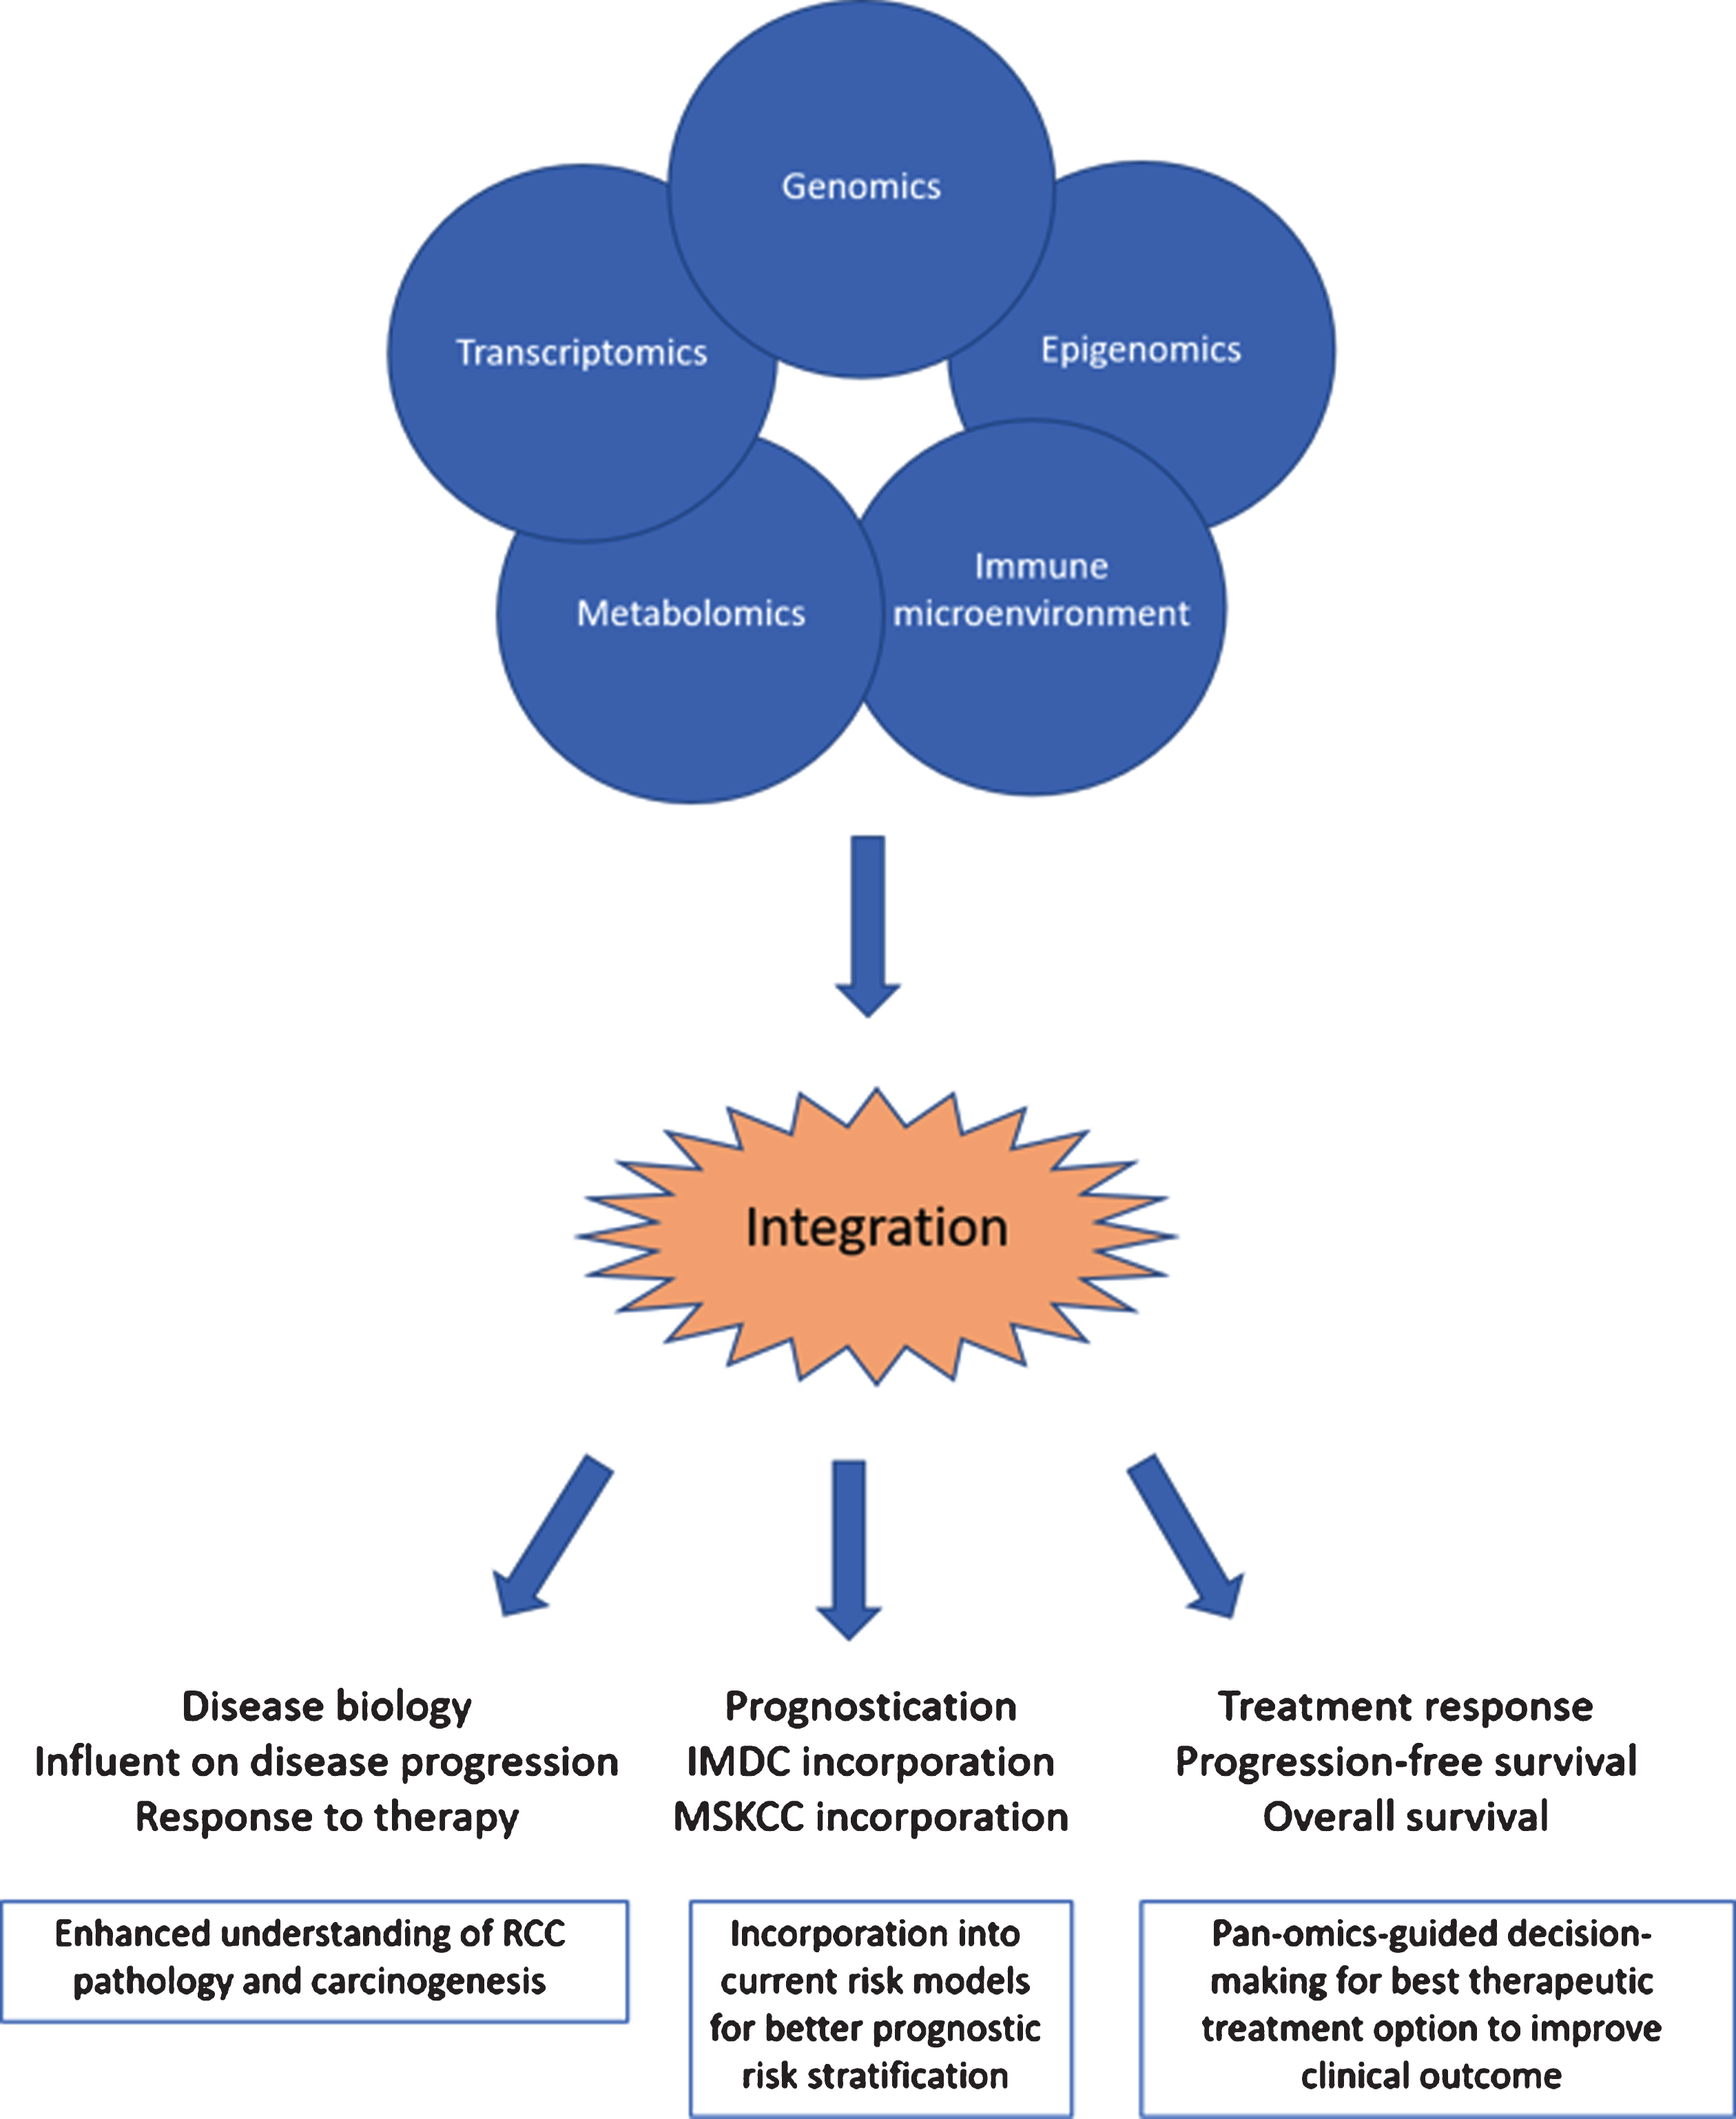
We have just begun to include molecular profiles into risk stratification models, and these early efforts have demonstrated how their inclusion might improve predictive power. Like the ClearCode34 model which integratedtranscriptomic signatures into the IMDC risk stratification model, we can continue to develop more comprehensive models that incorporate our newfound transcriptomic, metabolomic, and immune microenvironment knowledge to our expanding genomic and histologic knowledge to better risk-stratify patients with RCC, improve our prognostic capabilities, and better capture the complex biological dynamics of RCC This can help not only predict disease aggression and prognostic risk but also help determine best treatment options. Additional studies can continue to use molecular profiling to predict response to therapy and overall survival benefit with VEGF or mTORC1 inhibitors or immune checkpoint inhibitors. Many questions still remain about RCC characteristics that are predictors of response, especially in the era of ICIs. Recent studies recognized the discordance among -omic platforms, especially in transcriptome and metabolome data, pointing to the importance of integrating multiple omics data. Hence, our future precision oncology success relies on a successful integration of genomic, epigenomic, transcriptomic and immune signatures from boththe tumor and its microenvironment to develop a better therapeutic response prediction model (Fig. 1). This knowledge can then in turn better inform us about RCC carcinogenesis, which may then lead to the development of further therapeutic options and lead to more rigorous clinical trial design that will be able to better stratify patients according to their disease risk and prognosis. Much work remains to be done to better understand the biology and pathology of RCC and its response to therapies. Our hope is that this personalized medicine approach through integration of our pan-omic knowledge will influence our clinical practice and improve survival and clinical outcomes for patients with renal cell carcinoma.
Fig.1
The integration of pan-omics data alongside information about the immune microenvironment can lead to enhanced understanding of RCC biology, better prognostication models and enhanced decision-making for best therapeutic treatment options to improve clinical outcome.
FUNDING
JJHsieh is supported by NIH NCI R01 CA223231 and U2C CA233303.
AUTHOR CONTRIBUTIONS
Jennifer J. Huang and James J. Hsieh conceived the idea, collected the data, and wrote the manuscript together.
CONFLICT OF INTEREST
JJHsieh is a consultant of Eisai Inc. and receives research funding from BostonGene.
JJHuang has no conflicts of interest to report.
ACKNOWLEDGMENTS
The authors have no acknowledgments.
REFERENCES
[1] | Glover D , et al. Phase II trial of misonidazole (MISO) and cyclophosphamide (CYC) in metastatic renal cell carcinoma. Int J Radiat Oncol Biol Phys. (1986) ;12: (8):1405–8. |
[2] | Rosenberg SA . IL-2: the first effective immunotherapy for human cancer. J Immunol. (2014) ;192: (12):5451–8. |
[3] | Pace MaC DH , A Review of Renal Cell Carcinoma. US Pharm. (2007) ;32: (1):7–21. |
[4] | Klapper JA , et al. High-dose interleukin-2 for the treatment of metastatic renal cell carcinoma: a retrospective analysis of response and survival in patients treated in the surgery branch at the National Cancer Institute between 1986 and 2006. Cancer. (2008) ;113: (2):293–301. |
[5] | Hsieh JJ , et al. Renal cell carcinoma. Nat Rev Dis Primers. (2017) ;3: :17009. |
[6] | Miao D , et al. Genomic correlates of response to immune checkpoint therapies in clear cell renal cell carcinoma. Science. (2018) . |
[7] | Siegel RL , Miller KD , Jemal A . Cancer statistics, 2020. CA Cancer J Clin. (2020) ;70: (1):7–30. |
[8] | Choueiri TK , Motzer RJ . Systemic Therapy for Metastatic Renal-Cell Carcinoma. N Engl J Med. (2017) ;376: (4):354–366. |
[9] | Rosenberg SA , et al. A progress report on the treatment of 157 patients with advanced cancer using lymphokine-activated killer cells and interleukin-2 or high-dose interleukin-2 alone. N Engl J Med. (1987) ;316: (15):889–97. |
[10] | Fyfe G , et al. Results of treatment of 255 patients with metastatic renal cell carcinoma who received high-dose recombinant interleukin-2 therapy. J Clin Oncol. (1995) ;13: (3):688–96. |
[11] | Coppin C , et al. Immunotherapy for advanced renal cell cancer. Cochrane Database Syst Rev. (2005) (1): CD001425. |
[12] | Belardelli F , et al. Interferon-alpha in tumor immunity and immunotherapy. Cytokine Growth Factor Rev. (2002) ;13: (2):119–34. |
[13] | Linehan WM , RickettsCJ. The Cancer Genome Atlas of renal cell carcinoma: findings and clinical implications. Nat Rev Urol. (2019) . |
[14] | Hsieh JJ , et al. Chromosome 3p Loss-Orchestrated VHL, HIF, and Epigenetic Deregulation in Clear Cell Renal Cell Carcinoma. J Clin Oncol. (2018) :JCO2018792549. |
[15] | Cancer Genome Atlas Research N. Comprehensive molecular characterization of clear cell renal cell carcinoma. Nature. (2013) ;499: (7456):43–9. |
[16] | Kaelin WG Jr . The von Hippel-Lindau tumour suppressor protein: O2 sensing and cancer. Nat Rev Cancer. (2008) ;8: (11):865–73. |
[17] | Latif F , et al. Identification of the von Hippel-Lindau disease tumor suppressor gene. Science. (1993) ;260: (5112):1317–20. |
[18] | Signoretti S , et al. Renal Cell Carcinoma in the Era of Precision Medicine: From Molecular Pathology to Tissue-Based Biomarkers. J Clin Oncol. (2018) :JCO2018792259. |
[19] | Kaelin WG Jr . The von Hippel-Lindau tumor suppressor gene and kidney cancer. Clin Cancer Res. (2004) ;10: (18 Pt 2):6290S–5S. |
[20] | Mihaly Z , et al. A comprehensive overview of targeted therapy in metastatic renal cell carcinoma. Curr Cancer Drug Targets. (2012) ;12: (7):857–72. |
[21] | Escudier B , et al. Sorafenib in advanced clear-cell renal-cell carcinoma. N Engl J Med. (2007) ;356: (2):125–34. |
[22] | Escudier B , et al. Sorafenib for treatment of renal cell carcinoma: Final efficacy and safety results of the phase III treatment approaches in renal cancer global evaluation trial. J Clin Oncol. (2009) ;27: (20):3312–8. |
[23] | Motzer RJ , et al. Overall survival and updated results for sunitinib compared with interferon alfa in patients with metastatic renal cell carcinoma. J Clin Oncol. (2009) ;27: (22):3584–90. |
[24] | Rini BI , et al. Pembrolizumab plus Axitinib versus Sunitinib for Advanced Renal-Cell Carcinoma. N Engl J Med. (2019) ;380: (12):1116–1127. |
[25] | Hudes G , et al. Temsirolimus, interferon alfa, or both for advanced renal-cell carcinoma. N Engl J Med. (2007) ;356: (22):2271–81. |
[26] | Hutson TE , et al. Randomized phase III trial of temsirolimus versus sorafenib as second-line therapy after sunitinib in patients with metastatic renal cell carcinoma. J Clin Oncol. (2014) ;32: (8):760–7. |
[27] | Battelli C , Cho DC . mTOR inhibitors in renal cell carcinoma. Therapy. (2011) ;8: (4):359–367. |
[28] | Motzer RJ , et al. Phase 3 trial of everolimus for metastatic renal cell carcinoma: final results and analysis of prognostic factors. Cancer. (2010) ;116: (18):4256–65. |
[29] | Knox JJ , et al. Final overall survival analysis for the phase II RECORD-3 study of first-line everolimus followed by sunitinib versus first-line sunitinib followed by everolimus in metastatic RCC. Ann Oncol. (2017) ;28: (6):1339–1345. |
[30] | Hodi FS , et al. Improved survival with ipilimumab in patients with metastatic melanoma. N Engl J Med. (2010) ;363: (8):711–23. |
[31] | Wei SC , Duffy CR , Allison JP . Fundamental Mechanisms of Immune Checkpoint Blockade Therapy. Cancer Discov. (2018) ;8: (9):1069–1086. |
[32] | Drake CG , Stein MN . The Immunobiology of Kidney Cancer. J Clin Oncol. (2018) :JCO2018792648. |
[33] | Graham J , Dudani S , Heng DYC . Prognostication in Kidney Cancer: Recent Advances and Future Directions. J Clin Oncol. (2018) :JCO2018790147. |
[34] | Motzer RJ , Bacik J , Mazumdar M . Prognostic factors for survival of patients with stage IV renal cell carcinoma: memorial sloan-kettering cancer center experience. Clin Cancer Res. (2004) ;10: (18 Pt 2):6302S–3S. |
[35] | Mekhail TM , et al. Validation and extension of the Memorial Sloan-Kettering prognostic factors model for survival in patients with previously untreated metastatic renal cell carcinoma. J Clin Oncol. (2005) ;23: (4):832–41. |
[36] | Brannon AR , et al. Molecular Stratification of Clear Cell Renal Cell Carcinoma by Consensus Clustering Reveals Distinct Subtypes and Survival Patterns. Genes Cancer. (2010) ;1: (2):152–163. |
[37] | Brannon AR , et al. Meta-analysis of clear cell renal cell carcinoma gene expression defines a variant subgroup and identifies gender influences on tumor biology. Eur Urol. (2012) ;61: (2):258–68. |
[38] | Hsieh JJ , et al. Genomic classifications of renal cell carcinoma: a critical step towards the future application of personalized kidney cancer care with pan-omics precision. J Pathol. (2018) ;244: (5):525–537. |
[39] | Ricketts CJ , et al. The Cancer Genome Atlas Comprehensive Molecular Characterization of Renal Cell Carcinoma. Cell Rep. (2018) ;23: (1):313–326 e5. |
[40] | Nargund AM , et al. The SWI/SNF Protein PBRM1 Restrains VHL-Loss-Driven Clear Cell Renal Cell Carcinoma. Cell Rep. (2017) ;18: (12):2893–2906. |
[41] | Manley BJ , et al. Integration of Recurrent Somatic Mutations with Clinical Outcomes: A Pooled Analysis of 1049 Patients with Clear Cell Renal Cell Carcinoma. Eur Urol Focus. (2017) ;3: (4-5):421–427. |
[42] | Casuscelli J , et al. Molecular Classification of Renal Cell Carcinoma and Its Implication in Future Clinical Practice. Kidney Cancer. (2017) ;1: (1):3–13. |
[43] | Hsieh JJ , et al. Genomic Biomarkers of a Randomized Trial Comparing First-line Everolimus and Sunitinib in Patients with Metastatic Renal Cell Carcinoma. Eur Urol. (2017) ;71: (3):405–414. |
[44] | Casuscelli J , et al. Characterization and Impact of TERT Promoter Region Mutations on Clinical Outcome in Renal Cell Carcinoma. Eur Urol Focus. (2019) ;5: (4):642–649. |
[45] | Xu J , et al. Mechanistically distinct cancer-associated mTOR activation clusters predict sensitivity to rapamycin. J Clin Invest. (2016) ;126: (9):3526–40. |
[46] | Zhang Y , et al. A Pan-Cancer Proteogenomic Atlas of PI3K/AKT/mTOR Pathway Alterations. Cancer Cell. (2017) ;31: (6):820–832 e3. |
[47] | Voss MH , et al. PTEN Expression, Not Mutation Status in TSC1, TSC2, or mTOR, Correlates with the Outcome on Everolimus in Patients with Renal Cell Carcinoma Treated on the Randomized RECORD-3 Trial. Clin Cancer Res. (2019) ;25: (2):506–514. |
[48] | Choueiri TK , et al. Biomarker analyses from JAVELIN Renal 101: Avelumab+ axitinib (A+Ax) versus sunitinib (S) in advanced renal cell carcinoma (aRCC). Journal of Clinical Oncology. (2019) ;37: (15_suppl):101–101. |
[49] | Clark DJ , et al. Integrated Proteogenomic Characterization of Clear Cell Renal Cell Carcinoma. Cell. (2019) ;179: (4):964–983 e31. |
[50] | Mitchell TJ , et al. Timing the Landmark Events in the Evolution of Clear Cell Renal Cell Cancer: TRACERx Renal. Cell. (2018) ;173: (3):611–623 e17. |
[51] | Hakimi AA , et al. Clinical and pathologic impact of select chromatin-modulating tumor suppressors in clear cell renal cell carcinoma. Eur Urol. (2013) ;63: (5):848–54. |
[52] | Gerlinger M , et al. Intratumor heterogeneity and branched evolution revealed by multiregion sequencing. N Engl J Med. (2012) ;366: (10):883–892. |
[53] | Turajlic S , et al. Tracking Cancer Evolution Reveals Constrained Routes to Metastases: TRACERx Renal. Cell. (2018) ;173: (3):581–594 e12. |
[54] | Linehan WM , Ricketts CJ . The Cancer Genome Atlas of renal cell carcinoma: findings and clinical implications. Nat Rev Urol. (2019) ;16: (9):539–552. |
[55] | Voss MH , et al. Genomically annotated risk model for advanced renal-cell carcinoma: a retrospective cohort study. Lancet Oncol. (2018) ;19: (12):1688–1698. |
[56] | Davis CF , et al. The somatic genomic landscape of chromophobe renal cell carcinoma. Cancer Cell. (2014) ;26: (3):319–330. |
[57] | Casuscelli J , et al. Genomic landscape and evolution of metastatic chromophobe renal cell carcinoma. JCI Insight. (2017) ;2: (12). |
[58] | Chen F , et al. Pan-urologic cancer genomic subtypes that transcend tissue of origin. Nat Commun. (2017) ;8: (1):199. |
[59] | Brooks SA , et al. ClearCode34: A prognostic risk predictor for localized clear cell renal cell carcinoma. Eur Urol. (2014) ;66: (1):77–84. |
[60] | de Velasco G , et al. Molecular Subtypes Improve Prognostic Value of International Metastatic Renal Cell Carcinoma Database Consortium Prognostic Model. Oncologist. (2017) ;22: (3):286–292. |
[61] | Hakimi AA , et al. Transcriptomic Profiling of the Tumor Microenvironment Reveals Distinct Subgroups of Clear Cell Renal Cell Cancer: Data from a Randomized Phase III Trial. Cancer Discov. (2019) ;9: (4):510–525. |
[62] | McDermott DF , et al. Clinical activity and molecular correlates of response to atezolizumab alone or in combination with bevacizumab versus sunitinib in renal cell carcinoma. Nat Med. (2018) ;24: (6):749–757. |
[63] | Choueiri TK , et al. Correlation of PD-L1 tumor expression and treatment outcomes in patients with renal cell carcinoma receiving sunitinib or pazopanib: results from COMPARZ, a randomized controlled trial. Clin Cancer Res. (2015) ;21: (5):1071–7. |
[64] | Thompson RH , et al. PD-1 is expressed by tumor-infiltrating immune cells and is associated with poor outcome for patients with renal cell carcinoma. Clin Cancer Res. (2007) ;13: (6):1757–61. |
[65] | Chen F , et al. Multilevel Genomics-Based Taxonomy of Renal Cell Carcinoma. Cell Rep. (2016) ;14: (10):2476–89. |
[66] | Motzer RJ , et al. Avelumab plus Axitinib versus Sunitinib for Advanced Renal-Cell Carcinoma. N Engl J Med. (2019) ;380: (12):1103–1115. |
[67] | Rini BI , et al. Atezolizumab plus bevacizumab versus sunitinib in patients with previously untreated metastatic renal cell carcinoma (IMmotion151): a multicentre, open-label, phase 3, randomised controlled trial. Lancet. (2019) ;393: (10189):2404–2415. |


