
Current Trends in Partial Nephrectomy After Guideline Release: Health Disparity for Small Renal Mass
Abstract
Background:
Renal masses can be surgically treated by partial nephrectomy (PN) or radical nephrectomy (RN); however, in 2009 guidelines recommended PN as the standard of care for cT1a renal masses.
Objective:
To evaluate national trends of surgically appropriate patients using the National Cancer Database (NCDB) for utilization of PN focusing on guideline release, evaluating underlying health disparity.
Methods:
We identified 99,035 patients from 2004–2015 that underwent surgical resection of cT1a renal masses. We evaluated treatment proportions over time of patients treated with PN or RN. Logistic regression was utilized for multivariable analysis.
Results:
PN increased from 40.2% in 2004 to 71.3% in 2015 (p < 0.001). Older patients were more likely to be treated with RN (OR 1.018, p < 0.001), as were those with Charlson score 2 or 3+ (OR 1.288 and 2.074, p < 0.001). Patients with lower income were more likely to be treated with RN (OR 1.186, p < 0.001) as were uninsured patients (OR 1.108, p = 0.018) and low volume centers (OR 1.063, p < 0.001). Females were more likely to undergo RN (OR 1.123, p < 0.001) as were black patients (OR 1.339, p < 0.001). While these demographic trends persisted after the release of the guidelines, all associations decreased except for Charlson score and race. Black patients became more likely to undergo RN (pre-guideline OR 1.248 vs post-guideline OR 1.474, p < 0.001). Patients treated with RN had worsened mortality (17.4% vs. 7.3%, p < 0.001).
Conclusions:
Although use of PN in surgically appropriate patients for cT1a renal masses has increased over time, 30% of patients underwent RN in 2015. Socioeconomic disparities affect treatment decisions and require additional research.
INTRODUCTION
Traditionally, clinical T1 renal masses have been treated with radical nephrectomy (RN). However, in the past few decades there has been an emergence of nephron sparing approaches, including partial nephrectomy (PN), thermal ablation, and active surveillance. Several studies in the last 15 years have investigated the association of chronic kidney disease (CKD) with RN and the correlation between CKD and cardiovascular events and mortality [1–3]. In addition, PN has been shown to be oncologically equivalent to RN [4–7]. These revelations lead to the release of an AUA guideline statement in 2009 stating that nephron sparing approaches should be considered in all patients with cT1a masses, provided oncologic control can be achieved [8]. Historically, RN often remains overutilized and PN underutilized for unclear reasons [9, 10]. However, recent data has suggested the use of PN is increasing in the United States and Europe, with higher volume centers and adoption of robotic surgery associated with increased PN utilization [11, 12].
Based on this information, we aimed to evaluate the current trends in utilization of PN, as compared to RN, for patients deemed appropriate for surgical intervention and identify underlying health disparity. We hypothesized that PN would be increasingly adopted after the 2009 AUA guideline release and socioeconomic factors would correlate with use of RN or PN.
MATERIALS AND METHODS
Data source
The National Cancer Database (NCDB) is a nationwide oncology outcomes database containing information on cancer treatments and outcomes. It captures >70% of cancer cases from more than 1500 accredited facilities in the USA annually [13]. The NCDB contains information on patient demographics, insurance status, treatment facility volume, patient comorbidities, disease stage, and treatment. The data used in the study are derived from a de-identified NCDB file. The American College of Surgeons and the Commission on Cancer have not verified and are not responsible for the analytic or statistical methodology employed, or the conclusions drawn from these data by the investigator.
In this study, the NCDB kidney cancer participant file was queried for all patients treated surgically for renal masses ≤4.0 cm from 2004 to 2015. We aimed to study only those patients deemed clinically fit for surgical extirpation and did not include patients who underwent percutaneous ablation or surveillance. All patients were coded with clinical stage of cT1aN0M0. Patient treatments were categorized as PN or RN utilizing NCDB specified surgical treatment codes. Covariable data included age, race, sex, income status, insurance type, comorbidity, and treatment facility type. Race was reported as white, black or other. Comorbidity was evaluated by Charlson comorbidity index and is coded through the NCDB with values of 0, 1, 2, or 3+. Income status is reported as median household income in categories of < $38,000, $38,000–47,999, $48,000–62,999, and $63,000+. Facilities reporting to the NCDB were classified as low or high volume. Academic facilities and facilities reporting more than 500 new cancer cases per year were classified as high volume, while those with less than 500 new cases were considered low volume. Insurance status is reported as uninsured, private insurance, Medicaid, Medicare, other government insurance, or unknown. Pathologic data included mass size and pathologic tumor stage. Histologic type on final pathology was also recorded. Outcome and survival data included length of stay in hospital, length of follow up in months, and all-cause mortality.
Statistical analysis
Our primary outcome was utilization of treatment modality over time, and secondary outcomes included correlation of treatment utilization with preoperative patient demographics. Demographic and clinical data were compared between the groups treated with PN or RN. Student’s T-test was used for comparison of continuous variables while Pearson chi-square or Fischer’s exact test was used for comparison of categorical variables. Fischer’s exact test was used to compare treatment types between the time period of 2004–2009 (pre-AUA guideline changes) and 2010–2015 (post-AUA guideline changes). Correlation between treatment with RN and covariates was analyzed using multivariate logistic regression. For this multivariable logistic regression, data was analyzed comparing the time period prior to the AUA guideline statement (2004–2009 vs 2010–2015). Preoperative variables included age, race, female race, Charlson score, low income status, lack of insurance, low volume centers, and tumor size. We utilized SPSS v24 (New York, United States) for all analyses, with p value of <0.05 denoting statistical significance.
RESULTS
99,035 patients were identified in the NCDB from 2004 to 2015 treated with surgery for cT1a renal masses defined as ≤4.0 cm. The mean age was 59.5 years at diagnosis. 59.4% of patients were male, 83.7% were white, 12% were black, and 4.3% were another race. The majority of patients (69.3%) had Charlson comorbidity score of 0 and most patients had private insurance (50.1%) or Medicare (39.2%). The mean tumor size was 2.6 cm, and the majority were treated at high volume facilities (77.2%). (Table 1).
Table 1
Patient demographics and clinical tumor characteristics
| Variable | All (n = 99035) | Partial Nephrectomy (n = 61937) | Radical Nephrectomy (n = 37098) | p-value |
| Mean Age | 59.5±12.4 | 58.4±12.3 | 61.4±12.5 | <0.001 |
| Race | <0.001 | |||
| White | 82868 (83.7%) | 52386 (84.6%) | 30482 (82.2%) | |
| Black | 11871 (12.0%) | 6716 (10.8%) | 5155 (13.9%) | |
| Other | 4296 (4.3%) | 2835 (4.6%) | 1461 (3.9%) | |
| Male | 58830 (59.4%) | 37268 (60.2%) | 21562 (58.1%) | <0.001 |
| Charlson | <0.001 | |||
| 0 | 68668 (69.3%) | 44042 (71.1%) | 24626 (66.4%) | |
| 1 | 22554 (22.8%) | 13846 (22.4%) | 8708 (23.5%) | |
| 2 | 5640 (5.7%) | 3094 (5.0%) | 2546 (6.9%) | |
| 3+ | 2173 (2.2%) | 955 (1.5%) | 1218 (3.3%) | |
| Income Status | <0.001 | |||
| < $38,000 | 17005 (17.3%) | 9882 (16.0%) | 7123 (19.4%) | <0.001 |
| $38,000–47,999 | 22220 (22.6%) | 13513 (21.9%) | 870 (23.7%) | |
| $48,000–62,999 | 26527 (27.0%) | 16416 (26.6%) | 10111 (27.5%) | |
| $63,000+ | 32639 (33.2%) | 21810 (35.4%) | 10829 (29.5%) | |
| Insurance Status | <0.001 | |||
| Uninsured | 2581 (2.6%) | 1614 (2.6%) | 967 (2.6%) | 1.000 |
| Private | 49593 (50.1%) | 33756 (54.5%) | 15837 (42.7%) | |
| Medicaid | 5647 (5.7%) | 3641 (5.9%) | 2006 (5.4%) | |
| Medicare | 38849 (39.2%) | 21390 (34.5%) | 17459 (47.1%) | |
| Other Government | 1223 (1.2%) | 814 (1.3%) | 409 (1.1%) | |
| Unknown | 1142 (1.2%) | 722 (1.2%) | 420 (1.1%) | |
| Facility Type | <0.001 | |||
| High Volume | 76501 (77.2%) | 48163 (77.8%) | 28338 (76.4%) | |
| Low Volume | 22534 (22.8%) | 13774 (22.2%) | 8760 (23.6%) | |
| Tumor Size (cm) | 2.6±0.9 | 2.5±0.8 | 2.9±0.8 | <0.001 |
Mean values shown include±standard deviation.
Postoperative characteristics are noted in Table 2. The majority remained stage T1 at final pathology (81.5%), while 3% were upstaged to T3 and 15.4% were recorded as Tx. The majority had clear cell histology (56.1%). The mean length of follow up was 56.2 months and overall mortality rate was 11.0%.
Table 2
Histology and survival outcomes
| Variable | All (n = 99035) | Partial Nephrectomy (n = 61937) | Radical Nephrectomy (n = 37098) | p-value |
| Histology | <0.001 | |||
| Clear cell | 55542 (56.1%) | 35348 (57.1%) | 20194 (54.4%) | |
| Clear cell not otherwise specified | 22342 (22.6%) | 12329 (19.9%) | 10013 (27.0%) | |
| Papillary | 15428 (15.6%) | 10394 (16.8%) | 5034 (13.6%) | |
| Chromophobe | 5546 (5.6%) | 3774 (6.1%) | 1772 (4.8%) | |
| Sarcomatoid | 177 (0.2%) | 92 (0.1%) | 85 (0.2%) | |
| pT stage | <0.001 | |||
| pT0 | 29 (0.0%) | 16 (0.0%) | 11 (0.0%) | |
| pT1 | 80708 (81.5%) | 52078 (84.1%) | 28630 (77.2%) | |
| pT2 | 51 (0.1%) | 23 (0.0%) | 28 (0.1%) | |
| pT3 | 3004 (3.0%) | 1424 (2.3%) | 1580 (4.3%) | |
| pT4 | 15 (0.0%) | 3 (0.0%) | 12 (0.0%) | |
| pTx | 15228 (15.4%) | 8391 (13.5%) | 6837 (18.4%) | |
| Days in Hospital | 3.7±3.8 | 3.5±3.4 | 4.1±4.4 | <0.001 |
| Length of Follow Up (months) | 56.2±33.0 | 53.3±31.2 | 60.8±35.3 | <0.001 |
| Mortality | 10943 (11.0%) | 4492 (7.3%) | 6451 (17.4%) | <0.001 |
Mean values shown include±standard deviation.
Out of the 99,035 patients, 61,937 (62.5%) were treated with PN and the remainder (37.4%) were treated with RN. Those undergoing RN were older (61.4 years vs. 58.4 years, p < 0.001) and had higher Charlson comorbidity scores (p < 0.001). Patients with lower income were more likely to be treated with RN (p < 0.001) as were those treated at low volume facilities (p < 0.001). Tumor size was larger for those treated with RN (2.9 cm vs 2.5 cm) and the rate of incidental upstaging to T3 was higher for RN (4.3% vs 2.3%). Patients undergoing RN had a longer length of hospitalization (4.1 vs 3.5 days) and higher rate of overall mortality at last follow up (17.4% vs 7.3%) (Tables 1 and 2).
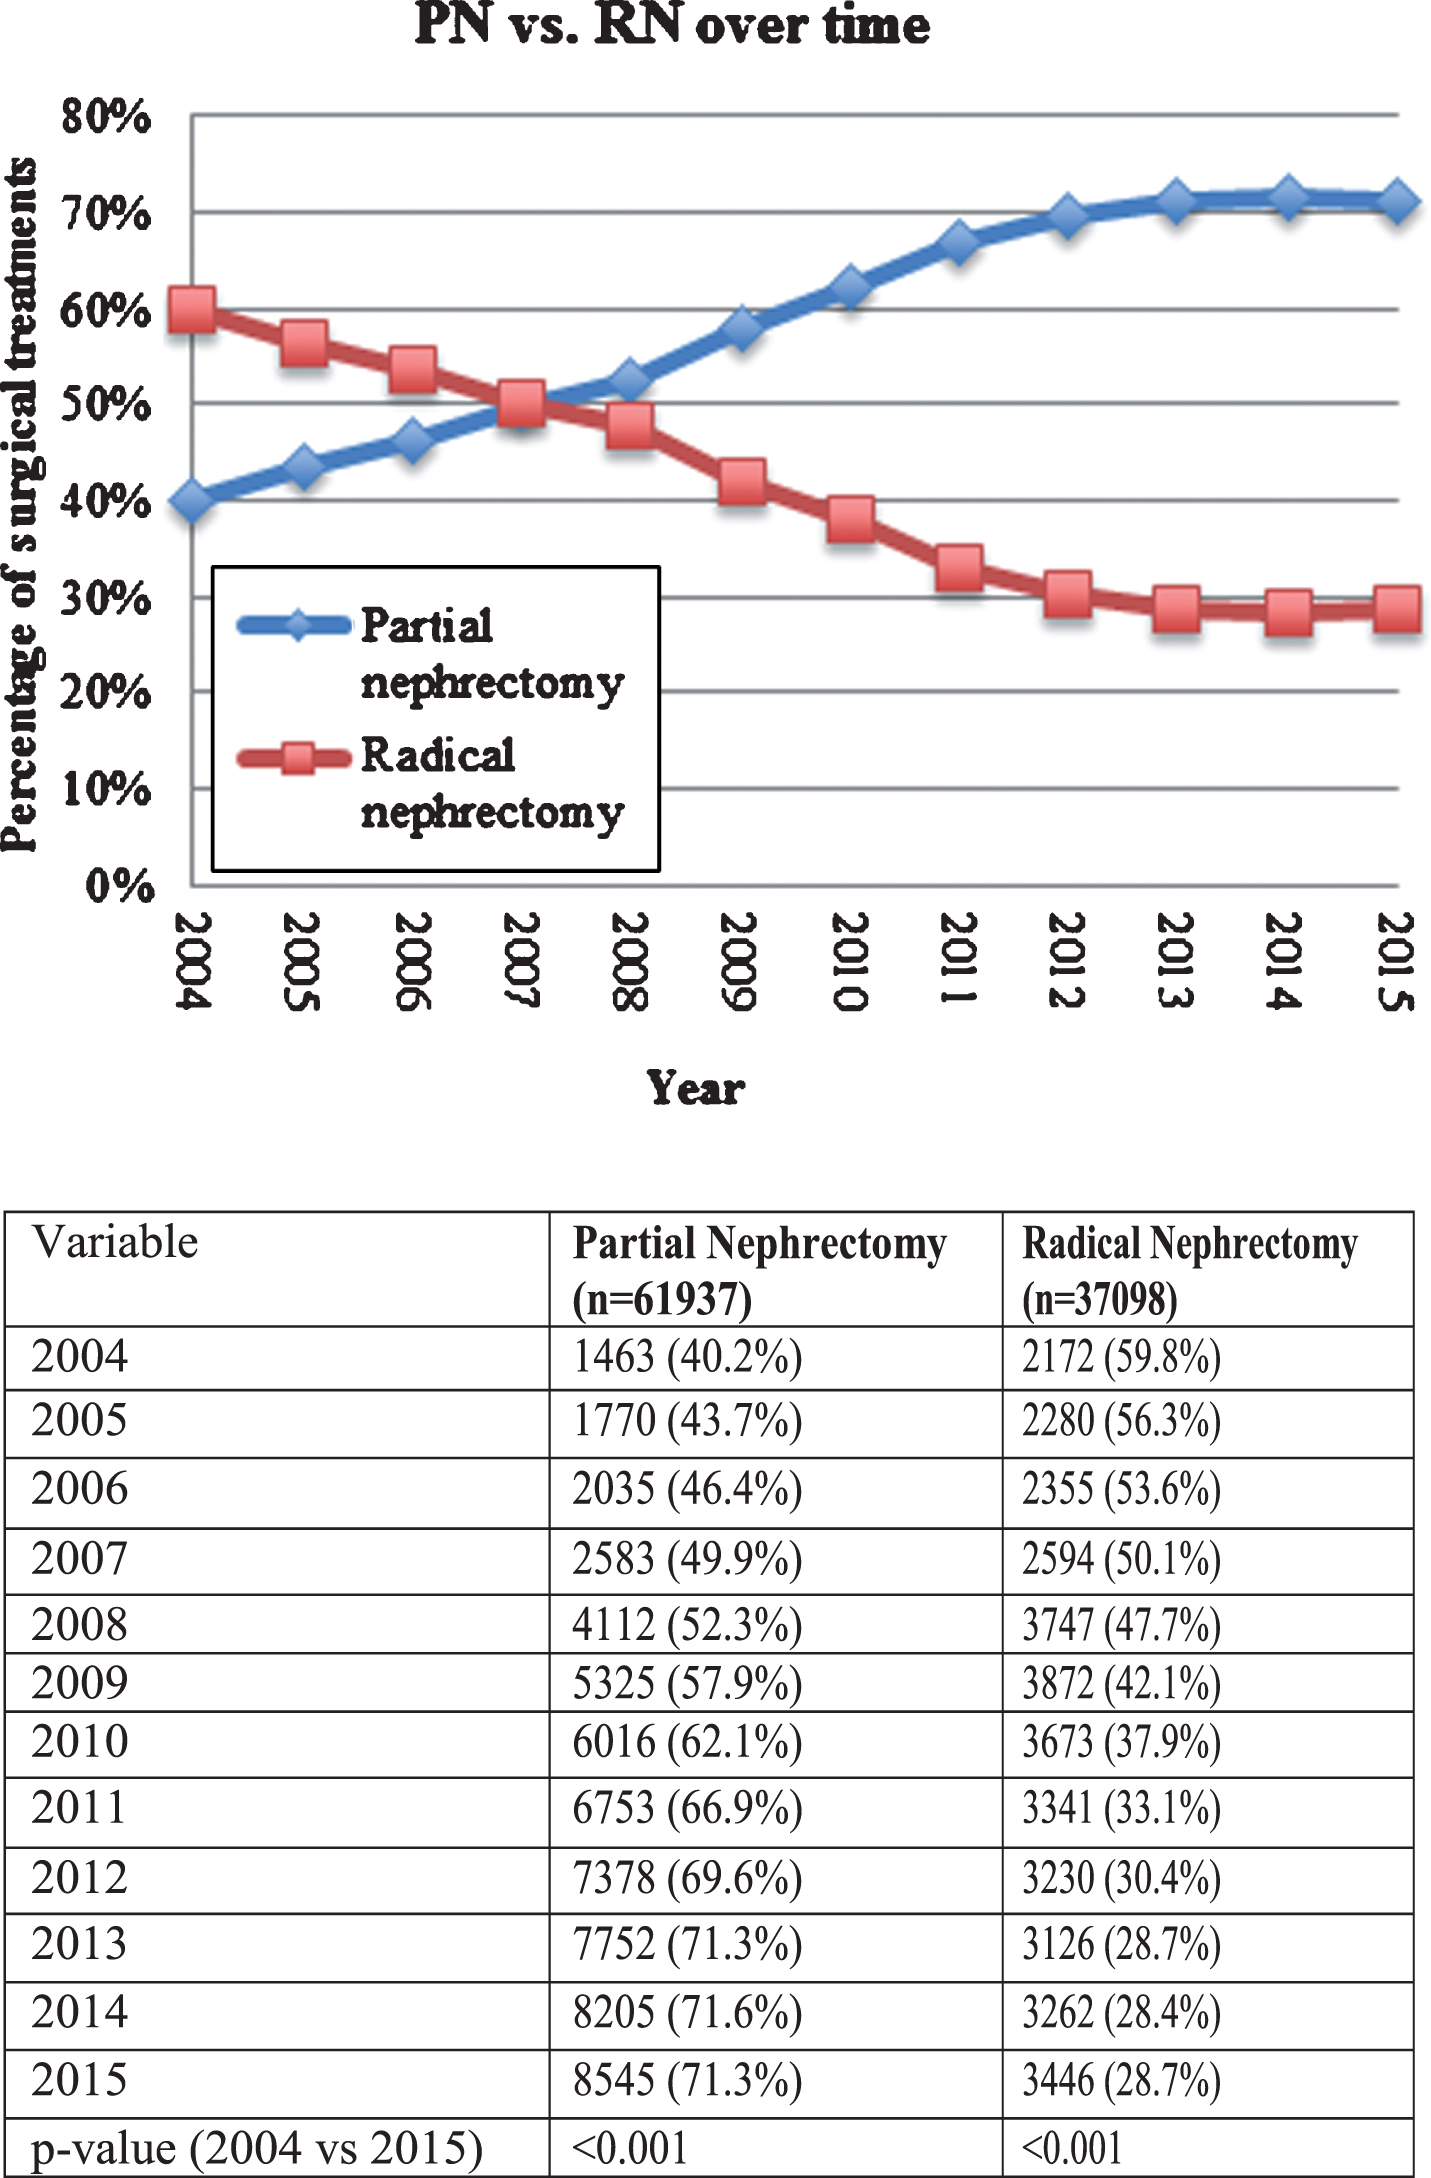
Figure 1 describes the utilization of PN and RN over time, stratified by year of diagnosis. The rate of PN increased from 40.2% in 2004 to 71.3% in 2015. Concordantly, the rate of RN decreased from 59.8% in 2004 to 28.7% in 2015 (p < 0.001). A cubic line-of-best-fit was significant for these corresponding curves (R2 = 0.997, p < 0.001).
Fig.1
Treatment trends over time.
On multivariable logistic regression (Table 3) we found increasing age, black race, female sex, Charlson score ≥2, low income status, lack of insurance, low volume treatment center, and increasing tumor size were significant factors in the pre-AUA guideline era. In the post-AUA guideline era, lack of insurance lost significance. The most significant drivers of RN treatment in the post-AUA guideline era included Charlson score (OR 1.374–2.319, p < 0.001) and black race (OR 1.474, p < 0.001).
Table 3
Logistic regression for Radical Nephrectomy (divided by release of guidelines)
| 2004–2009 | 2010–2015 | |||||||
| Variable | OR | 95% CI low | 95% CI high | p-value | OR | 95% CI low | 95% CI high | p-value |
| Age | 1.021 | 1.019 | 1.023 | <0.001 | 1.017 | 1.016 | 1.019 | <0.001 |
| Race (white ref) | ||||||||
| Black | 1.248 | 1.158 | 1.345 | <0.001 | 1.474 | 1.399 | 1.552 | <0.001 |
| Other | 0.927 | 0.825 | 1.042 | 0.206 | 0.970 | 0.891 | 1.055 | 0.475 |
| Female | 1.166 | 1.114 | 1.221 | <0.001 | 1.091 | 1.053 | 1.130 | <0.001 |
| Charlson Score (0 ref) | ||||||||
| 1 | 1.028 | 0.973 | 1.086 | 0.325 | 1.034 | 0.992 | 1.077 | 0.118 |
| 2 | 1.237 | 1.119 | 1.368 | <0.001 | 1.374 | 1.279 | 1.475 | <0.001 |
| 3+ | 1.985 | 1.669 | 2.361 | <0.001 | 2.319 | 2.083 | 2.581 | <0.001 |
| Low Income | 1.199 | 1.127 | 1.276 | <0.001 | 1.207 | 1.153 | 1.263 | <0.001 |
| Uninsured | 1.292 | 1.109 | 1.506 | 0.001 | 1.101 | 0.991 | 1.223 | 0.074 |
| Low Volume Center | 1.272 | 1.203 | 1.344 | <0.001 | 1.238 | 1.187 | 1.292 | <0.001 |
| Tumor Size | 1.072 | 1.069 | 1.075 | <0.001 | 1.060 | 1.058 | 1.063 | <0.001 |
DISCUSSION
Our analysis of a large United States cancer based registry evaluates trends in the use of PN and RN for surgically appropriate patients over time, with a novel reference to the AUA guideline release in 2009 and correlation with underlying health disparity. We note a significant increase in the use of PN for cT1a renal masses from 2004 to 2015. However, we note that underlying health disparity may be affecting the treatment option for some patients, including female gender and black race. Although an increase in PN which correlates with guideline release is encouraging, the underlying health disparities persist in the post-AUA guideline era and deserve further research.
We identified black race, female gender, low income status, lack of insurance, and low volume centers to be associated with RN treatment on multivariate analysis as well. When comparing the pre-AUA guideline and post-AUA guideline era, a lack of insurance lost significance but other socioeconomic factors remained independently associated with RN. The inherent limitations of a retrospective analysis from a large national registry prevent us from drawing definitive conclusions to these findings; however, unmeasured factors may be driving these correlations and persist despite the effect of time and AUA guideline statements. Interestingly, surgeon volume has been correlated with use of PN both in the United States and in Europe, indicating a potential worldwide disparity [11, 14, 15].
Our analysis is supported by previous literature evaluating the socioeconomic factors related to kidney cancer treatment. Small et al. [16] evaluated the NCDB from 2000 to 2008, prior to the AUA guideline changes, and found that for patients with stage I kidney cancer, black or Hispanic patients, as well as those with lower income or no insurance, were less likely to receive nephron sparing treatment. Kiechle et al. [17] studied the NCDB from 1998 to 2011 and found that black patients were significantly less likely to undergo PN than RN, even when treated at high volume academic or cancer centers. Moskowitz et al. [18] identified patients in the SEER database from 2005 to 2010 treated for renal masses 3 cm or less, and found that black and Hispanic patients were more likely to undergo RN with OR 1.63 and 1.28 respectively. Our own analysis is strengthened by these similar findings and it is important that we relate these ongoing health disparities persisting in a current timeframe even when analyzed by the guideline release. These new findings are important as the underlying health disparities noted by our analysis persist within the post-AUA guideline era. Increased utilization of PN suggests that guidelines are appropriately adjusting surgical management of small renal masses; however, underlying socioeconomic factors continue to drive some aspect of clinical decision making.
Our study provides an updated picture to the literature described above for patients that are deemed appropriate for surgical intervention. Despite multiple previous studies describing racial and socioeconomic disparities in nephron sparing surgery, we found that these disparities continue to exist. To our knowledge, this analysis is the first to compare treatment trends before and after the 2009 AUA guideline statement with focus on underlying health disparity. Sorokin et al found that the use of PN was increasing after AUA guideline release by examining operative logs, but this analysis was unable to evaluate for patient specific health disparity [15]. Similarly, Liss and colleagues used the Nationwide Inpatient Sample and found increases in PN utilization; however, their analysis did not find significant correlations with patient race [19]. We found that since the guideline statement, a potential racial disparity may have increased. Black patients were more likely to be treated with RN with an odds ratio of 1.25 prior to guideline changes, and this increased to 1.47 after 2009. Data has shown that black patients are at a higher risk for CKD and ESRD, and therefore it may be particularly important to preserve renal function in this patient population [20]. It is unclear why these racial disparities exist, but it is important that further research be done to determine the underlying causes in treatment decisions based on race, despite the implementation of AUA guidelines.
An inherent limitation of the NCDB is the underlying patient-provider decision making that determines choice of RN or PN. Importantly, it is well known that PN has a higher rate of urologic complications, including urinary leak and severe hemorrhage [21, 22] and these complications may be more difficult to tolerate in older and sicker patients with decreased life expectancies. Additionally, level one evidence did not identify an overall survival benefit in favor of PN [4], thus patients with complex renal masses or competing mortality risk may be best suited for RN. Concordantly, our analysis only evaluates those patients who were deemed appropriate for surgery. We did not evaluate the use of active surveillance or percutaneous ablation, as we aimed to study those patients who were deemed appropriate for surgical intervention. Furthermore, the NCDB lacks data regarding radiologic tumor characteristics that can also affect treatment decisions. However, in our study on multivariate analysis we found that patients increasing age, Charlson score of ≥2, and increasing tumor size were independently associated with RN treatment. These findings likely relate to these confounding factors leading to treatment choice. There are other notable limitations to our study. We were limited to the variables available through the NCDB, and therefore could not account for other factors that may have influenced treatment approach such as baseline renal function or surgeon experience. In addition, patient preference for a particular treatment may be an important factor that could not be accounted for in this study. While the NCDB accounts for a large number of cancer cases in the United States, we cannot ensure that the database is representative of the full population in the United States and may not directly correlate with other health care systems throughout the world.
CONCLUSIONS
The use of PN has increased over the past 10 years and correlates with AUA guideline release; however, racial and socioeconomic disparities exist and may affect the treatment decision for RN even in the post-AUA guideline era. Due to the well-documented advantages of nephron sparing surgery for small renal masses, it is important that the underlying causes of these disparities are better understood. Further research is needed to determine what factors are influencing surgical treatment decisions.
CONFLICT OF INTEREST
The authors have no conflict of interest to report.
AUTHORS’ CONTRIBUTIONS
Authors whose names appear on the submission have made substantial contributions to the work; writing the article; approve the final version to be published; agreed to be accountable for the accuracy and integrity of the work.
ACKNOWLEDGMENTS
None.
REFERENCES
[1] | McKiernan J , Simmons R , Katz J , et al. Natural history of chronic renal insufficiency after partial and radical nephrectomy. Urology. (2002) ;59: :816. |
[2] | Thompson RH , Boorjian SA , Lohse CM , et al. Radical nephrectomy for pT1a renal masses may be associated with decreased overall survival compared to partial nephrectomy. J Urol. (2008) ;179: :468. |
[3] | Go AS , Chertow GM , Fan D , et al. Chronic kidney disease and the risks of death, cardiovascular events, and hospitalization. N Engl J Med. (2004) ;351: :1296. |
[4] | Van Poppel H , Da Pozzo L , Albrecht W , et al. A prospective randomized EORTC intergroup phase 3 study comparing the oncologic outcome of elective nephron-sparing surgery and radical nephrectomy for low-stage renal cell carcinoma. Eur Urol. (2011) ;59: :543–52. |
[5] | Lee CT , Katz J , Shi W , et al. Surgical management of renal tumors 4cm. or less in a contemporary cohort. J Urol. (2000) ;163: :730. |
[6] | Lau WK , Blute ML , Weaver AL , et al. Matched comparison of radical nephrectomy vs. nephron-sparing surgery in patients with unilateral renal cell carcinoma and a normal contralateral kidney. Mayo Clin Proc. (2000) ;75: :1236. |
[7] | Leibovich BC , Blute ML , Cheville JC , et al. Nephron sparing surgery for appropriately selected renal cell carcinoma between 4 and 7cm results in outcome similar to radical nephrectomy. J Urol. (2004) ;171: :1066. |
[8] | Campbell SC , Novick AC , Belldegrun A , et al. Guideline for management of the clinical T1 renal mass. J Urol. (2009) ;182: :1271–9. |
[9] | Hollenbeck BK , Taub DA , Miller DC , et al. National utilization trends of partial nephrectomy for renal cell carcinoma: A case of underutilization? Urology. (2006) ;67: :254. |
[10] | Miller DC , Hollingsworth JM , Hafez KS , et al. Partial nephrectomy for small renal masses: An emerging quality of care concern? J Urol. (2006) ;175: :853. |
[11] | Simon G , De Nunzio C , Ferriero M , et al. Trends in the use of partial nephrectomy for cT1 renal tumors: Analysis of a 10-yr European multicenter dataset. Eur J Surg Oncol. (2016) ;42: (11), 1729–35. |
[12] | Jabaji RB , Fischer H , Kern T , et al. Trend of surgical treatment of localized renal cell carcinoma. Perm J. (2019) ;23: :18–108. |
[13] | Bilimoria KY , Stewart AK , Winchester DP , Ko CY . The National Cancer Data Base: A powerful initiative to improve cancer care in the United States. Ann Surg Oncol. (2008) ;15: :683–90. |
[14] | Meyer C , Hansen J , Becker A , et al. The adoption of nephron-sparing surgery in Europe –A trend analysis in two referral centers from Austria and Germany. Urol Int. (2016) ;96: (3), 330–6. |
[15] | Sorokin I , Feustel PJ , O’Malley RL . National utilization of partial nephrectomy pre- and post- AUA guidelines: Is this as good as it gets? Clin Genitourin Cancer ((2017) ;15: (5), 591–7. |
[16] | Small AC , Tsao CK , Moshier EL , et al. Trends and variations in utilization of nephron-sparing procedures for stage I kidney cancer in the United States. World J Urol. (2013) ;31: :1211–7. |
[17] | Kiechle JE , Abouassaly R , Gross CP , Dong S , et al. Racial disparities in partial nephrectomy persist across hospital types: Results from a population-based cohort. Urology. (2016) ;90: :69–74. |
[18] | Moskowitz D , Chang J , Ziogas A , Anton-Culver H , Clayman RV . Treatment for T1a renal cancer substratified by size: “Less is more”. J Urol. (2016) ;196: :1000–7. |
[19] | Liss MA , Wang S , Palazzi K , et al. Evaluation of national trends in the utilization of partial nephrectomy in relation to the publication of the American Urologic Association guidelines for the management of clinical T1 renal masses. BMC Urol. (2014) ;14: :101. |
[20] | Collins AJ , Foley RN , Chavers B , et al. United states renal data system 2011 annual data report: Atlas of chronic kidney disease & end-stage renal disease in the United States. Am J Kidney Dis. (2012) ;59: (A7), e1–e420. |
[21] | Van Poppel H , Pozzo LD , Albrecht W , et al. A prospective randomized EORTC intergroup phase 3 study comparing the complications of elective nephron-sparing surgery and radical nephrectomy for low-stage renal cell carcinoma. Eur Urol. (2007) ;51: :1606. |
[22] | Tanagho YS , Kaouk JH , Allaf ME , Rogers CG , Stifelman MD , Kaczmarek BF , et al. Perioperative complications of robot-assisted partial nephrectomy: Analysis of 886 patients at 5 United States centers. Urology. (2013) ;81: (3), 573e579. |


