Extracellular volume fraction of liver and pancreas using spectral CT in hypertensive patients: A comparative study
Abstract
BACKGROUND:
Besides the direct impact on the cardiovascular system, hypertension is closely associated with organ damage in the kidneys, liver, and pancreas. Chronic liver and pancreatic damage in hypertensive patients may be detectable via imaging.
OBJECTIVE:
To explore the correlation between hypertension-related indicators and extracellular volume fraction (ECV) of liver and pancreas measured by iodine maps, and to evaluate corresponding clinical value in chronic damage of liver and pancreas in hypertensive patients.
METHODS:
A prospective study from June to September 2023 included abdominal patients who underwent contrast-enhanced spectral CT. Normal and various grades of hypertensive blood pressure groups were compared. Upper abdominal iodine maps were constructed, and liver and pancreatic ECVs calculated. Kruskal-Wallis and Spearman analyses evaluated ECV differences and correlations with hypertension indicators.
RESULTS:
In 300 patients, hypertensive groups showed significantly higher liver and pancreatic ECV than the normotensive group, with ECV rising alongside hypertension severity. ECVliver displayed a stronger correlation with hypertension stages compared to ECVpancreas. Regression analysis identified hypertension severity as an independent predictor for increased ECV.
CONCLUSIONS:
ECVliver and ECVpancreas positively correlates with hypertension indicators and serves as a potential clinical marker for chronic organ damage due to hypertension, with ECVliver being more strongly associated than ECVpancreas.
1Introduction
Hypertension is one of the most common chronic disease among middle-aged and elderly individuals. With the global population continues to age, the estimated global population affected by hypertension has approximately doubled from 650 million in 1990 to 1.3 billion in 2019 over the past 30 years [1]. Besides the direct impact on the cardiovascular system, hypertension is closely associated with organ damage in the kidneys, liver, and pancreas [2, 3].
Conventional CT technique only uses single-energy polychromatic X-rays and has an inherent limitation in soft tissue differentiation since the CT number entirely depends on the linear attenuation coefficient which has overlap between different body materials. By contrast, spectral CT uses dual-energy X-rays to capture detailed images of internal body structures, which provides more detailed information about the composition of tissues and structures within the body. Spectral CT provides a range of novel images, including material decomposition images, monoenergetic images, effective atomic number images, and virtual unenhanced images. These images enable the quantitative measurement of various tissues and lesions, such as material concentration, monoenergetic CT values, and effective atomic numbers [4]. Material-specific images play a particularly important role in spectral CT. Iodine-water are the most common basis pairs in clinical practice. Iodine maps is served as a quantitative indicator of iodine concentration and primarily reflects tissue enhancement [5].
The extracellular matrix (ECM) plays a crucial role in regulating essential biological processes, including cell proliferation and metabolism. The change of ECM indicates the occurrence and progression of diseases, such as organ fibrosis and potential malignancy [6, 7]. In animal and clinical studies [8, 9], the feasibility of predicting chronic liver damage has been demonstrated. Tissue biopsy remains the gold standard for evaluating chronic damage to organs such as the liver and pancreas. This invasive procedure provides a direct histological evidence of tissue status which is associated with certain risks and limitations. In recent years, imaging techniques, such as spectral CTs and MRI, have been used in non-invasive assessment of organ damage. Specifically, the extracellular volume fraction (ECV) could be considered a significant non-invasive and non-destructive measurement index to evaluate the extent of chronic organ tissue damage and fibrosis [10]. The consistency between ECM achieved from tissue biopsies and ECV derived from imaging examinations has been demonstrated. Additionally, ECV can effectively reveal the changes in ECM [11]. However, few studies focus on the correlation between hypertension and ECV of liver and pancreas.
Therefore, this study aims to explore the correlation between hypertension-related indicators and ECV of liver and pancreas measured by spectral CT, to provide novel imaging indicators for early intervention and treatment of hypertension in clinical practice, and to provide a more comprehensive scientific basis of hypertensive pathogenesis and prevention.
2Materials and methods
2.1Study population
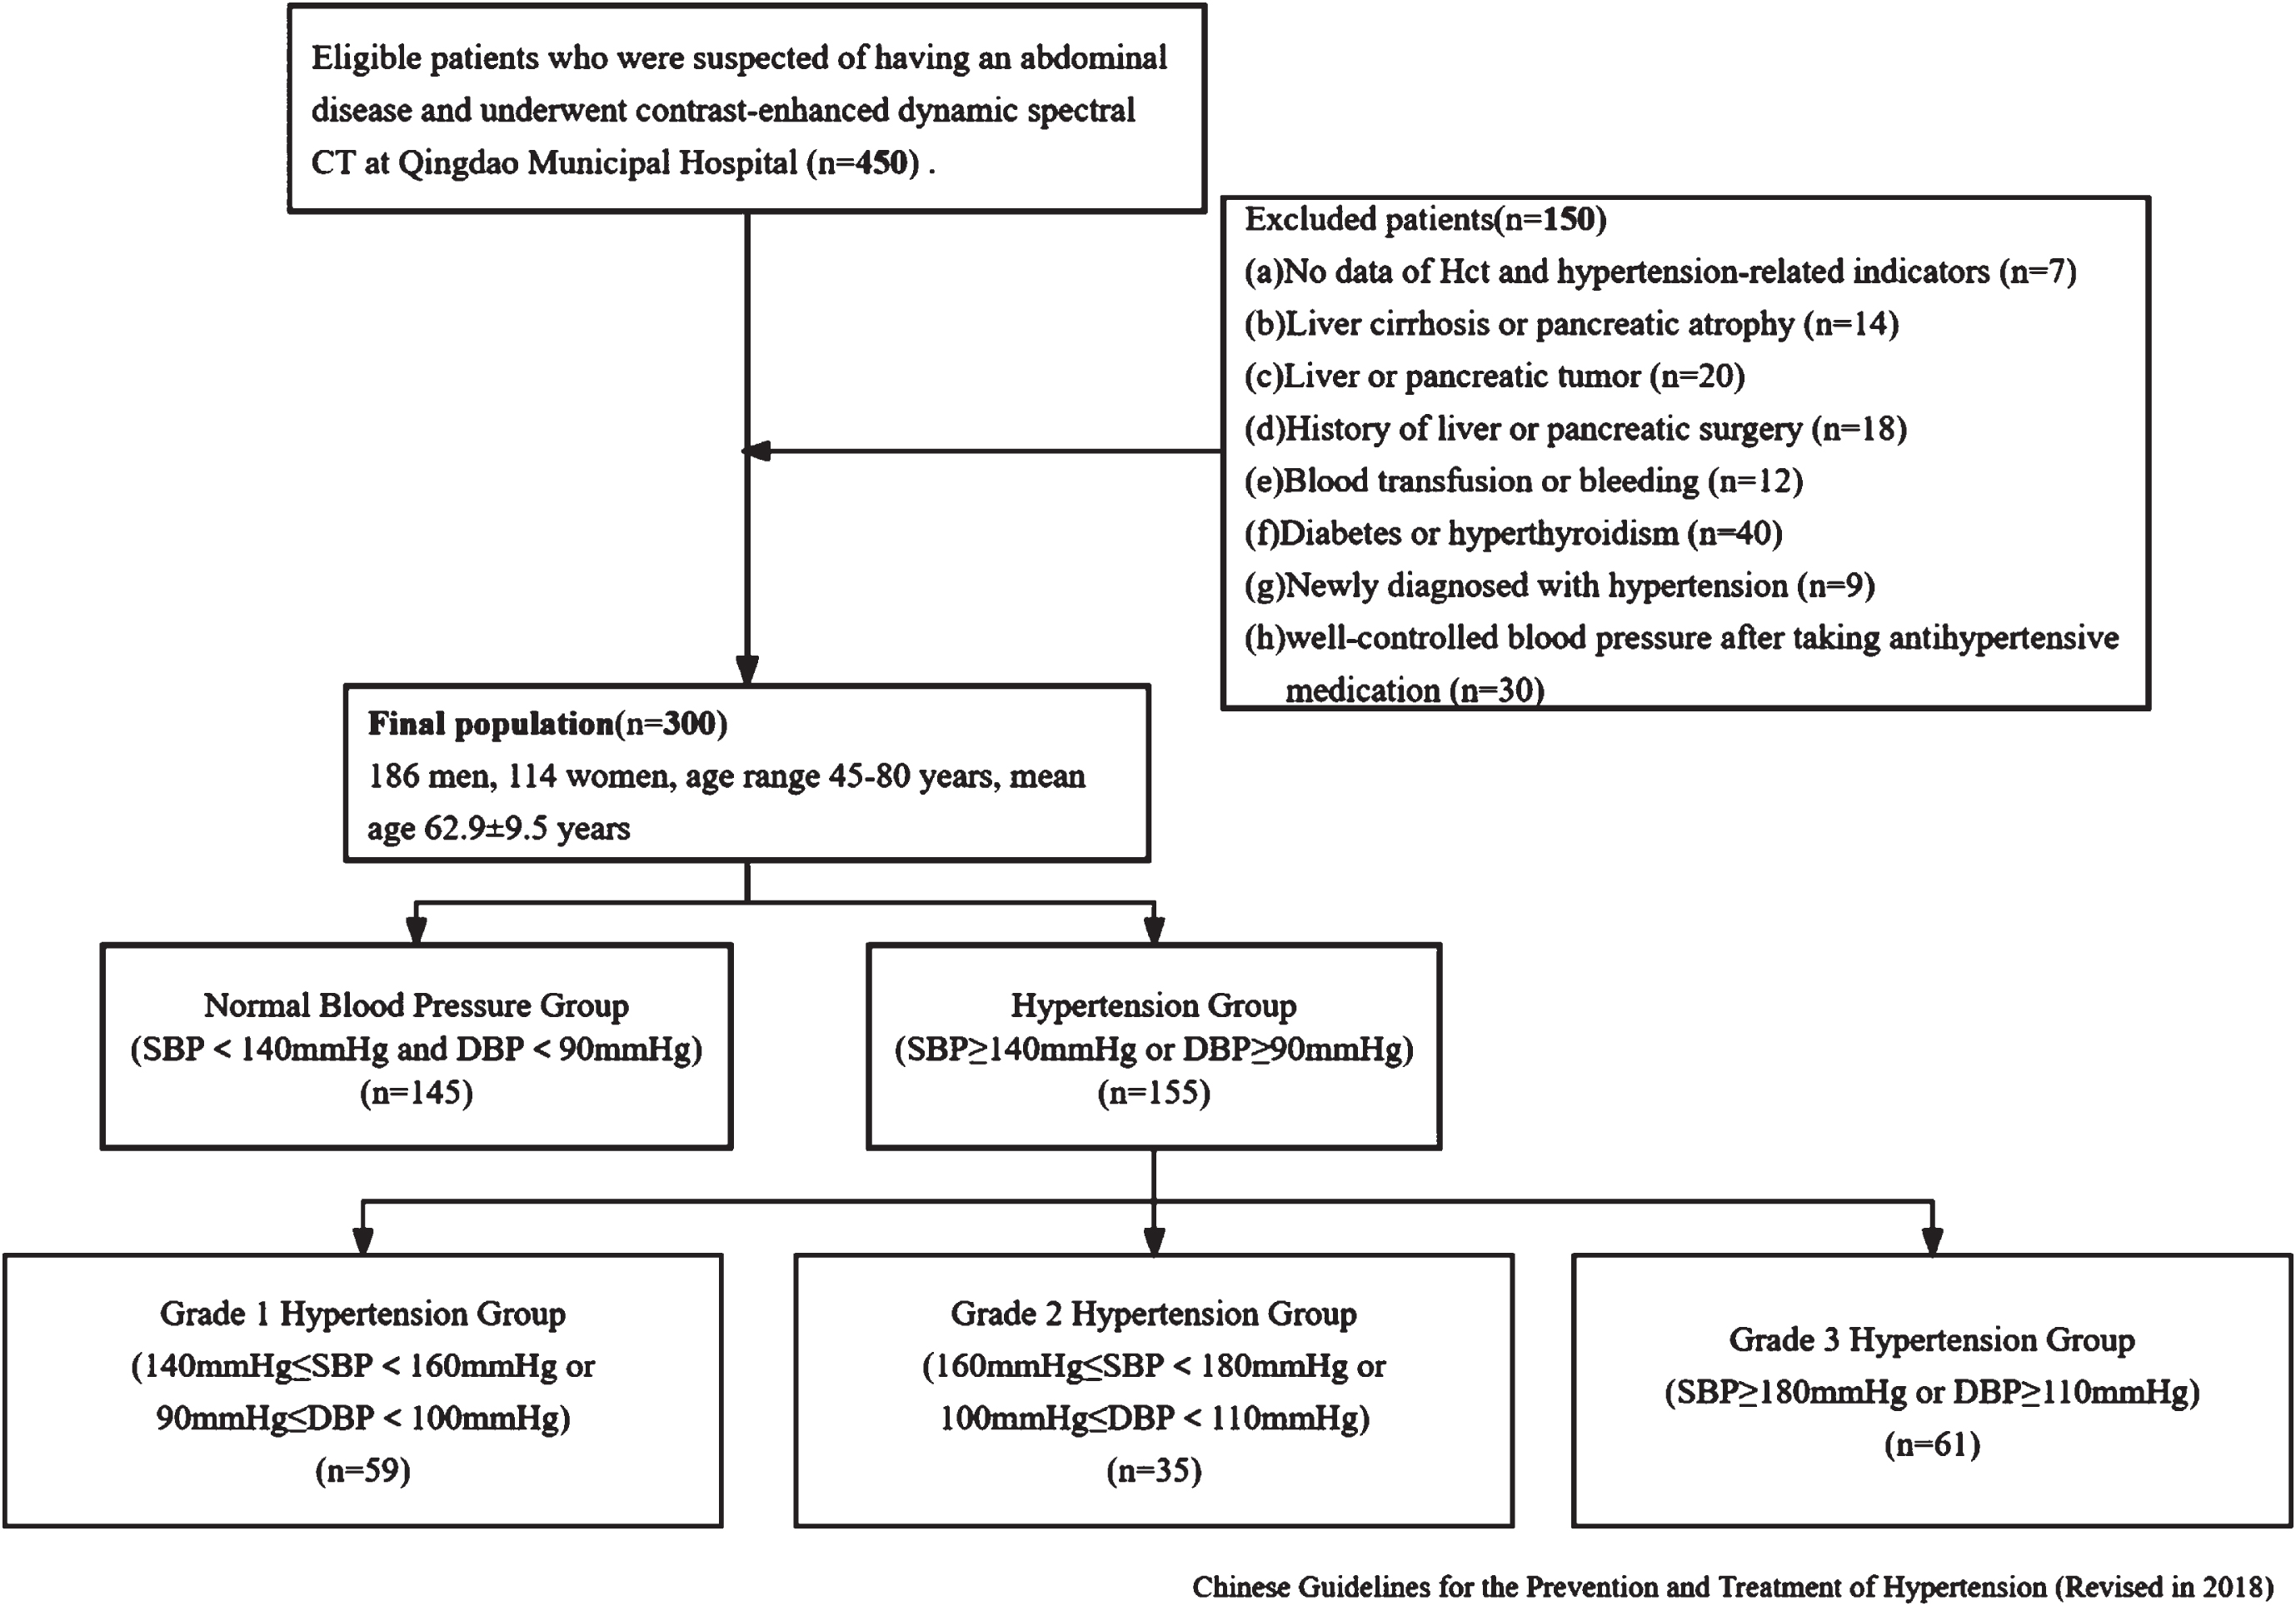
From June 2023 to September 2023, a total of 450 consecutive patients who were suspected of having an abdominal disease and underwent multiphasic contrast-enhanced dynamic spectral CT at Qingdao Municipal Hospital were collected. This retrospective study was approved by our Institutional Review Board. The exclusion criteria were as follows: absence of the data of hematocrit (Hct) and hypertension-related indicators (n = 7), severe liver cirrhosis or pancreatic atrophy (n = 14), liver or pancreatic tumor (n = 30), history of liver or pancreatic surgery (n = 18), blood transfusion or bleeding (n = 12), diabetes or hyperthyroidism (n = 40), newly diagnosed with hypertension (n = 9), and with a history of hypertension but well-controlled blood pressure after taking antihypertensive medication (n = 30). Following the exclusions, 300 patients (mean age, 62.9±9.5 years; age range, 45–80 years; 186 men) were included and were diagnosed as normal pressure group (n = 145) and hypertension (n = 155). The hypertension group were further classified into three groups according to Chinese Guidelines for the Prevention and Treatment of Hypertension (Revised in 2018), as shown in Fig. 1.
Fig. 1
Flowchart of the study design.
2.2CT Scan Acquisition
All patients underwent a three-phase contrast-enhanced CT scan of the upper abdomen using a Revolution CT scanner (GE Healthcare, Milwaukee, WI, USA). The scan parameters were as follows: tube voltage of 80/140 kVp (fast switching mode), tube current of 405 mA, pitch of 0.992 : 1, rotation speed of 0.5 s/rot, and reconstruction slice thickness of 1.25 mm. The contrast agent (320 mgI/ml; Hengrui Medicine Co., Ltd., Jiangsu, China) was injected using high-pressure syringe at 1.2 mL/kg bodyweight via antecubital vein at 2.0 mL/s. Scan delay for arterial, portal venous, and equilibrium phases were 30, 60, and 180 s, respectively. In the equilibrium phase, the distribution of iodine contrast agent in the extravascular-extracellular and intravascular spaces was stable. The extracellular volume fraction (ECV) was calculated based on the iodine maps in the equilibrium phase [12, 13].
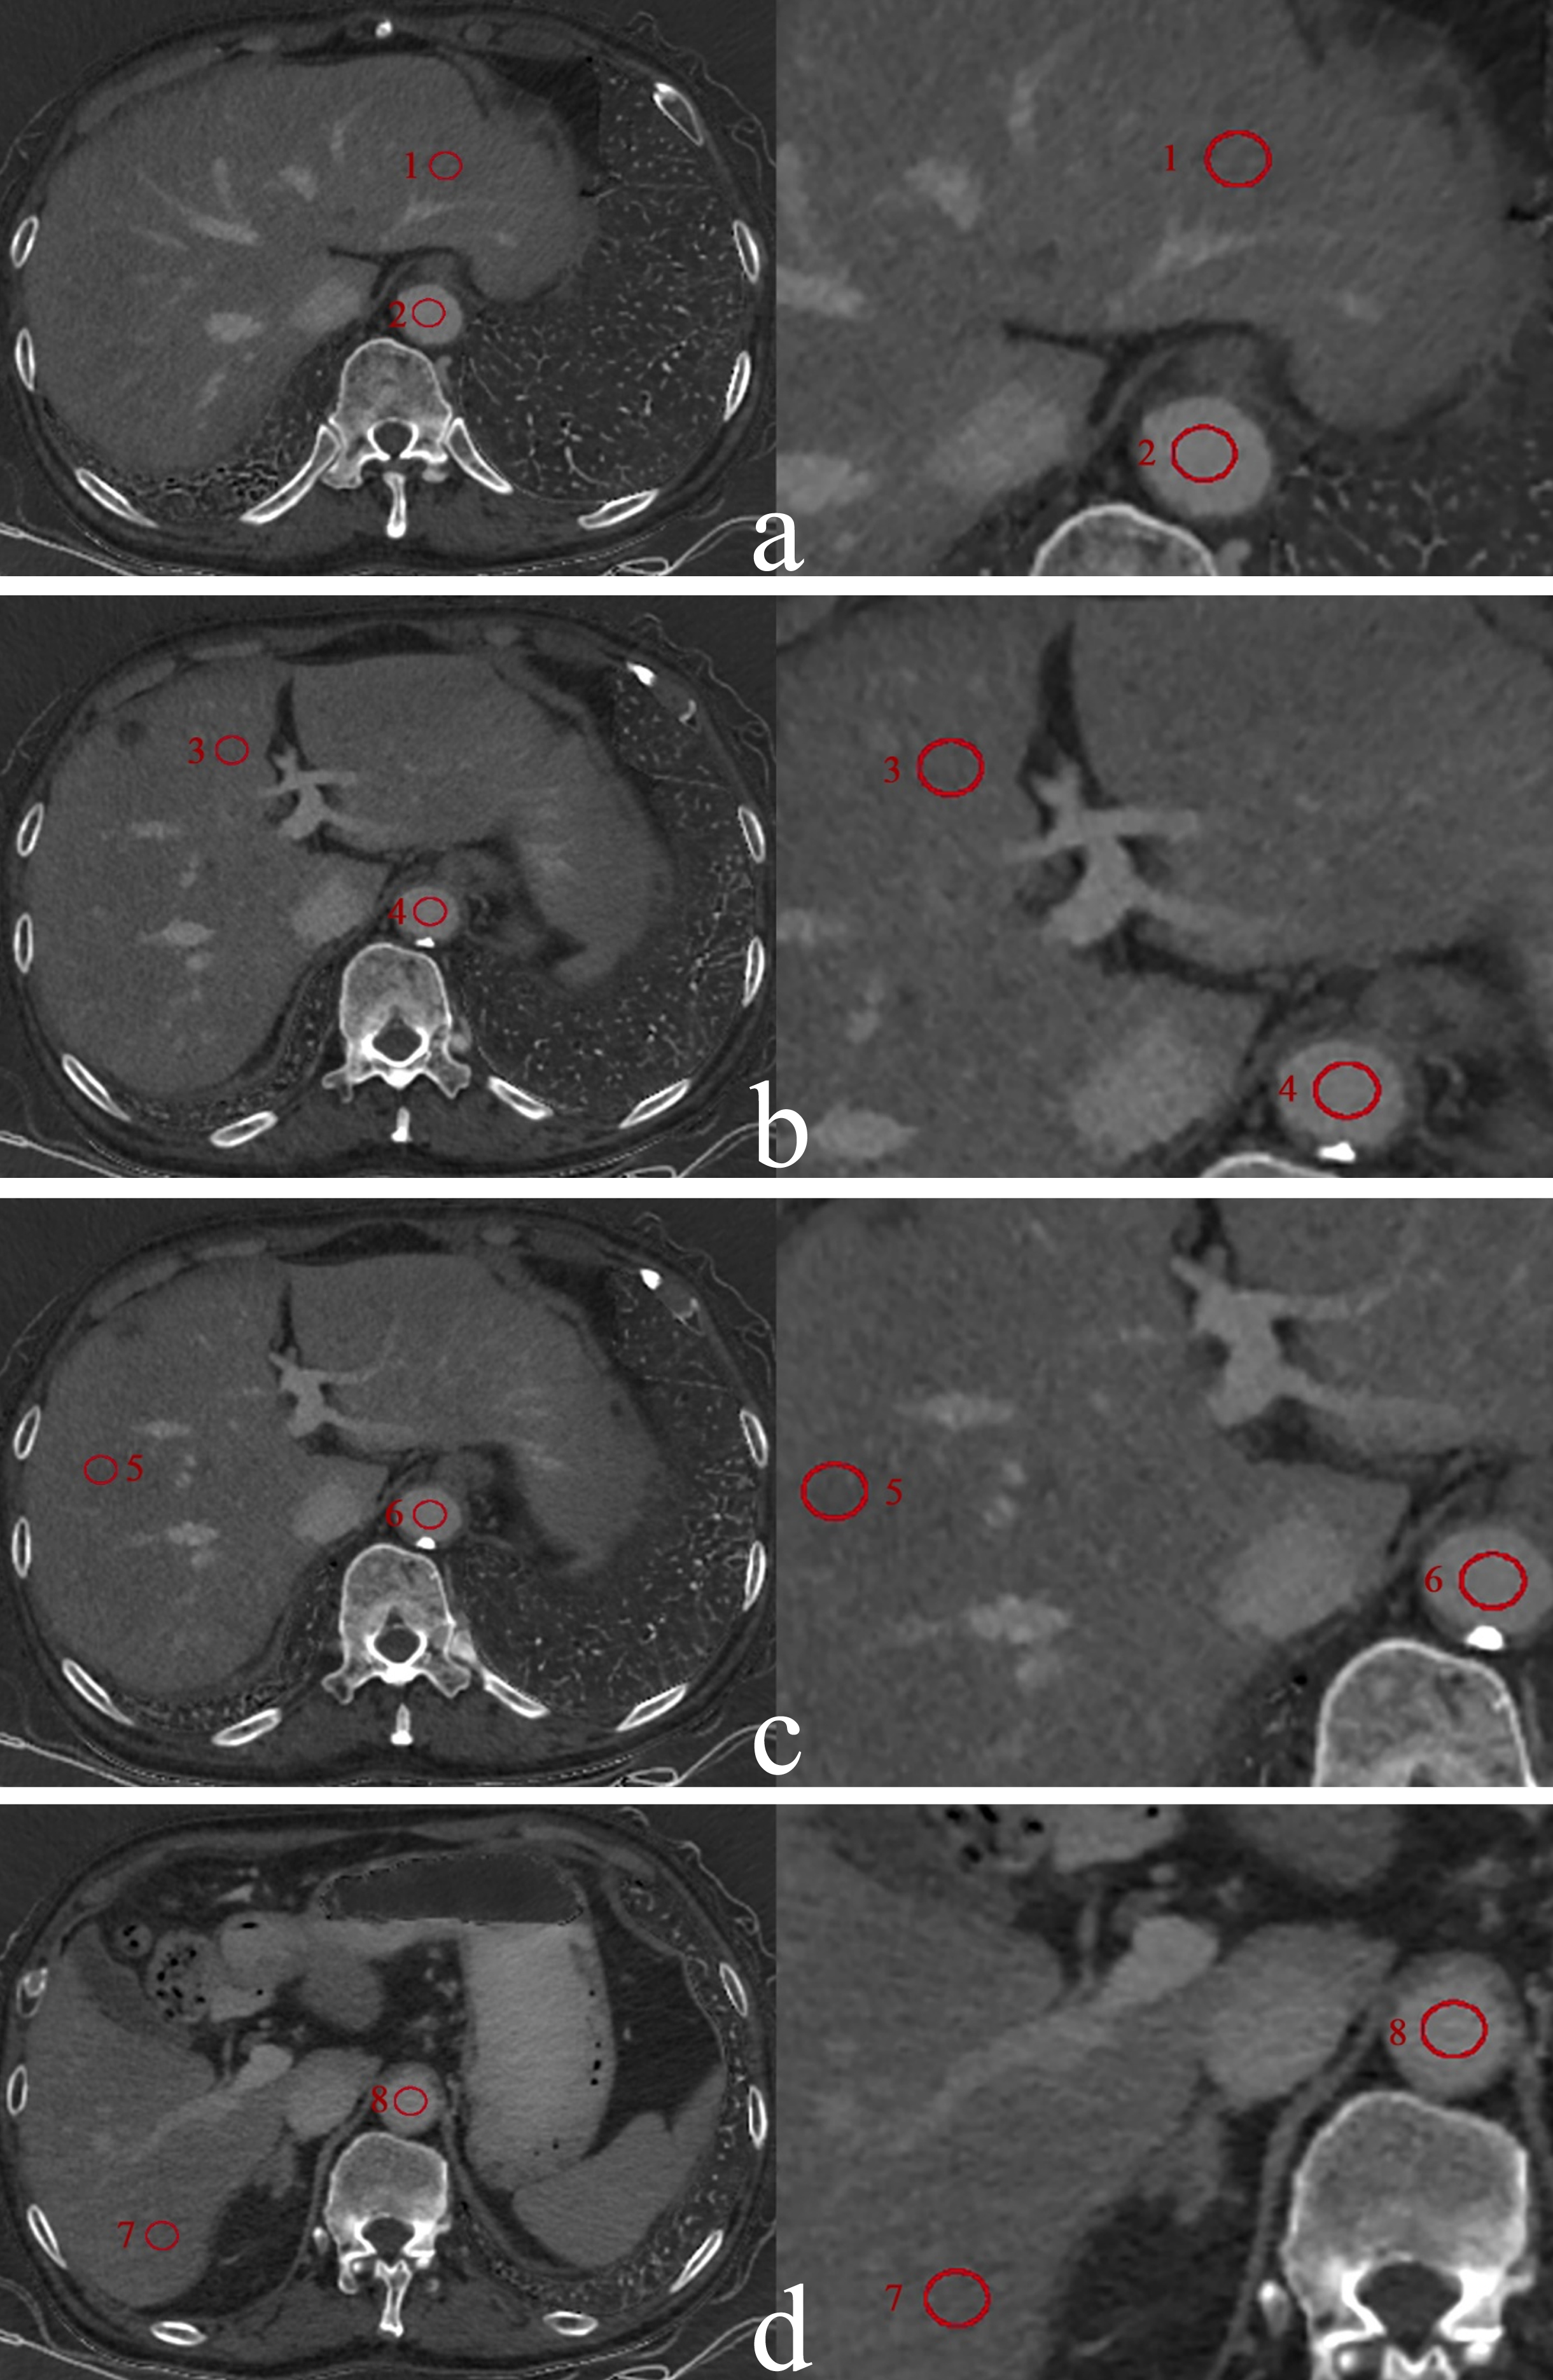
The data were sent to the ADW4.7 workstation (GE Healthcare) and the GSI software was used for image post-processing and measurement. For liver, circular regions of interest (ROIs) with an area of approximately 100 mm2 were placed on left lateral lobe, left medial lobe, right anterior lobe, and right posterior lobe. For pancreas, circular ROIs with an area of approximately 50 mm2 were placed on pancreatic head, body, and tail. All delineations were avoided intrahepatic bile ducts, blood vessels, and calcifications. Since the volume of liver is significantly larger than that of pancreas, the areas of ROI placed in liver and pancreas were 100 mm2 and 50 mm2, respectively and the ROIs with the same size were also placed on abdominal aorta at the same slice, as shown in Figs. 2 and 3. Figure 2 illustrates the placement of regions of interest (ROIs) by a radiologist on the iodine maps of a primary hypertension patient during the equilibrium phase. The ROIs, each with an area of 50 mm2, were positioned on the pancreatic head, body, and tail. Additionally, ROIs of the same size were placed on the abdominal aorta at the corresponding slice level to facilitate comparative analysis. Figure 3 depicts the ROIs drawn by a radiologist on the iodine maps of a primary hypertension patient during the equilibrium phase to measure liver iodine density. The ROIs, each with an area of 100 mm2, were placed on the left lateral lobe, left medial lobe, right anterior lobe, and right posterior lobe of the liver. Similarly, ROIs of the same size were placed on the abdominal aorta at the corresponding slice level for comparative measurements.
Fig. 2
The measurement of ECVpancreas in a 75-year-old man with primary hypertension in Grade 1 hypertension group. Pancreatic iodine maps (iodine-water basic pair) were generated from spectral CT in equilibrium phase at the level of pancreatic head (a), body (b), and tail (c). Six red circles represent the ROIs placed in the head (1), body (3), tail (5), and abdominal aorta at the same level (2, 4, 6), respectively.
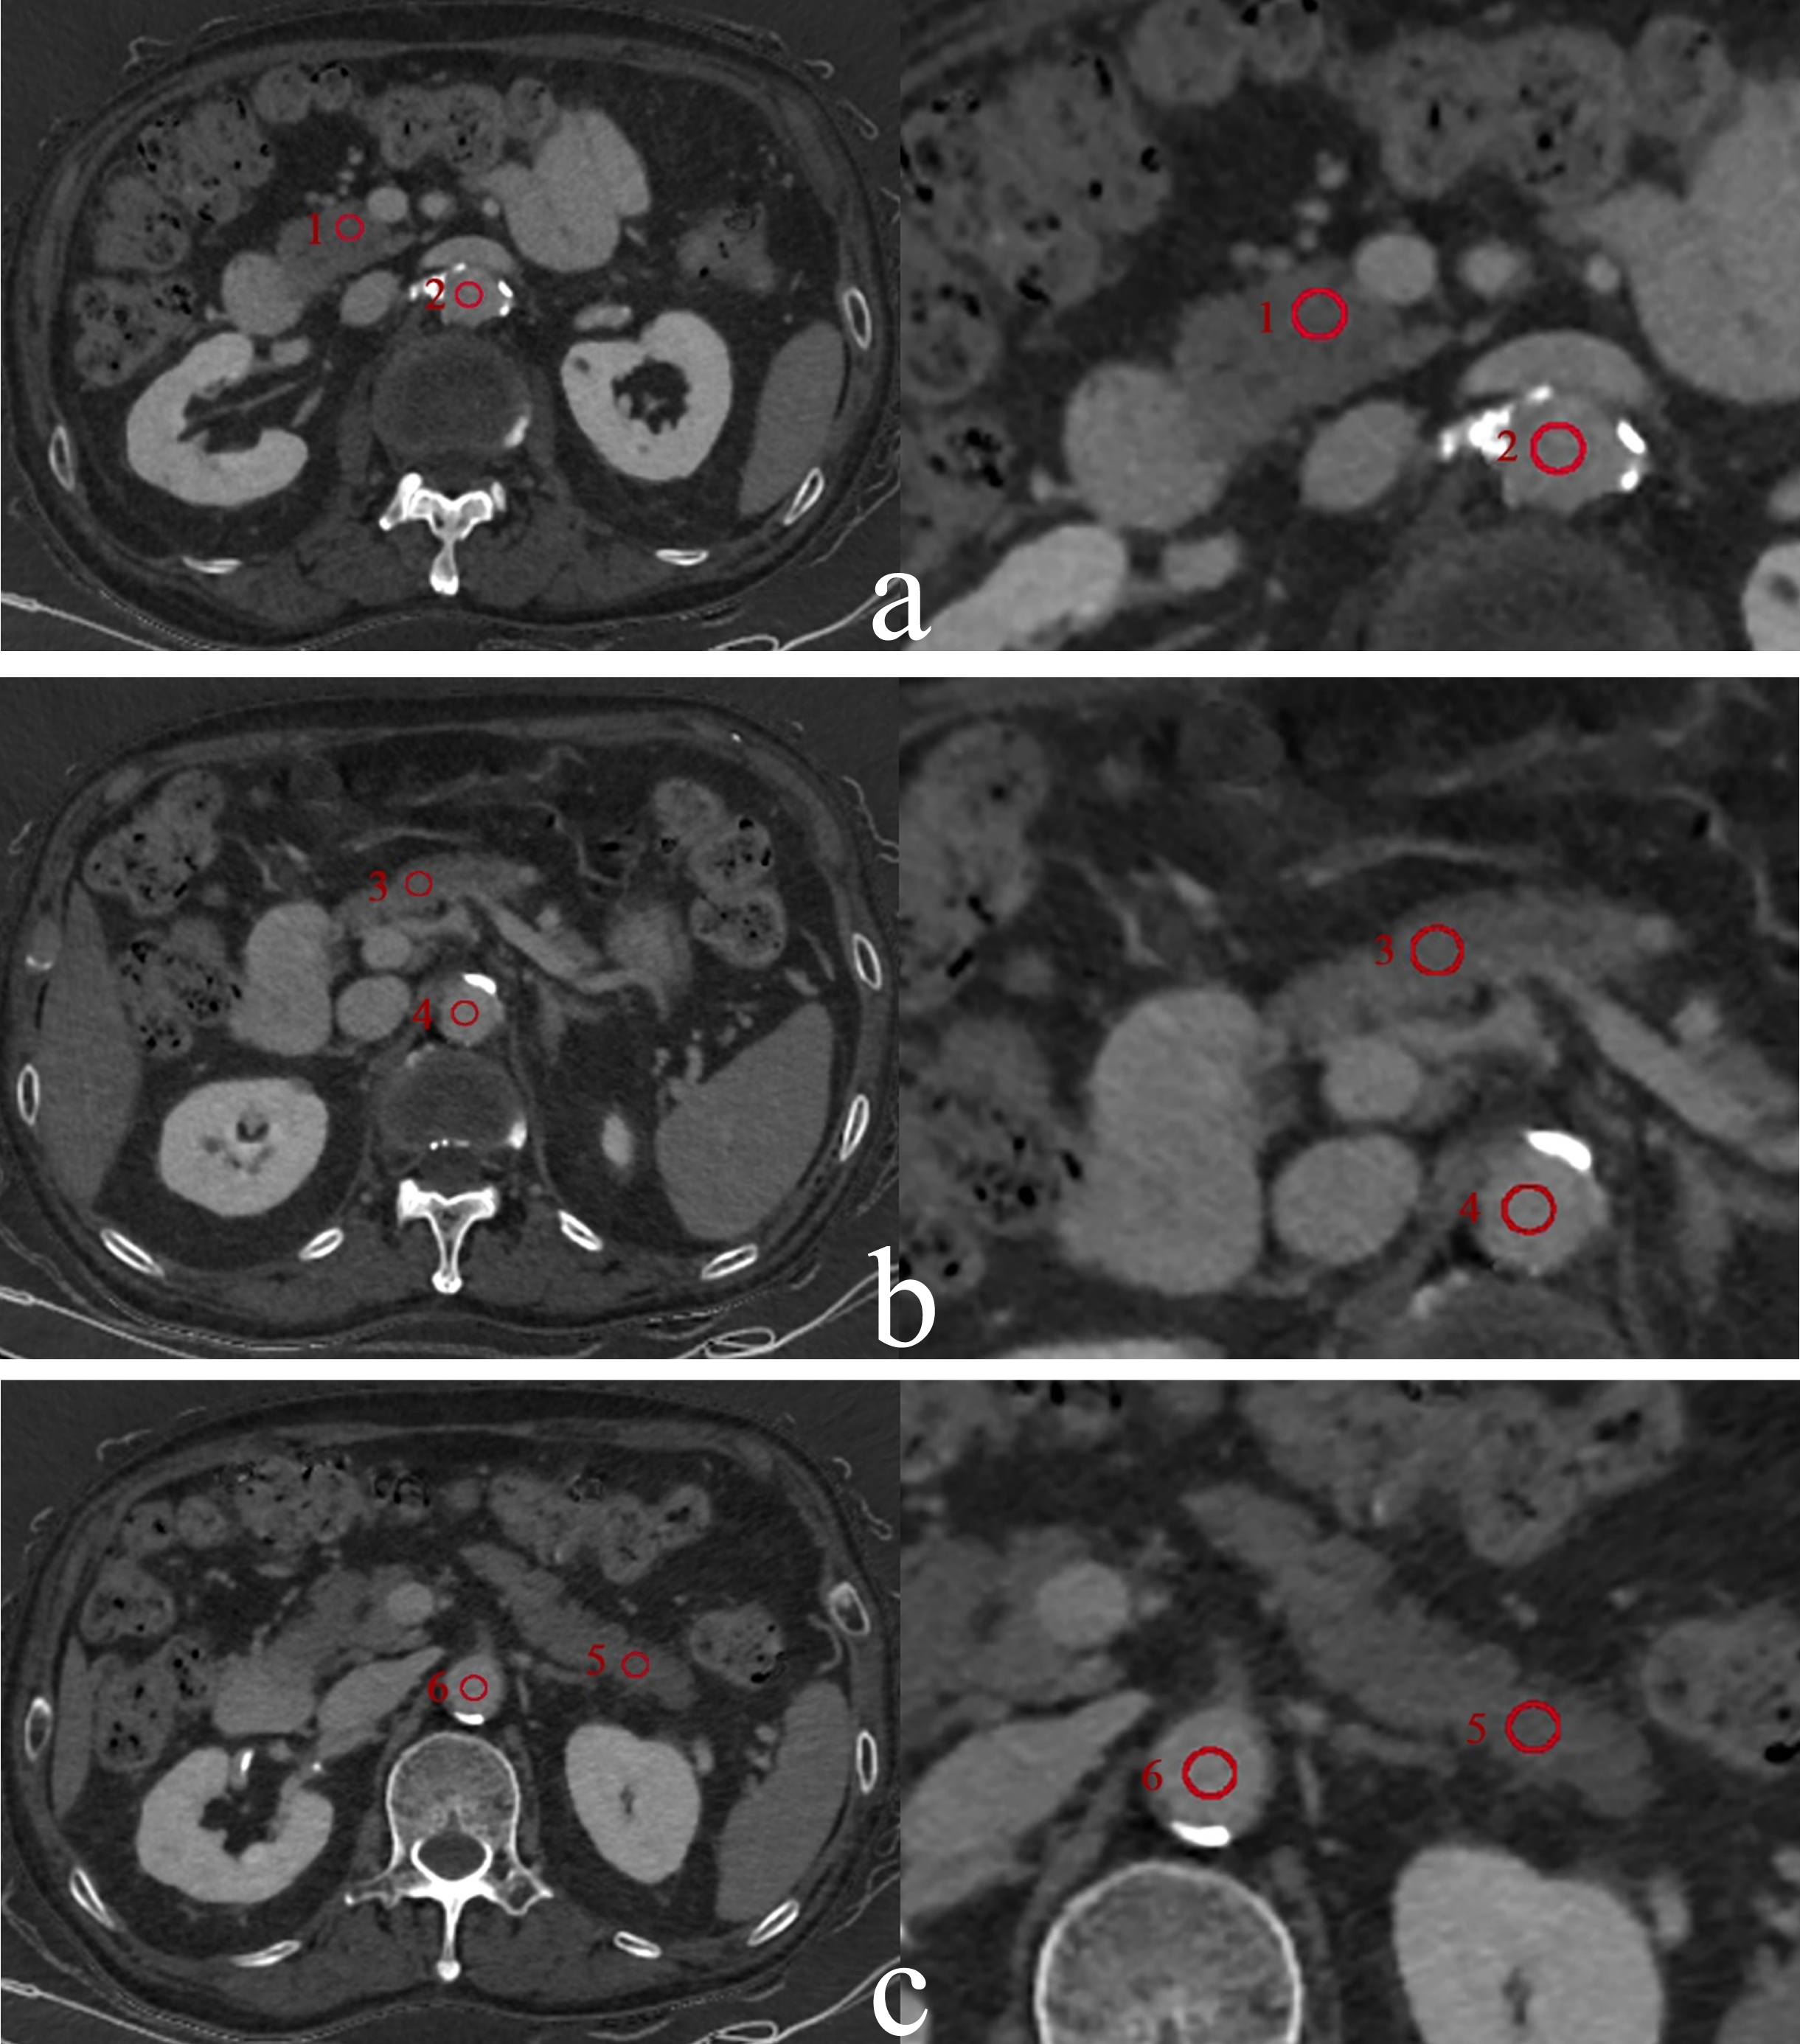
Fig. 3
The measurement of ECVliver in a 75-year-old man with primary hypertension in Grade 1 hypertension group. Liver iodine maps (iodine-water basic pair) were generated from spectral CT in equilibrium phase at the level of the left lateral lobe of the liver (a), the left medial lobe (b), the right anterior lobe (c) and the right posterior lobe (d). Eight red circles represent the ROIs placed in the left lateral lobe (1), the left medial lobe (3), the right anterior lobe tail (5), the right posterior lobe (7) and abdominal aorta (2, 4, 6, 8) at the same level, respectively.
Iodine concentration (IC) obtained from the ROIs in pancreatic head, body, tail, liver lobes, and abdominal aorta were averaged to represent the ICpancreas, ICliver, and ICaorta, respectively. All delineations and measurements were performed by two radiologists (both with over 5 years of experience in abdominal CT diagnostic imaging) independently. The average value of two radiologists was considered as the final result. All ECV were calculated according to the following formula [14]:
2.3Hypertensive reference standard
According to the Guidelines for the Prevention and Treatment of Hypertension in China (2018 Revised Edition) [15], the diagnosis and classification of hypertension in this study was defined. Patients with a systolic blood pressure (SBP) of 140 mmHg or higher, or a diastolic blood pressure (DBP) of 90 mmHg or higher, were diagnosed as primary hypertension. According to the degree of increase in blood pressure, hypertension was divided into three grades: Grade 1, Grade 2, and Grade 3 (Table 2). In our study, the hypertension-related indicators primarily include systolic blood pressure (SBP), diastolic blood pressure (DBP), pulse pressure (PP), and hypertension grade. These indicators are integral to the diagnostic criteria and risk stratification of hypertension as outlined in the “2018 Chinese Guidelines for the Management of Hypertension”. SBP and DBP are directly recognized the positive correlation with risk of stroke, coronary events, and cardiovascular mortality. PP is utilized as a crucial parameter for hypertension treatment and blood pressure control. Hypertension grade, which considers both SBP and DBP, is supported by epidemiological data from China, indicating its strong association with cardiovascular risk.∥
2.4Statistical analysis
All statistical analyses were conducted using the SPSS 27.0 statistical software. Data were tested for normal distribution using the Shapiro-Wilk test. Normally distributed data were expressed as means±SDs, whereas nonnormally distributed data were displayed as medians with IQRs. The ECV comparisons between different blood pressure groups were performed by Mann-Whitney U analysis. ECV and blood pressure-related indicators (SBP, DBP, PP) were correlated using Spearman’s rank correlation coefficient analysis. Mann-Whitney U analysis was used to compare the cirrhotic and non-cirrhotic groups. A multiple linear stepwise regression model was established to determine the quantitative relationship between ECV and blood pressure-related indicators. P < 0.05 indicated a statistically significant difference.
3Results
There was not statistically difference in age, gender, Hct, and BMI among the groups of normal blood pressure, hypertension, Grade 1 hypertension, Grade 2 hypertension, and Grade 3 hypertension (P > 0.05) (Table 1).
Table 1
Demographics of study population
| Variables | All patients | Normal Blood Pressure Group | Hypertension Group | Grade 1 Hypertension Group | Grade 2 Hypertension Group | Grade 3 Hypertension Group | P |
| Number | 300 | 145 | 155 | 59 | 35 | 61 | |
| Age (y) | 62.9±9.5 | 62.8±9.4 | 61.8±10.1 | 60.0±9.9 | 62.3±10.2 | 63.2±10.2 | 0.16, 0.20 |
| Gender | 0.62, 0.92 | ||||||
| Male | 186 | 92 | 94 | 36 | 20 | 38 | |
| Female | 114 | 53 | 61 | 23 | 15 | 23 | |
| BMI (kg/m2) | 24.58±3.63 | 23.93±3.35 | 25.22±3.79 | 25.34±4.41 | 25.92±3.23 | 24.73±3.44 | 0.05, 0.15 |
| Hct (% ) | 37.81±7.45 | 37.26±7.93 | 38.35±6.94 | 39.98±5.63 | 38.03±8.98 | 36.98±6.73 | 0.30, 0.05 |
Note: BMI = body mass index, Hct = hematocrit. For two P values, the former represents the statistical test values for the comparison between the normal blood pressure group and the hypertension group, and the latter represents the statistical test values for each grade of hypertension group.
Table 2
Classification Criteria for Hypertension (mmHg)
| Group | SBP | DBP |
| Normal blood pressure | <140 | <90 |
| Hypertension | ≥140 | ≥90 |
| Grade 1 hypertension | 140∼159 | 90∼99 |
| Grade 2 hypertension | 160∼179 | 100∼109 |
| Grade 3 hypertension | ≥180 | ≥110 |
Note: SBP = systolic blood pressure, DBP = diastolic blood pressure.
3.1Comparison of ECVliver and ECVpancreas among patients with different blood pressure levels
There were significant differences in ECVpancreas and ECVliver between the group with normal blood pressure and the group with hypertension (P < 0.001) with higher values observed in the hypertensive group (ECVpancreas = 36.68, ECVliver = 35.60) (Table 3). Among three grades hypertension groups, there were also significant differences in ECVpancreas and ECVliver (P < 0.001) and the two values increased with higher grades of hypertension (ECVpancreas 33.73,34.76,37.85,39.26) (ECVliver 32.02,33.81,36.48,38.58). Post-hoc comparisons using the Bonferroni correction revealed that the differences in ECV among the different hypertension grade groups were statistically significant (P < 0.05) (Table 4).
Table 3
Differences in liver and pancreatic ECV between patients with hypertension and non-hypertensive patients
| Group | Median (P25, P75) | Wilcoxon Rank Sum Test | ||
| Z | P | |||
| ECVliver | Normal blood pressure | 32.02(29.48, 33.39) | 9.49 | <0.001 |
| Hypertension | 35.60(33.22, 38.58) | |||
| ECVpancreas | Normal blood pressure | 33.73(32.40, 34.64) | 8.37 | <0.001 |
| Hypertension | 36.68(34.23, 40.55) | |||
Note: ECV = extracellular volume fraction.
Table 4
Differences in liver and pancreatic ECV among patients with different hypertension grades
| Group | Median (P25, P75) | K-W-H Test | ||
| H | P | |||
| ECVliver | Normal blood pressure | 32.02(29.48, 33.39) | 120.60 | <0.001 |
| Grade 1 hypertension | 33.81(32.03, 35.24) | |||
| Grade 2 hypertension | 36.48(34.78, 38.55) | |||
| Grade 3 hypertension | 38.58(35.22, 41.25) | |||
| ECVpancreas | Normal blood pressure | 33.73(32.40, 34.64) | 112.70 | <0.001 |
| Grade 1 hypertension | 34.76(32.30, 35.80) | |||
| Grade 2 hypertension | 37.85(35.05, 40.65) | |||
| Grade 3 hypertension | 39.26(36.55, 43.67) | |||
Note: ECV = extracellular volume fraction.
3.2Correlation analysis between blood pressure-related indicators and ECV
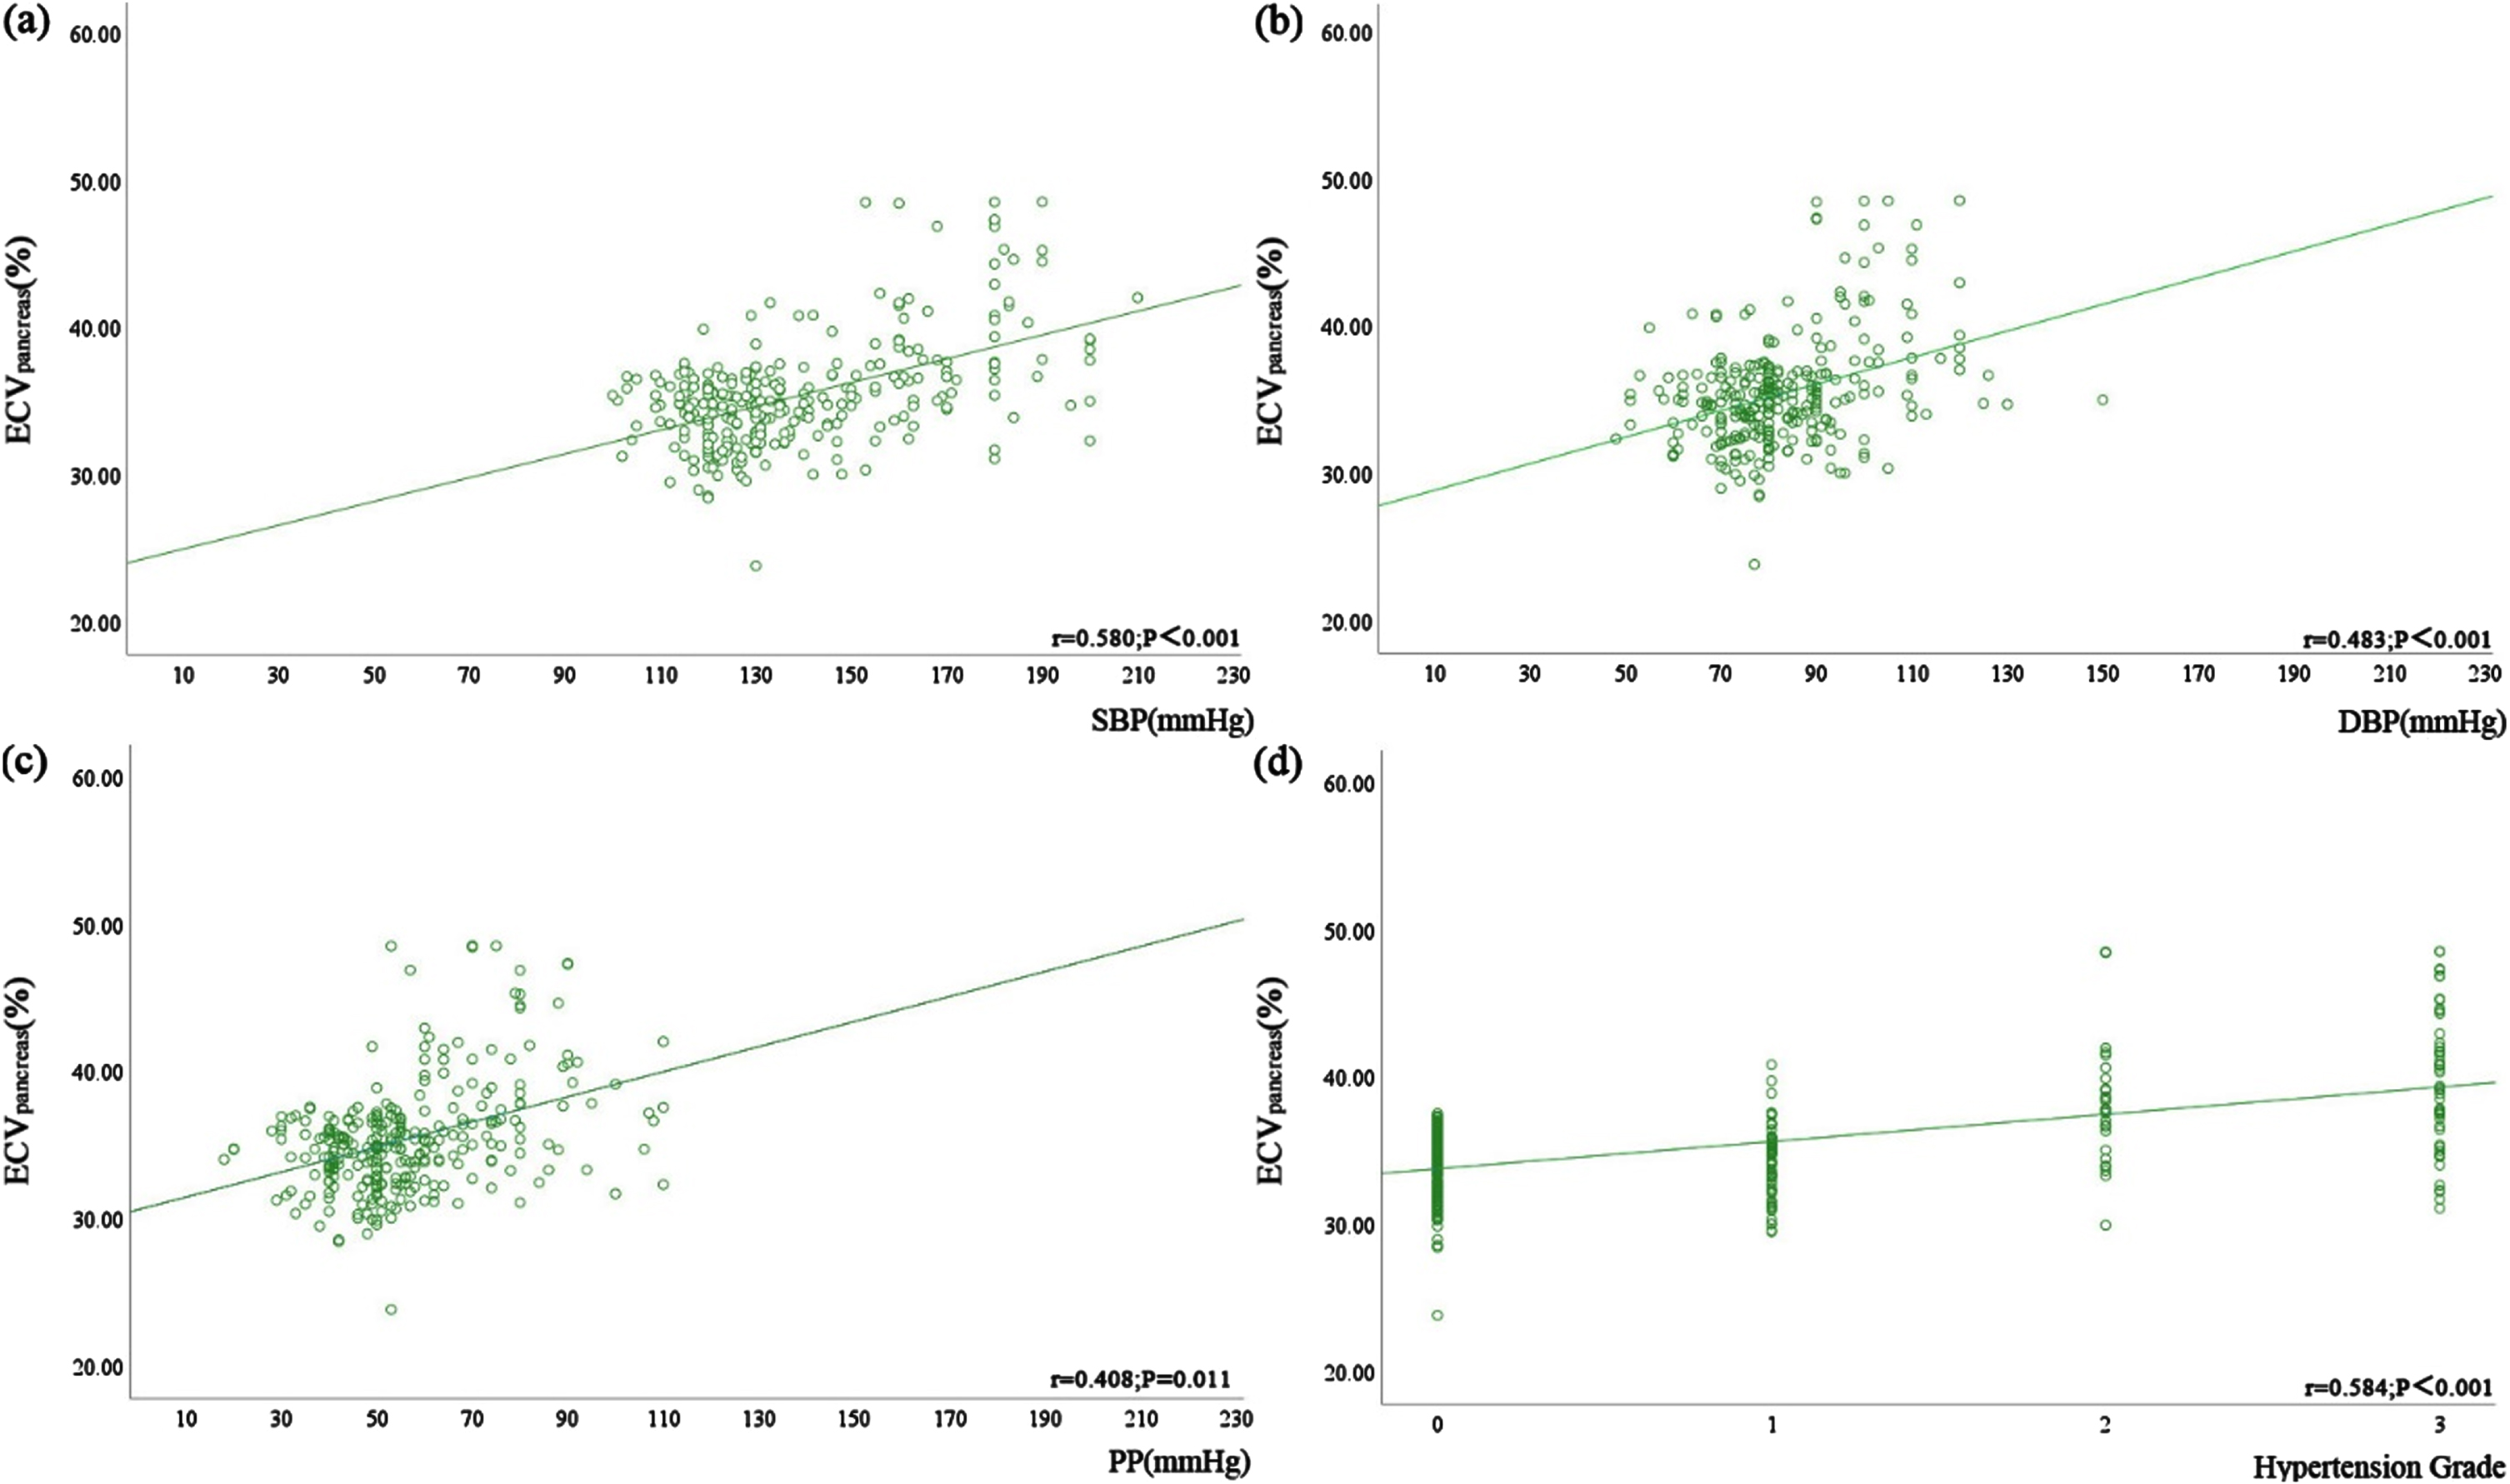
There were statistically significant correlations between ECVpancreas, ECVliver, SBP, DBP, PP, and hypertension grade (P < 0.05) (Table 5 and Figs. 4, 5). Table 5 and Fig. 4 demonstrate the positive correlation between ECVliver and SBP, DBP, PP, and hypertension grade, with the strongest correlation observed with hypertension grade. Hypertension grade and ECV denoted a stronger correlation, compared to hypertension-related indicators (r = 0.621 > 0.577 > 0.488 > 0.402). Table 5 and Fig. 5 illustrate the positive correlation between ECVpancreas and SBP, DBP, PP, and hypertension grade, again showing the strongest correlation with hypertension grade (r = 0.584 > 0.580 > 0.483 > 0.408). The correlation between ECVliver and hypertension grade was stronger than that of ECVpancreas (r = 0.621 > 0.584).
Table 5
Correlation analysis between blood pressure indicators and liver and pancreatic ECV
| Parameter | r | P | |
| ECVliver | SBP | 0.577 | <0.001 |
| DBP | 0.488 | <0.001 | |
| PP | 0.402 | 0.025 | |
| Hypertension Grade | 0.621 | <0.001 | |
| ECVpancreas | SBP | 0.580 | <0.001 |
| DBP | 0.483 | <0.001 | |
| PP | 0.408 | 0.011 | |
| Hypertension Grade | 0.584 | <0.001 |
Note: ECV = extracellular volume fraction, SBP = systolic blood pressure, DBP = diastolic blood pressure, PP = pulse pressure.
Fig. 4
Correlation between ECVliver and blood pressure-related indicators, including (a) SBP (r = 0.577, P < 0.001), (b) DBP (r = 0.488, P < 0.001), and (c) PP (r = 0.402, P = 0.025), and (d) hypertension grade in all patients (r = 0.621, P < 0.001).
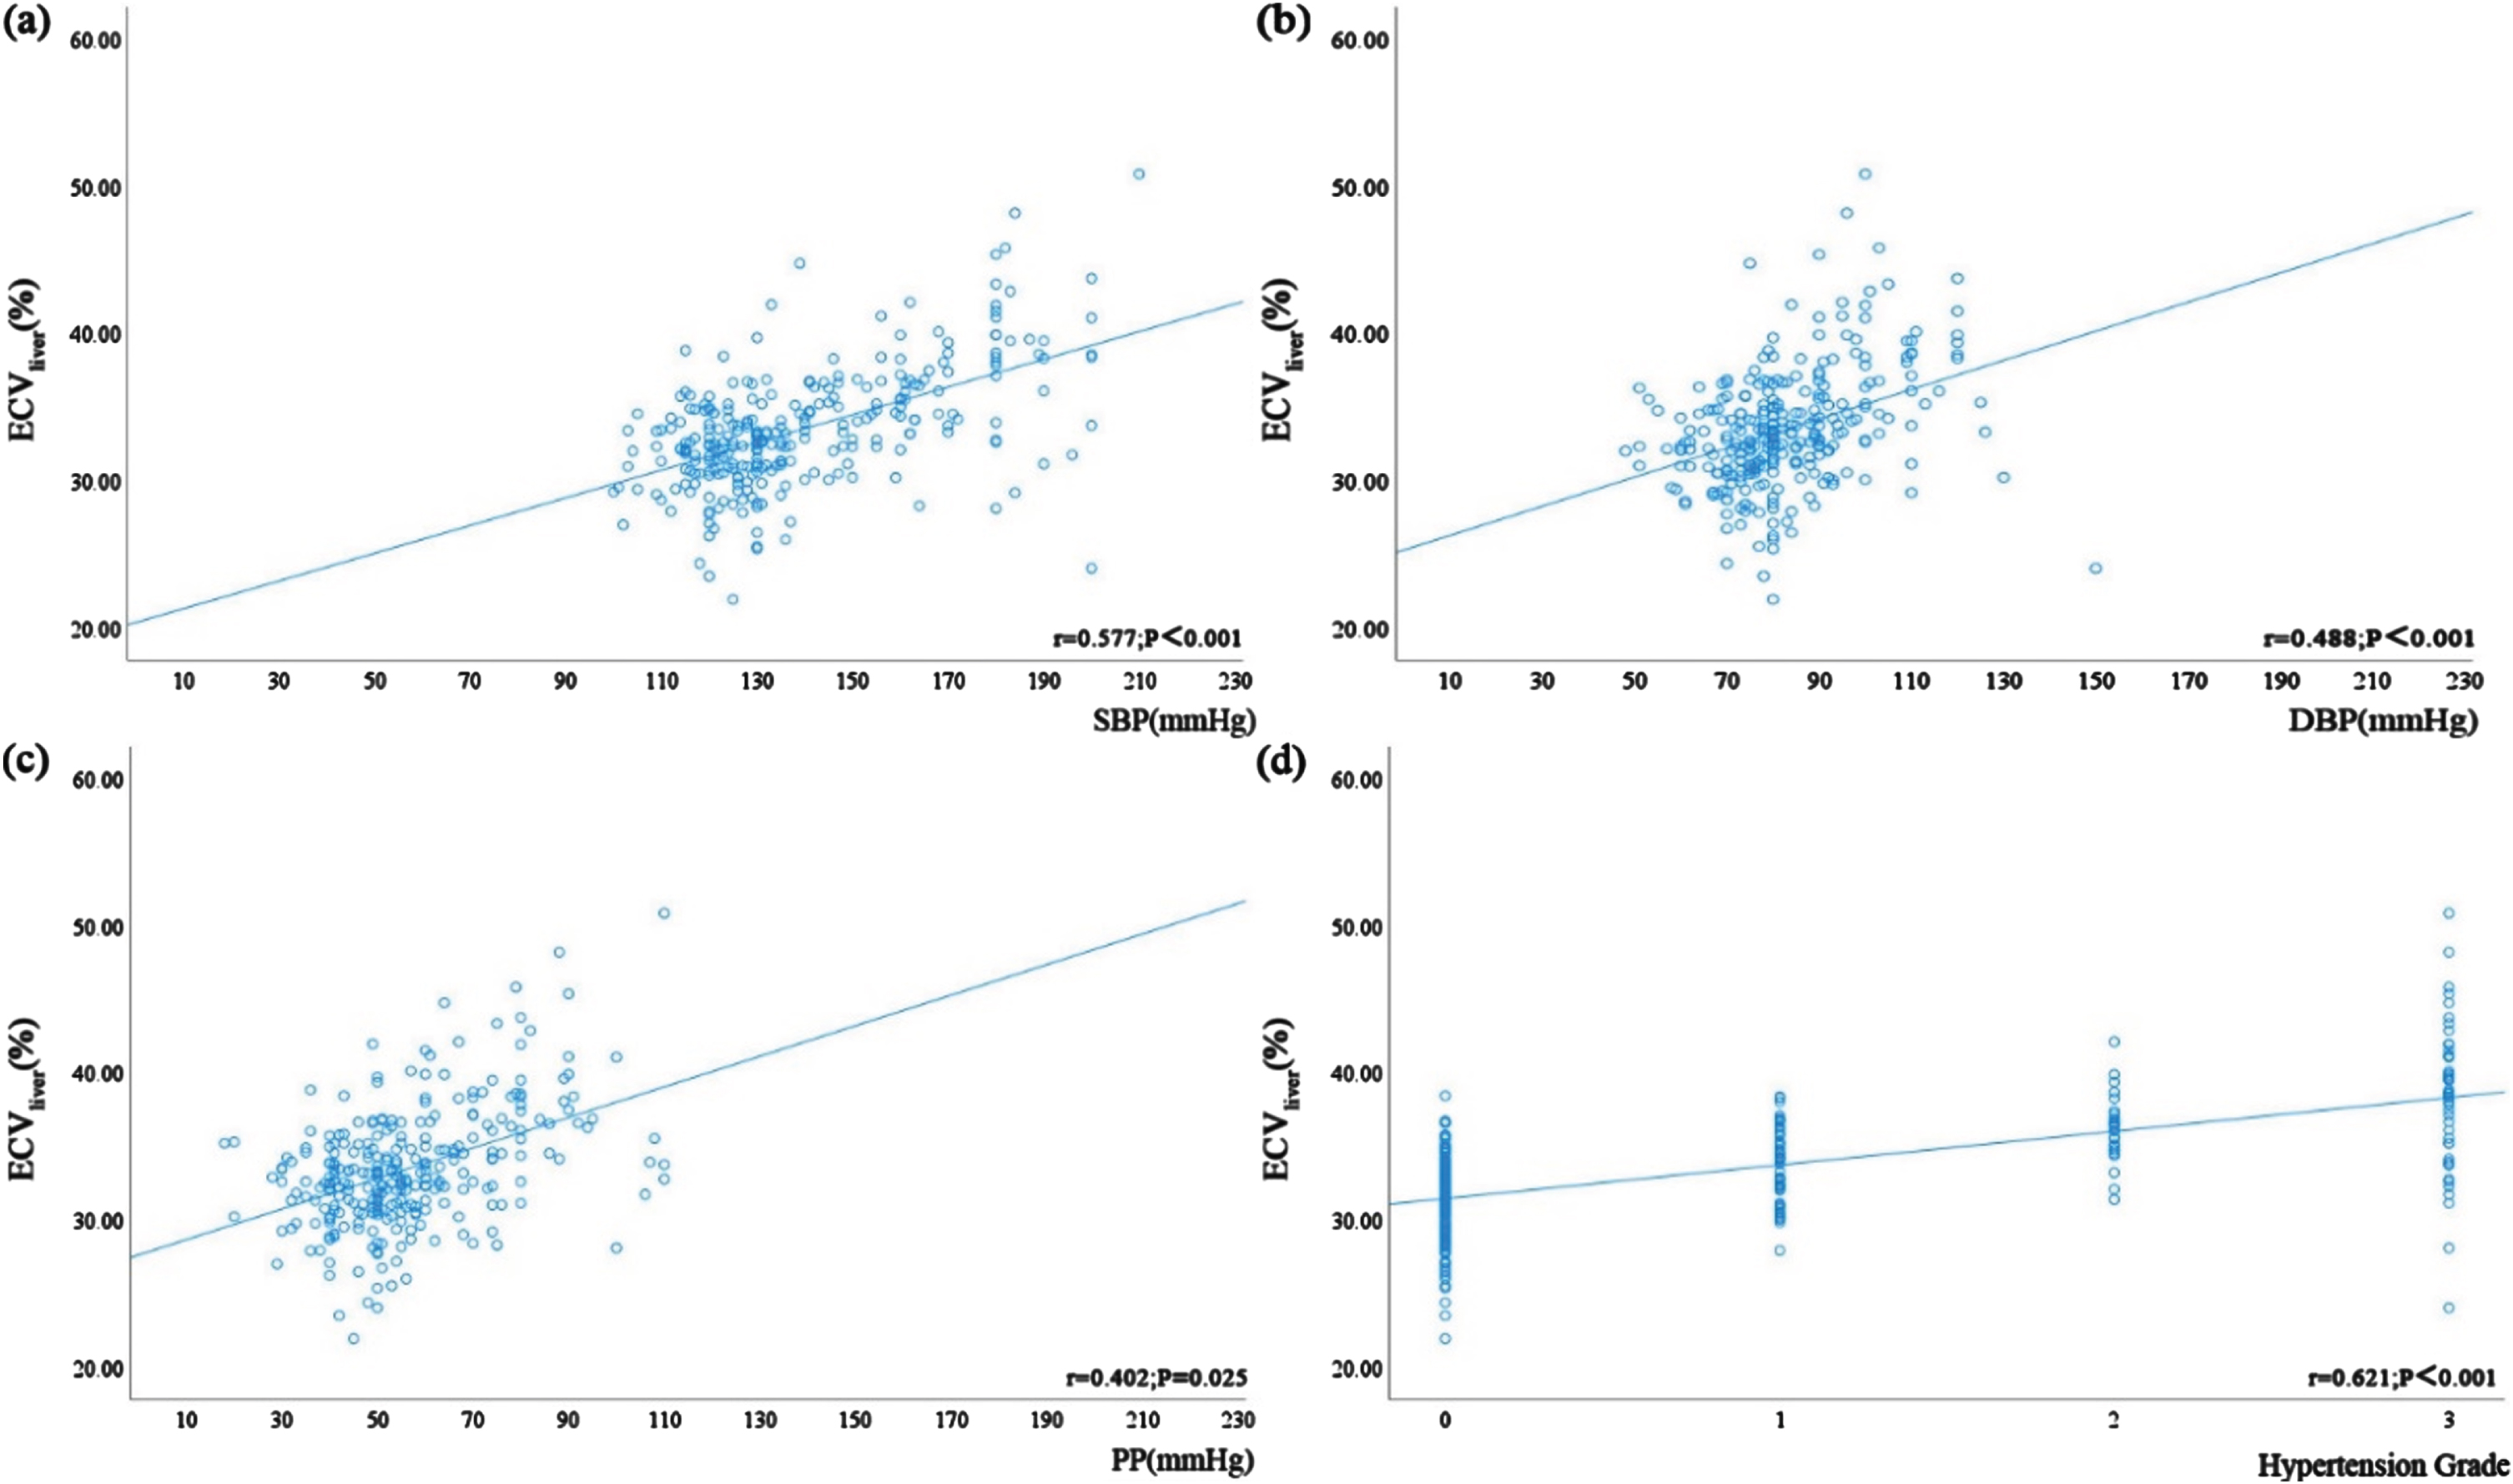
Fig. 5
Correlation between ECVpancreas and blood pressure-related indicators, including (a) SBP (r = 0.580, P < 0.001), (b) DBP (r = 0.483, P < 0.001), and (c) PP (r = 0.408, P = 0.011), and (d) hypertension grade in all patients (r = 0.584, P < 0.001).
3.3Multiple linear regression analysis
Multiple linear regression analysis was performed using SBP, DBP, PP, and hypertension grade as independent variables. The result showed that hypertension grade had a statistically significant impact on ECVliver and DBP and PP did not show significant statistical impact on ECVliver (Table 6). Hypertension grade was an independent factor for the elevation of both ECVpancreas and ECVliver.
Table 6
Multiple linear regression analysis of ECVliver and ECVpancreas
| Variable | Unstandardized Coefficient (β) | Standardized | t | P | ||
| β | Standard Error | Coefficient (β) | ||||
| ECVliver | Hypertension Grade | 1.67 | 0.44 | 0.45 | 3.80 | <0.001 |
| DBP | 0.03 | 0.03 | 0.11 | 1.21 | 0.228 | |
| PP | 0.04 | 0.02 | 0.15 | 1.73 | 0.085 | |
| ECVpancreas | Hypertension Grade | 1.95 | 0.39 | 0.57 | 4.99 | <0.001 |
| DBP | 0.02 | 0.02 | 0.06 | 0.68 | 0.495 | |
| PP | 0.01 | 0.02 | 0.04 | 0.45 | 0.650 | |
Note: ECV = extracellular volume fraction, DBP = diastolic blood pressure, PP = pulse pressure.
4.Discussion
The correlation between ECV and hypertension was confirmed in this study using spectral CT. The results demonstrated that ECVliver and ECVpancreas increased as hypertension grade increased, indicating that poorly controlled hypertension might contribute to chronic liver and pancreatic injury. This finding aligns with previous research on chronic pancreatic and liver injury caused by hypertension. Firstly, Zhang et al.’s study on spontaneously hypertensive rats versus normotensive rats revealed increased pancreatic unit weight and reduced blood flow in hypertensive rats, indicative of functional and pathological morphological damage. This finding resonates with our conclusion that ECVpancreas correlates positively with hypertension, suggesting that hypertension may influence pancreatic structure and function, thereby affecting ECVpancreas [16]. Secondly, Shi et al.’s quantitative study using magnetic resonance IDEAL-IQ sequences uncovered that hypertension often coexists with insulin resistance, where high insulin levels promote collagen synthesis and migration in vascular smooth muscle, thereby increasing the ECV. This mechanism potentially explains the elevated ECV in hypertensive patients [17]. Furthermore, Sadulaeva et al.’s study indicated that poorly controlled hypertension can lead to increased peripheral resistance and hemodynamic disturbances, which can contribute to and accelerate the formation and development of liver fibrosis. This mechanism also supports our conclusion that hypertension, through its impact on hemodynamics and peripheral resistance, may increase the ECVliver [18]. The above research further highlighting the hypertension could contribute to chronic liver and pancreatic injury and the ability of ECV to reflect the chronic injury process of organs quantitatively and dynamically. Chronic organ injury might be related to vascular wall elasticity, endothelial dysfunction, and extracellular matrix remodeling caused by hypertension. Additionally, individuals with high blood pressure tend to exhibit metabolic disorders and hyperlipidemia, which might exacerbate extracellular matrix remodeling and result in chronic organ damage [19-23]. Aneni et al. discovered that patients with non-alcoholic fatty liver disease had significantly higher SBP, DBP and PP. SBP and DBP were positively correlated with liver fibrosis indices, and hypertensive patients exhibited higher fibrosis indices compared to pre-hypertensive and normotensive individuals. Hypertension exacerbates liver damage and is associated with increased rates and severity of liver fibrosis. Hypertensive patients with liver steatosis experience aggravated liver damage and increased rates and severity of liver fibrosis. This study is consistent with the results of our study [3]. In addition, our study found that hypertension grade had a stronger correlation with ECVliver and ECVpancreas than SBP, DBP, and PP. Multiple regression analysis confirmed that hypertension grade was an independent risk factor for elevated ECVliver and ECVpancreas. These findings indicated that pancreatic and liver ECV correlate positively with hypertension-related indicators. Hypertension grade could reflect the overall blood pressure condition and chronic liver or pancreas damage in primary hypertension was a multifactorial process, not only determined by SBP, DBP, or PP.
Overall, this study presented a novel noninvasive method for evaluating chronic injury to organs related to hypertension. Currently, chronic damage assessment of hypertension-related organs mainly relied on tissue biopsy or specialized examinations. However, tissue biopsy was invasive and not suitable for comprehensive detection, while specialized examinations required more time and manpower. Indeed, ECV can be derived from both conventional CT and spectral CT. For conventional CT, the calculation of ECV involves the absolute enhancement values of target tissue and aorta after injecting iodine contrast agents and using the non-contrast phase and the equilibrium phase. Careful timing and precise measurement of contrast enhancement are required. For spectral, the calculation of ECV only uses the iodine maps in the equilibrium phase, which simplifies the process and makes it more feasible in routine clinical practice. Since, spectral CT served as a more practical and efficient alternative than conventional CT while measuring ECV, particularly due to its simplified approach and reduction of patient burden. Therefore, the ECV obtained from spectral CT provided a rapid, accurate, and noninvasive quantitative assessment of chronic liver and pancreas damage caused by hypertension. This assessment could offer clinical guidance for early blood pressure control in hypertensive patients and prevent the occurrence and progression of chronic organ diseases.
There were limitations in this study. First, the limited sample size might lead to a certain bias in the results. Secondly, other biomarkers might have unknown effects on the diagnosis of hypertension or on organ extracellular matrix. To reveal the relationship between hypertension and ECV more comprehensively, more biomarkers should be considered in future studies and their interactions should be deeply explored.
In conclusion, ECVliver and ECVpancreas were positively correlated with hypertension-related indicators. Hypertension grade could predict the increasement of ECVliver and ECVpancreas, as an independent risk factor. Compared with ECVpancreas, ECVliver showed a stronger correlation with hypertension-related indicators in hypertensive patients. ECV had a potential clinical value in diagnosing chronic damage of liver and pancreas caused by hypertension.
Acknowledgments
The authors are grateful for support from the Qingdao Municipal Hospital.
References
[1] | Global report on hypertension: the race against a silent killer, Geneva: World Health Organization; (2023) . License: CC BY-NC-SA 3.0 IGO |
[2] | Perrotta S. and Carnevale D. , TCR-sequencing provides a barcode of immune activation and target organ damage in human hypertension, Hypertension (Dallas, Tex: 1979) 80: (11) ((2023) ), 2330–2332. |
[3] | Aneni E.C. , Oni E.T. , Martin S.S. et al., Blood pressure is associated with the presence and severity of nonalcoholic fatty liver disease across the spectrum of cardiometabolic risk, J Hypertens 33: (6) ((2015) ), 1207–1214. |
[4] | Greffier J. , Villani N. , Defez D. et al., Spectral CT imaging: Technical principles of dual-energy CT and multi-energy photon-counting CT, Diagnostic and Interventional Imaging 104: (4) ((2023) ), 167–177. |
[5] | Fernández-Pérez G.C. , Fraga C. Piñeiro, M. Oñate Miranda, et al., Dual-energy CT: Technical considerations and clinical applications, Radiologia 64: (5) ((2022) ), 445–455. |
[6] | Lee S.W. , Kwak H.S. , Kang M.H. et al., Fibroblast-associated tumour microenvironment induces vascular structure-networked tumouroid, Sci Rep 8: (1) ((2018) ), 2365. |
[7] | Fukui H. , Onishi H. , Nakamoto A. et al., Pancreatic fibrosis by extracellular volume fraction using Contrast-enhanced computed tomography and relationship with pancreatic cancer, European Journal of Radiology 156: ((2022) ), 110522. |
[8] | Nagayama Y. , Kato Y. , Inoue T. et al., Liver fibrosis assessment with multiphasic dual-energy CT: diagnostic performance of iodine uptake parameters, Eur Radiol 31: (8) ((2021) ), 5779–5790. |
[9] | Karsdal M.A. , Detlefsen S. , Daniels S.J. et al., Is the total amount as important as localization and type of collagen in liver fibrosis attributable to steatohepatitis? Hepatology (Baltimore, Md) 71: (1) ((2020) ), 346–351. |
[10] | Ozaki K. , Ohtani T. , Ishida S. et al., Extracellular volume fraction obtained by dual-energy CT depicting the etiological differences of liver fibrosis, Abdominal Radiology (New York) 48: (6) ((2023) ), 1975–1986. |
[11] | Bandula S. , Punwani S. , Rosenberg W.M. et al., Equilibrium contrast-enhanced CT imaging to evaluate hepatic fibrosis: initial validation by comparison with histopathologic sampling, Radiology 275: (1) ((2015) ), 136–143. |
[12] | Sofue K. , Ueshima E. , Masuda A. et al., Estimation of pancreatic fibrosis and prediction of postoperative pancreatic fistula using extracellular volume fraction in multiphasic contrast-enhanced CT, Eur Radiol 32: (3) ((2022) ), 1770–1780. |
[13] | Kameda F. , Tanabe M. , Higashi M. et al., The extracellular volume fraction of the pancreas measured by dual-energy computed tomography: The association with impaired glucose tolerance, European Journal of Radiology 141: ((2021) ), 109775. |
[14] | Liang Z. , Liu Y. , Nie Y. Efficacy analysis of double-low dynamic contrast-enhanced CT and hepatic extracellular volume fraction in the diagnosis of liver fibrosis, Contrast Media Mol Imaging 2022: ((2022) ), 8089914. |
[15] | Chinese guidelines for the prevention and treatment of hypertension (Revised in 2018), Chinese Journal of Cardiovascular Medicine 24: (01) ((2018) ), 24–56. |
[16] | Zhang M. , Sun Y. , Wan Z. et al., The role of aldosterone and eplerenone in pancreatic injury in spontaneously hypertensive rats, Chinese Journal of Evidence-Based Cardiovascular Medicine 1: (03) ((2009) ), 211–213+217. |
[17] | Shi J. , Jiang S. Quantitative magnetic resonance study of pancreatic fat in patients with primary hypertension, Chinese Journal of Medical Imaging Technology 27: (03) ((2021) ), 237–241. |
[18] | Sadulaeva I.A. , Yushchuk E.N. , Khalikova L.F. et al., Subclinical markers of liver damage in patients with arterial hypertension and obesity, Terapevticheskii arkhiv 94: (12) ((2023) ), 1367–1373. |
[19] | Franco C. , Sciatti E. , Favero G. et al., Essential hypertension and oxidative stress: Novel future perspectives, Int J Mol Sci 23: (22) ((2022) ). |
[20] | Rodrigues J.C.L. , Erdei T. , Dastidar A.G. et al., Left ventricular extracellular volume fraction and atrioventricular interaction in hypertension, Eur Radiol 29: (3) ((2019) ), 1574–1585. |
[21] | Cai Z. , Gong Z. , Li Z. et al., Vascular extracellular matrix remodeling and hypertension, Antioxidants & Redox Signaling 34: (10) ((2021) ), 765–783. |
[22] | Litwin M. , Kułaga Z. Obesity, metabolic syndrome, and primary hypertension, Pediatric Nephrology (Berlin, Germany) 36: (4) ((2021) ), 825–837. |
[23] | Cha M.J. , Kim S.M. , Kim H.S. et al., Association of cardiovascular risk factors on myocardial perfusion and fibrosis in asymptomatic individuals: cardiac magnetic resonance study, Acta radiologica (Stockholm, Sweden: 1987) 59: (11) ((2018) ), 1300–1308. |


