
Impact of deep learning-based image reconstruction on image quality compared with adaptive statistical iterative reconstruction-Veo in renal and adrenal computed tomography
Abstract
OBJECTIVE:
To evaluate image quality of deep learning-based image reconstruction (DLIR) in contrast-enhanced renal and adrenal computed tomography (CT) compared with adaptive statistical iterative reconstruction-Veo (ASiR-V).
METHODS:
We prospectively recruited 52 patients. All images were reconstructed with ASiR-V 30%, ASiR-V 70%, and DLIR at low, medium, and high reconstruction strengths. CT number, noise, noise reduction rate, signal-to-noise ratio (SNR), and contrast-to-noise ratio (CNR) were measured and calculated within the region of interest (ROI) on subcutaneous fat, bilateral renal cortices, renal medulla, renal arteries, and adrenal glands. For qualitative analyses, the differentiation of the renal cortex and medulla, conspicuity of the adrenal gland boundary, sharpness, artifacts, and subjective noise were assessed. The overall image quality was calculated on a scale from 0 (worst) to 15 (best) based on the five values above and the score≥9 was acceptable.
RESULTS:
CT number does not significantly differ between the reconstruction datasets. Noise does not significantly differ between ASiR-V 30% and DLIR-L, but it is significantly lower using ASiR-V 70%, DLIR-M, and DLIR-H. The noise reduction rate relative to ASiR-V 30% is significantly different between the DLIR groups and ASiR-V 70%, and DLIR-H yields the highest noise reduction rate (61.6%). SNR and CNR are higher for DLIR-M, DLIR-H, and ASiR-V 70% than for ASiR-V 30% and DLIR-L. DLIR-H shows the best SNR and CNR. The overall image quality yields the same pattern for DLIR-H, with the highest score. Percentages of cases with overall image quality score≥9 are 100% (DLIR-H), 94.23% (DLIR-M), 90.38% (ASiR-V70%), 67.31% (DLIR-L), and 63.46% (ASiR-V30%), respectively.
CONCLUSIONS:
DLIR significantly improved the objective and subjective image quality of renal and adrenal CTs, yielding superior noise reduction compared with ASiR-V.
1Introduction
Although computer tomography (CT) is widely used and offers extensive clinical benefits, dose reduction is required to alleviate concerns about exposure to radiation [1, 2]. CT offers several advantages as the first-line imaging technique for imaging of retroperitoneal lesions including faster examination times, relatively lower cost, and increased accessibility. Renal and adrenal masses may result in important errors when unrecognized. The characterization of these lesions pertains to the epidemiology and pathophysiology, the various components of a multi-phase CT protocol, and challenges related to attenuation measurements [3]. Additionally, technical parameters are matched between the multiphase to accurately compare quantitative attenuation values and subjective assessment of the appearance of lesions, which may be affected by differences in technique [4]. Therefore, images with high quality in contrast-enhanced renal and adrenal CT are critical to identify and prevent errors related to pitfalls in imaging.
For decades, filtered back-projection (FBP) has been the major reconstruction technique for routine CT scanning. As FBP is limited at low dose settings as it introduces high image noise and artifacts, iterative reconstruction (IR) algorithms have been proposed to overcome the limitations of FBP consequently [5]. Adaptive statistical iterative reconstruction (ASiR, GE Healthcare, Milwaukee, USA) is a hybrid IR algorithm that yields blended images between FBP and IR, and allows for a dose reduction of 25–40% without degrading the image quality of abdominal CT scans [6]. A new generation of adaptive statistical iterative reconstruction (ASiR-V) has been developed based on a physical model in the IR process to improve the strength of noise reduction and image quality [7]. However, the development of a waxy and plastic image, or otherwise unnatural appearance, is a limitation with ASiR-V [8, 9].
The application of artificial intelligence (AI) in CT is a deep learning approach to image denoising. AI algorithms are trained to identify noise and not specific anatomical structures, which are subsequently subtracted from the original image to improve image quality and reduce radiation dose [10]. Deep learning-based image reconstruction (DLIR; TrueFidelityTM, GE Healthcare) has been developed and has the potential to improve image reconstruction far better than that of traditional statistics-based reconstruction methods [11, 12]. Recently, DLIR has been applied to phantom and clinical studies [13–16], showing greater noise reduction and superior image quality than that with ASiR-V, and what influences DLIR clinical imaging showed on complex and subtle structures has not been fully explored.
To our knowledge, no evaluation for clinical contrast-enhanced renal and adrenal CT with DLIR has been reported. Thus, the purpose of our study was to compare the image quality of renal and adrenal CT images constructed with DLIR and ASiR-V algorithms and determine the optimal strength of DLIR to achieve the highest quality images using quantitative and qualitative assessments.
2Materials and methods
2.1Subjects
From January 2020 to February 2021, 52 patients (mean age, 59.67±0.94 years; 32 males; 20 females) were enrolled in the prospective study. The inclusion criterion was that a patient underwent hepatic oncologic staging for metastasis and was scheduled for the abdominal contrast-enhanced CT examination with the same scanner and parameters. The exclusion criteria included severe allergies to iodinated contrast materials, compromised renal function (estimated glomerular filtration rate of < 60 ml/min/ 1.73 m2), and pregnancy. The institutional review board approved the study protocol and the requirement of written informed consent was obtained from all patients.
2.2CT data acquisition and image reconstruction
All patients were evaluated using a 256-section multi-detector CT scanner (Revolution CT; GE Healthcare Technologies, Waukesha, Wisconsin, USA) with the following parameters: Scan mode, helical; SFOV, large body; DFOV, 35 cm; noise index, 8.0; pitch, 0.992:1; rotation time, 0.5 s; 1.25-mm slice collimation; SmartmA 100–500 and 120 kVp. Arterial phase scanning was initiated by bolus tracking (Smartprep; GE Healthcare Technologies) in the abdominal aorta at the level of the celiac trunk and with a threshold of 100 HU. The amount of nonionic contrast material administered via bolus injection was 600 mg iodine/kg body weight, and the maximum dose was 45 g of iodine. The contrast media was injected at a speed of 3.0 ml/s.
All images were reconstructed using ASiR-V at a level of 30% and 70%. DLIR was performed at the low level (DLIR-L), medium level (DLIR-M), and high level (DLIR-H) to control the amount of noise reduction while maintaining a reconstruction time similar to that of IR algorithms, and the strength levels are selectable and can be built into the reconstruction protocols based on the clinical applications and radiologist preference[15, 17]. The DLIR engine is deployed to run locally on the reconstruction hardware. DLIR and ASiR-V images were reconstructed with a 1.25-mm slice thickness at a 1.25-mm interval in the axial plane (AW Advantage Workstation 4.6; GE Healthcare). Five series of image sets (ASiR-V 30%, ASiR-V 70%, DLIR-L, DLIR-M, and DLIR-H) were created.
The volumetric CT dose index (CTDIvol) in milligray (mGy) and the dose–length product (DLP) in mGy×cm were recorded from the dose page. Meanwhile, the effective dose (ED) in millisieverts (mSv) was estimated from the DLP using a conversion factor of 0.015 mSv / (mGy×cm) for the abdomen [18].
2.3Quantitative image analysis
Images were evaluated on the same workstation (Advantage workstation 4.6, GE healthcare). Patient information and scanning parameters were anonymized. The reconstructions were linked so that identical anatomic levels could be reviewed during scrolling. The image readers were permitted to scroll, change the window settings, and zoom while reviewing cases with soft-tissue window settings of width 400 HU and level 40 HU.
The region of interest (ROI) on axial images was measured blindly to the reconstruction details by one radiologist with 5 years of experience and reviewed by another radiologist with 5 years of experience. Bilateral ROIs were measured in the arterial phase and averaged data were obtained. ROIs with diameters ranging from 2 to 3 mm were drawn in the subcutaneous fat, bilateral renal cortices, renal medulla, renal arteries, and adrenal glands.
For assessments of the renal cortex and renal medulla, ROIs were measured at the level of the renal hilum and placed separately on the peripheral renal cortex and adjacent medulla. For assessments of the renal artery, ROIs were placed in the proximal lumen. ROIs were placed at the junction of the adrenal gland and the anterior subcutaneous abdominal fat. Measurements avoided calcification, thrombi, and focal lesions or artifacts.
In the subcutaneous abdominal fat of every patient, we measured the CT number, representing mean attenuation, and standard deviation (SD), representing noise. The noise reduction rate relative to ASiR-V 30% was calculated as follows:
The signal-to-noise ratio (SNR) was calculated as follows:
The contrast-to-noise ratio (CNR) relative to fat was calculated as follows [19]:
2.4Qualitative image analysis
Qualitative image assessments were performed by the same readers and one of them performed the assessment again after two weeks. We used a 4-point subjective scale (from 0 to 3) to grade the differentiation of the renal cortex and medulla, conspicuity of the adrenal gland boundary, sharpness, artifacts, and subjective noise (Table 1). An overall image quality score from 0 (worst) to 15 (best) was calculated based on the scores from all the values described above. An overall image quality score≥9 was considered of acceptable diagnostic quality.
Table 1
Grading scores of qualitative image assessments
| Grading score | Differentiation of renal cortex and medulla | Conspicuity of adrenal gland boundary | Sharpness | Artifacts | Subjective noise | Overall image quality |
| 0 | Non-diagnostic | Non-diagnostic | Blurry | Marked | Marked | |
| 0 (worst); | ||||||
| 1 | Poor | Poor | Slight | Major | Major | |
| ≥9 (acceptable); | ||||||
| 2 | Moderate | Moderate | Strong | Minor | Minor | |
| 15 (best) | ||||||
| 3 | Excellent | Excellent | Distinct | Absent | Absent |
2.5Statistical analysis
All statistical analyses were performed using SPSS version 19.0 (SPSS statistics; IBM). All data were expressed as the mean±standard derivation. After using the Kolmogorov–Smirnov test to determine if the data were normally distributed, quantitative data were compared using one-way analysis of variance (ANOVA) with Kruskal–Wallis correction for multiple comparisons. Intraclass correlation analysis was applied to assess inter-observer and intra-observer agreements for qualitative image assessments. Intraclass correlation values under 0.4, between 0.4 and 0.8, and above 0.8 indicated weak, moderate, and strong agreement, respectively. A two-tailed p-value < 0.05 was considered statistically significant.
3Results
3.1Participant characteristics
The 52 participants in this study underwent oncologic staging and were scheduled for the abdominal contrast-enhanced CT examination, consisting of 32 men and 20 women, with a mean age of 59.67±0.94 years. The mean CTDIvol was 11.52±5.09 mGy, the mean DLP was 355.95±198.26 mGy·cm and the mean ED was 5.34±2.97 mSv.
3.2Quantitative image assessment
CT number did not significantly differ between the five reconstruction algorithms. All other parameters, including noise, noise reduction rate, SNR, and CNR differed significantly (p < 0.001). Noise was significantly lower for DLIR-M, DLIR-H, and ASiR-V 70% compared with ASiR-V 30% and DLIR-L (ASiR-V 30% vs. DLIR-L, p = 0.075), and DLIR-H exhibited the lowest noise (Fig. 1A). Similar results were obtained for the SNRs and CNRs in the renal cortex, renal medulla, renal artery, and adrenal gland. DLIR-M, DLIR-H, and ASiR-V 70% exhibited similar SNRs and CNRs, but were significantly higher than that of ASiR-V 30% and DLIR-L (Fig. 1B, D).
Fig. 1
Quantitative image analysis of ASiR-V and DLIR. All parameters, including noise, noise reduction rate, SNR, and CNR differed significantly between the five reconstruction algorithms (p < 0.001). Noise was significantly lower for DLIR-M, DLIR-H, and ASiR-V 70% compared with ASiR-V 30% and DLIR-L. DLIR-H exhibited the lowest noise (A). Noise reduction rate relative to ASiR-V 30% significantly differed between the DLIR groups and ASiR-V 70%, ASiR-V 70% (47.04%) showed similar noise reduction rate to DLIR-M (43.83%). DLIR-H yielded the highest noise reduction rate (61.6%) (C). Similar results were obtained for the SNRs and CNRs in the renal cortex, renal medulla, renal artery, and adrenal gland (B, D).
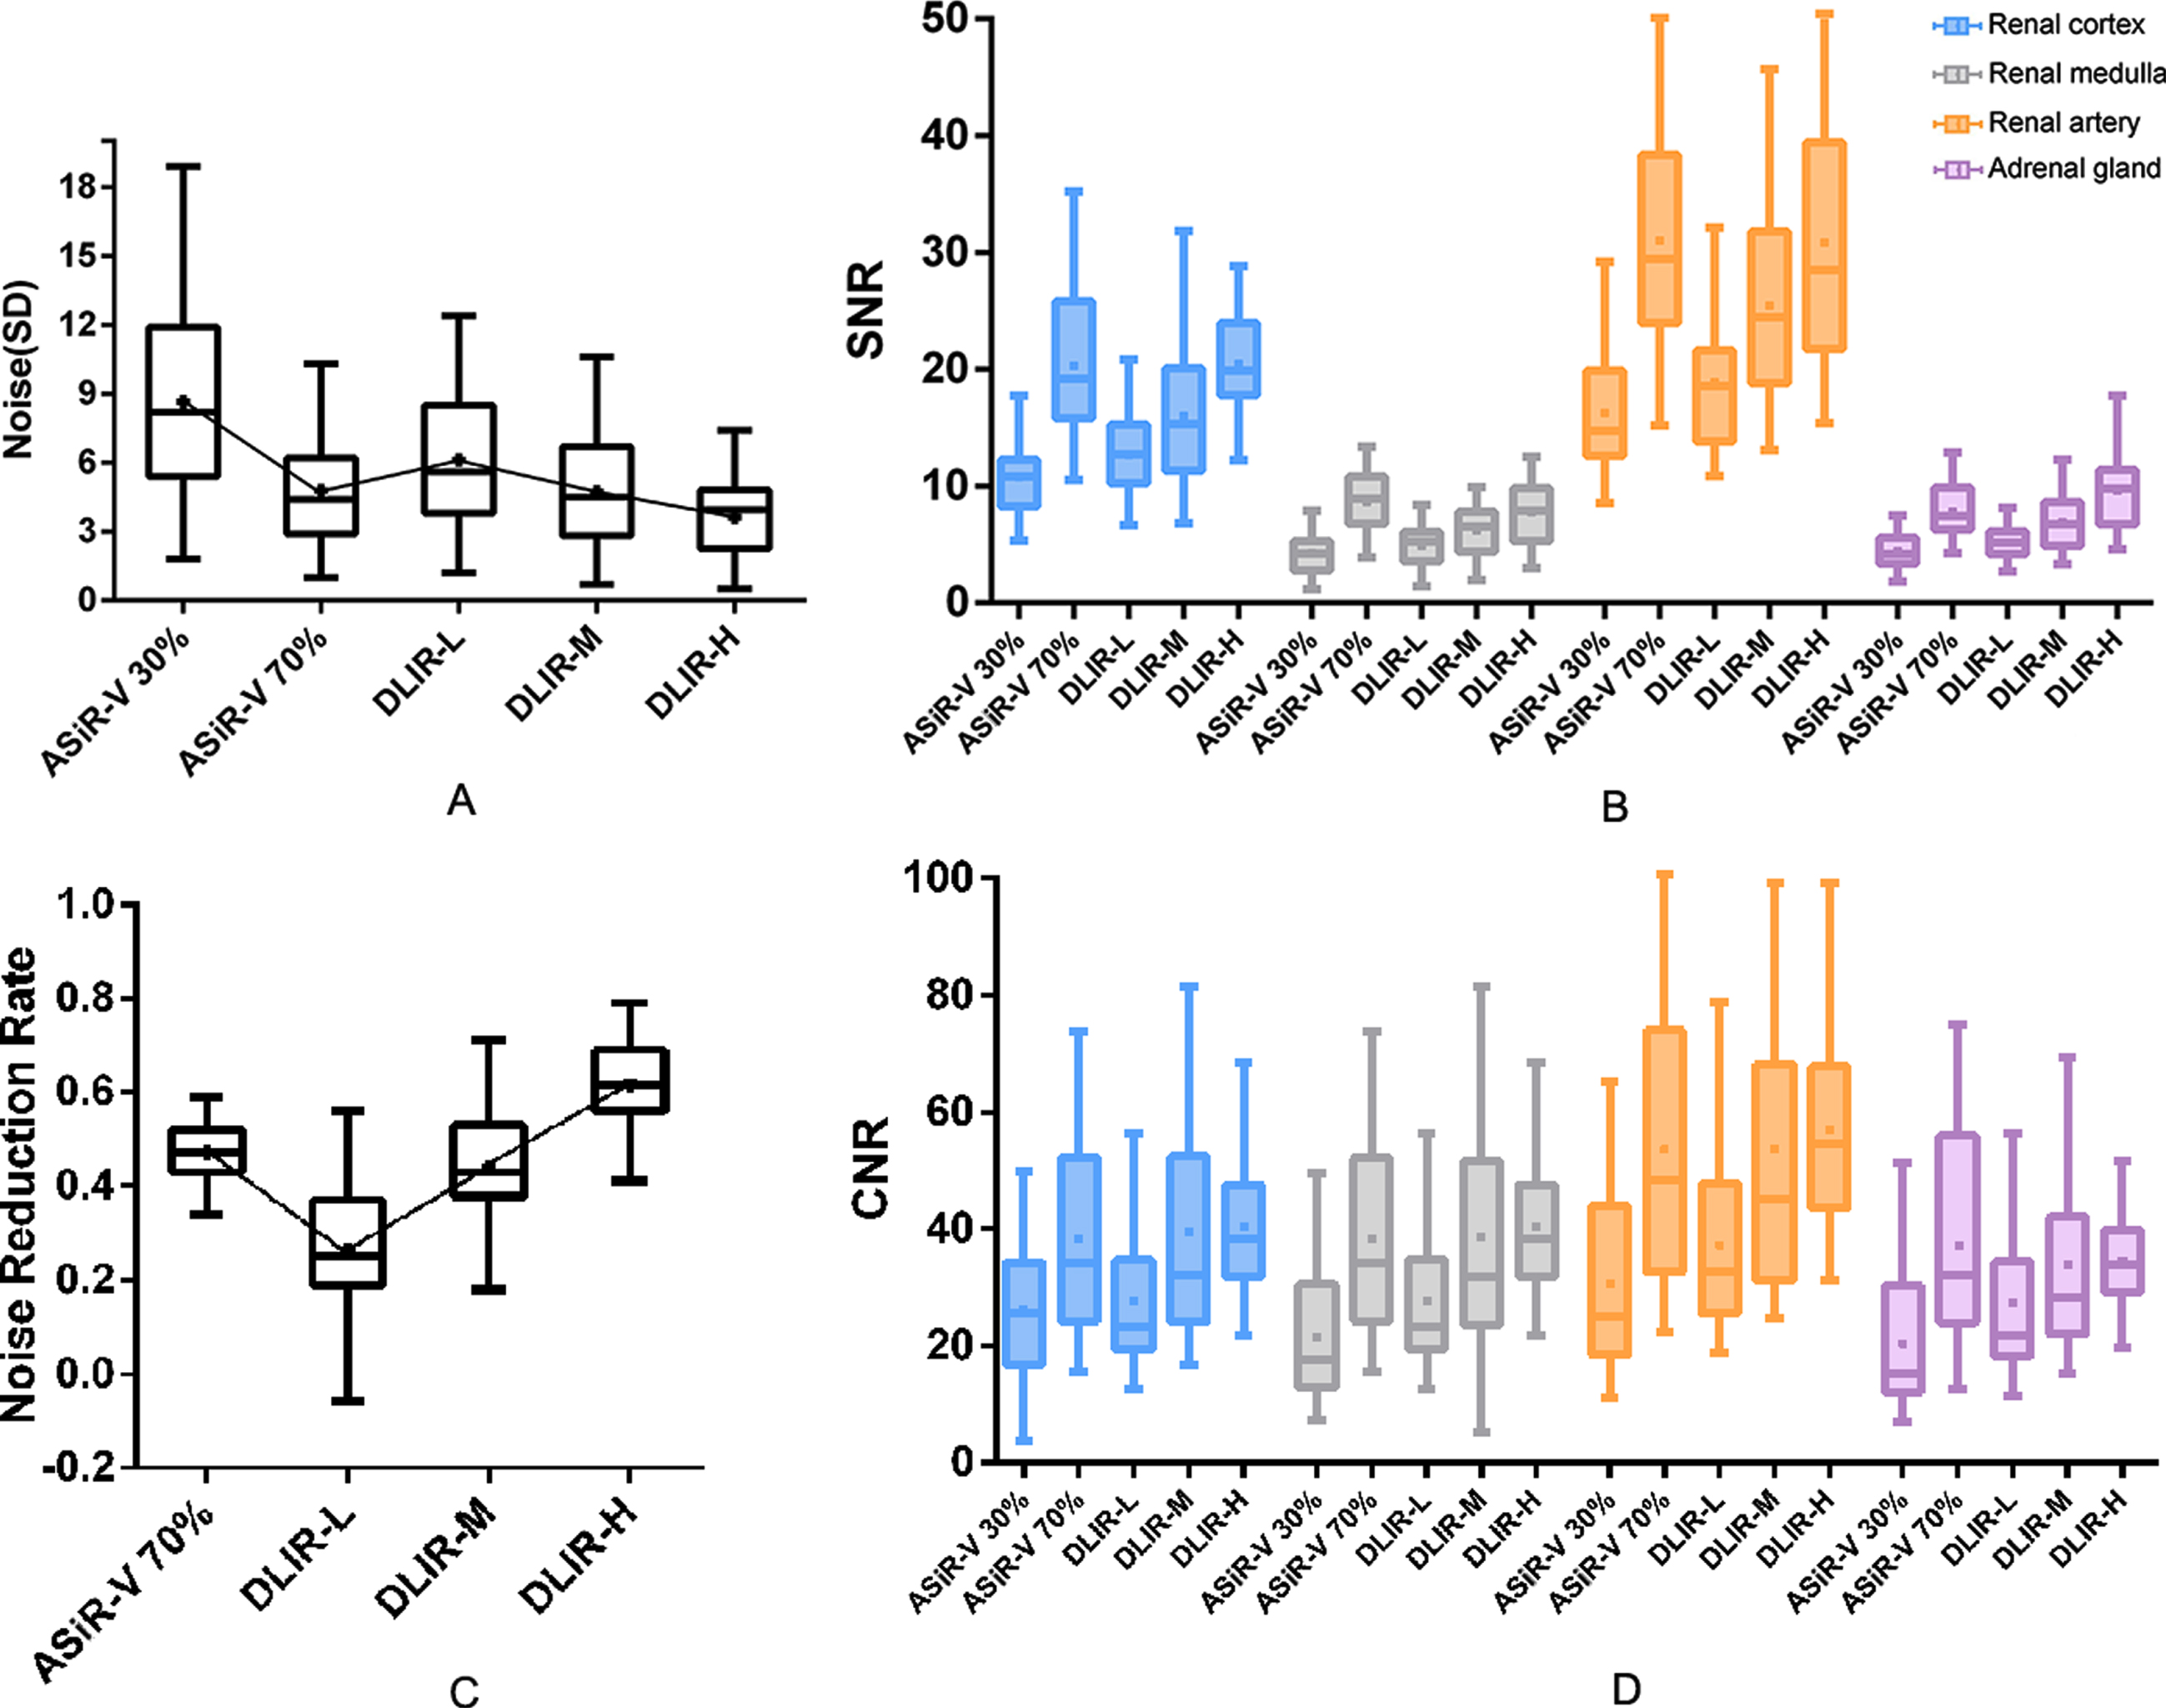
The noise reduction rate relative to ASiR-V 30% was significantly different between the DLIR groups and ASiR-V 70%, ASiR-V 70% (47.04%) showed a similar noise reduction rate to DLIR-M (43.83%) (ASiR-V 70% vs. DLIR-M, p = 1.000), and DLIR-H yielded the highest noise reduction rate (61.6%) (Fig. 1C). The results of the quantitative image analysis are summarized in Table 2 and Fig. 1.
Table 2
Quantitative image analysis using ASiR-V and DLIR
| Values | 30% ASiR-V | 70% ASiR-V | DLIR-L | DLIR-M | DLIR-H | p value | |
| CT number(HU) | Renal cortex | 126.51±19.24 | 128.91±21.02 | 129.91±20.98 | 124.17±25.41 | 129.38±18.72 | 0.627 |
| Renal medulla | 53.20±14.04 | 53.42±11.97 | 52.65±12.83 | 52.65±12.02 | 52.40±11.26 | 0.993 | |
| Renal artery | 243.33±37.03 | 237.15±39.94 | 246.32±40.32 | 249.61±38.67 | 247.34±38.67 | 0.552 | |
| Adrenal gland | 64.23±12.23 | 62.55±10.87 | 63.35±11.11 | 63.94±12.09 | 65.32±12.34 | 0.815 | |
| Noise(SD) | 8.66±4.16 | 4.77±2.30 | 6.13±2.86 | 4.71±2.19 | 3.64±1.67 | < 0.001 | |
| Noise reduction rate(%) | – | 47.04% | 26.19% | 43.83% | 61.60% | < 0.001 | |
| SNR | Renal cortex | 10.78±2.89 | 20.29±6.20 | 12.66±3.14 | 16.02±5.90 | 20.45±4.14 | < 0.001 |
| Renal medulla | 4.26±1.55 | 8.62±2.51 | 4.89±1.58 | 6.23±2.01 | 7.79±2.68 | < 0.001 | |
| Renal artery | 16.28±5.04 | 31.03±9.4 | 18.90±5.74 | 25.36±8.10 | 30.84±11.52 | < 0.001 | |
| Adrenal gland | 4.43±1.43 | 8.14±2.38 | 5.21±1.34 | 6.84±2.19 | 9.69±3.24 | < 0.001 | |
| CNR | Renal cortex | 30.70±15.34 | 54.29±23.48 | 37.24±14.85 | 54.31±27.22 | 57.07±16.61 | < 0.001 |
| Renal medulla | 20.40±10.87 | 38.05±17.77 | 26.92±12.74 | 33.51±14.82 | 34.89±8.30 | < 0.001 | |
| Renal artery | 46.05±22.85 | 80.98±36.82 | 54.77±20.69 | 87.16±43.03 | 87.02±27.99 | < 0.001 | |
| Adrenal gland | 21.52±10.61 | 38.27±16.61 | 27.74±12.26 | 39.42±19.32 | 40.44±11.68 | < 0.001 |
3.3Qualitative image assessment
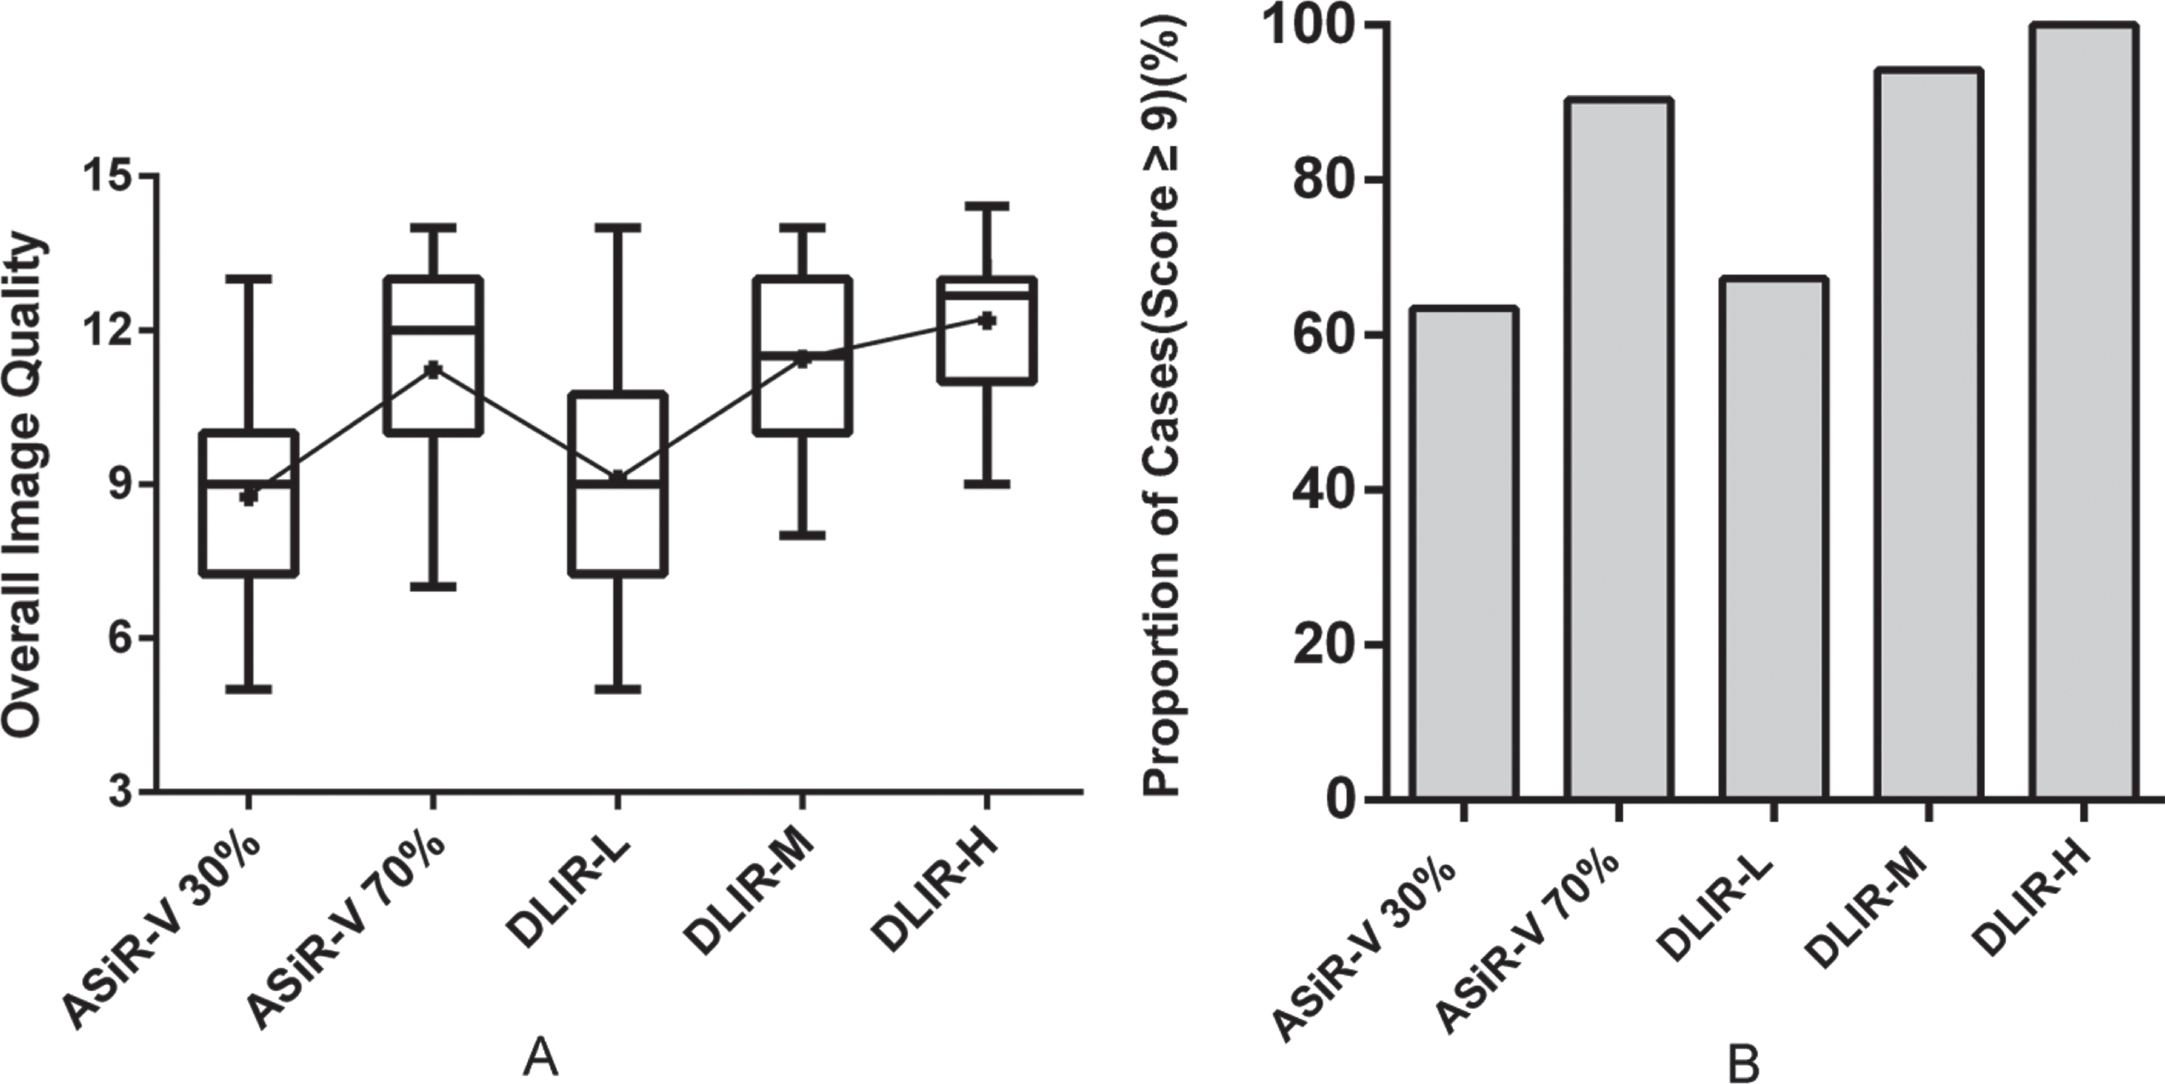
The overall image quality was significantly different between the five types of reconstruction (p < 0.001). Compared to ASiR-V 30% and DLIR-L (ASiR-V 30% vs. DLIR-L, p = 1.000), the overall image quality was better using DLIR-M, DLIR-H, and ASiR-V 70%, with DLIR-H being of the highest quality. The scores of overall image quality ranked from the highest to lowest were as follows: DLIR-H, DLIR-M, ASiR-V 70%, DLIR-L, and ASiR-V 30% (Fig. 2A).
Fig. 2
Overall image quality of ASiR-V and DLIR. Overall image quality scores were graded on a scale from 0 (worst) to 15 (best). Compared to ASiR-V 30% and DLIR-L, the overall image quality was better for DLIR-M, DLIR-H, and ASiR-V 70%. DLIR-H exhibited the highest overall image quality score (A). Images with scores≥9 were considered to be of acceptable diagnostic quality. The proportion of cases with scores≥9 from the highest to the lowest was as follows: DLIR-H (100%), DLIR-M (94.23%), ASiR-V70% (90.38%), DLIR-L (67.31%), and ASiR-V 30% (63.46%) (B).
The differentiation of the renal cortex and medulla, the conspicuity of the adrenal gland boundary, and artifacts exhibited the same pattern: with significant differences among the five types of reconstruction (p < 0.001), ASiR-V 30% and DLIR-L showed close levels (p = 0.246, p = 0193, p = 0677), and values were better in ASiR-V 70%, DLIR-M, and DLIR-H.
Conversely, sharpness was rated better using ASiR-V 30% and DLIR-L (ASiR-V 30% vs. DLIR-L, p = 0.454). The sharpness scores ranked from the highest to lowest were as follows: ASiR-V 30%, DLIR-L, DLIR-M, ASiR-V 70%, and DLIR-H. The scores of subjective noise increased gradually as the strength of DLIR increased, however, they did not differ between ASiR-V 30% vs. DLIR-L (p = 0.514) and ASiR-V 70% vs. DLIR-M (p = 1.000). DLIR-H exhibited the highest subjective noise score. The subjective noise scores from the highest to the lowest were as follows: DLIR-H, DLIR-M, ASiR-V 70%, DLIR-L, and ASiR-V 30%.
An overall image quality score≥9 was considered an acceptable diagnostic quality. The proportion of cases with scores≥9 was better for DLIR-M, DLIR-H, and ASiR-V 70%, compared with ASiR-V 30% and DLIR-L. The proportion of cases with scores≥9 from the highest to the lowest was as follows: DLIR-H (100%), DLIR-M (94.23%), ASiR-V70% (90.38%), DLIR-L (67.31%), and ASiR-V 30% (63.46%) (Fig. 2B).
The inter-observer intraclass correlation coefficient was 0.753 (95% confidence interval [CI]: 0.636, 0.840; P < 0.001) for the differentiation of the renal cortex and medulla, 0.740 (95% CI: 0.620, 0.831; P < 0.001) for the conspicuity of the adrenal gland boundary, 0.911 (95% CI: 0.848, 0.959; P < 0.001) for sharpness, 0.871 (95% CI: 0.795, 0.929; P < 0.001) for artifacts, and 0.814 (95% CI: 0.718, 0.886; P < 0.001) for subjective noise. The intra-observer intraclass correlation coefficient was 0.867 (95% CI: 0.566, 0.960; P < 0.001) for the differentiation of the renal cortex and medulla, 0.914 (95% CI: 0.719, 0.974; P < 0.001) for the conspicuity of the adrenal gland boundary, 0.939 (95% CI: 0.836, 0.966; P < 0.001) for sharpness, 0.946 (95% CI: 0.824, 0.984; P < 0.001) for artifacts, and 0.980 (95% CI: 0.936, 0.994; P < 0.001) for subjective noise. The results of the qualitative image analyses are summarized in Table 3, Table 4, and Fig. 2.
Table 3
Qualitative image analysis using ASiR-V and DLIR
| Reconstruction algorithm | Differentiation of renal cortex and medulla | Conspicuity of adrenal gland boundary | Sharpness | Artifact | Subjective noise | |||||
| Reader1 | Reader2 | Reader1 | Reader2 | Reader1 | Reader2 | Reader1 | Reader2 | Reader1 | Reader2 | |
| ASiR-V 30% | 1.67±0.51 | 1.11±0.66 | 1.84±0.37 | 1.24±0.43 | 2.87±0.34 | 2.16±0.50 | 1.19±0.72 | 1.13±0.35 | 1.00±0.63 | 0.83±0.38 |
| ASiR-V 70% | 2.71±0.46 | 1.95±0.58 | 2.76±0.49 | 2.19±0.66 | 1.58±0.54 | 1.22±0.42 | 1.98±0.73 | 1.57±0.50 | 2.17±0.68 | 1.83±0.46 |
| DLIR-L | 1.79±0.57 | 1.16±0.65 | 1.86±0.35 | 1.46±0.51 | 2.56±0.61 | 0.97±0.16 | 1.25±0.74 | 1.20±0.41 | 1.35±0.86 | 0.90±0.31 |
| DLIR-M | 2.56±0.54 | 2.30±0.66 | 2.68±0.58 | 2.62±0.48 | 1.79±0.46 | 2.95±0.23 | 2.27±0.72 | 1.73±0.45 | 2.15±0.61 | 1.77±0.43 |
| DLIR-H | 2.75±0.44 | 2.73±0.45 | 2.78±0.48 | 2.78±0.42 | 1.08±0.65 | 1.22±0.48 | 2.73±0.63 | 2.80±0.41 | 2.81±0.40 | 2.83±0.38 |
| Interclass correlation coefficient | 0.653 | 0.640 | 0.815 | 0.759 | 0.810 | |||||
Table 4
Overall Image quality using ASiR-V and DLIR
| Values | ASiR-V 30% | ASiR-V 70% | DLIR-L | DLIR-M | DLIR-H | p value |
| Overall Image quality | 8.75±1.76 | 11.23±1.84 | 9.10±2.13 | 11.44±1.70 | 12.19±1.40 | <0.001 |
| Score≥9 (n, %) | 33, 63.46% | 47, 90.38% | 35, 67.31% | 49, 94.23% | 52, 100% | < 0.001 |
| Score < 9 (n, %) | 19, 36.54% | 5, 9.62% | 17, 32.69% | 3, 5.77% | 0, 0% | < 0.001 |
The Overall image quality scores were calculated on a scale from 0 (worst) to 15 (best) based on the scores from all subjective values and with scores≥9 was considered acceptable.
4Discussion
In this study, we aimed to investigate whether renal and adrenal CT with DLIR algorithms could be used for routine assessments. We found that DLIR significantly improved overall image qualities with superior noise reduction rates and fewer artifacts compared with ASiR-V, which agreed with previous findings from other organs [20–23]. The use of deep neural networks for CT image reconstruction is promising for the improvement of image quality [11, 20]. Through rigorous validations and extensive testing to reduce the differences between reconstruction outputs and ground images, DLIR can generate images that accurately match ground images to improve the image quality [20], as proven by our study.
In routine non-contrast CT images, the differences in HU were subtle between the renal cortex and medulla. Although the differentiation between renal cortex and medulla was relatively remarkable in contrast-enhanced scanning, DLIR still yielded a much clearer boundary between two adjacent structures (Fig. 3A, B). DLIP-M and DLIP-H showed superior SNRs and CNRs compared with ASiR-V 30%, and DLIP-H exhibited the best noise reduction rate out of the five approaches. Given that the volume of adrenal glands was small, improvements in the noise reduction exhibited by DLIR were beneficial.
Fig. 3
Image quality comparison of ASiR-V 30%, ASiR-V 70%, DLIR-L, DLIR-M, and DLIR-H. Images were compared between all of the reconstruction datasets in contrast-enhanced renal and adrenal CT (A) (B). ASiR-V 70% showed similar subjective image appearances and objective values to DLIR-H and DLIR-M. However, DLIR images yielded better visual appearances even in some cases with high noise and artifact, as well as in some cases with small lesions. A case showed severe radial and stripy artifacts after the interventional therapy in adrenal glands. Additionally, several renal cysts showed. DLIR images showed a better denoise effect and depiction of lesions. (C). Another case showed a small and low-attenuation lesion in the right adrenal gland which was close to the hepatis. The boundary between them was better differentiated in DLIR images (D).
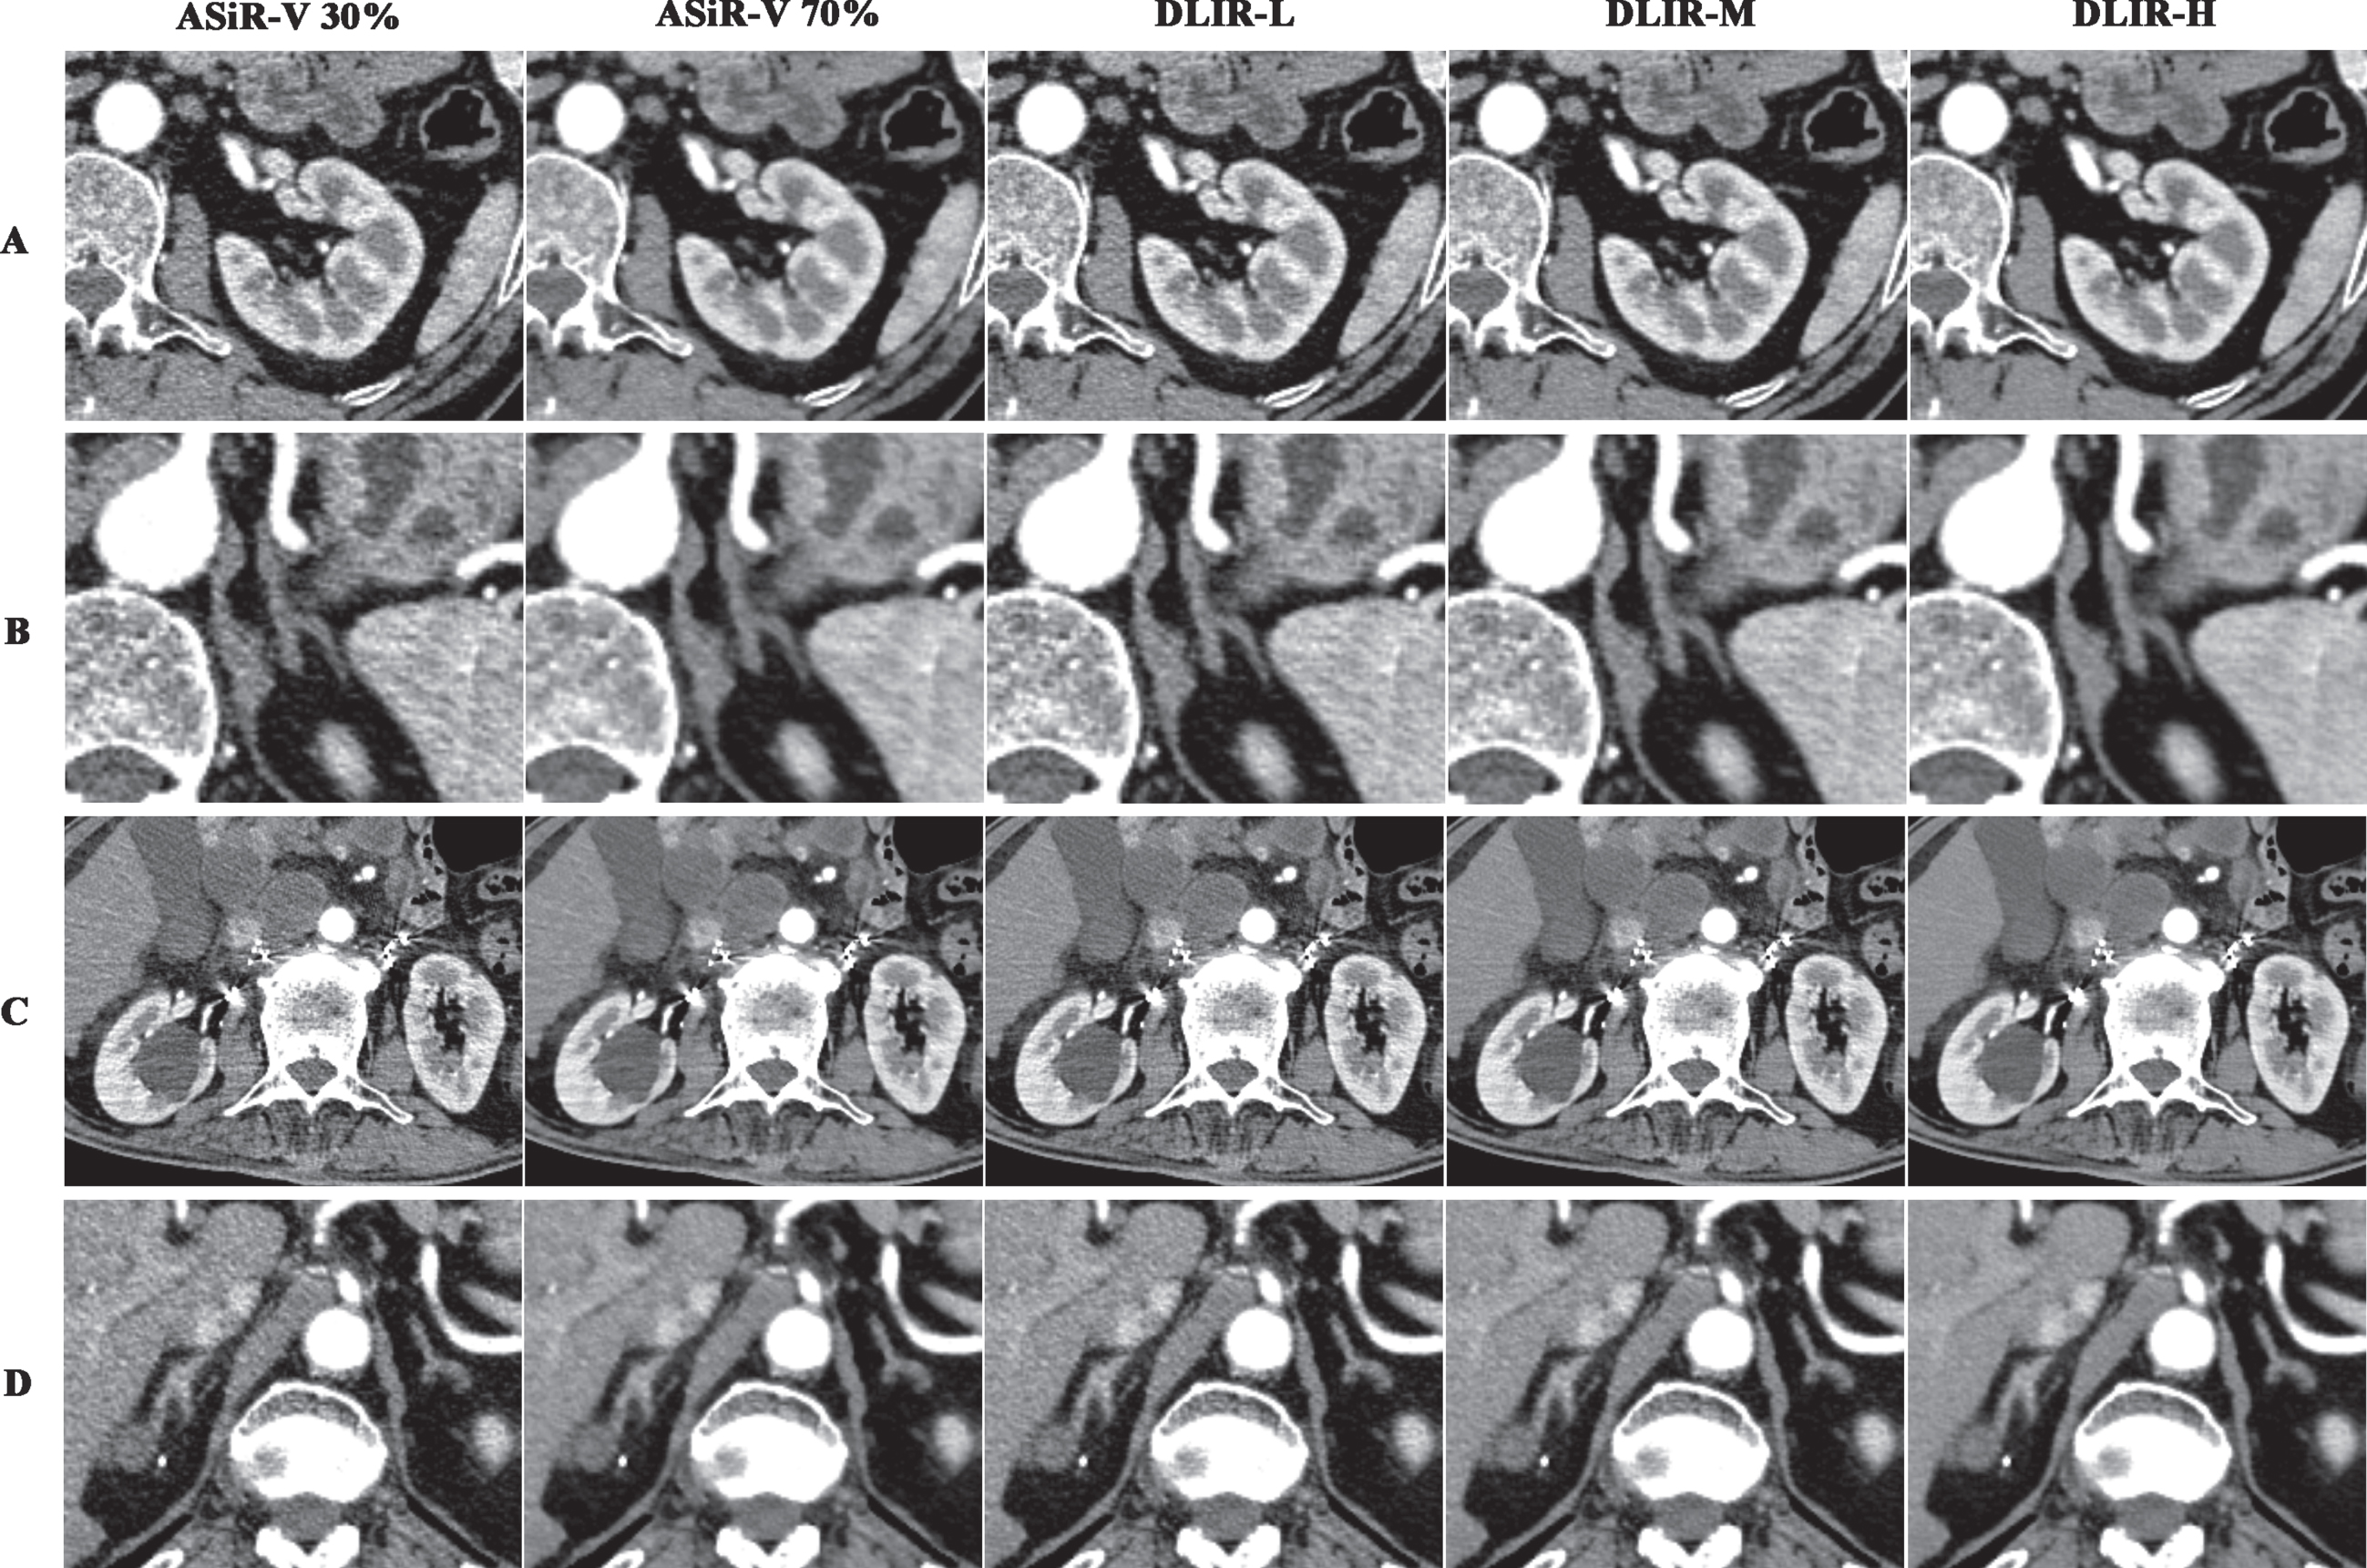
DLIR-H exhibited the best subjective image quality scores of all reconstruction datasets (Fig. 3A, B). Additionally, DLIR images yielded better visual contrasts than ASiR-V, and the reader scores of subjective assessments were generally higher in DLIR-H. DLIR improved the differentiation between structures and overall image appearances, even when the highest level of reconstruction was used in DLIR. DLIR-H also displayed reasonably good quality in some cases with high noise and artifact, as well as in some cases with small lesions (Fig. 3C, D).
Reduced sharpness was followed by noise reduction, and lower noise was associated with higher radiation doses or undesirable image noise texture due to a denoising algorithm [22]. Images with DLIR achieved a superior trade-off between the differentiation of structural boundaries and noise to maintain adequate resolution and improve image texture compared with ASiR-V [24]. The lowest sharpness was with DLIR-H, and minor blurring of the boundaries of adrenal glands or small hypo-attenuating lesions (< 5 mm) was observed as well [14]. Meanwhile, DLIR-M provided a better balance between the noise reduction and sharpness in cases with small lesions. That is, DLIR strengths should be chosen to balance the degree of denoising and the extent of conspicuity in clinical practice.
DLIR incorporates a deep neural network trained with high-quality FBP datasets of ground truth images. DLIR images with high quality are critical technique basis to identify renal and adrenal lesions which are usually small and with complex appearances, and prevent misdiagnosis related to pitfalls in clinical imaging.
4.1Strength and limitation
The CT scanning in renal and adrenal showed a high contrast in the arterial phase to distinguish lesions and the differences among renal structures. Conventionally, the arterial phase and nephrographic phase imaging should both be performed because the enhancement pattern may help differentiate lesions, and the arterial phase better characterizes the anatomy and vascular disease entities [3, 25]. Although the image quality of other relevant enhancement phases in renal and adrenal CT can be evaluated theoretically, only the arterial phase initiated by bolus tracking was evaluated in our study for that optimal venous and delay times for renal and adrenal lesions were not identical. Further studies of renal and adrenal CT in the multiphase are expected.
An overall image quality score≥9 was considered of acceptable diagnostic quality. Several values were evaluated from qualitative aspects and the overall image quality score was a relatively comprehensive manner in our view. The maximum of the overall image quality score was fifteen, and we thought that more than sixty percent of the total score was qualified in subjective assessment of the image quality. A similar evaluation method was used for an objective discussion of acceptable scores in another study likewise [26].
Besides, there were some other limitations in this study. First, additional task-specific studies are needed to analyze how DLIR impacted diagnostic accuracy and its performance under pathologic conditions in different organs. Second, the clinical images were evaluated using only one radiation dose. The qualitative results must be evaluated at different radiation doses to determine how variations impact the DLIR performance. Furthermore, subjective image quality assessments were performed by only two radiologists. Thus, additional radiologists are required to evaluate subjective results. Further studies with larger sample sizes are expected to confirm our results and to explore the appropriate DLIR strength under specific clinical conditions.
5Conclusions
DLIR is promising as an advanced reconstruction method and exhibited desirable performance in improving the overall quality of clinical renal and adrenal CT images. DLIR-H reconstruction provided superior image qualities and better noise reduction than ASiR-V.
Acknowledgments
We thank International Science Editing (https://www.internationalscienceediting.com) for editing this manuscript.
References
[1] | Pearce M.S. , Salotti J.A. , Little M.P. , et al., Radiation exposure from CT scans in childhood and subsequent risk of leukaemia and brain tumours: a retrospective cohort study, Lancet 380: (9840) ((2012) ), 499–505. |
[2] | Brenner D.J. , Hall E.J. , Computed tomography - an increasing source of radiation exposure, N Engl J Med 357: (22) ((2007) ), 2277–2284. |
[3] | Krishna S. , Murray C.A. , McInnes M.D. , et al., CT imaging of solid renal masses: pitfalls and solutions, Clin Radiol 72: (9) ((2017) ), 708–721. |
[4] | Birnbaum B.A. , Hindman N. , Lee J. , Babb J.S. , Multi-detector row CT attenuation measurements: assessment of intra- and interscanner variability with an anthropomorphic body CT phantom, Radiology 242: (1) ((2007) ), 109–119. |
[5] | Fleischmann D. , Boas F.E. , Computed tomography–old ideas and new technology, Eur Radiol 21: (3) ((2011) ), 510–517. |
[6] | Pickhardt P.J. , Lubner M.G. , Kim D.H. , et al., Abdominal CT with model-based iterative reconstruction (MBIR): initial results of a prospective trial comparing ultralow-dose with standard-dose imaging, Am J Roentgenol 199: (6) ((2012) ), 1266–1274. |
[7] | Chen L.H. , Jin C. , Li J.Y. , et al., Image quality comparison of two adaptive statistical iterative reconstruction (ASiR, ASiR-V) algorithms and filtered back projection in routine liver CT, Br J Radiol 91: (1088) ((2018) ), 20170655. |
[8] | Hardie A.D. , Nelson R.M. , Egbert R. , et al., What is the preferred strength setting of the sinogram-affirmed iterative reconstruction algorithm in abdominal CT imaging? Radiol Phys Technol 8: (1) ((2015) ), 60–63. |
[9] | Geyer L.L. , Schoepf U.J. , Meinel F.G. , et al., State of the Art: Iterative CT Reconstruction Techniques, Radiology 276: (2) ((2015) ), 339–357. |
[10] | McCollough C.H. , Leng S. , Use of artificial intelligence in computed tomography dose optimisation, Ann ICRP 49: (1_suppl) ((2020) ), 113–125. |
[11] | Chartrand G. , Cheng P.M. , Vorontsov E. , et al., Deep Learning: A Primer for Radiologists, Radiographics 37: (7) ((2017) ), 2113–2131. |
[12] | LeCun Y. , Bengio Y. , Hinton G. , Deep learning, Nature 521: (7553) ((2015) ), 436–444. |
[13] | Greffier J. , Hamard A. , Pereira F. , et al., Image quality and dose reduction opportunity of deep learning image reconstruction algorithm for CT: a phantom study, Eur Radiol 30: (7) ((2020) ), 3951–3959. |
[14] | Jensen C.T. , Liu X. , Tamm E.P. , et al., Image quality assessment of abdominal CT by use of new deep learning image reconstruction: Initial experience, Am J Roentgenol 215: (1) ((2020) ), 50–57. |
[15] | Yang S. , Bie Y. , Pang G. , et al., Impact of novel deep learning image reconstruction algorithm on diagnosis of contrast-enhanced liver computed tomography imaging: Comparing to adaptive statistical iterative reconstruction algorithm, J Xray Sci Technol 29: (6) ((2021) ), 1009–1018. |
[16] | Lee S. , Choi Y.H. , Cho Y.J. , et al., Noise reduction approach in pediatric abdominal CT combining deep learning and dual-energy technique, Eur Radiol 31: (4) ((2020) ), 2218–2226. |
[17] | Hsieh L.E. J , Nett B. et al., A new era of image reconstruction: TrueFidelity™, Technical white paper on deep learning image reconstruction. Available at: https://www.gehealthcare.co.uk/-/jssmedia/040dd213fa89463287155151fdb01922.pdf. (accessed April 2020). |
[18] | The Recommendations of the International Commission on Radiological Protection. ICRP publication 103, Ann ICRP 37: (2-4) ((2007) ), 1–332. |
[19] | Thitaikumar A. , Krouskop T.A. , Ophir J. , Signal-to-noise ratio, contrast-to-noise ratio and their trade-offs with resolution in axial-shear strain elastography, Phys Med Biol 52: (1) ((2007) ), 13–28. |
[20] | Brady S.L. , Trout A.T. , Somasundaram E. , et al., Improving image quality and reducing radiation dose for pediatric CT by using deep learning reconstruction, Radiology 298: (1) ((2021) ), 180–188. |
[21] | Singh R. , Digumarthy S.R. , Muse V.V. , et al., Image quality and lesion detection on deep learning reconstruction and iterative reconstruction of Submillisievert chest and abdominal CT, Am J Roentgenol 214: (3) ((2020) ), 566–573. |
[22] | Kim I. , Kang H. , Yoon H.J. , et al., Deep learning-based image reconstruction for brain CT: improved image quality compared with adaptive statistical iterative reconstruction-Veo (ASIR-V), Neuroradiology 63: (6) ((2021) ), 905–912. |
[23] | Benz D.C. , Benetos G. , Rampidis G. , et al., Validation of deep-learning image reconstruction for coronary computed tomography angiography: Impact on noise, image quality and diagnostic accuracy, J Cardiovasc Comput Tomogr 14: (5) ((2020) ), 444–451. |
[24] | McLeavy C.M. , Chunara M.H. , Gravell R.J. , et al., The future of CT: deep learning reconstruction, Clin Radiol 76: (6) ((2021) ), 407–415. |
[25] | Schieda N. , Isupov I. , Chung A. , et al., Practical applications of balanced steady-state free-precession (bSSFP) imaging in the abdomen and pelvis, J Magn Reson Imaging 45: (1) ((2017) ), 11–20. |
[26] | Ye K. , Zhu Q. , Li M. , et al., A feasibility study of pulmonary nodule detection by ultralow-dose CT with adaptive statistical iterative reconstruction-V technique, Eur J Radiol 119: ((2019) ), 108652. |


