
Computer-aided COVID-19 diagnosis and a comparison of deep learners using augmented CXRs
Abstract
Background:
Coronavirus Disease 2019 (COVID-19) is contagious, producing respiratory tract infection, caused by a newly discovered coronavirus. Its death toll is too high, and early diagnosis is the main problem nowadays. Infected people show a variety of symptoms such as fatigue, fever, tastelessness, dry cough, etc. Some other symptoms may also be manifested by radiographic visual identification. Therefore, Chest X-Rays (CXR) play a key role in the diagnosis of COVID-19.
Methods:
In this study, we use Chest X-Rays images to develop a computer-aided diagnosis (CAD) of the disease. These images are used to train two deep networks, the Convolution Neural Network (CNN), and the Long Short-Term Memory Network (LSTM) which is an artificial Recurrent Neural Network (RNN). The proposed study involves three phases. First, the CNN model is trained on raw CXR images. Next, it is trained on pre-processed CXR images and finally enhanced CXR images are used for deep network CNN training. Geometric transformations, color transformations, image enhancement, and noise injection techniques are used for augmentation. From augmentation, we get 3,220 augmented CXRs as training datasets. In the final phase, CNN is used to extract the features of CXR imagery that are fed to the LSTM model. The performance of the four trained models is evaluated by the evaluation techniques of different models, including accuracy, specificity, sensitivity, false-positive rate, and receiver operating characteristic (ROC) curve.
Results:
We compare our results with other benchmark CNN models. Our proposed CNN-LSTM model gives superior accuracy (99.02%) than the other state-of-the-art models. Our method to get improved input, helped the CNN model to produce a very high true positive rate (TPR 1) and no false-negative result whereas false negative was a major problem while using Raw CXR images.
Conclusions:
We conclude after performing different experiments that some image pre-processing and augmentation, remarkably improves the results of CNN-based models. It will help a better early detection of the disease that will eventually reduce the mortality rate of COVID.
1Introduction
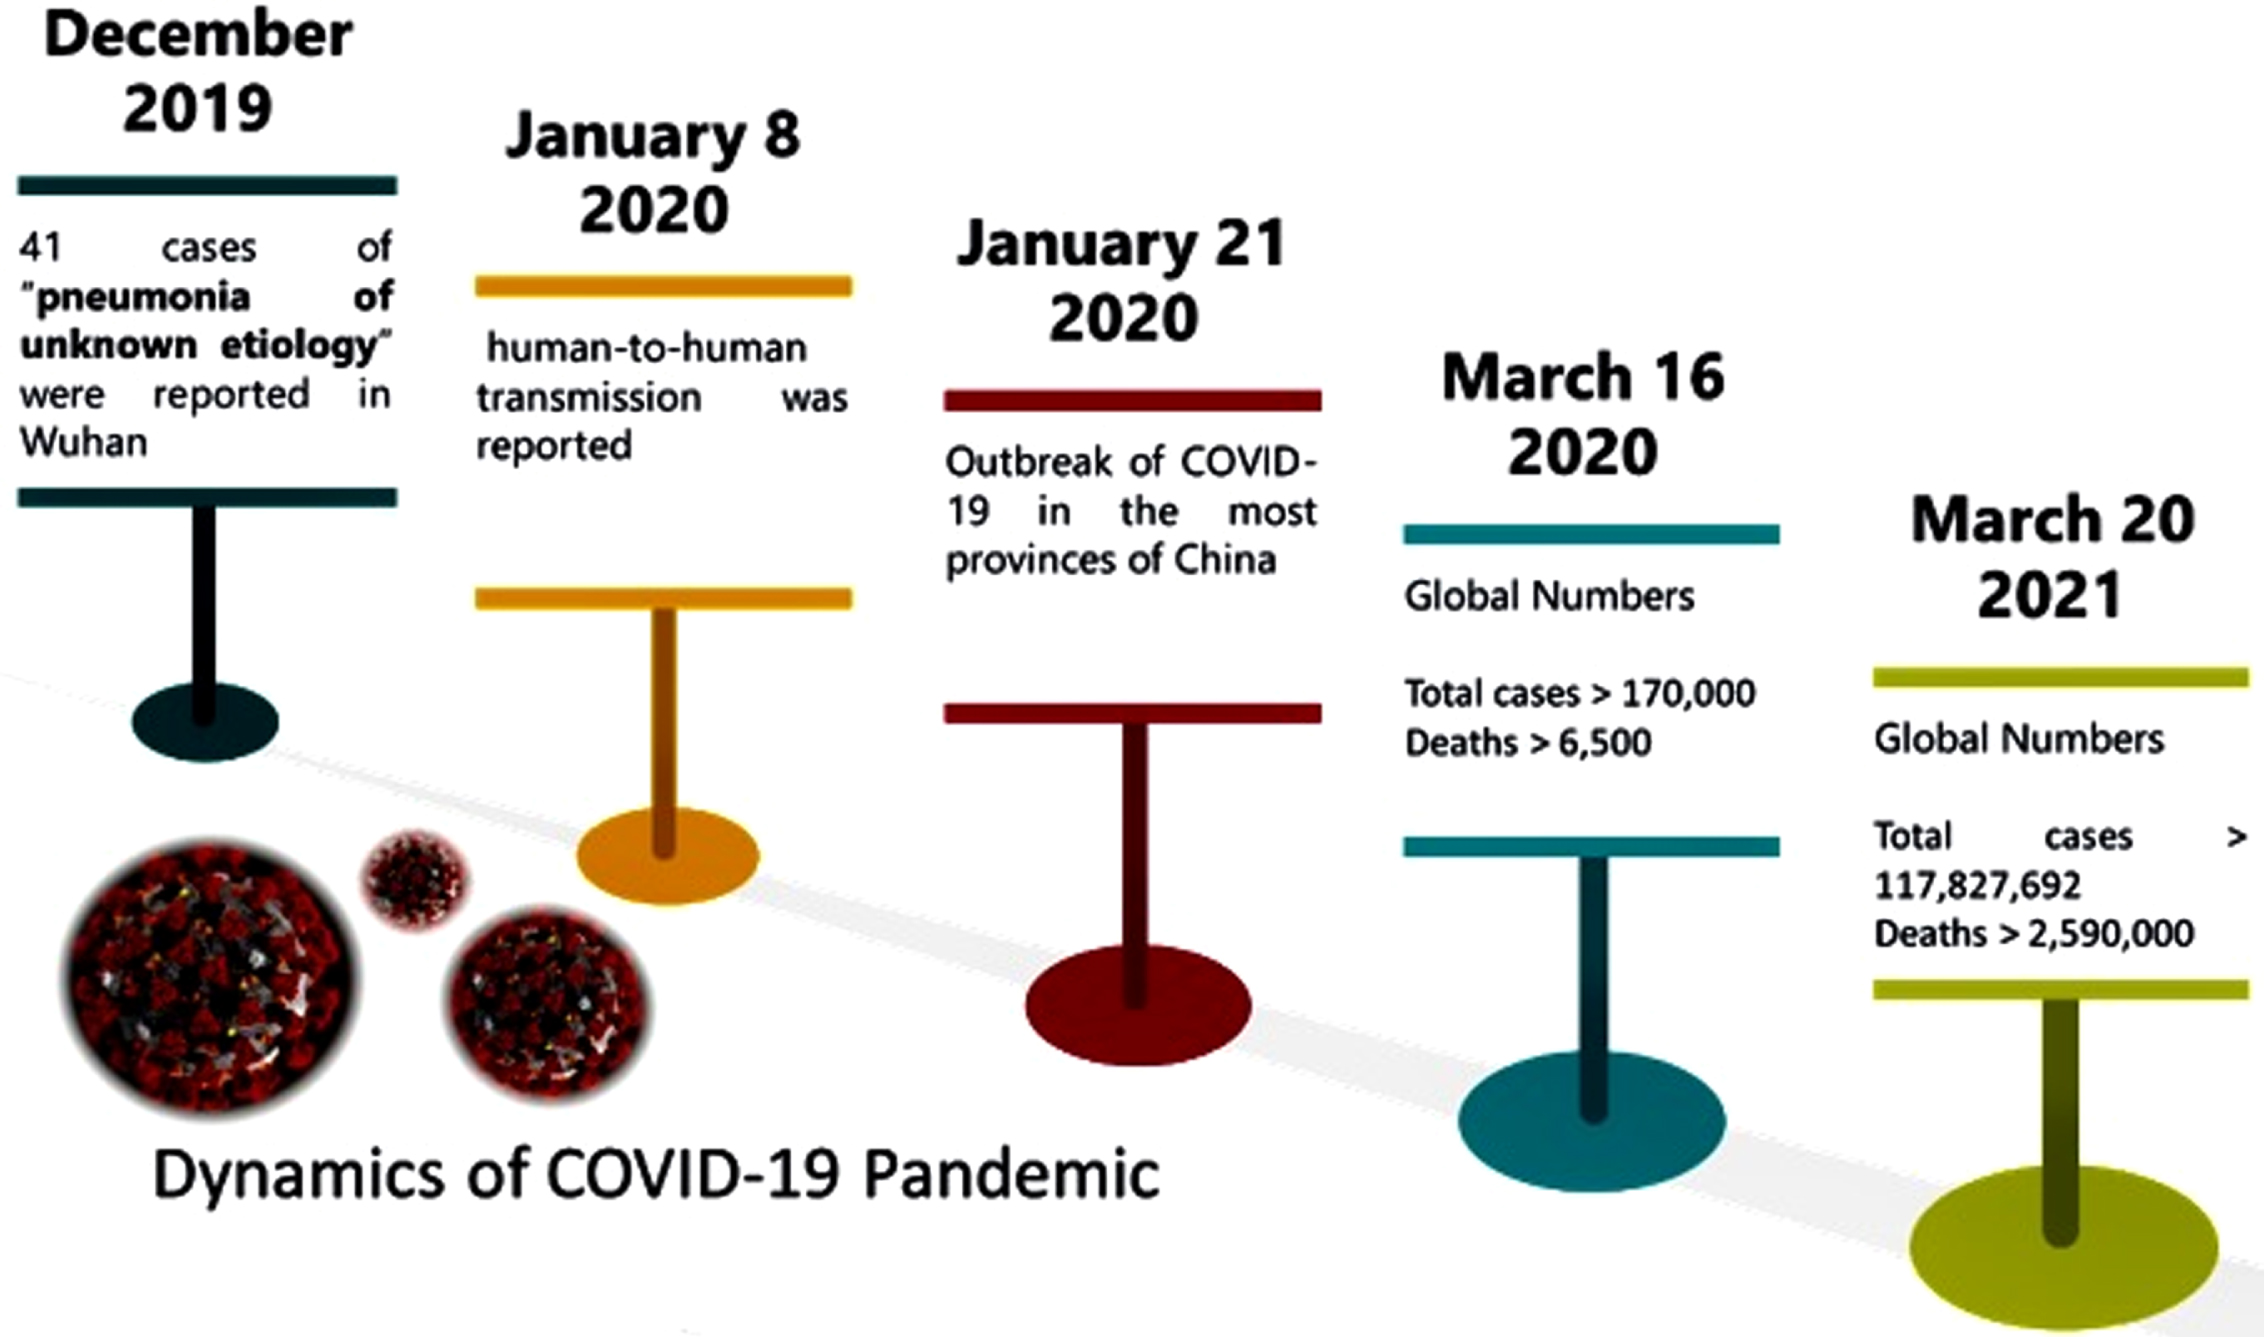
The outbreak of COVID-19 has infected over 160 millions of people across the globe, and over 3.5 million deaths have been officially reported. The term COVID-19 is a shorthand for three words i.e., corona, virus, and disease, plus the year when the disease became a global pandemic (2019). It is a highly contagious and transferable disease with a 5.7 reproductive number (R0) [1]. With such a number, not only the disease has become a serious threat to human life, but it has also caused a financial disaster for both individuals and nations. Early dynamics of the COVID-19 pandemic horrified the world, as in three months it spread globally with 170,000 infected people. A summary of the evolution of the pandemic can be seen in the timeline of COVID-19 spread in Fig. 1. Within one year, the number of casualties reached above 2.59 million.
Fig. 1
Dynamics of Corona Virus in the First Four Months of the Outbreak
For COVID-19 detection, there is a specific Standard Operating Procedures (SOP) recommended by the World Health Organization (WHO). SOPs have to be followed for respiratory specimen or nasal swab specimen collection, storage, and transportation. A real-time reverse transcription polymerase chain reaction (rRT-PCR) test is carried out either on a respiratory specimen or a nasal swab specimen in a laboratory with Bio-safety level three (BSL-3). Still, the sensitivity of the test is reported to be in the range 30%to 60 %in Feb 2020, which improved up to 95%by the end of 2020. Another way to diagnose this deadly disease is by gene sequencing for blood samples, or in other words, RT-PCR for blood samples. Not only that, the testing process takes almost 4 to 6 hours to produce results, the testing kits are inefficient and remain in shortage quite on and off. Therefore, supplementary fast testing methods, with better sensitivity to COVID-19 diagnostic, are extremely needed.
The patients of COVID-19 may show symptoms like dry cough, fever, palpitation, pneumonia, and influenza. Along with these symptoms, acute respiratory infection or lung infection is also reported in COVID-19 patients [2]. Therefore, analysis of lung images can be a very suitable testing method for Computer-Aided Diagnosis (CAD) of COVID-19. For lung examination, Chest X-Rays (CXR) and Computed Tomography (CT) scans are widely used medical images. COVID-19 should be diagnosed quickly if people are infected, so that they can self-isolate, and start their treatment. The formal diagnosis involves RT-PCR test which requires at least 24 hours to produce results using samples taken from throat and nose [3]. On the other hand, an accurate and quick diagnosis of COVID-19 can be achieved from CXR. In recent research [4–6], it is reported that CXRs examination has improved the sensitivity of COVID-19 diagnostic. For additional computer aided applications of COVID-19 diagnosis, the readers are referred to [7–14]. However, manual analysis and interpretation of CXRs are not only quite time consuming, but it is also error-prone due to their subjectivity. With the advancement in digital imaging apparatus, medical image processing can excel the diagnosis process of COVID-19, and increase the reliability and sensitivity of its diagnostic. Therefore, in this research CXRs are used for CAD of the COVID-19 pandemic.
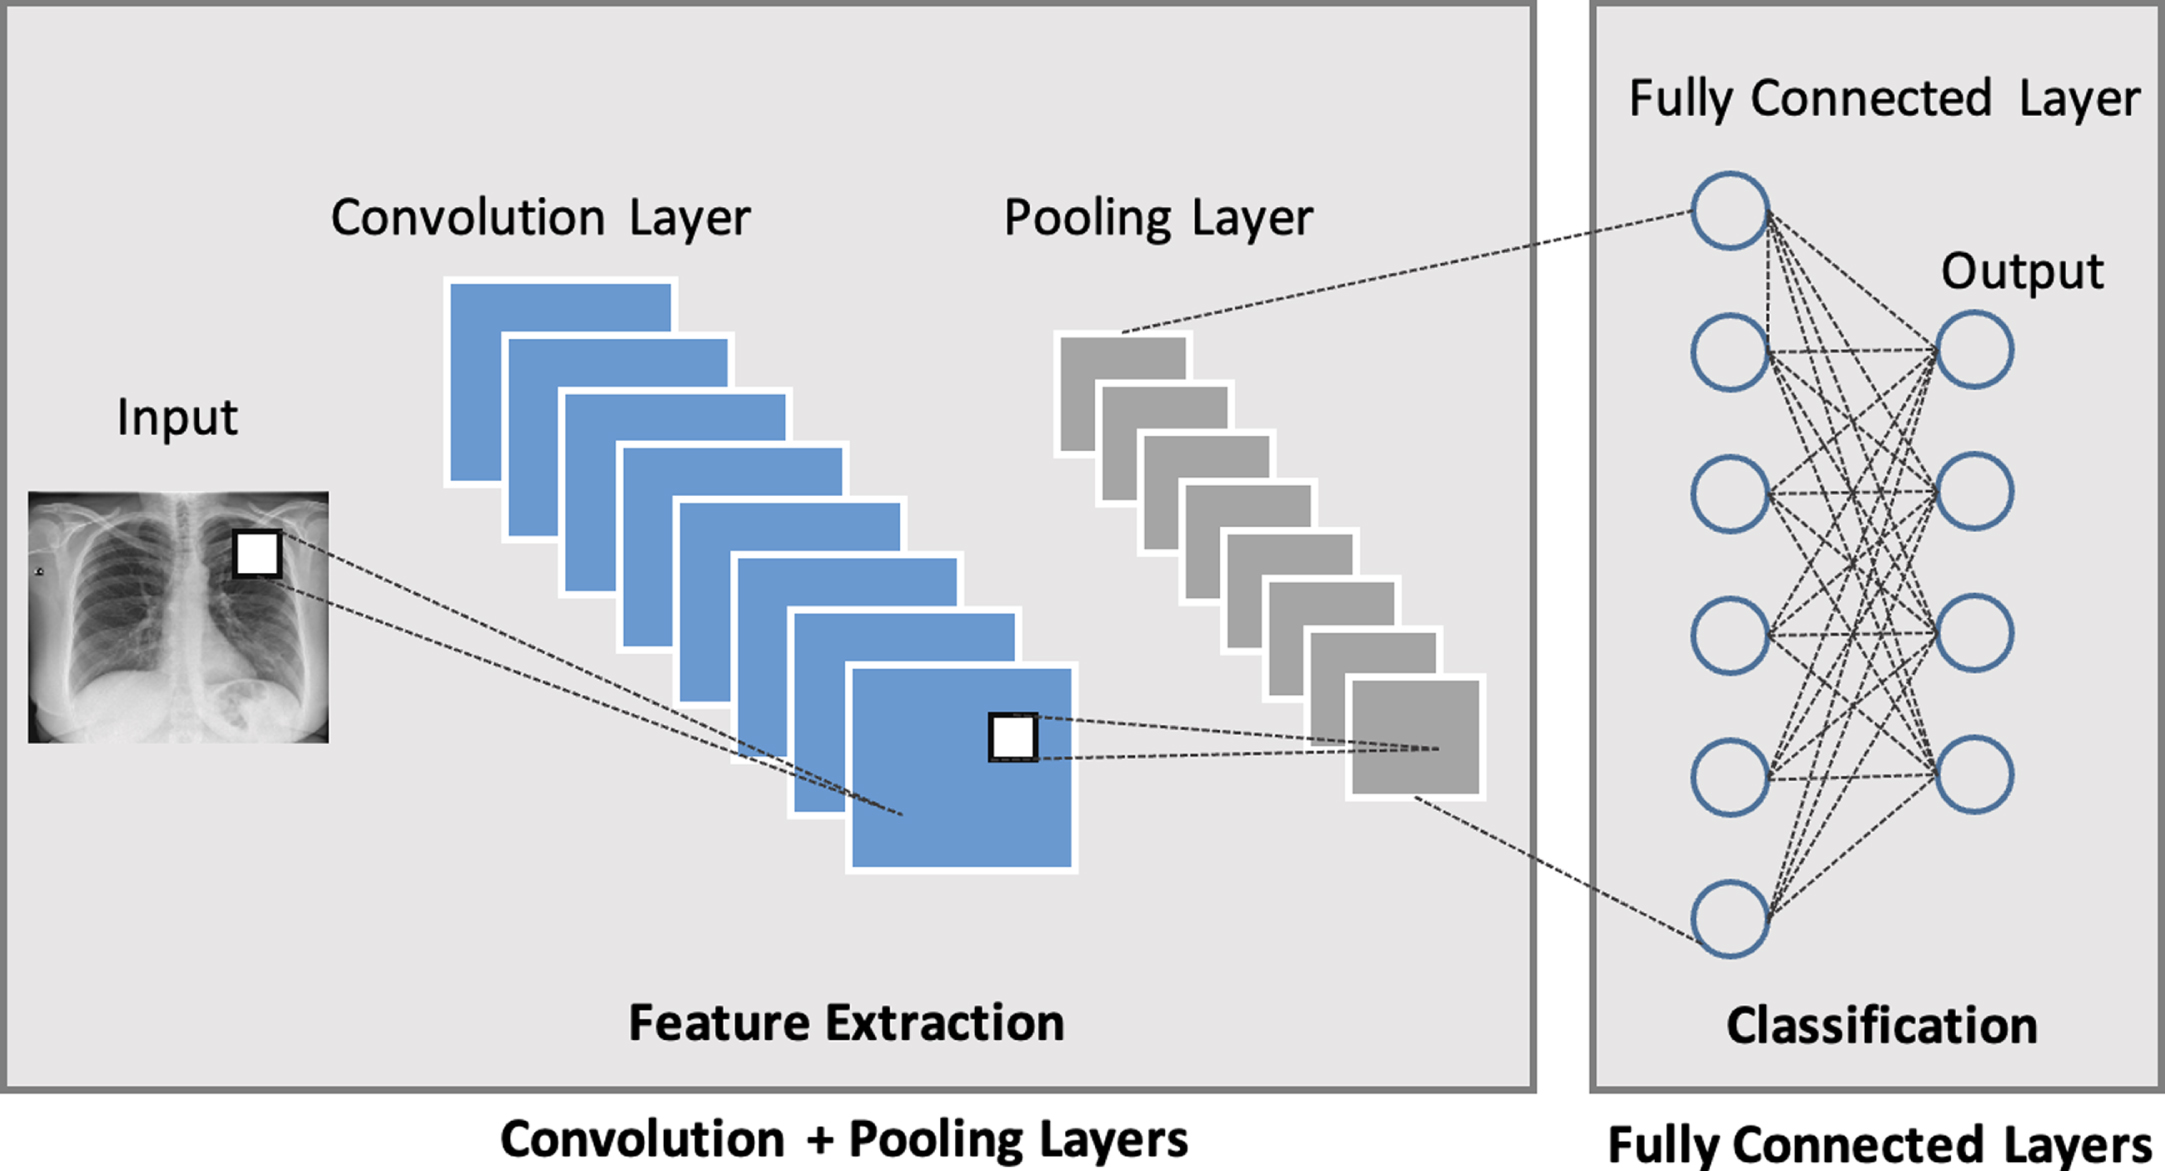
Accurate identification at preliminary stage using medical images, provide an early stage detection of several medical diseases [15]. Similarly, COVID-19 detection at an early stage plays a key role in controlling the widespread of this disease which is highly contagious in nature. The focus of this research is to diagnose COVID-19 at an early stage by using CXRs. In the proposed CAD system, two deep learners i.e., Convolution Neural Network (CNN) and Long Short Term Memory Network (LSTM) are trained and their performance is evaluated. CNN is a type of deep network that is designed in several subsequent layers, including the most essential ones i.e., pooling layer, convolution layer, and fully connected layer. Each layer contains neurons in multi-dimensions. At each convolution layer, the input to that layer is convoluted with different filters, thus producing different feature maps by each filter. The number of feature maps is one of the hyper-parameters which is tuned at each convolution layer. Between convolution layers, a pooling layer is added to reduce the number of computations by down-sampling. Fully connected layers are responsible for getting connected with all the activation of the preceding layer and reshaping them in a single vector. Some other layers of CNN include Rectified Linear Unit (ReLU) layer, SoftMax layer, and input/output layer as described in Fig. 2. CNN is considered as a black box with a very powerful feature extraction mechanism which causes it to perform tremendously for image classification and other problems.
Fig. 2
Building blocks of CNN Architecture consisting of Convolution Layer, Pooling Layer and Fully Connected Layer
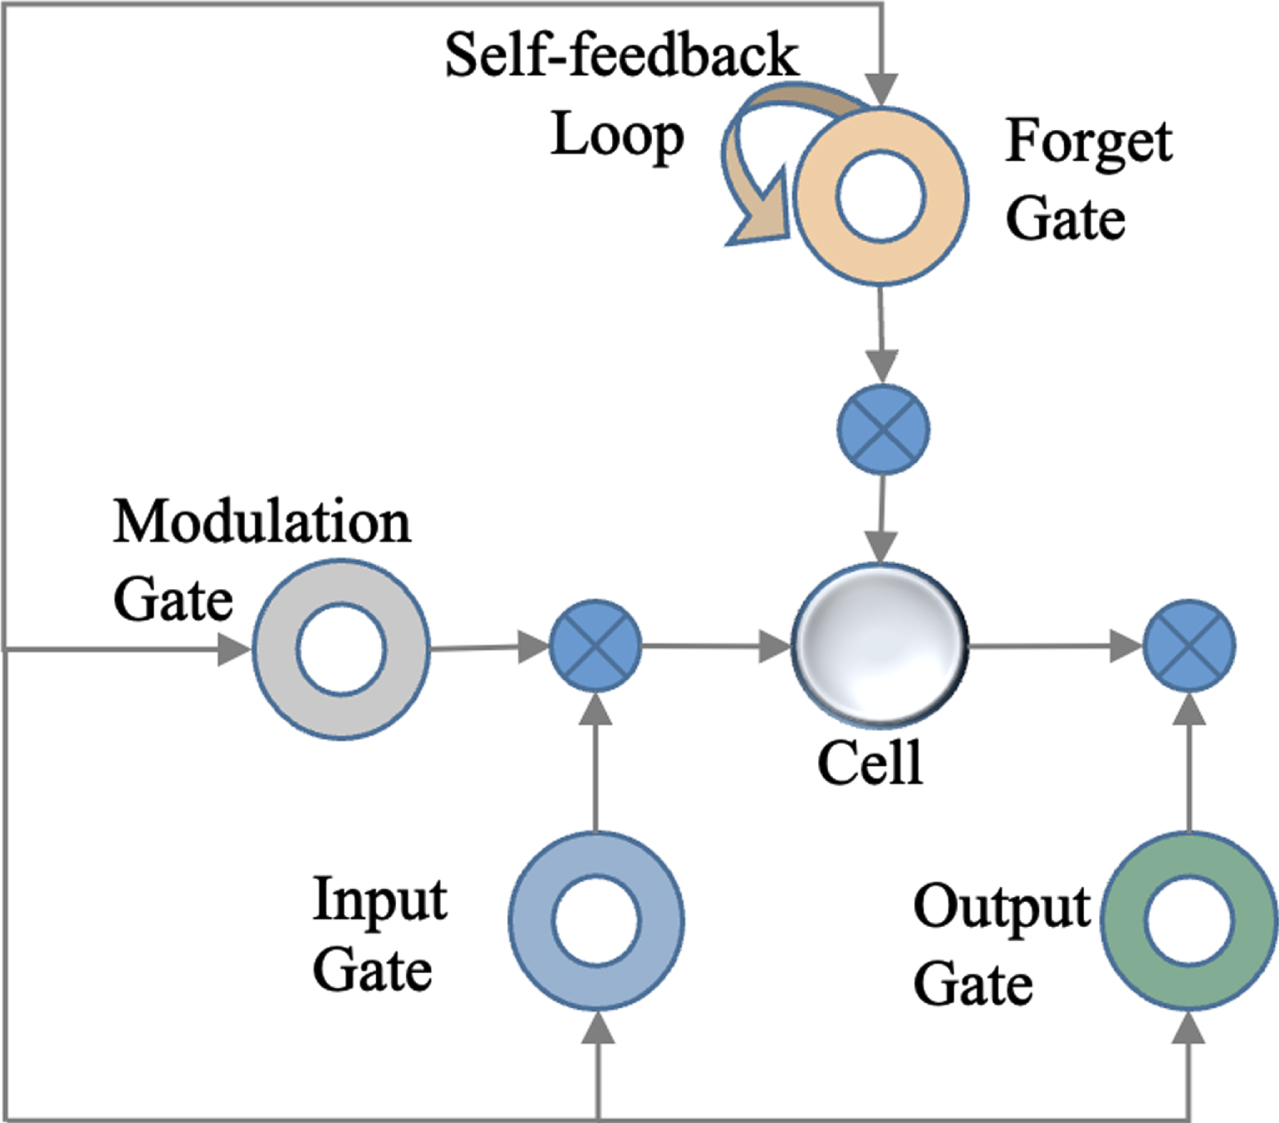
LSTM is another deep network that shows considerably better results due to its memory cells, equation updating mechanism, and back-propagation refinements [16, 17]. The architecture of LSTM makes it one of the most promising deep networks. Unlike others, it holds memory cells, comprising of forgetting gate, input gate, output gates, and self-feedback loops as illustrated in Fig. 3. Forget gate picks only relevant and important information for the next iterations, thus discarding irrelevant and less significant information.
Fig. 3
Intrinsic Components of LSTM Memory Cell
In this research two deep networks, CNN and LSTM, are used for the computer-aided diagnosis of COVID-19. At first, CNN is trained on raw CXR images, and the performance of the model is evaluated. For improving the efficiency of this model, another model, based on the same CNN architecture, is trained on pre-processed images. To train the deep networks, adversarial-based adaptation is used and synthetic data is generated by using augmentation. In this way, different augmentation techniques are applied to images and more training data is generated. After generating augmented data, another CNN model is trained on pre-processed augmented CXR images. Finally, a combination of CNN-LSTM is designed for COVID-19 diagnosis. In this joint model, CNN convolution layers are used to extract features from raw and pre-processed augmented images, and LSTM is used for classifying. The paper is arranged in such a way that analysis and review of the contemporary scholarly work, related to this research, is described in section “Related Work”. A description of the proposed CAD system, including pre-processing, data augmentation, and model architecture, is presented in section “Methodology”. The experimental results of the proposed deep learning-based CAD are in section “Results and Discussion”. Finally, section “Conclusion” ends this research work with directions for future research.
2Related work
Computer-aided diagnosis has become a major research subject in many healthcare related applications. CAD automatically makes efficient decisions and facilitates medical experts to make fast decisions [18–22]. In the latest research works [23, 24], CXR and CT images have been used for training Deep Learning (DL) models to diagnose COVID-19. Such approaches play a key role in identifying COVID-19 and segmenting its infections successfully. However, in these approaches, CXR and CT images are employed as primary instruments to diagnose COVID-19 patients. A set of 8,474 CXRs is divided into three subsets and these subsets are used to train deep learning model CNN [25]. VGG16 is used as a base model which yields 94.5%to 98.1%accuracy for detecting COVID-19 in three subsets of CXRs. An innovative CAD system for COVID-19 diagnosis is proposed in [26], which is based on multiple CNN models. Features are extracted from different CNN models and fed to Support Vector Machine (SVM) for classifying into COVID-19 positive or negative. Principal Component Analysis (PCA) is also applied to the feature maps, extracted by CNN models, and fed to the SVM classifier. The technique fuses certain principal components from feature maps and compares them with the feature maps mined by different CNN models. The reported accuracy of the proposed technique is 94.7%on average. To enhance the accuracy of deep learning classifiers for pneumonia and COVID-19 diagnostic from CXR images, a DL-based framework is proposed [27]. Two key developments are proposed in which a multi-label classifier is simplified as a binary classifier, and already trained DL models are used simultaneously. CXRs are used to train Residual Neural Network (ResNet), Dense Neural Network (DenseNet169), and Visual Geometry Group Network (VGG). A simultaneous DL-based CAD system is proposed with a YOLO predictor to predict COVID-19 by using CXRs [28]. The model is trained on 50,490 annotated images. Five-fold cross-validation is performed to evaluate the performance of the classifier. The overall classification accuracy of the proposed model is 97.40%while COVID-19 detection accuracy is 96.31%. An automatic COVID-19 diagnostic system is proposed which is based on the fusion of spatio-temporal evidence [29]. Lesion and lung area is segmented by using the DL model and spatiotemporal pieces of evidence are collected from several CT scans. These features are used for auxiliary analysis and diagnosis. The average accuracy attained by the proposed system is 96.7%.
A CAD system for COVID-19 diagnostic is proposed which extracts feature maps from CXR images [37]. Classification is performed in three phases by using multiple shallow classifiers. For evaluation, 10-fold cross-validation is performed which is validated by a skilled radiologist. The proposed system outperforms all the existing systems. An Artificial Neural Network (ANN) is trained on 700 Regions of Interest (ROIs) to diagnose COVID-19 [38]. The architecture of ANN comprises 60 neurons at the hidden layer. For the evaluation of the proposed COVID-19 diagnostic system, Receiver Operator Characteristic (ROC) and Z scores are used.
The pragmatism of pre-trained multiple CNNs for the diagnosis of COVID-19 is explored [39]. The research uses CXR images from which correlation-based features are extracted and combined with the feature maps extracted by multiple CNNs. Bayesnet is used for the diagnosis of COVID-19. The proposed technique is applied to two datasets. The first dataset consists of 453 positive and 497 negative images. And the accuracy achieved on this dataset is reported as 91.16%. The second dataset contains 71 positive and 7 negative images and the accuracy reported for this dataset is 97.44%. To differentiate COVID-19 positive CT scans from COVID-19 negative CT scans, a general-purpose technique is proposed [40]. An adaptable registration system is used to prepare training data from CT scan images while Generative Adversarial Networks (GANs) synthesizes positive images from negative images.
A novel system was proposed which uses the transfer-to-transfer learning method [41]. In this methodology an imbalanced dataset is transformed into clusters of balanced sub-set, and CNN is used for classifying positive and negative COVID-19 images. The evaluation of its performance was done by 10-fold cross-validation, and it showed that the system achieves an overall 94%accuracy.
Afterwards a new approach was proposed in which LSTM is used to identify COVID-19 from CXR images [35]. In pre-processing, marker-controlled watershed and Sobel gradient are used for segmentation. The system reveals promising results. In a unique approach [36], certain features i.e., distribution pattern, nodule, number of the lesion, Location, crazy-paving, reticular, consolidation, ground-glass opacity (GGO), bronchial wall thickness, cavity, air bronchogram, pleural thickening, pleural effusion, and lymphadenopathy are used to tell apart COVID-19 positive from negative classes. The proposed system obtains 91.94%accuracy.
In 2020 and 2021, Sethy et al. [32–34] published different papers in the related field, however, they performed analyses of different computer aid screening method of COVID19 using Xray and CT scan images, they used several machine learning methods for comparisons.
Table 1
An overview of the accuracy of some existing techniques for COVID-19 diagnostic
| References | Algorithm | Images | Accuracy | |
| ResNet | [42] | ResNet | 558 | 95.20% |
| [7] | ResNet | 3464 | 89.50% | |
| [43] | ResNet | 618 | 86% | |
| U-Net | [44] | Two U-Nets | 1044 | 86% |
| [45] | U-Net++ | 13751 | 95.20% | |
| [30] | U-Net +CNN | 542 | 90.90% | |
| CNN | [25] | VGG16-CNN | 8474 | 94.50% |
| [39] | Multi-CNNs | 950 | 91.16% | |
| [31] | R-CNN | 13800 | 97.65% |
In the recent research works, different approaches have been proposed for the CAD system of COVID-19, and their accuracies are reported above 85%, as can be seen in Table 1. Although SVM, PCA [26] and some shallow classifiers [37] are also used for the diagnosis of COVID-19, the state-of-art indicates that deep learners [25, 30, 31, 35, 39, 44, 45] and other neural networks [38] are the most popular approaches for such a diagnostic. Still, the existing systems, based on ResNet [7, 42, 43], U-Net [30, 44, 45] and variations of CNN [25, 31, 39] are generally trained on huge datasets to produce good results. On using a small set of training data, the performance of these deep networks decreases significantly, as can be seen in Table 3. Even the popular deep network ResNet [42], produces around 95%accuracy. The motivation of this research is to propose such a CAD system for COVID-19 which can give good results even on a small set of data. The COVID-19 diagnosis system, proposed in this research, employs different augmentation techniques and provides better results with a small set of training data consisting of only 402 original CXR images.
3Methodology
In this research, CNN and a combined CNN-LSTM are proposed for computer-aided diagnosis of COVID-19. At first, raw images of CXRs are pre-processed, and then more images are generated by using different data augmentation techniques. After that, the pre-processed CXRs image dataset is divided into training and testing datasets.
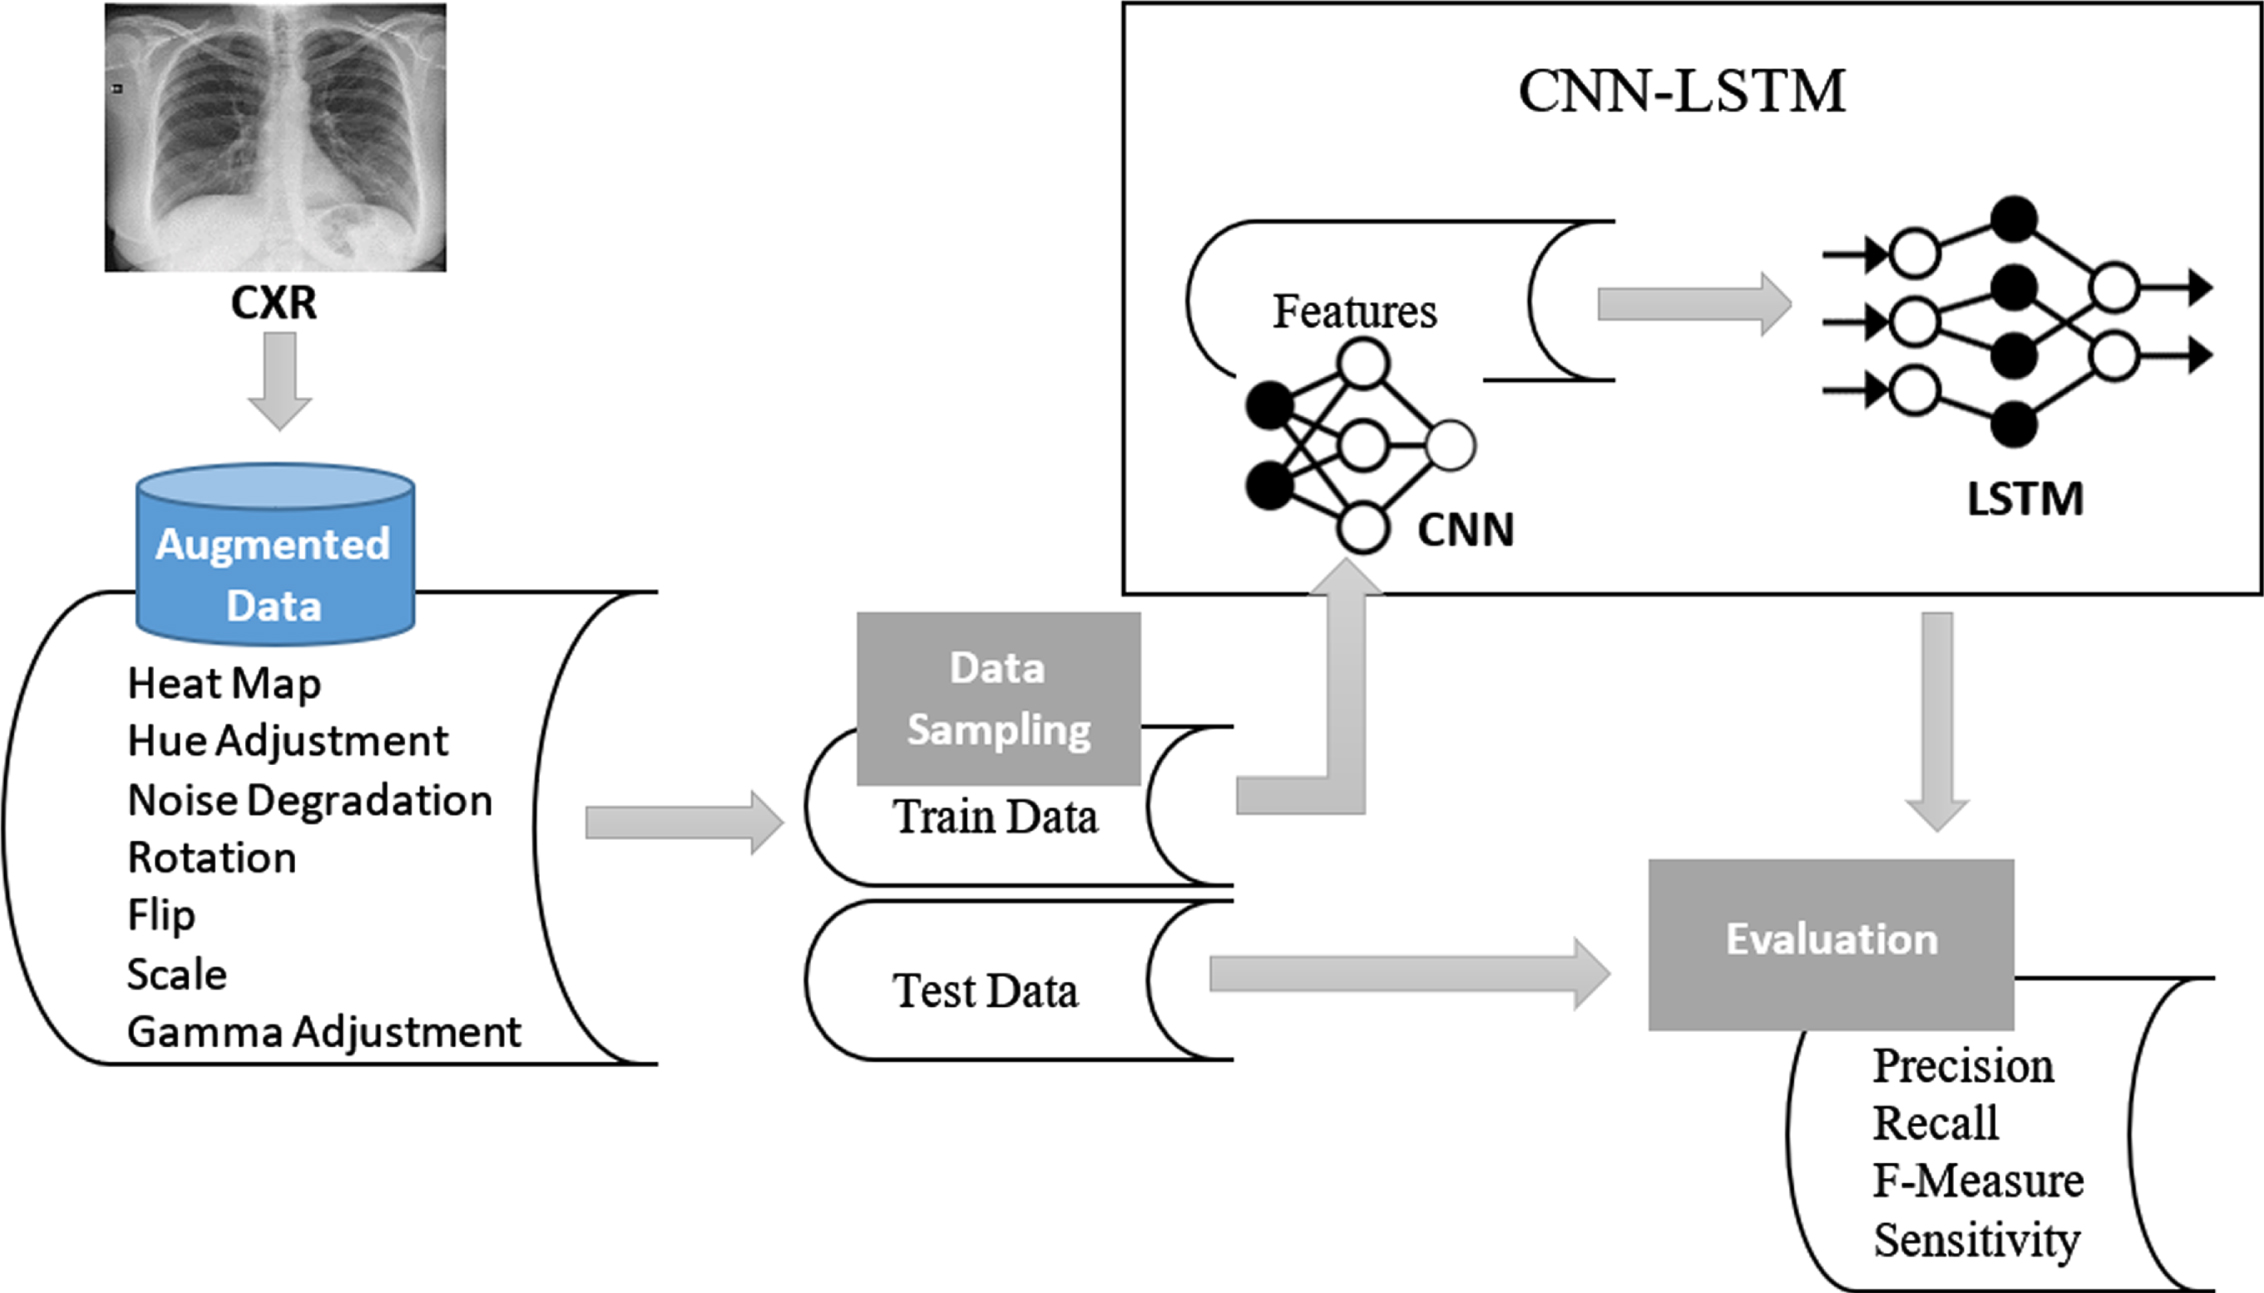
The research is carried out in different phases. In the first phase, the architecture of the CNN model is designed and developed. The CNN model is used to extract features from raw images and classify them. To increase the accuracy of the model, pre-processed images of CXR are used to train CNN. In the next phase, augmented images are generated to extract feature maps, and based on these feature maps, CNN is used to classify the input in normal or COVID-19 infected categories. In the last phase of the research, two deep networks, i.e., CNN and LSTM, are combined. By doing so, the power of effective features extraction of CNN is boosted up by LSTM which is employed as a classifier. The deep learner CNN is used for extracting only feature maps, which are provided to LSTM for classification. An overview of CNN-LSTM architecture is illustrated in Fig. 4. The performance of both CNN and CNN-LSTM based proposed systems is evaluated by using different evaluation statistics.
Fig. 4
The proposed system architecture of CNN-LSTM model for COVID-19 diagnosis

3.1Dataset
For computer-aided diagnosis of COVID-19, Covid X-Ray Dataset [46] is used which consists of 402 CXR images. Out of these images, 50 %images are COVID-19 infected while the remaining 50%CXR images are normal. It is an open research, publicly available dataset to the global research community for the application of recent advancements in computer-aided diagnosis of COVID-19. The CXRs in this dataset indicate radiographic characteristics in COVID-19 patients. The temporal radiographic changes in COVID-19 positive CXRs are helpful for deep learners to diagnose COVID-19. All the images are pre-processed followed by data augmentation.
3.1.1Training / testing datasets
To train and test Deep Networks, the CXR image dataset is divided into training and testing sets. The validation set is generated from the training set at run time but training data remains the same for the whole testing phase. As the validation set is also extracted from the training dataset hence, 70%of CXRs are used for training, 10%are used for validation, whereas the remaining 20%CXRs are used for testing and model evaluation. All the three subsets of CXRs are pre-processed, while only training and validation sets (which are 80%of the data) go through the augmentation process as well.
3.2Pre-processing
For achieving a good diagnosis accuracy, all CXRs are pre-processed before feeding to deep learners. At first, all the images are rescaled to 128 x 128. Then, they are standardized by using equations (1), (2) and (3). The standardization process sets 1 as standard deviation σ, and 0 as mean μ for all the images. By turning to mean into zero, CXRs become comparable while variance with value 1 lets CXRs comparable to standard normal distribution.
(1)
(2)
(3)
3.3Data augmentation
For small datasets, offline augmentation is a popular technique to train deep learners effectively. Scaling, translation, flipping, rotation, noise addition, and/or a combination of these transformations are very prevalent augmentation practices.
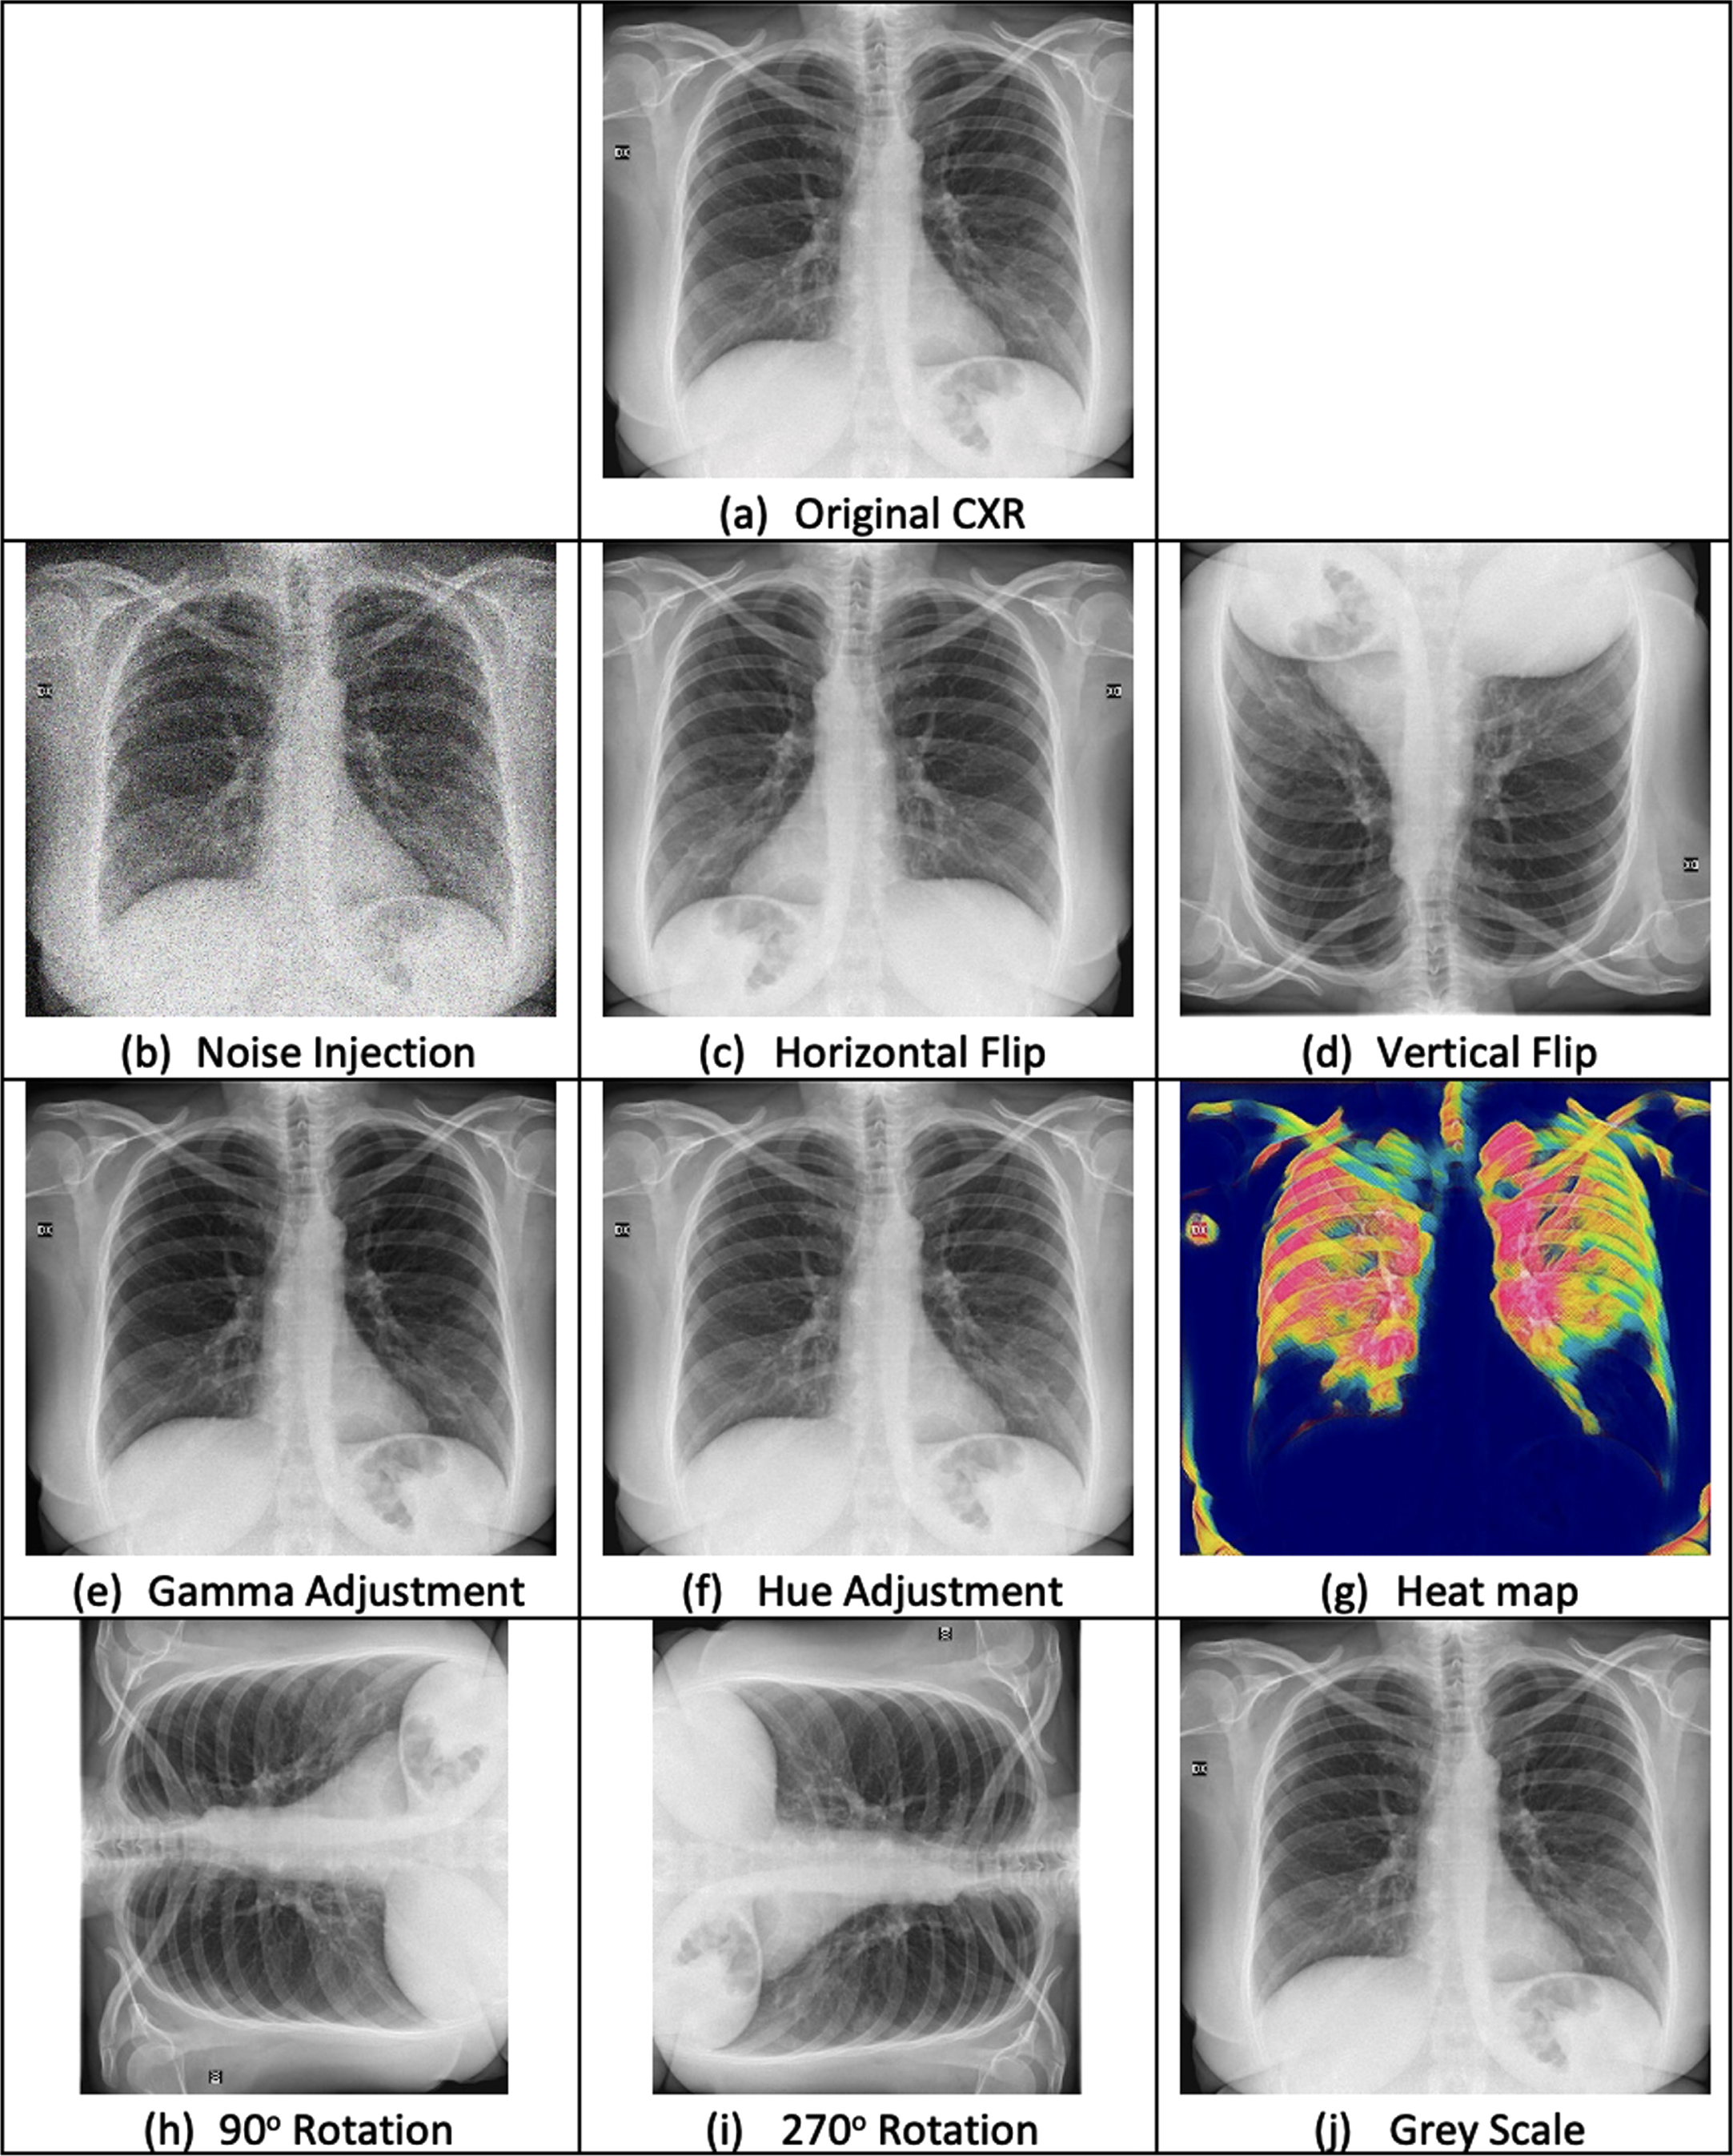
The dataset, used in this research, contains only 402 original images of CXRs which are not ample enough for producing good classification accuracy. Even powerful deep networks like CNN and LSTM require sufficient datasets for training [7, 31, 45]. Hence, CXRs go through many data augmentation steps including geometric transformations, color transformations, image enhancement, noise injection, etc. In this way, 3,220 augmented images are generated as a training set. The resultant images after applying data augmentation are illustrated in Fig. 5.
3.3.1Geometric transformation
CXRs may contain positional biases for which geometric transformations are considered a great solution [12]. Not only do they resolve such biases, but they are also easy to implement. In this research, four geometrical transformations, horizontal flip, vertical flip, and two rotations are applied. To make deep networks perform dynamically, image reflections (flip) in both horizontal and vertical dimensions, are generated by using equations (4) and (5):
(4)
(5)
After getting flipped images, two rotations of angles 90 degree and 270 degree are applied to the original images. For rotations, equations (6) and (7) are used.
(6)
(7)
3.3.2Colour transformation
Two types of color transformations are applied to original CXRs to generate more images. The first color transformation is converting CXRs into a single channel (greyscale) image. The second one is a heat map which expresses the magnitude of a phenomenon in colors, thus increasing the details in an image. The effects of greyscale and heat map are given in Figures 5 (j) and (g) respectively. As in this research only gray-scaled images are used, so the three channels of heat maps are converted into a single channel by averaging.
3.3.3Image enhancement
The quality of CXR images is enhanced by adjusting gamma and hue.
Gamma Adjustment: The nonlinear operation gamma is applied to CXR images to decode luminance by using the power-law expression given in equation (8):
(8)
Hue Adjustment: After luminant adjustment, the contrast and brightness of CXR images are adjusted by setting the hue displacement value as 180,, described in equation (9). Thus, producing more image variations by hue adjustment. The effects of gamma and hue adjustments are given in Fig. 5 (e) and (f) respectively.
(9)
3.3.4Noise injection
Small training dataset can make a deep network memorize the training examples, which leads to over-fitting. It also ends up with a harder mapping problem thus, making the learning process challenging. By adding noise in training data, the training process becomes robust as it gets more data for training and learns in a generalized way. Noise adds a kind of imperfection which can alter a deep network’s ability to predict accurately. Noise injection, as a part of data augmentation, intensifies the robustness of DLs. Thus, adding noise in training data makes the learning process of DLs robust and increases fault tolerance by reducing error and generalization. So, instead of removing noise in the CXRs training dataset, standard Gaussian noise, described in equation (9), is added with zero mean and variance set as 1. The effect of Gaussian noise is illustrated in Fig. 5 (b).
(10)
Fig. 5
Effects of pre-processing and data augmentation on Chest X-Ray Images
After data augmentation, in total 3220 images are generated as training and validation datasets. Finally, for training the deep learners, all the CXRs with COVID-19 negative are labeled as class 0, and the CXRs with COVID-19 positive are labeled as class 1.
Fig. 6
Proposed CNN model with a sequence of layers on top of each other
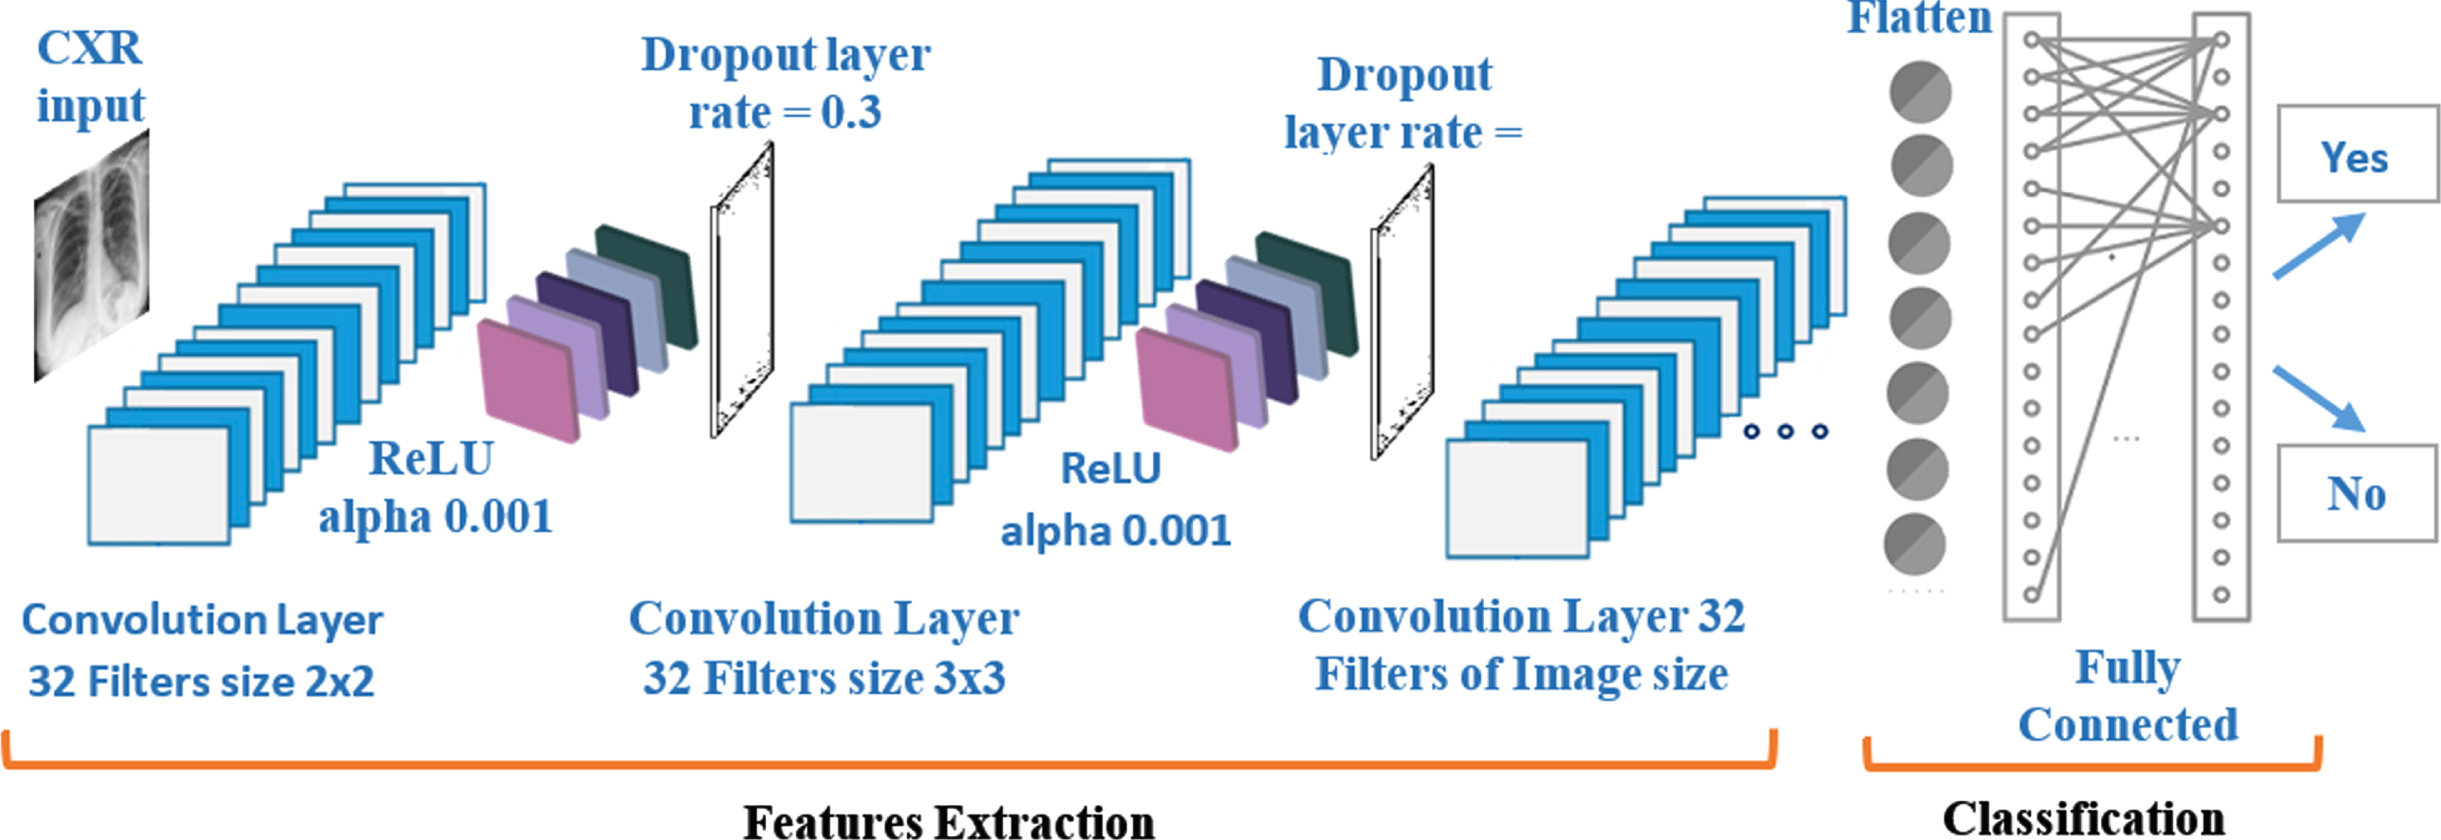
Fig. 7
Data model of the proposed CNN-LSTM
3.4Experimental setup
In this research, 2D CNN is used to learn the patterns across the CXRs to assist the diagnosis of COVID-19. At first, only CNN is used for both feature extraction and classification and then CNN is used for extracting feature maps and LSTM classifies as COVID-19 positive or negative. The data model of CNN-LSTM is illustrated in Fig. 7.
3.4.1CNN architecture
CNN model is built layer by layer in a sequential way. The size of the first layer, which is the input layer, is as per the CXR image size. Then comes the 2D convolution layer with 2 x 2 kernels. In this layer, there are 32 filters in total. After the convolution layer, the next layer is Rectified Linear Unit (ReLU) layer. The alpha value of the ReLU layer is set as 0.001. ReLU layer is followed by the dropout layer which contains a 0.3 dropout rate. The same sequence of layers is reconstructed to create another layer of a 2D convolution layer followed by ReLU and dropout layers. Except for the kernel function, which is now of size 3x3, the rest of the parameters remain the same. After that, the third layer of 2D convolution is built which contains as many filters as the number of pixels in CXR images. Next to it comes a pooling layer which downsamples to summarize the feature map. For avoiding overfitting, dropout layer is used as a regularization technique. Dropout layer avoids over-fitting by modifying the network and setting activations to zero. During training, neurons are randomly dropped from the network in each iteration. Dropping different neurons makes it equivalent to different neural networks which will over-fit in different ways, thus reducing the over-fitting effect as a whole.These CNN layers are responsible for extracting feature maps from CXR images. After these layers, another layer is defined for flattening the output of the network. Finally, fully connected dense layers, containing ReLU and sigmoid as activation functions, are built. The architecture of CNN is illustrated in Fig. 6. Convolution operations are executed by using equation (9) and ReLU layers are applied with equation 10.
(11)
(12)
The architecture of CNN model, designed in this study, is inspired by LeNet and VGG CNNs. The hyper-parameters, filter size and number of filters, are tuned considering the major trends adapted by the classical DL architectures LeNet, VGG-16 and VGG-19. AlexNet provides large filter sizes i.e., 5x5 and 11x11, which result in more computational time, hence the small filter size is preferred to reduce computational cost and lesser weight sharing as adapted by LeNet, VGG-16 and VGG-19. The idea is to replace large filter sizes with 2x2 and 3x3 filters. As a small filter corresponds to a trade-off between quality and computational complexity, it is overcome by increasing the number of filters which is taken as the power of 2 for efficiency.
3.4.2CNN-LSTM
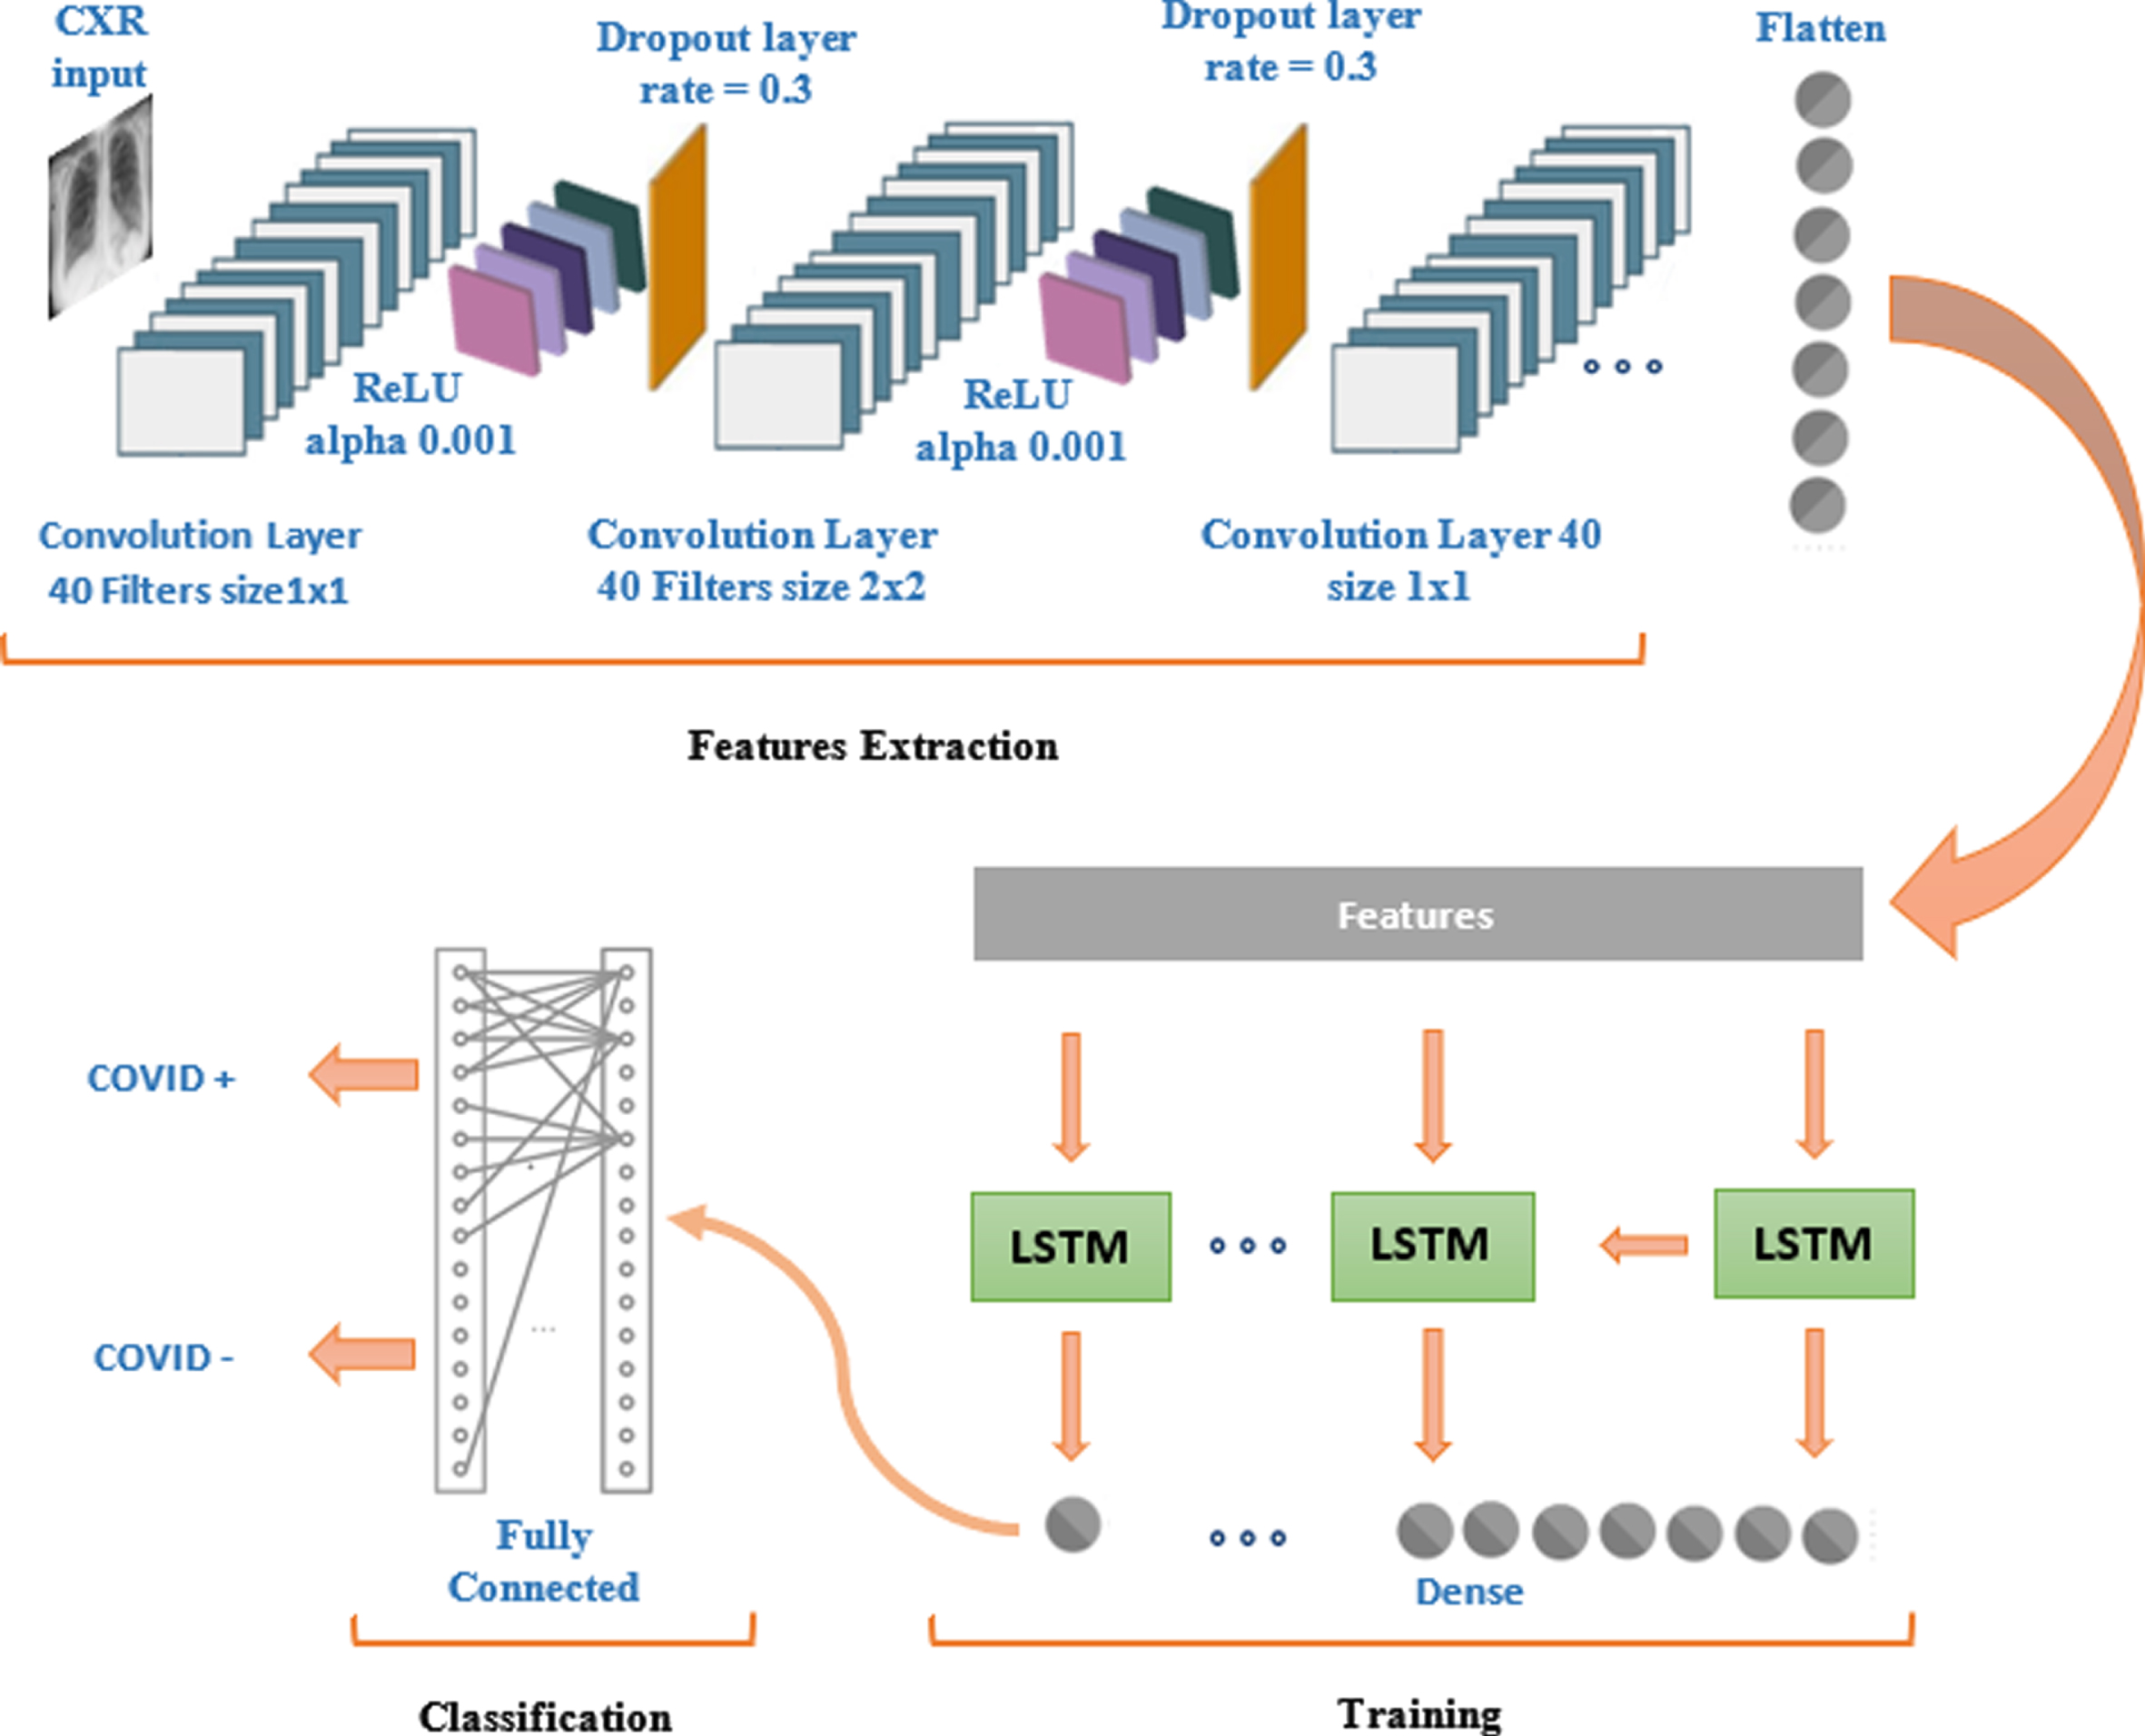
In CNN-LSTM architecture, a single CNN model is defined followed by many LSTM models, constituting one LSTM for each time-step. CNN model extracts feature maps from each input CXR image, and the output of each image is passed to the LSTM as a single time step. As illustrated in Fig. 7, CXR images are pre-processed, and then augmented data is created. This data is divided into training and testing sets. Training data is fed to CNN which extracts feature maps and sends them to LSMT for learning. LSTM learns from the feature maps, extracted by CNN, and classifies the test data. The perfection of the classification model is assessed by using different statistical techniques.
CNN-LSTM Architecture. The sequential structure of CNN-LSTM architecture is constructed by joining both the networks. Fig. 8 explains the hybrid design of deep networks for COVID-19 detection. The model is constructed sequentially with 2D convolution layers followed by LSTM. The input layer takes the input of size 128 x 128. The first 2D convolution layer is designed with 40 filters and with kernel size 1x1. ReLU is used as an activation function followed by a dropout layer. The next 2D convolution layer again contains 40 filters but this time with kernel size 2x2. The third and fourth 2D layers contain the same architecture that is used in the first and second 2D convolution layers. Between convolution layers, dropout layers are also added. The designed model uses binary cross-entropy as a loss function and for optimization, the learning rate is set as 0.001while decay rate is set as 0.95. In total, there are 142,742 parameters out of which 142,734 parameters are trainable and 8 parameters are non-trainable. The output of CNN is 28x28 which is flattened as a 1D array and then fed to LSTM. LSTM, being a recurrent neural network, also contains the capability of remembering the important and relative information while forgetting the less important and irrelevant information. For such functionality of LSTM, gating mechanism including forget gate, input gate, an output gate, is applied by using equations (12)–(16):
(13)
(14)
(15)
(16)
(17)
The LSTM layer is followed by a dense layer which is further connected to the fully connected layers for predicting diagnosis of COVID-19.
Fig. 8
Feature extraction, learning and vlassification: A detailed illustration of CNN-LSTM based COVID-19 diagnosis system
3.5Training
After pre-processing, data augmentation, and architecture designing of the models, the deep networks are trained on different kinds of input. For model evaluation, during training, binary-Cross-Entropy is used. At first, the CNN model is trained on only raw images and its performance is evaluated. In the second phase, the same architecture is used but pre-processing is applied on input images. In the third phase, pre-processed and augmented images (Fig. 5) are fed to CNN for training and classification. For the training CNN model, the sigmoid activation function, given in equation (17), is used:
(18)
(19)
In the fourth phase of the research, the CNN-LSTM model is trained on pre-processed and augmented set of CXR images. Model accuracy and model loss of these four models during training are given from Fig. 9 to 12.
Fig. 9
CNN model: Graphs of training accuracy and loss for raw images
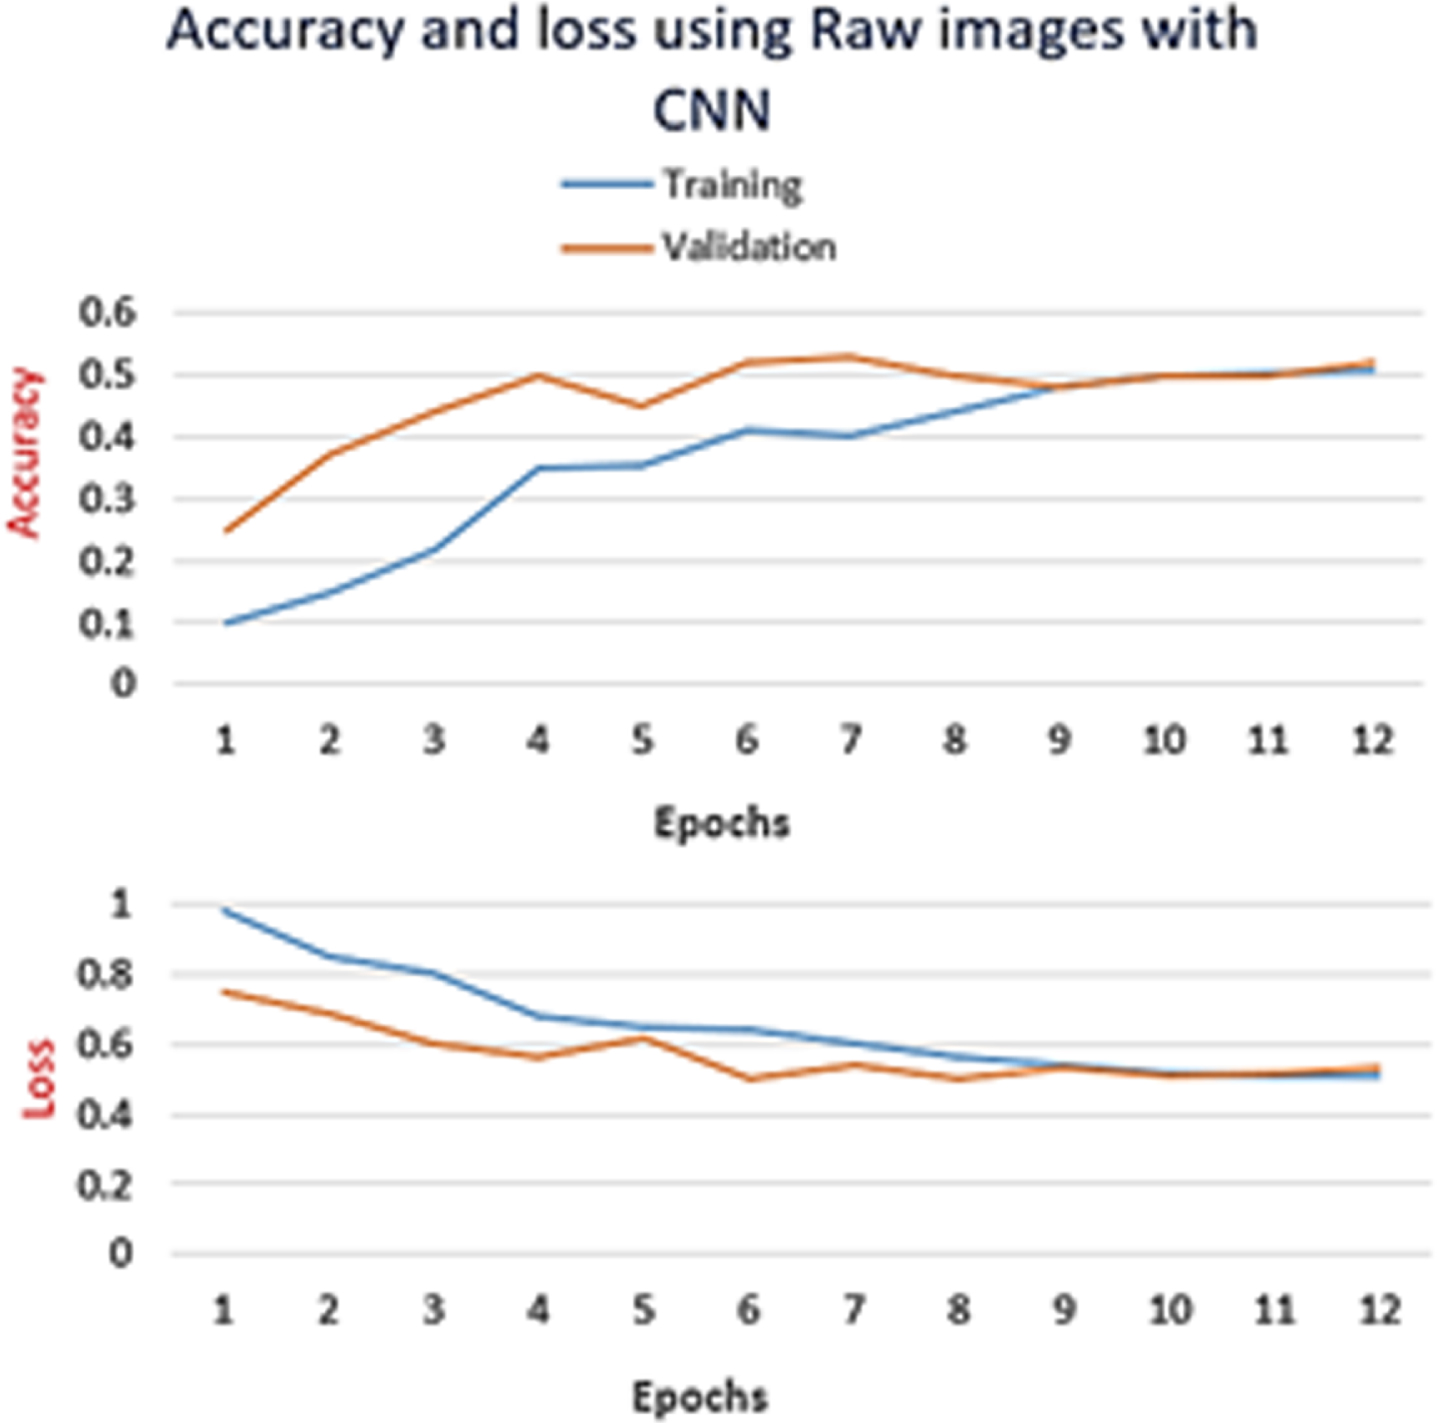
Fig. 10
CNN model: Graphs of training accuracy and loss for Normalized images
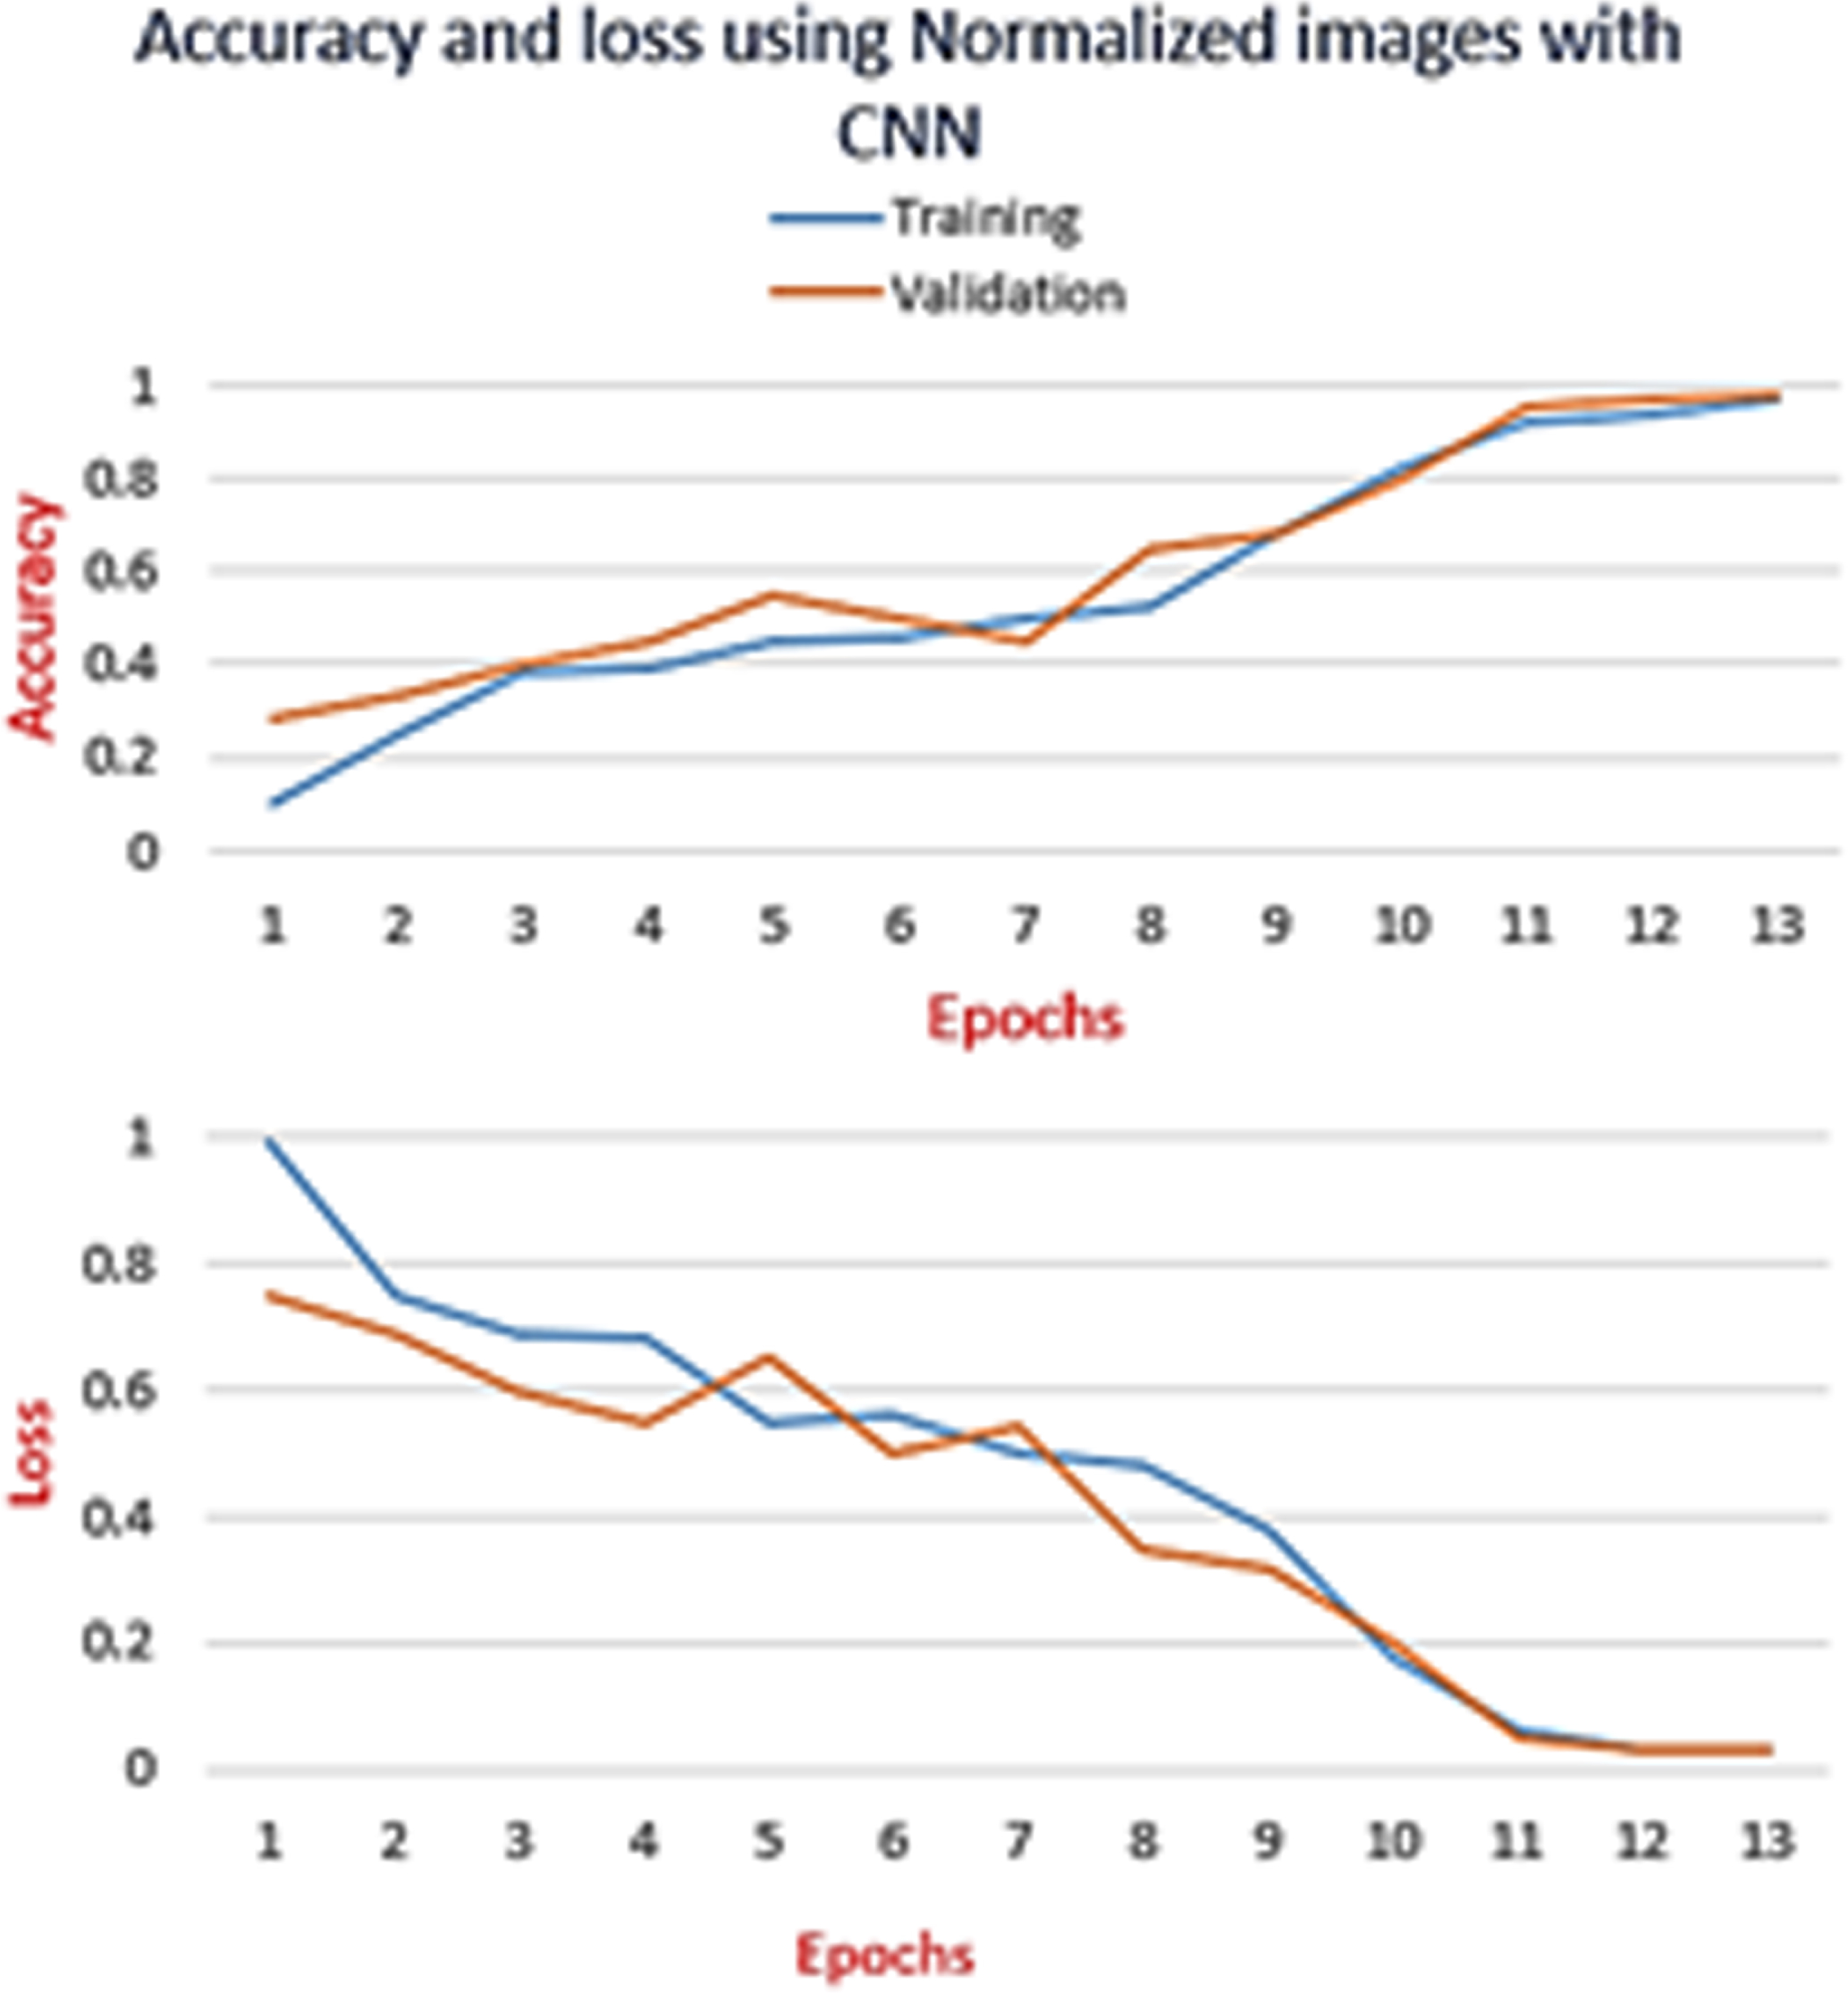
Fig. 11
CNN model: Graphs of training accuracy and loss for pre-processed and augmented images
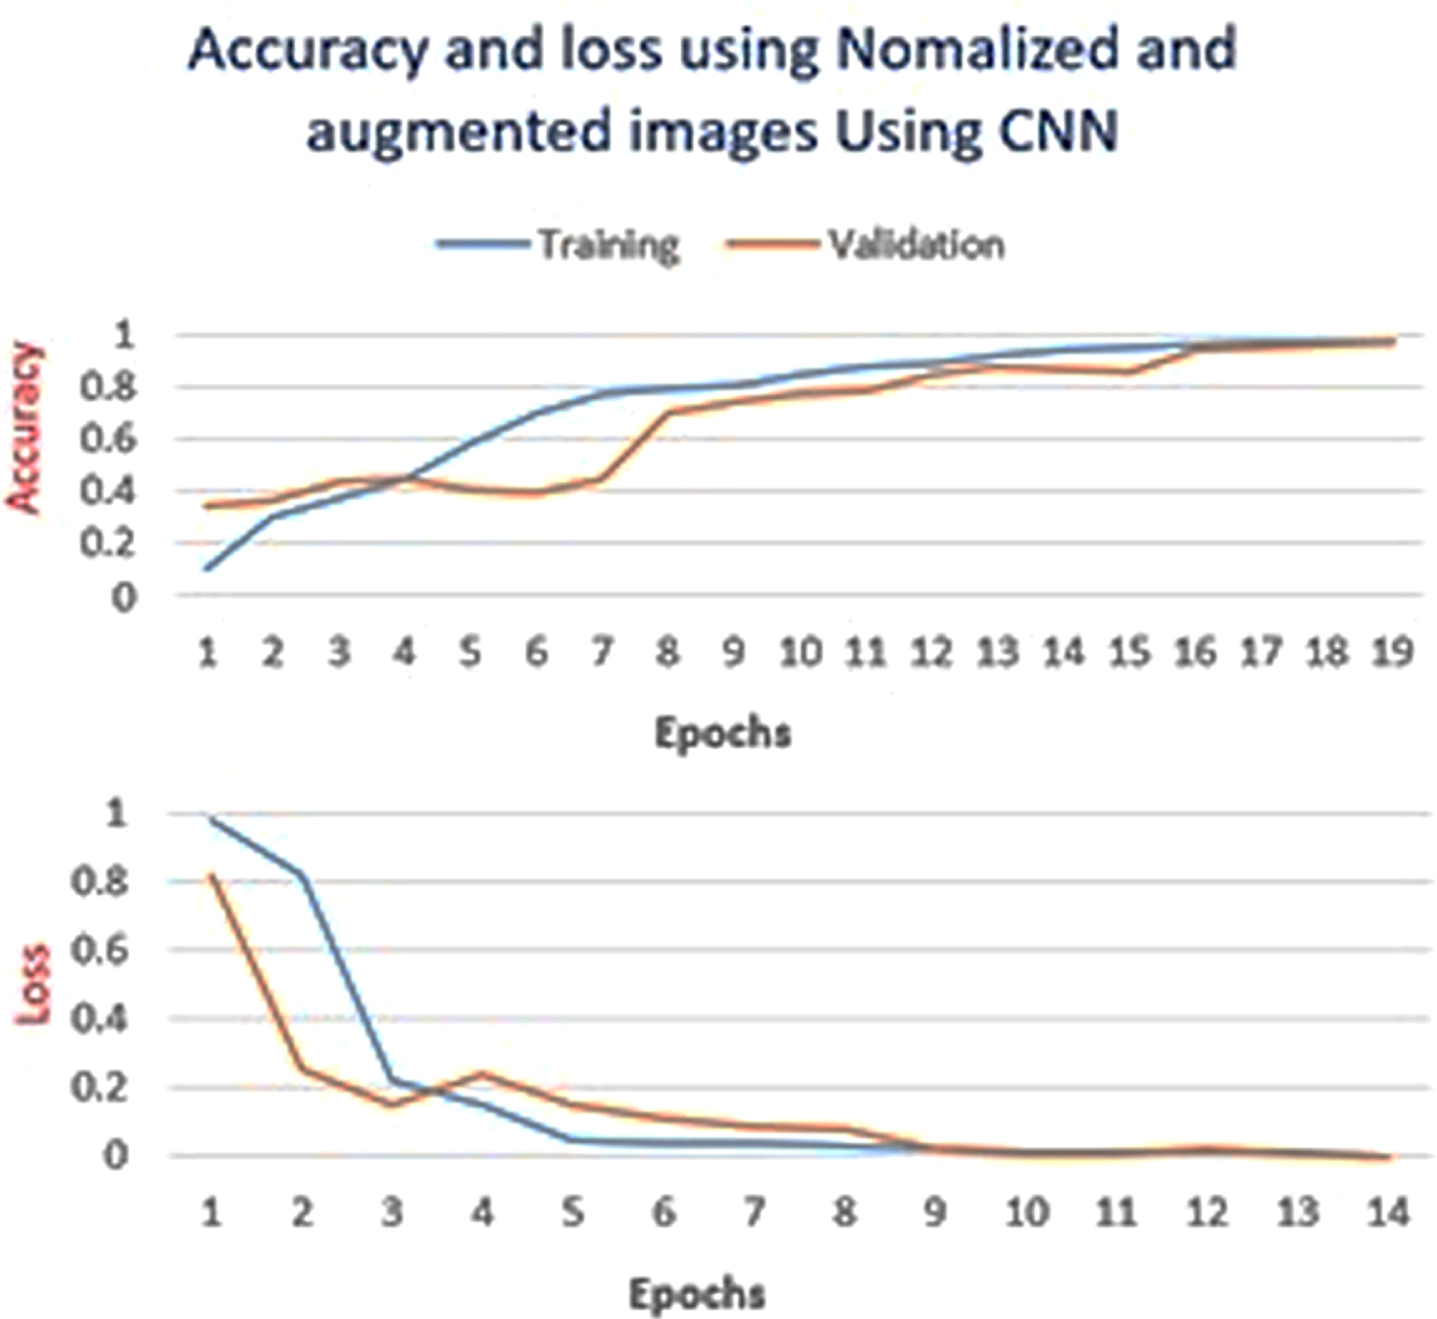
Fig. 12
CNN-LSTM Model: Graphs of training accuracy and loss for pre-processed augmented images
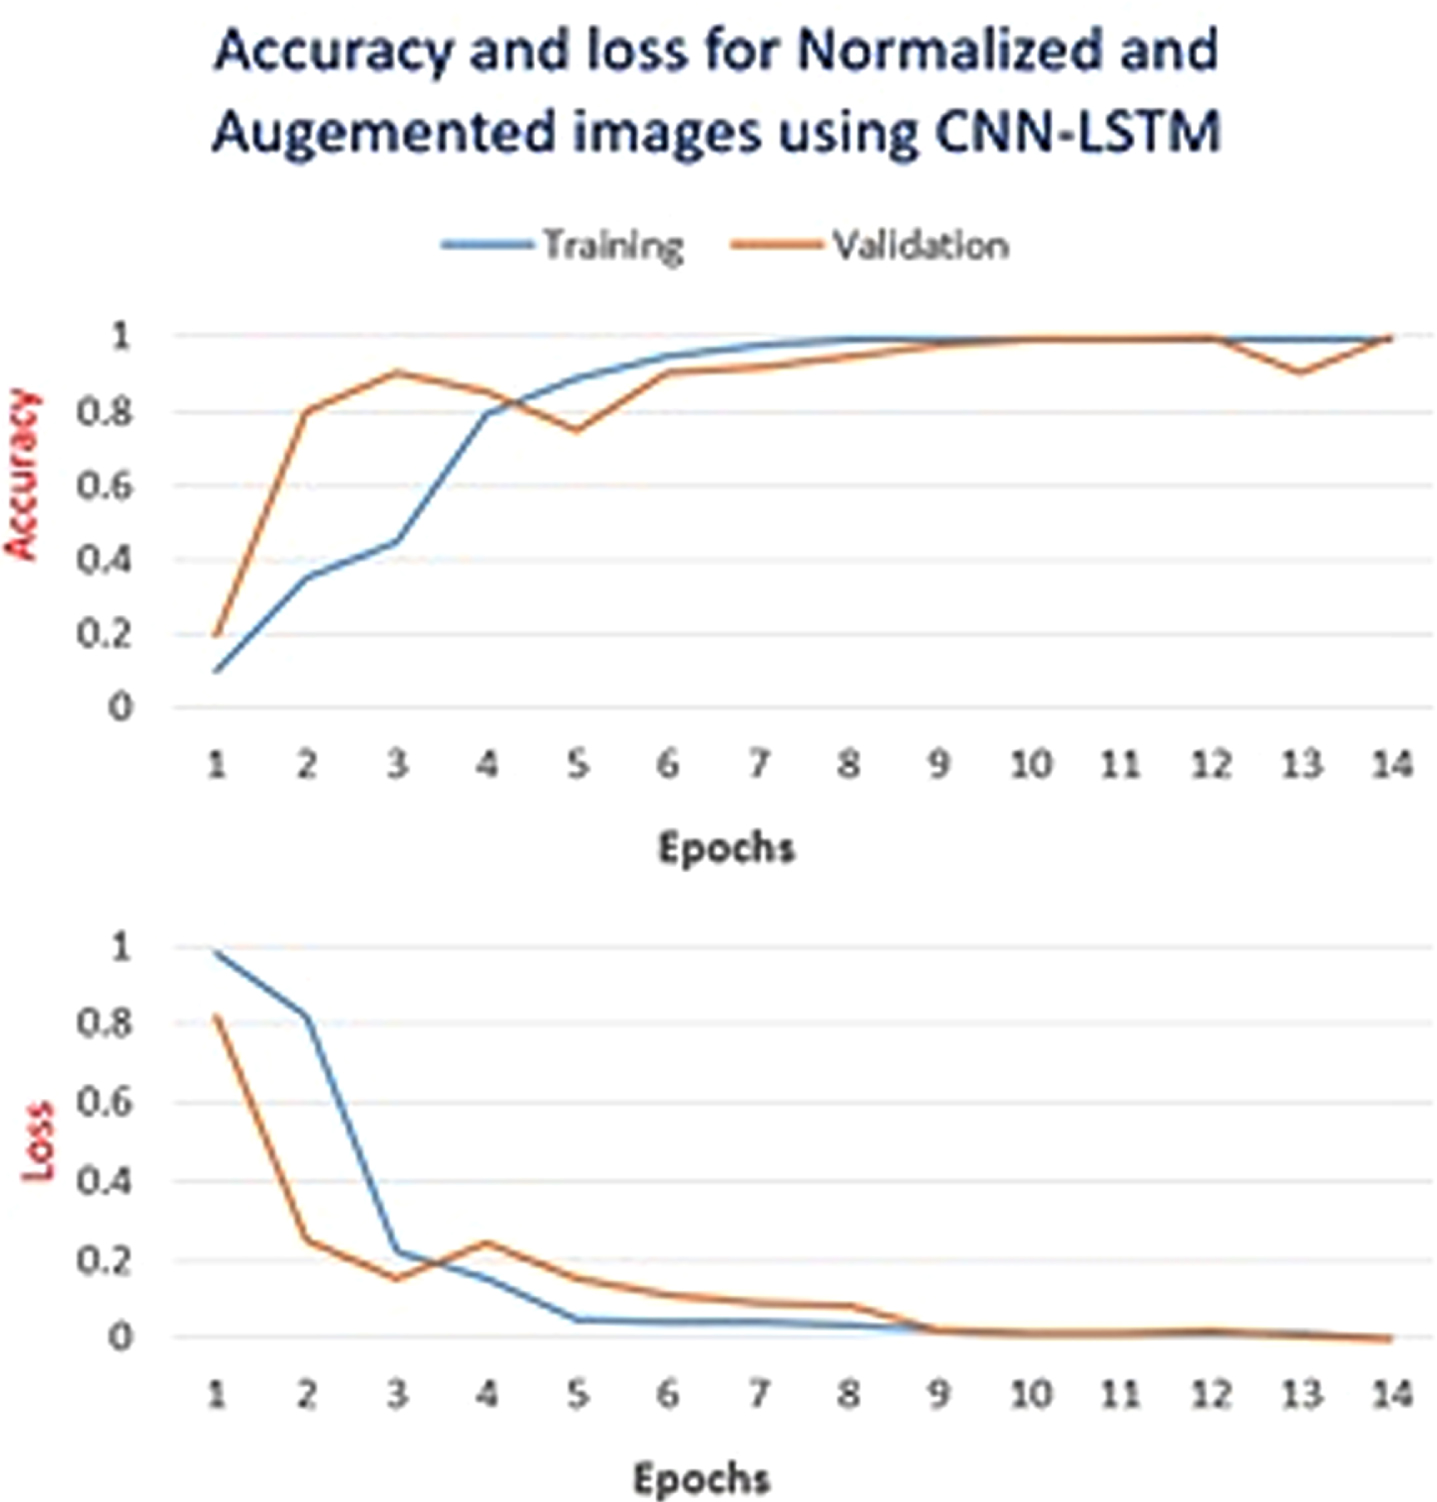
The graphs in Fig. 9 to 12 summarise the start of training, followed by the highest point and then the end of training. The graphs in Fig. 11 and 12 show the drop down in validation accuracy at some points while the training accuracy remains consistent which indicates that at some points the chosen parameters lead to over-fitting but later on the parameters got tuned properly and validation accuracy becomes consistent with the training accuracy. After repeating experiments multiple times, it is observed that before 30 epochs, training and validation errors stop dropping any more.
4Results and discussion
Both the models, CNN and CNN-LSTM, are tested on the same 20%of the data from the original CXR images. After testing, the performance of the models is evaluated by using different model evaluation statistics.
4.1Model evaluation
For models’ evaluation, accuracy, sensitivity, specificity, precision, Receiver Operating Characteristics (ROC), False Positive Rate (FPR), and True Positive Rate (TPR) are calculated by using equations from (19) to (23). The different evaluation measures provide an analysis of the performance of the model from different perspectives. Accuracy expresses the percentage of the correctly classified cases while sensitivity quantifies the fraction of the positive cases which are correctly identified. On the other hand, specificity quantifies the fraction of the negative cases which are classified correctly. F-score or f-measure combines precision (TPR) and recall (sensitivity), by calculating the harmonic mean of both. ROC graphically portrays the relationship between TPR and FPR. Its Area Under the Curve (AUC) shows how perfectly the model has performed. Greater AUC represents better performance.
(20)
(21)
(22)
(23)
(24)
4.2Results
Table 2
Performance comparison of proposed CNN and CNN-LSTM models
| Model | Training Data | Accuracy | Sensitivity | Specificity | Precision | f-measure |
| CNN | Raw CXRs | 51.00% | 0.93 | 0.1 | 0.51 | 0.72 |
| Normalized CXRs | 96.07% | 0.95 | 0.96 | 0.97 | 0.96 | |
| Normalized &Augmented CXRs | 97.05% | 0.93 | 0.98 | 0.99 | 0.96 | |
| CNN-LSTM | Normalized &Augmented CXRs | 99.02% | 1 | 0.99 | 0.99 | 1 |
Fig. 13
Receiver operating characteristic (ROC) curve
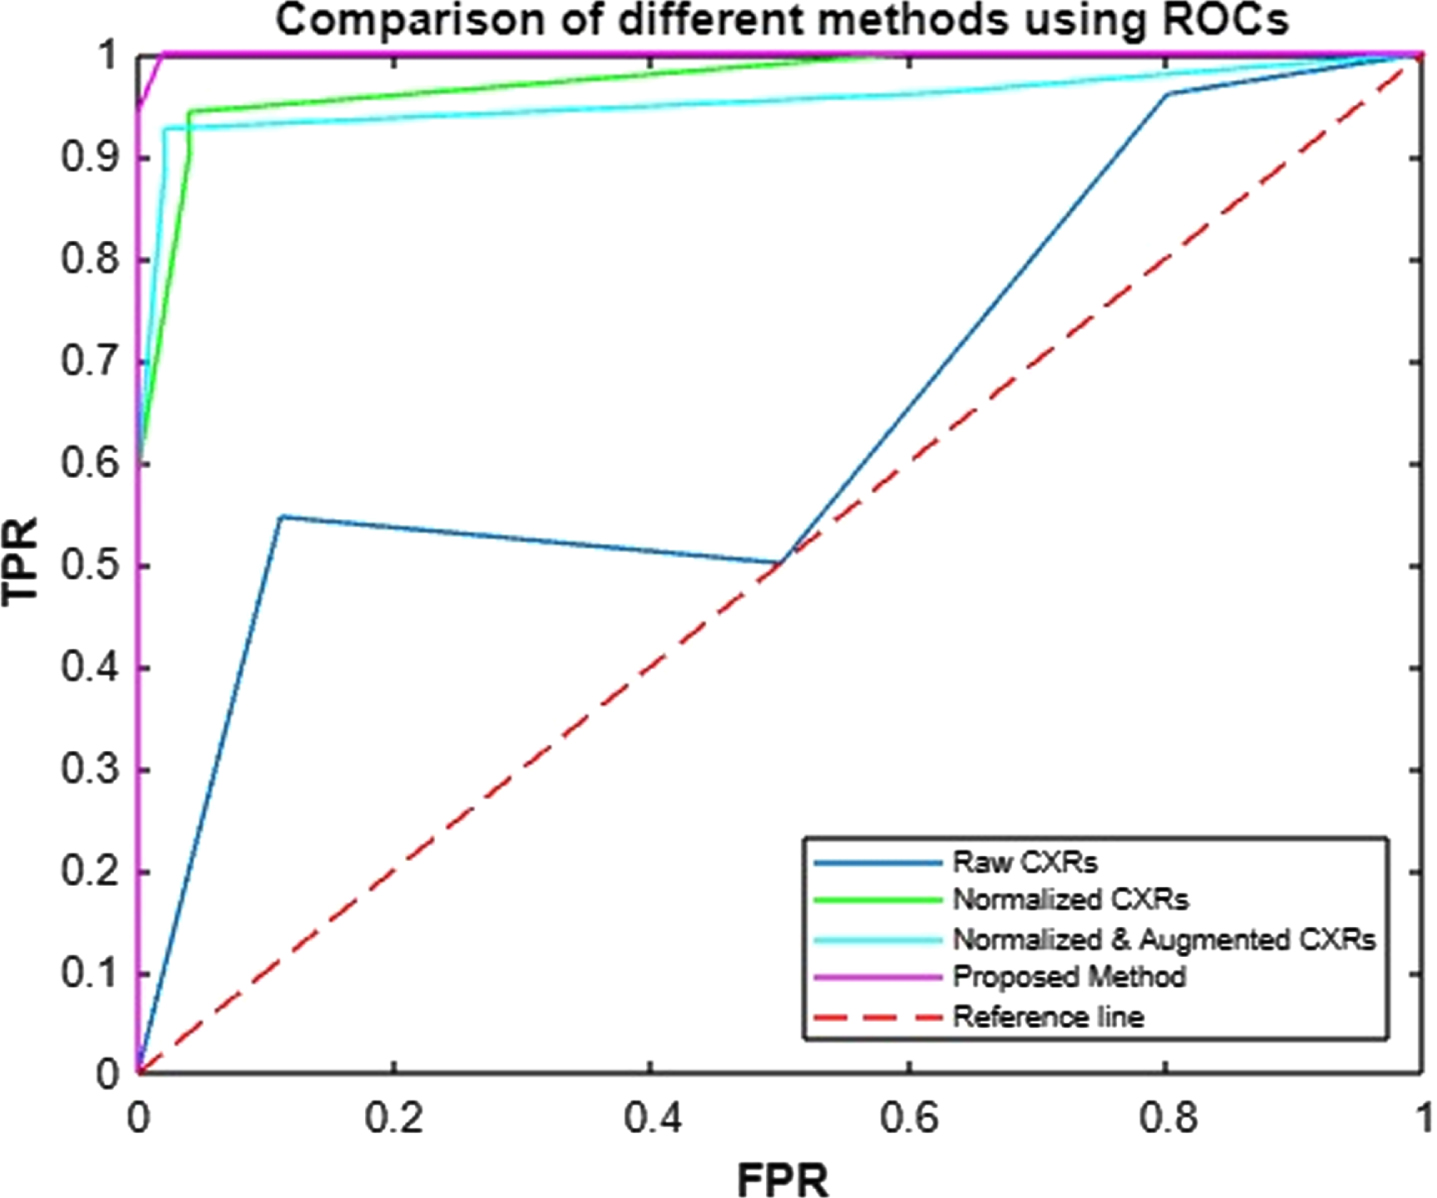
CNN, when trained on Raw CXRs, provides only 51%accuracy. The experiment is repeated five times to evaluate the results but the average accuracy of CNN on raw images remain 51%. The model is then trained on normalized CXRs for which, mean μ of all the images is turned into zero while standard deviation σ is made 1. With such a change in input images, the performance of CNN improves a lot and shows 96.07%accuracy. The mode is trained once again on augmented data derived from the normalized CXRs. With this change in the input data, CNN achieves 97.05%accuracy for COVID-19 diagnosis. CNN-LSTM, which is trained only on normalized augmented data, reveals very promising results by achieving 99.02%accuracy. The performance comparison of these four trained models by using accuracy, sensitivity, specificity, precisions, and f-measures is given in Table 2. The TPR and FPR of all the models are portrayed as ROC in Fig. 13.
4.3Discussion
The research proves that even powerful learners, like deep networks, are not able to show a reliable performance if the input is not good. When CNN is trained on raw images it is not able to classify into positive and negative cases of COVID-19. But, when all the CXR training images are pre-processed and are brought to the same scale the performance of CNN remarkably improves. Moreover, the normalization of CXR images further helps in better performance. By turning to mean into zero, CXRs become comparable for classification, while variance with value 1 lets CXRs comparable to standard normal distribution. Hence, after standardization, the performance of CNN model improves from 51%to 96.07%, which is indeed a great leap. Augmentation further improves the accuracy of CNN from 96.07%to 97.05%.
Table 3
Comparison of the proposed models with the other existing CAD systems for COVID-19 diagnosis
| Algorithms | Total Images | Accuracy |
| ResNet [42] | 558 | 95.20% |
| ResNet [7] | 3464 | 89.50% |
| ResNet [43] | 618 | 86% |
| Two U-Nets [44] | 1044 | 86% |
| U-Net++ [45] | 13751 | 95.20% |
| U-Net+CNN [30] | 542 | 90.90% |
| VGG16-CNN [25] | 8474 | 94.50% |
| Multi-CNNs [39] | 950 | 91.16% |
| R-CNN [31] | 13800 | 97.65% |
| CNN | 402 (after augmentation 3300) | 97.05% |
| CNN-LSTM | 402 (after augmentation 3300) | 99.02% |
Data augmentation is supposed to increase the performance of the model in the range of 1%to 3%[13]. With data augmentation, the CXR images dataset is increased by creating synthetic images from the existing ones. The technique works as a regularizer and makes the learner avoid overfitting. By this oversampling, data augmentation has gained paramount importance in classification which is also evident by the results of CNN when it is trained on pre-processed augmented images. Thus, augmented CXR images improve the performance of CNN from 96.07%to 97.05%. When CNN is used for features extraction only and LSTM is used for classification, this CNN-LSTM model outperforms all the other ones by showing 99.02%accuracy. Due to the memory mechanism, memory cells and gates, of LSTM, it can learn and remember long-term dependencies which always helps in improved performance.
The proposed CAD system, based on CNN-LSTM, not only outreaches the other models which are trained in this research, but also it outreaches the performance of other state-of-the-art COVID-19 diagnosis systems. The performance of the model is compared with the existing systems, based on ResNet [7, 42, 43], U-Net [30, 44, 45] and variations of CNN [25, 31, 39]. All these systems are trained on different datasets with the number of instances varying from 542 to 13,800. As referred in Table 3, among these state-of-the-art systems, only three systems have produced accuracy above 95%, and for producing such accuracy two of them have used above 13,000 CXR images. ResNet [42]is the only COVID-19 diagnosis systems which has produced above 95%accuracy with only 558 images, still the COVID-19 diagnosis systems, proposed in this research, reveal better results i.e., 97.05%and 99.02%accuracy with only 402 original CXR images. By employing different augmentation techniques, 3,300 images are generated from a small dataset consisting of 402 CXRs and it produced promising results. Hence the research proves that the CNN and LSTM based models, trained on augmented images, provide a remarkable diagnosis accuracy. Table 3 shows that the performance of the model is better than other models. Although other models used large annotated data for training but, the model proposed in this research uses a small dataset and still produces promising results. Although, comparison between different algorithms, trained on same dataset, is quite in practice but studies also propose some statistical methods [47] for comparing different algorithms for diverse datasets. Such comparisons are more essential for DL studies and presented in this research.
There are four main contributions of this research:
1. The performance of two powerful deep learners, CNN and LSTM, is evaluated for the effective computer-aided diagnosis of COVID-19. Not only the proposed models are compared with each other, but a comparison of these models with other existing systems is also presented.
2. A 2D CNN model architecture is designed to learn hierarchical 2D patterns in CXR images to classify COVID-19 positive and negative cases. Response of CNN for raw images vs. normalized and augmented images is also assessed.
3. The features’ strength of both normalized and augmented CXR images is investigated and summarized. In total, 3,220 augmented images are generated from 322 raw images, by applying 10 augmented techniques. The augmented and normalized images are used for training the models and improving the accuracy of the pandemic COVID-19 diagnosis.
4. In our approach we integrate the benefits of CNN-LSTM models and use pre-processed CXR images which give us 99.02%accurate diagnosis of COVID-19 cases. With such high accuracy, the overall mortality can be reduced as compared to the previous approaches.
5Conclusion
In this research, two powerful deep learners are used for COVID-19 diagnosis and very promising results are produced. The power of deep learners is further amplified by augmented CXR images. The proposed approach provides advantages that are summarized as follows:
• A high-grade and dense deep-learning model for the diagnosis of COVID-19 in Chest X-Rays (CXRs).
• An exclusive and compact data augmentation process.
• A deep insight into CNN and LSTM for COVID-19 detection by analysing the effects of normalisation and augmentation.
• The utilisation of powerful feature extraction attribute of CNN by feeding feature maps to LSTM for COVID-19 diagnosis.
• Diagnosis via easily generated and widely used CXRs.
The limitations and future work of the proposed work are as follows:
• Not combined with and extended to the other deep learning models.
• Frequency domain and other transformations such as Fast Fourier Transformation (FFT), Discrete Cosine Transformation (DCT), Wavelets and Hough Transformation, etc. are not yet considered.
• Variations of CNN, i.e., U-Net, LeNet-5, VGG-16, and ResNet-50, etc. are not utilized either.
• Meta-Features (features from features) are not extracted for training deep NWs.
• The model is not tested for other image types, i.e., Computerized Tomography (CT) Scan, Echocardiogram, Ultrasound and Magnetic Resonance Images (MRI).
Author contributions
This work was carried out in close collaboration among all co-authors. AN and MTH first defined the research theme and contributed an early design of the system. AN and MT further implemented and refined the system development. AN, MT and AA wrote the paper. AN revised the paper. All authors have contributed to, seen, and approved the final manuscript.
Compliance with ethical standards
Conflict of interest All authors declare that they have no conflict of interest.
Ethical approval This article does not contain any studies with human participants or animals performed by any of the authors.
Informed Consent This study used secondary data; therefore, the informed consent does not apply.
References
[1] | Sanche S. , Lin Y.T. , Xu C. , Romero-Severson E. , Hengartner N. and Ke R. , High contagiousness and rapid spread of severe acute respiratory syndrome coronavirus 2, Emerging Infectious Diseases 26: (7) ((2020) ), 1470–1477. |
[2] | Huang D. , Miao H. , Zhang Z. , Yang Y. , Zhang L. , Lure F.Y. , Wang Z. , Jaeger S. , Guo L. , Xu T. and Liu J. , Longitudinal changes of laboratory measurements after discharged from hospital in COVID-19 pneumonia patients, Journal of X-Ray Science and Technology 2021 (Preprint) (1-22): . |
[3] | Benmalek E. , Elmhamdi J. and Jilbab A. , Comparing CT scan and chest X-ray imaging for COVID-19 diagnosis, Biomedical Engineering Advances 1: (06) ((2021) ), 100003. |
[4] | Liang S. , Liu H. , Gu Y. , Guo X. , Li H. , Li L. , Wu Z. , Liu M. and Tao L. , Fast automated detection of COVID-19 from medical images using convolutional neural networks, Communications Biology 4: (1) ((2021) ), 1–13. |
[5] | Bassi P.R. and Attux R. , A deep convolutional neural network for COVID-19 detection using chest X-rays, Research on Biomedical Engineering (2021), 1–10. |
[6] | Panwar H. , Gupta P.K. , Siddiqui M.K. , Morales-Menendez R. and Singh V. , Application of deep learning for fast detection of COVID-19 in X-Rays using nCOVnet. Chaos, Solitons & Fractals 138: ((2020) ), 109944. |
[7] | Li L. , Qin L. , Xu Z. , Yin Y. , Wang X. , Kong B. , Bai J. , Lu Y. , Fang Z. and Song Q. , Using artificial intelligence to detect COVID-19 and community-acquired pneumonia based on pulmonary CT: evaluation of the diagnostic accuracy, Radiology 296: (2) ((2020) ), E65–E71. |
[8] | Ardakani A.A. , Acharya U.R. , Habibollahi S. and Mohammadi A. , COVIDiag: A clinical CAD system to diagnose COVID-19 pneumonia based on CT findings, European Radiology 31: (1) ((2021) ), 121–130. |
[9] | Abbas A. , Abdelsamea M.M. and Gaber M.M. , Classification of COVID-19 in chest X-ray images using DeTraC deep convolutional neural network, Applied Intelligence 51: (2) ((2021) ), 854–864. |
[10] | Bassi P.R. and Attux R. , A deep convolutional neural network for covid-19 detection using chest x-rays, Research on Biomedical Engineering (2021), 1–10. |
[11] | Wang S.H. , Govindaraj V.V. , Gorriz J.M. , Zhang X. and Zhang Y.D. , COVID-19 classification by FGCNet with deep feature fusion from graph convolutional network and convolutional neural network, Information Fusion 67: ((2021) ), 208–229. |
[12] | Shorten C. and Khoshgoftaar T.M. , A survey on image data augmentation for deep learning, Journal of Big Data 6: (1) ((2019) ), 1–48. |
[13] | Moreno-Barea F.J. , Jerez J.M. and Franco L. , Improving classification accuracy using data augmentation on small data sets, Expert Systems with Applications 161: ((2020) ), 113696. |
[14] | Ozturk T. , Talo M. , Yildirim E.A. , Baloglu U.B. , Yildirim O. and Acharya U.R. , Automated detection of COVID-19 cases using deep neural networks with X-ray images, Computers in Biology and Medicine 121: ((2020) ), 103792. |
[15] | Tamoor M. and Younas I. , Automatic segmentation of medical images using a novel Harris Hawk optimization method and an active contour model, Journal of X-Ray Science and Technology Preprint1–19 : ((2021) ). |
[16] | Naseer A. and Zafar K. , Comparative analysis of raw images and meta feature based Urdu OCR using CNN and LSTM, International Journal of Advanced Computer Science and Applications 9: (1) ((2021) ), 419–424. |
[17] | Naseer A. and Zafar K. , Meta features-based scale invariant OCR decision making using LSTM-RNN, Computational and Mathematical Organization Theory 25: (2) ((2019) ), 165–183. |
[18] | Habib S. and Akram M. , Diagnostic methods and risk analysis based on fuzzy soft information, International Journal of Biomathematics 11: (8) ((2018) ), 1850096. |
[19] | Habib S. and Akram M. , Medical decision support systems based on fuzzy cognitive maps, International Journal of Biomathematics 12: (6) ((2019) ), 1950069. |
[20] | Akram M. , Shahzadi G. and Ahmadini A.A.H. , Decision-making framework for an effective sanitizer to reduce COVID-19 under Fermatean fuzzy environment, Journal of Mathematics 2020, DOI: 10.1155/2020/3263407. |
[21] | Garg H. , Shahzadi G. and Akram M. , Decision-making analysis based on Fermatean fuzzy Yager aggregation operators with application in COVID-19 testing facility, Mathematical Problems in Engineering, 2020, Article ID 7279027, pp. 16. |
[22] | Habib S. , Ashraf A. , Butt M.A. and Ahmad M. , Medical diagnosis based on single-valued neutrosophic information, Neutrosophic Sets and Systems 42: ((2021) ), 302–323. |
[23] | Shinde G.R. , Kalamkar A.B. , Mahalle P.N. , Dey N. , Chaki J. and Hassanien A.E. , Forecasting models for coronavirus disease (COVID-19): a survey of the state-of-the-art, SN Computer Science 1 1: (4) ((2020) ), 1–15. |
[24] | Dey N. , Rajinikanth V. , Fong S.J. , Kaiser M.S. and Mahmud M. , Social group optimization-assisted Kapur’s entropy and morphological segmentation for automated detection of COVID-19 infection from computed tomography images, Cognitive Computation 12: (5) ((2020) ), 1011–1023. |
[25] | Heidari M. , Mirniaharikandehei S. , Khuzani A.Z. , Danala G. , Qiu Y. and Zheng B. , Improving the performance of CNN to predict the likelihood of COVID-19 using chest X-ray images with preprocessing algorithms, International Journal of Medical Informatics 144: ((2020) ), 104284. |
[26] | Attallah O. , Ragab D.A. and Sharkas M. , Multi-deep: A novel cad system for coronavirus (covid-19) diagnosis from ct images using multiple convolution neural networks, Peer J 8: ((2020) ), e10086. |
[27] | Karar M.E. , Hemdan E.E.D. and Shouman M.A. , Cascaded deep learning classifiers for computer aided diagnosis of COVID-19 and pneumonia diseases in X-ray scans, Complex & Intelligent Systems 7: (1) ((2020) ), 235–247. |
[28] | Al-antari M.A. , Hua C.H. and Lee S. , Fast deep learning computer-aided diagnosis against the novel COVID-19 pandemic from digital chest X-ray images, Europe PMC (2020). |
[29] | Li T. , Wei W. , Cheng L. , Zhao S. , Xu C. , Zhang X. , Zeng Y. and Gu J. , Fast deep learning computer-aided diagnosis against the novel COVID-19 pandemic from digital chest X-ray images, Europe PMC (2020). |
[30] | Zheng C. , Deng X. , Fu Q. , Zhou Q. , Feng J. , Ma H. , Liu W. and Wang X. , Deep learning-based detection for COVID-19 from chest CT using weak label, medRxiv:2020.03.12.20027185, (2020). |
[31] | Shibly K.H. , Dey S.K. , Islam M.T.U. and Rahman M.M. , COVID faster R-CNN: A novel framework to diagnose novel coronavirus disease (COVID-19) in X-ray images, Informatics in Medicine Unlocked 20: ((2020) ), 100405. |
[32] | Sethy P.K. , Behera S.K. , Anitha K. , Pandey C. and Khan M.R. , Computer aid screening of COVID-19 using X-ray and CT scan images: An inner comparison, Journal of X-ray Science and Technology, (Preprint), (2021), 1–14. |
[33] | Behera S. and Sethy P. , Categorization of Common Pigmented Skin Lesions (CPSL) using Multi-Deep Features and Support Vector Machine. (2021). |
[34] | Sethy P.K. and Behera S.K. , A data constrained approach for brain tumour detection using fused deep features and SVM, Multimedia Tools and Applications (2021), 1–16. |
[35] | Demir F. , DeepCoroNet: A deep LSTM approach for automated detection of COVID-19 cases from chest X-ray images, Applied Soft Computing 103: ((2021) ), 107160. |
[36] | Ardakani A.A. , Acharya U.R. , Habibollahi S. and Mohammadi A. , Covidiag: A clinical CAD system to diagnose COVID-19 pneumonia based on CT findings, European Radiology 30: (1) ((2021) ), 121–130. |
[37] | Abbasi W.A. , Abbas S.A. and Andleeb S. , Covidx: Computer-aided diagnosis of covid-19 and its severity prediction with raw digital chest X-ray images, arXiv preprint arXiv:2012.13605, (2020). |
[38] | Carvalho A.R.S. , Guimaraes A. , Werberich G.M. , de Castro S.N. , Pinto J.S.F. , Schmitt W.R. , França M. , Bozza F.A. , da Silva Guimaraes B.L. , Zin W.A. and Rodrigues R.S. , COVID-19 chest computed tomography to stratify severity and disease extension by artificial neural network computer-aided diagnosis, Frontiers in Medicine 7: (12) ((2020) ), 1–11. |
[39] | Abraham B. and Nair M.S. , Computer-aided detection of COVID-19 from X-ray images using multi-CNN and bayesnet classifier, Biocybernetics and Biomedical Engineering 40: (4) ((2020) ), 1436–1445. |
[40] | Li H. , Hu Y. , Li S. , Lin W. , Liu P. , Higashita R. and Liu J. , CT scan synthesis for promoting computer-aided diagnosis capacity of COVID-19, International Conference on Intelligent Computing, (2020), Springer, 413–422. |
[41] | Narayanan B.N. , Hardie R.C. , Krishnaraja V. , Karam C. and Davuluru V.S.P. , Transfer-to-transfer learning approach for computer aided detection of COVID-19 in chest radiographs, AI 1: (4) ((2020) ), 539–557. |
[42] | Xu X. , Jiang X. , Ma C. , Du P. , Li X. , Lv S. , Yu L. , Ni Q. , Chen Y. , Su J. , et al., A deep learning system to screen novel coronavirus disease pneumonia, Engineering 6: (10) ((2020) ), 1122–1129. |
[43] | Song Y. , Zheng S. , Li L. , Zhang X. , Zhang X. , Huang Z. , Chen J. , Zhao H. , Jie Y. and Wang R. , Deep learning enables accurate diagnosis of novel coronavirus (COVID-19) with CTimages, MedRxiv:2020.02.23. 20026930., (2020). |
[44] | Amyar A. , Modzelewski R. , Li H. and Ruan S. , Multi-task deep learning based CT imaging analysis for covid-19 pneumonia: Classification and segmentation, Computers in Biology and Medicine 126: ((2020) ), 104037. |
[45] | Chen J. , Wu L. , Zhang J. , Zhang L. , Gong D. , Zhao Y. , Chen Q. , Huang S. , Yang M. and Yang X. , Deep learning-based model for detecting novel coronavirus pneumonia on high-resolution computed tomography, Scientific Reports 10: (1) ((2020) ), 1–11. |
[46] | Sharma S. , Covid X-Ray Dataset, version 1, https://www.kaggle.com/sanyamss99/covid-xray-dataset 18: (07) ((2020) ). |
[47] | Janez D. , Statistical comparisons of classifiers over multiple data sets, The Journal of Machine Learning Research 7: ((2006) ), 1–30. |


