
Impact of novel deep learning image reconstruction algorithm on diagnosis of contrast-enhanced liver computed tomography imaging: Comparing to adaptive statistical iterative reconstruction algorithm
Abstract
OBJECTIVE:
To assess clinical application of applying deep learning image reconstruction (DLIR) algorithm to contrast-enhanced portal venous phase liver computed tomography (CT) for improving image quality and lesions detection rate compared with using adaptive statistical iterative reconstruction (ASIR-V) algorithm under routine dose.
METHODS:
The raw data from 42 consecutive patients who underwent contrast-enhanced portal venous phase liver CT were reconstructed using three strength levels of DLIRs (low [DL-L]; medium [DL-M]; high [DL-H]) and two levels of ASIR-V (30%[AV-30]; 70%[AV-70]). Objective image parameters, including noise, signal-to-noise (SNR), and the contrast-to-noise ratio (CNR) relative to muscle, as well as subjective parameters, including noise, artifact, hepatic vein-clarity, index lesion-clarity, and overall scores were compared pairwise. For the lesions detection rate, the five reconstructions in patients who underwent subsequent contrast-enhanced magnetic resonance imaging (MRI) examinations were compared.
RESULTS:
For objective parameters, DL-H exhibited superior image quality of lower noise and higher SNR than AV-30 and AV-70 (all P < 0.05). CNR was not statistically different between AV-70, DL-M, and DL-H (all P > 0.05). In both objective and subjective parameters, only image noise was statistically reduced as the strength of DLIR increased compared with ASIR-V (all P < 0.05). Regarding the lesions detection rate, a total of 45 lesions were detected by MRI examination and all five reconstructions exhibited similar lesion-detection rate (25/45, 55.6%).
CONCLUSION:
Compared with AV-30 and AV 70, DLIR leads to better image quality with equal lesion detection rate for liver CT imaging under routine dose.
1Introduction
As a non-invasive examination for diagnosis and evaluation of live diseases, liver contrast-enhanced computed tomography (CT) examination is becoming more and more extensive, but the concerns that comes with medical radiation dose has become more and more significant. Constant image-reconstruction algorithm improvement and software system designing is one of the critical steps in the project of balancing image quality and radiation exposure [1–3].
As a widely recognized and accepted image-reconstruction algorithm, adaptive statistical iterative reconstruction V (ASIR-V, GE Healthcare Waukesha, WI, USA) is challenged by changes in image noise and texture, which may present a plastic or unnatural appearance, especially at high iterative levels [4–7]. This limitation might influence the interpretation of images and the ability of radiation dose reduction [8, 9]. True-Fidelity is a deep learning image reconstruction (DLIR) algorithm developed recently by GE Healthcare by using deep neural network (DNN)-based artificial intelligence technology. The algorithm was trained with millions of high qualities filtered back-projection images as the training targets and large number of extreme cases as the verification data sets. With millions of parameters that represent image quality characteristics, this algorithm could actively identify and reduce image noise and make it obtain the better and more applications [10–12]. As far as we know, present study had no adequate evidence to verify its clinical application especially in diagnostic accuracy of liver lesions.
Therefore, the aim of this study was to assess the clinical application of the DLIR algorithm (low, medium and high DLIR) compared to the most advanced ASIR algorithm (30%and 70%ASIR-V) in image quality and the lesions detection rate in liver CT under routine dose.
2Subjects and methods
2.1Subjects
From August 2020 to February 2021, a total of 68 patients underwent contrast-enhanced liver CT examinations at our center due to suspected liver tumors for the first time. 26 patients were excluded due to the receipt of interventional therapy prior to CT (n = 14), the presence of incomplete portal venous phase CT images (n = 4), or the lack of lesions in image diagnostic reports (n = 8). Ultimately, 42 cases were retrospectively analyzed (mean patient age, 60.0 + 10.1 years; 23 males; 19 females).
2.2CT scanning technique and image reconstruction
All patients in our study underwent 256-slice multidetector contrast-enhanced liver CT (Revolution CT, GE Healthcare Waukesha, WI, USA). The parameters were as follows: tube voltage, 120 kV; tube current modulation range, 50–500 mA; noise index, 16.0; scan type, Helical; Rotation time, 0.50 s; detector coverage, 80 mm; pitch, 0.992: 1; coverage speed, 158.75 mm/s; scan slice thickness: 5 mm. IV injected weight-based contrast was performed with 1.2 mL I/kg and an injection speed of 3.0 mL/s. Arterial phase was scanned at a delay of 5 seconds after the threshold of abdominal aorta reached 120 HU. Portal venous phase was scanned at a delay of 30 seconds after arterial phase completed.
All portal venous phase images were reconstructed using ASIR-V algorithm at level of 30%(AV-30) and 70%(AV-70) and DLIR algorithm at strength of low (DL-L), medium (DL-M), and high (DL-H) with a 1.25-mm slice thickness at a 1.25-mm interval in the axial plane.
2.3Evaluation of image quality
2.3.1Objective quality evaluation
The five reconstructed images were imported into AW workstation (Advantage workstation 4.6, GE healthcare). Four regions of interest (ROIs) (80±20 mm2) were placed on the liver parenchyma of right posterior lobe [RPL], right anterior lobe [RAL], left medial lobe [LML], and left lateral lobe [LLL] at the level of the portal vein to calculate the average noise of liver parenchyma. Two ROIs were placed on the subcutaneous fat of the anterior abdomen and the right erector spinae on the same level to calculate the signal-to-noise ratio (SNR) of liver parenchyma and the contrast-to-noise ratio (CNR) relative to muscle. The reconstructions were linked in each viewport, so that identical interest could be drawn in the same location and of the same size in each reconstruction. The corresponding image noise, SNR and CNR are computed using following equations.
2.3.2Subjective quality evaluation
The five reconstructed images were imported into the GE PACS workstation and presented to two subprofessional abdominal radiologists (termed reader 1 and 2, with 10 and 15 years of experience, respectively). Readers 1 and 2 independently scored the subjective parameters of different reconstructions with a randomized order and without reconstruction algorithm information or annotations. The images were presented with a window with of 400 HU and a level of 40 HU.
As there were five reconstructed images, we used a 5-point Likert scale to score the parameters, including image noise score, artifact score, hepatic vein-clarity score relative liver parenchyma, index lesion-clarity score relative liver parenchyma. The index lesion was the one that shows enhanced and largest (calcifications were excluded). If none of the lesions were enhanced, the largest lesion was considered the index lesion.
The 5-point scale included 1. poor, 2, fair, 3. above, 4. good, and 5. excellent. Score 3 was considered as medium level in five reconstructions. Scores could be used repeatedly if reconstructions had equivalent subjective qualities. The overall score was considered as the average of the four scores.
2.4The lesions detection rate
The contrast-enhanced magnetic resonance imaging (MRI) examination was taken as the reference standard for lesions count were presented to 2 readers to count the overall number of liver lesions [13]. For each enrolled case, 2 readers counted the number of liver lesions in MRI respectively until consensus was reached. Two weeks later, the reader 1 counted the number of liver lesions of each case in randomly selected reconstruction. To avoid memory effects, only one randomly selected reconstruction was presented to reader 1 at a time with one-week interval without reconstruction information. Given to the low sensitivity of MRI in calcifications, calcifications were not evaluated in this study. Any other lesions (e.g., cysts, tumors or unexplained abnormal signals in MRI) were all counted.
2.5Statistical analysis
All statistical analyses were performed using IBM SPSS Statistics, version 20.0 (SPSS, Inc., Chicago, IL, USA). The Kolmogorov-Smirnov test was used to test the distribution and normality of the data. For quantitative data with and without normal distributions, we performed one-way analyses of variance and the Kruskal-Wallis test, respectively. The Bonferroni correction was used for pairwise comparisons. Cohen’s linearly weighted kappa was used to assess inter-reader agreement. The lesions detection rate of five reconstructions against the MRI examinations were simply calculated and compared. A P value < 0.05 was considered statistically significant.
3Results
3.1Image quality analysis
3.1.1Objective quality analysis
AV-30 exhibited the worst image quality in all objective terms compared to any strength of DLIRs, which had a statistically higher noise, lower SNR and CNR. AV-70 was equivalent to DL-M but lower than DL-H in terms of noise and SNR, and CNR was not statistically different between AV-70, DL-M, and DL-H. Compared to AV-30 and AV-70, only image noise was reduced statistically as the strength of DLIR increased. The results of the objective image quality analyses are summarized in Fig. 1, Tables 1 and 2.
Fig. 1
Box-and-whisker plots of the objective parameters. DLIR provided significantly better image qualities than ASIR-V30 in terms of noise, signal-to-noise ratio (SNR), and contrast-to-noise ratio (CNR). DLIR-medium provided an equivalent image quality to ASIR-V70 in terms of noise, SNR and CNR. DLIR-high had a significantly better image quality than ASIR-V70 in terms of noise and SNR, but exhibited the same CNR.
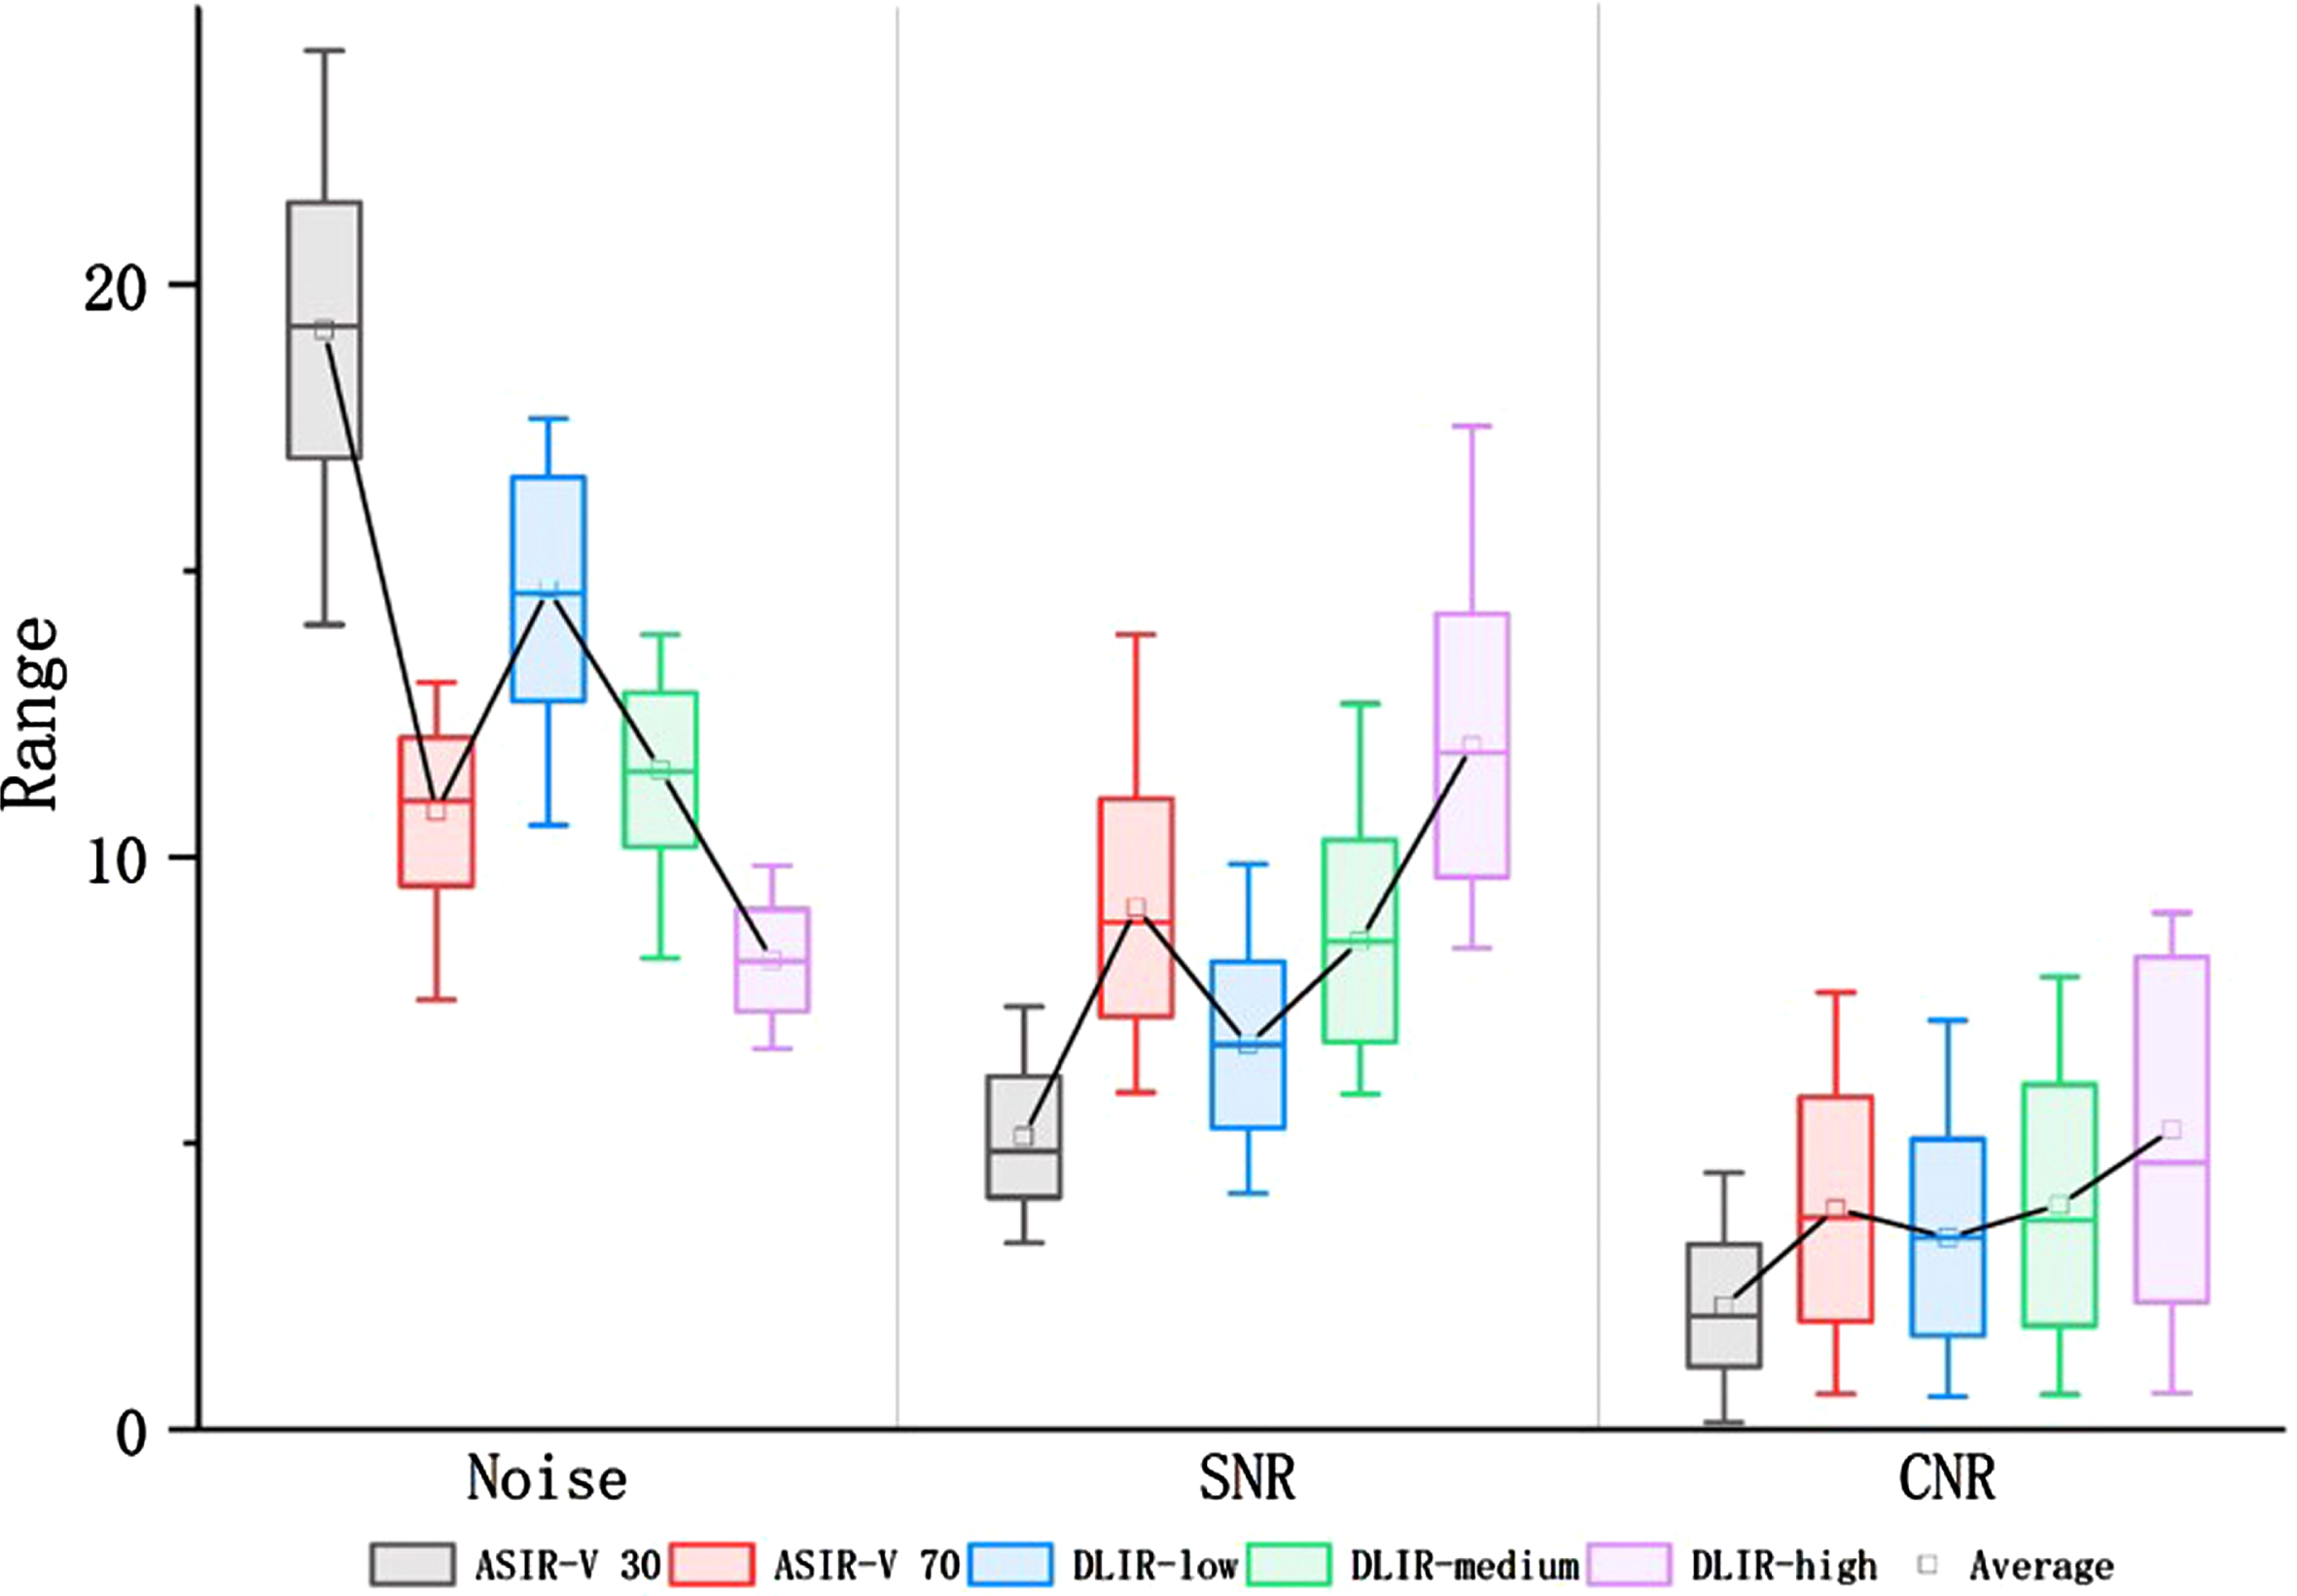
Table 1
Objective and subjective image quality
| Reconstruction | ASIR-V30 | ASIR-V70 | DLIR-Low | DLIR-Medium | DLIR-High | P value |
| Objective parameters | ||||||
| Noise | 19.20±2.23 | 10.79±1.30 | 14.67±2.00 | 11.51±1.34 | 8.19±0.89 | < 0.001 |
| SNR | 5.11±1.06 | 9.11±1.90 | 6.72±1.45 | 8.53±1.76 | 11.95±2.30 | < 0.001 |
| CNR | 2.14±1.06 | 3.85±2.00 | 3.34±1.71 | 3.92±2.11 | 5.23±3.01 | < 0.001 |
| Subjective parameters | ||||||
| Noise | 1.00±0 | 3.02±0.79 | 2.26±0.45 | 3.64±0.49 | 4.88±0.33 | < 0.001 |
| Artifact | 4.69±0.47 | 4.85±0.35 | 4.95±0.22 | 5.00±0 | 5.00±0 | < 0.001 |
| Hepatic veins clarity | 2.02±1.09 | 2.59±0.66 | 3.55±0.99 | 3.71±0.81 | 3.76±1.16 | < 0.001 |
| Lesion clarity | 2.50±1.33 | 3.62±1.01 | 3.14±0.75 | 4.26±0.85 | 3.57±1.35 | < 0.001 |
| Overall score | 2.55±0.53 | 3.76±0.47 | 3.23±0.75 | 4.15±0.35 | 4.30±0.49 | < 0.001 |
Table 2
Pairwise comparisons of objective and subjective image quality
| Objective Image Quality | Subjective Image Quality | |||||||
| Noise | SNR | CNR | Noise | Artifact | Vein clarity | Lesion clarity | Overall | |
| AV-30 VS AV-70 | < 0.001 | < 0.001 | < 0.001 | < 0.001 | 0.111* | 0.891* | 0.002 | < 0.001 |
| AV-30 VS DL-L | 0.019 | 0.024 | 0.025 | < 0.001 | 0.001 | < 0.001 | 0.880* | < 0.001 |
| AV-30 VS DL-M | < 0.001 | < 0.001 | < 0.001 | < 0.001 | < 0.001 | < 0.001 | < 0.001 | < 0.001 |
| AV-30 VS DL-H | < 0.001 | < 0.001 | < 0.001 | < 0.001 | < 0.001 | < 0.001 | 0.001 | < 0.001 |
| AV-70 VS DL-L | < 0.001 | < 0.001 | 1.000* | 0.101* | 1.000* | 0.001 | 0.389* | 1.000* |
| AV-70 VS DL-M | 1.000* | 1.000* | 1.000* | 0.357* | 0.295* | < 0.001 | 0.085* | < 0.001 |
| AV-70 VS DL-H | 0.001 | 0.005 | 0.410* | < 0.001 | 0.295* | < 0.001 | 1.000* | 0.005 |
| DL-L VS DL-M | 0.001 | 0.005 | 1.000* | < 0.001 | 1.000* | 1.000* | < 0.071* | < 0.001 |
| DL-L VS DL-H | < 0.001 | < 0.001 | 0.017 | < 0.001 | 1.000* | 1.000* | 0.341* | < 0.001 |
| DL-M VS DL-H | < 0.001 | < 0.001 | 0.434* | < 0.001 | 1.000* | 1.000* | 0.100* | 1.000* |
AV-30 and AV-70 represent 30%and 70%adaptive statistical iterative reconstructions; DL-L, DL-M, and DL-H represent low, medium, and high strengths of deep learning image reconstruction; * P > 0.05.
3.1.2Subjective quality analysis
For the subjective terms’ evaluation, there was moderate to substantial inter-reader agreement (Kappa = 0.662–0.758).
When combining the four independent terms, the overall score from low to high was AV-30 (2.55±0.53), DL-L (3.23±0.75), AV-70 (3.76±0.47), DL-M (4.15±0.35), and DL-H (4.30±0.49). The score for AV-30 was statistically lower than all other reconstructions. The score for DL-L was statistically equivalent with AV-70. The score for AV-70 was statistically lower than that of DL-M and DL-H. The score for DL-M was statistically equivalent with DL-H.
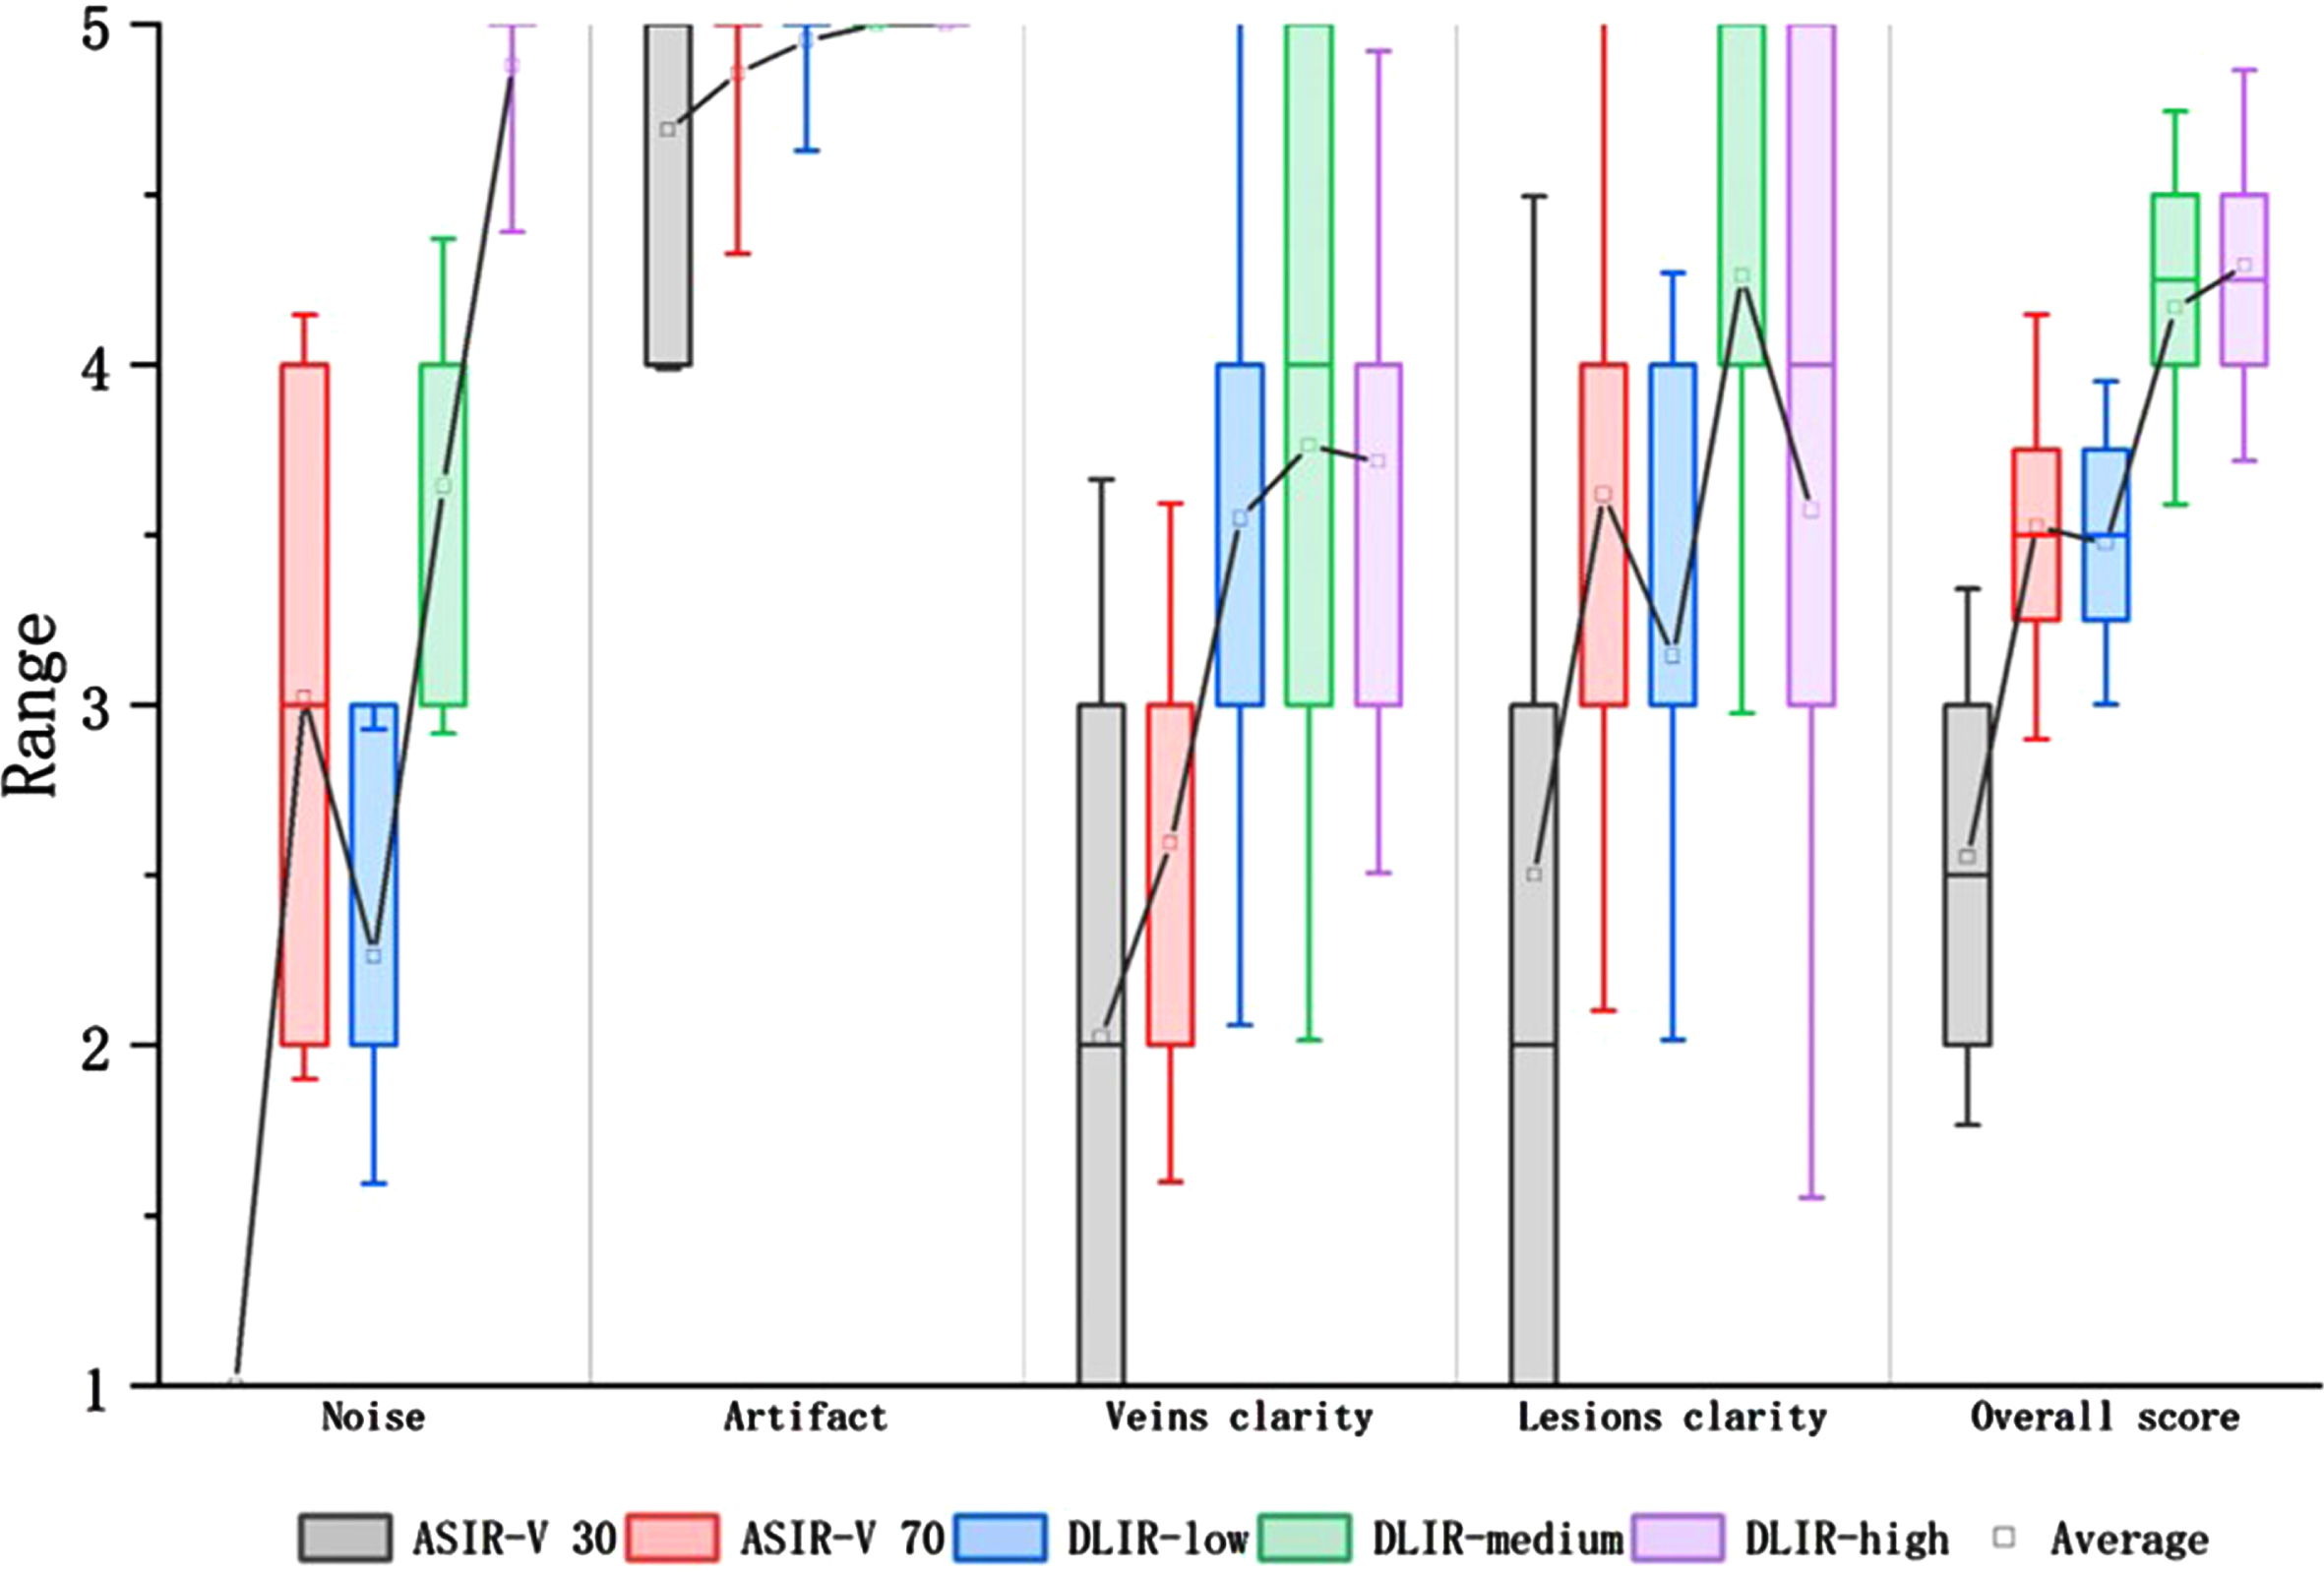
When analyzing the four terms independently, only image noise score was statistically increased as the strength of DLIR increased. For artifact score, AV-30 exhibited statistically lower score than any strength level of DLIR, but there was no statistically difference between AV-70 and DLIRS. For vein-clarity score, AV-30 and AV-70 exhibited statistically lower score than any strength level of DLIRs, but there was no statistically difference between DLIRs. For lesion-clarity score, AV-30 exhibited statistically lower score than DL-M and DL-H, and there was no significantly statistical difference between AV-70, DL-M and DL-H. The results of the subjective image quality analyses are summarized in Fig. 2, Tables 1 and 2.
Fig. 2
Box-and-whisker plots of the subjective parameters. DLIR-medium and DLIR-high had significantly better image qualities than ASIR-V30 according to the image noise score, artifact score, vein-clarity score, lesion-clarity score, and overall score. DLIR-high had a significantly better image quality than ASIR-V70 according to the noise score, vein-clarity score, and overall score. However, DLIR-high was not significantly different than ASIR-V70 in terms of artifact score and lesion-clarity score.
3.2The lesions detection rate
In our study, 8 patients underwent subsequent contrast enhanced liver MRI examination after CT scanning. A total of 45 lesions in the MRI images were detected by 2 readers with length of the lesions varied from 0.4 cm to 4.7 cm, including 25 hepatic cysts, 5 hepatic hemangioma, 13 liver malignancies, and 2 unexplained abnormal signals. The number of lesions detected by reader 1 in all five reconstructions exhibited similar lesion-detection rate (25/45, 55.6%) (Table 3).
Table 3
Accuracy of lesion detection of the five reconstructions
| Patient number | The number of lesions detected by reader 1 in different images | |||||
| MRI* | ASIR-V30 | ASIR-V 70 | DLIR-Low | DLIR-Medium | DLIR-High | |
| 1 | 16 | 2 | 2 | 2 | 2 | 2 |
| 2 | 3 | 3 | 3 | 3 | 3 | 3 |
| 3 | 3 | 2 | 2 | 2 | 2 | 2 |
| 4 | 6 | 4 | 4 | 4 | 4 | 4 |
| 5 | 7 | 5 | 5 | 5 | 5 | 5 |
| 6 | 1 | 1 | 1 | 1 | 1 | 1 |
| 7 | 5 | 4 | 4 | 4 | 4 | 4 |
| 8 | 4 | 4 | 4 | 4 | 4 | 4 |
| Overall lesions | 45 | 25 | 25 | 25 | 25 | 25 |
*The number of lesions in MRI images were taken as the reference standards.
4Discussion
In this study, we simultaneously evaluated image quality and the lesions detection rate between two blending percentages of ASIR-V and three strengths of DLIRs. For objective parameters, DL-H exhibited superior image quality according to the noise and SNR than ASIR-V. For subjective parameters, DL-M was similar with DL-H, but both higher than ASIR-V according to overall score. And only objective and subjective noise reduction occurred statistically as the strength of DLIRs increased but not observed for any other parameters (Fig. 3). Regarding to the lesions detection rate, there was no difference in lesion-detection rate between two algorisms.
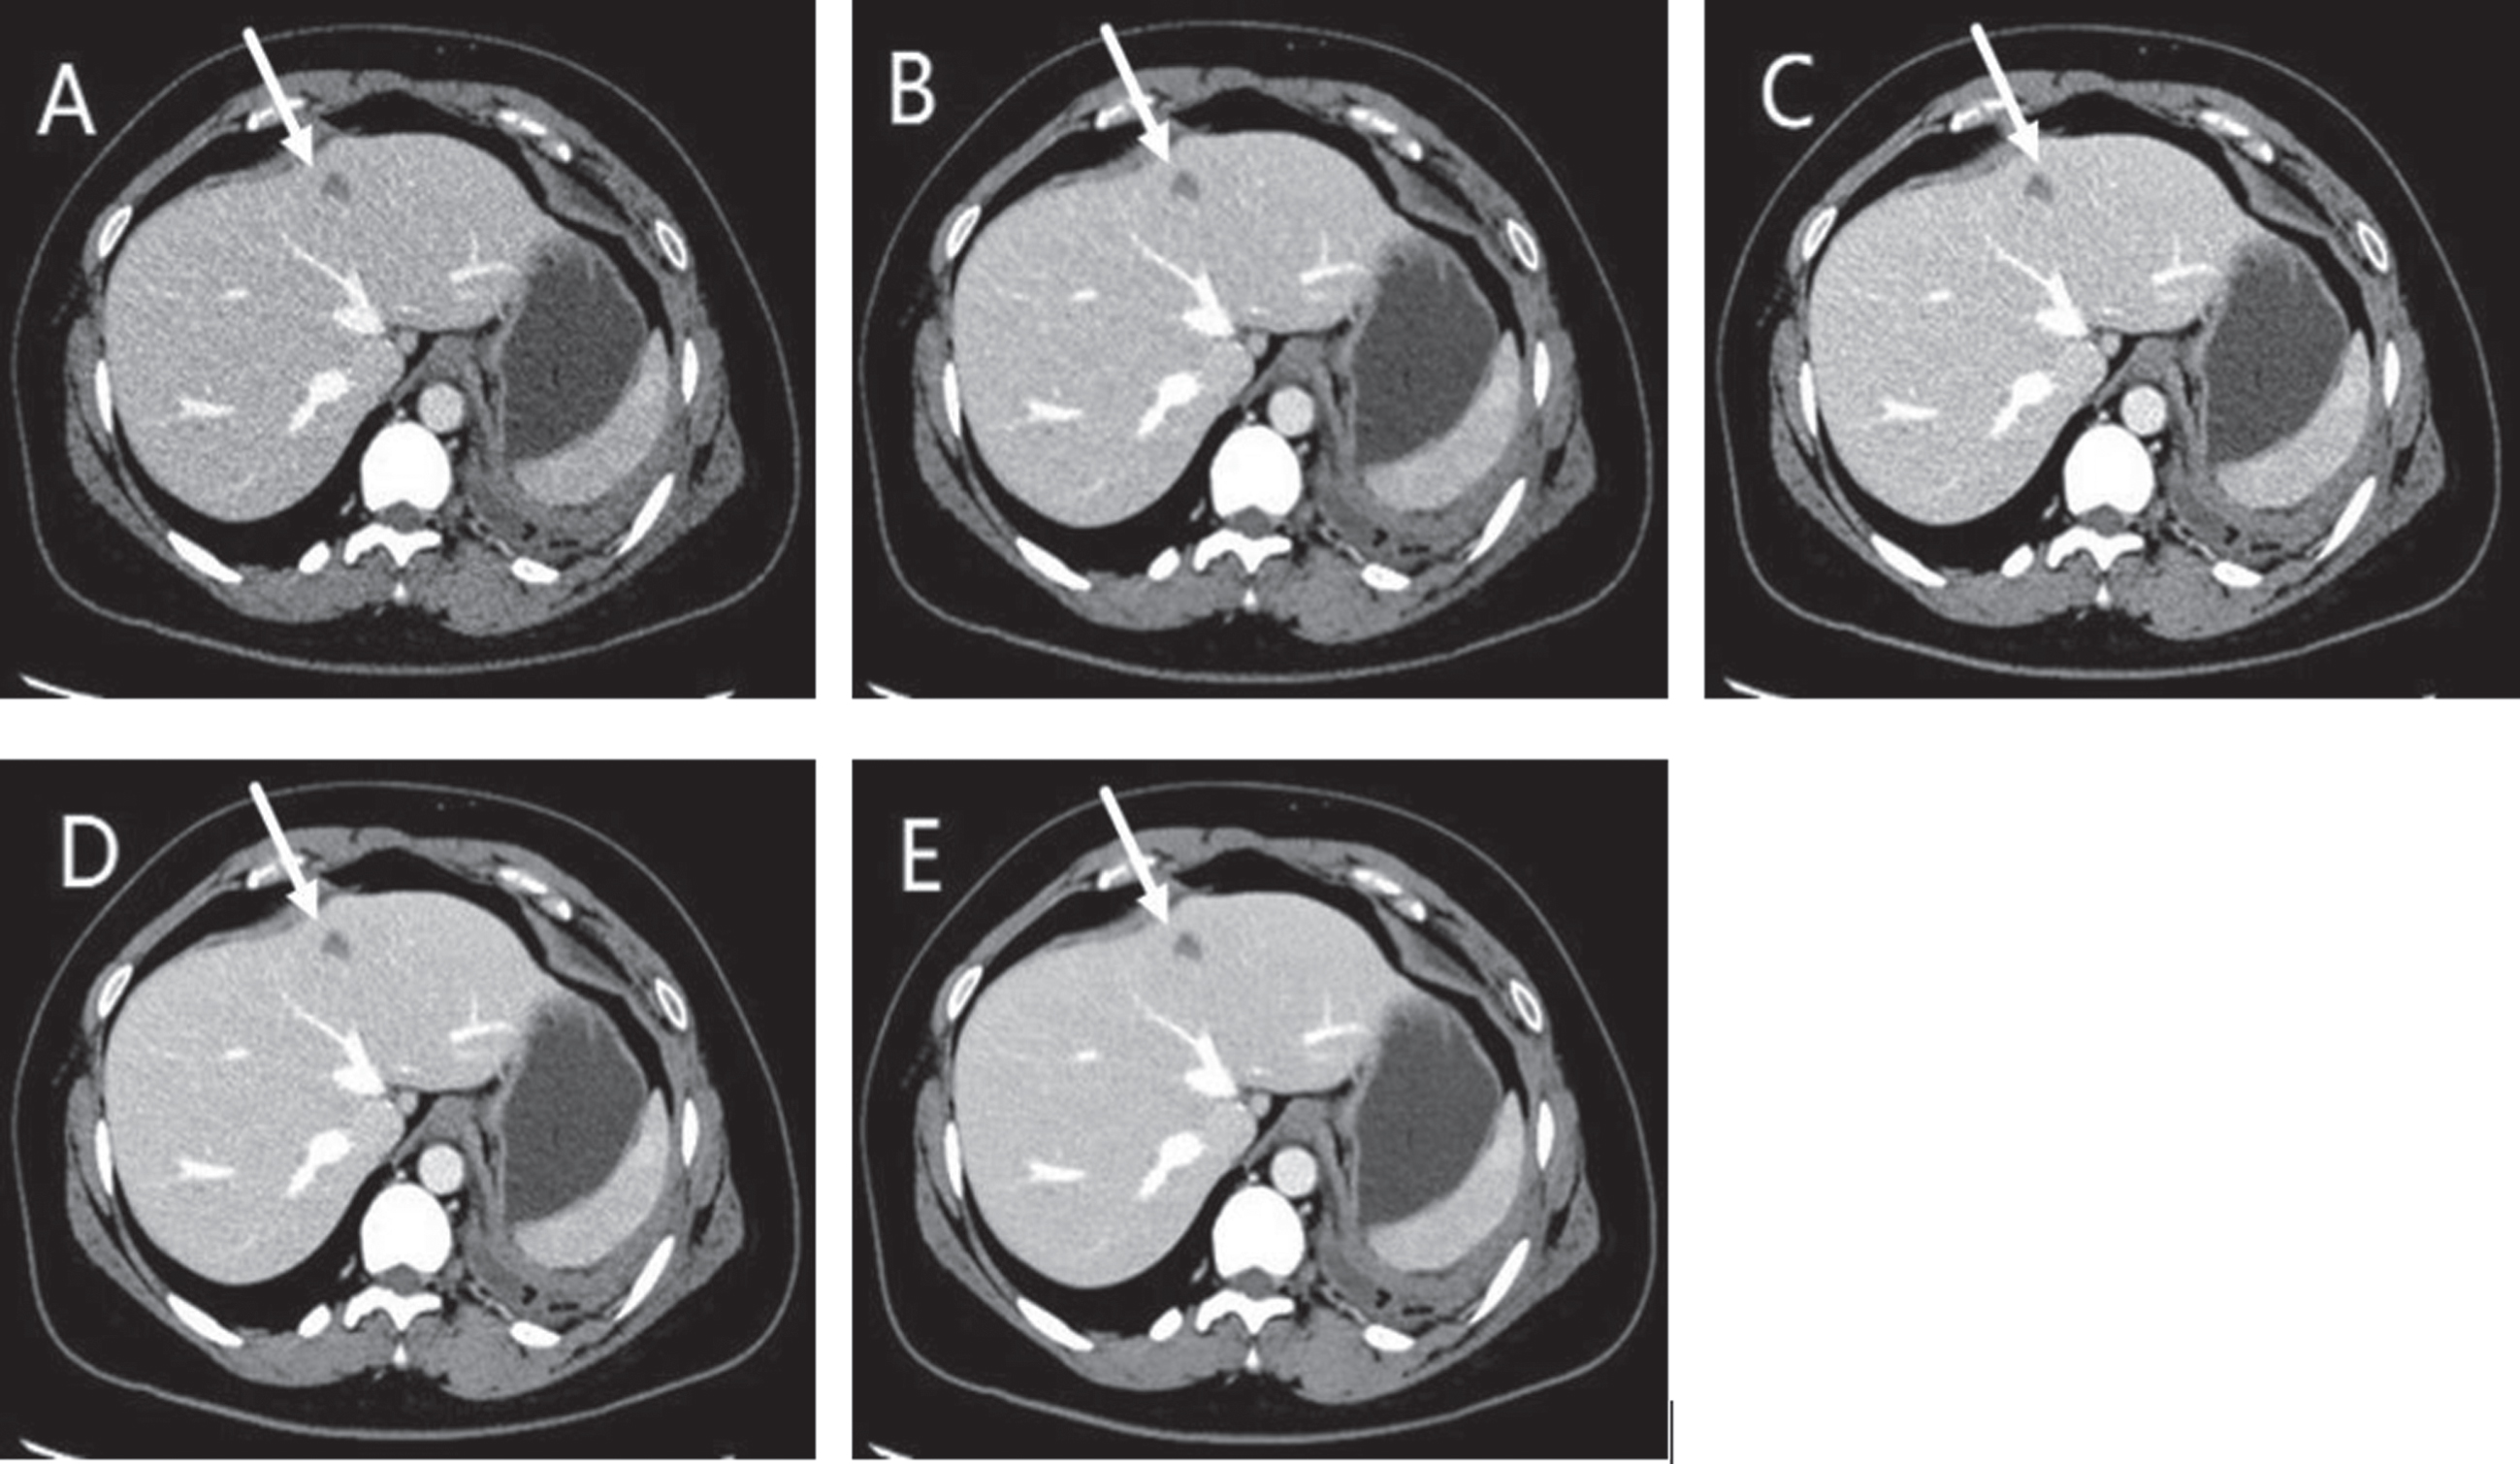
Fig. 3
A 55-year-old female with liver cysts (arrows) showed on d ASIR-V 30 (AV-30) (A), ASIR-V 70 (AV-70) (B), DLIR-low (DL-L) (C), DLIR-medium (DL-M) (D), DLIR-high (DL-H) (E). As the strength of DLIR increased, image noise was gradually reduced, but not that of the other parameters. DL-M and DL-H provided better image quality than ASIR-V in term of overall score, which was mainly due to the lower image noise.
Unlike ASIR-V, which is based on the IR technique and can present unnatural appearances in high-blending percentages [5], DLIR is a new image reconstruction technology that uses deep learning algorithms based on DNNs. With the help of calculating millions of image quality parameters using deep learning allows such algorithm to intelligently identify image noise and signal. Recent studies of the application of DLIR to abdominal samples have shown that compared to AV-30, DLIR could significantly reduce image noise, and thus, yield superior image qualities [14–18]. Those data are also consistent with our results. As is well-known, as the blending percentage increases, significant image noise reductions are observed in ASIR-V [5, 6, 19]. Previous studies showed that 60%to 70%ASIR-V algorithm could present better visual image quality in liver examination [5]. In this study, we simultaneously evaluated the image quality between AV-70 and DLIR. Our results showed that AV-70 was similar to DL-M according to image noise, but was still worse than DL-H. A gradual statistically reduction in the objective and subjective noise was observed as the strength of DLIRs increased in pairwise comparisons. These results suggested that DLIR especially DL-H could significantly reduce image noise in liver CT images.
Noise reduction could benefit the interpretation of CT images, but image noise alone cannot explain whether images were more suitable for clinical application. Therefore, we also evaluated the differences in terms of CNR, hepatic-vein clarity, and lesion-clarity relative liver parenchyma among the five reconstruction algorithms. We hypothesized that good performance in these parameters were important for the improvement of lesions detection. Our results showed that compared to AV-30, DL-M and DL-H were superior in regards to above parameters. However, compared to AV-70, there was no significant difference between AV-70, DL-M, and DL-H in the CNR or lesion-clarity score. Previous studies reported that DL-H rendered small lesions blurred; thus, leading to missed diagnoses of small lesions [14, 15]. In our study, we mainly evaluated the index lesion, and our readers also observed blurring appearance in DL-H especially for weakly enhanced lesions (Fig. 4). In our data, DL-M had a higher lesion-clarity score than AV-70 and DL-H, but this finding was not statistically significant (lesion-clarity score, 4.26±0.85 vs 3.62±1.01 vs 3.57±1.35, all P > 0.05).
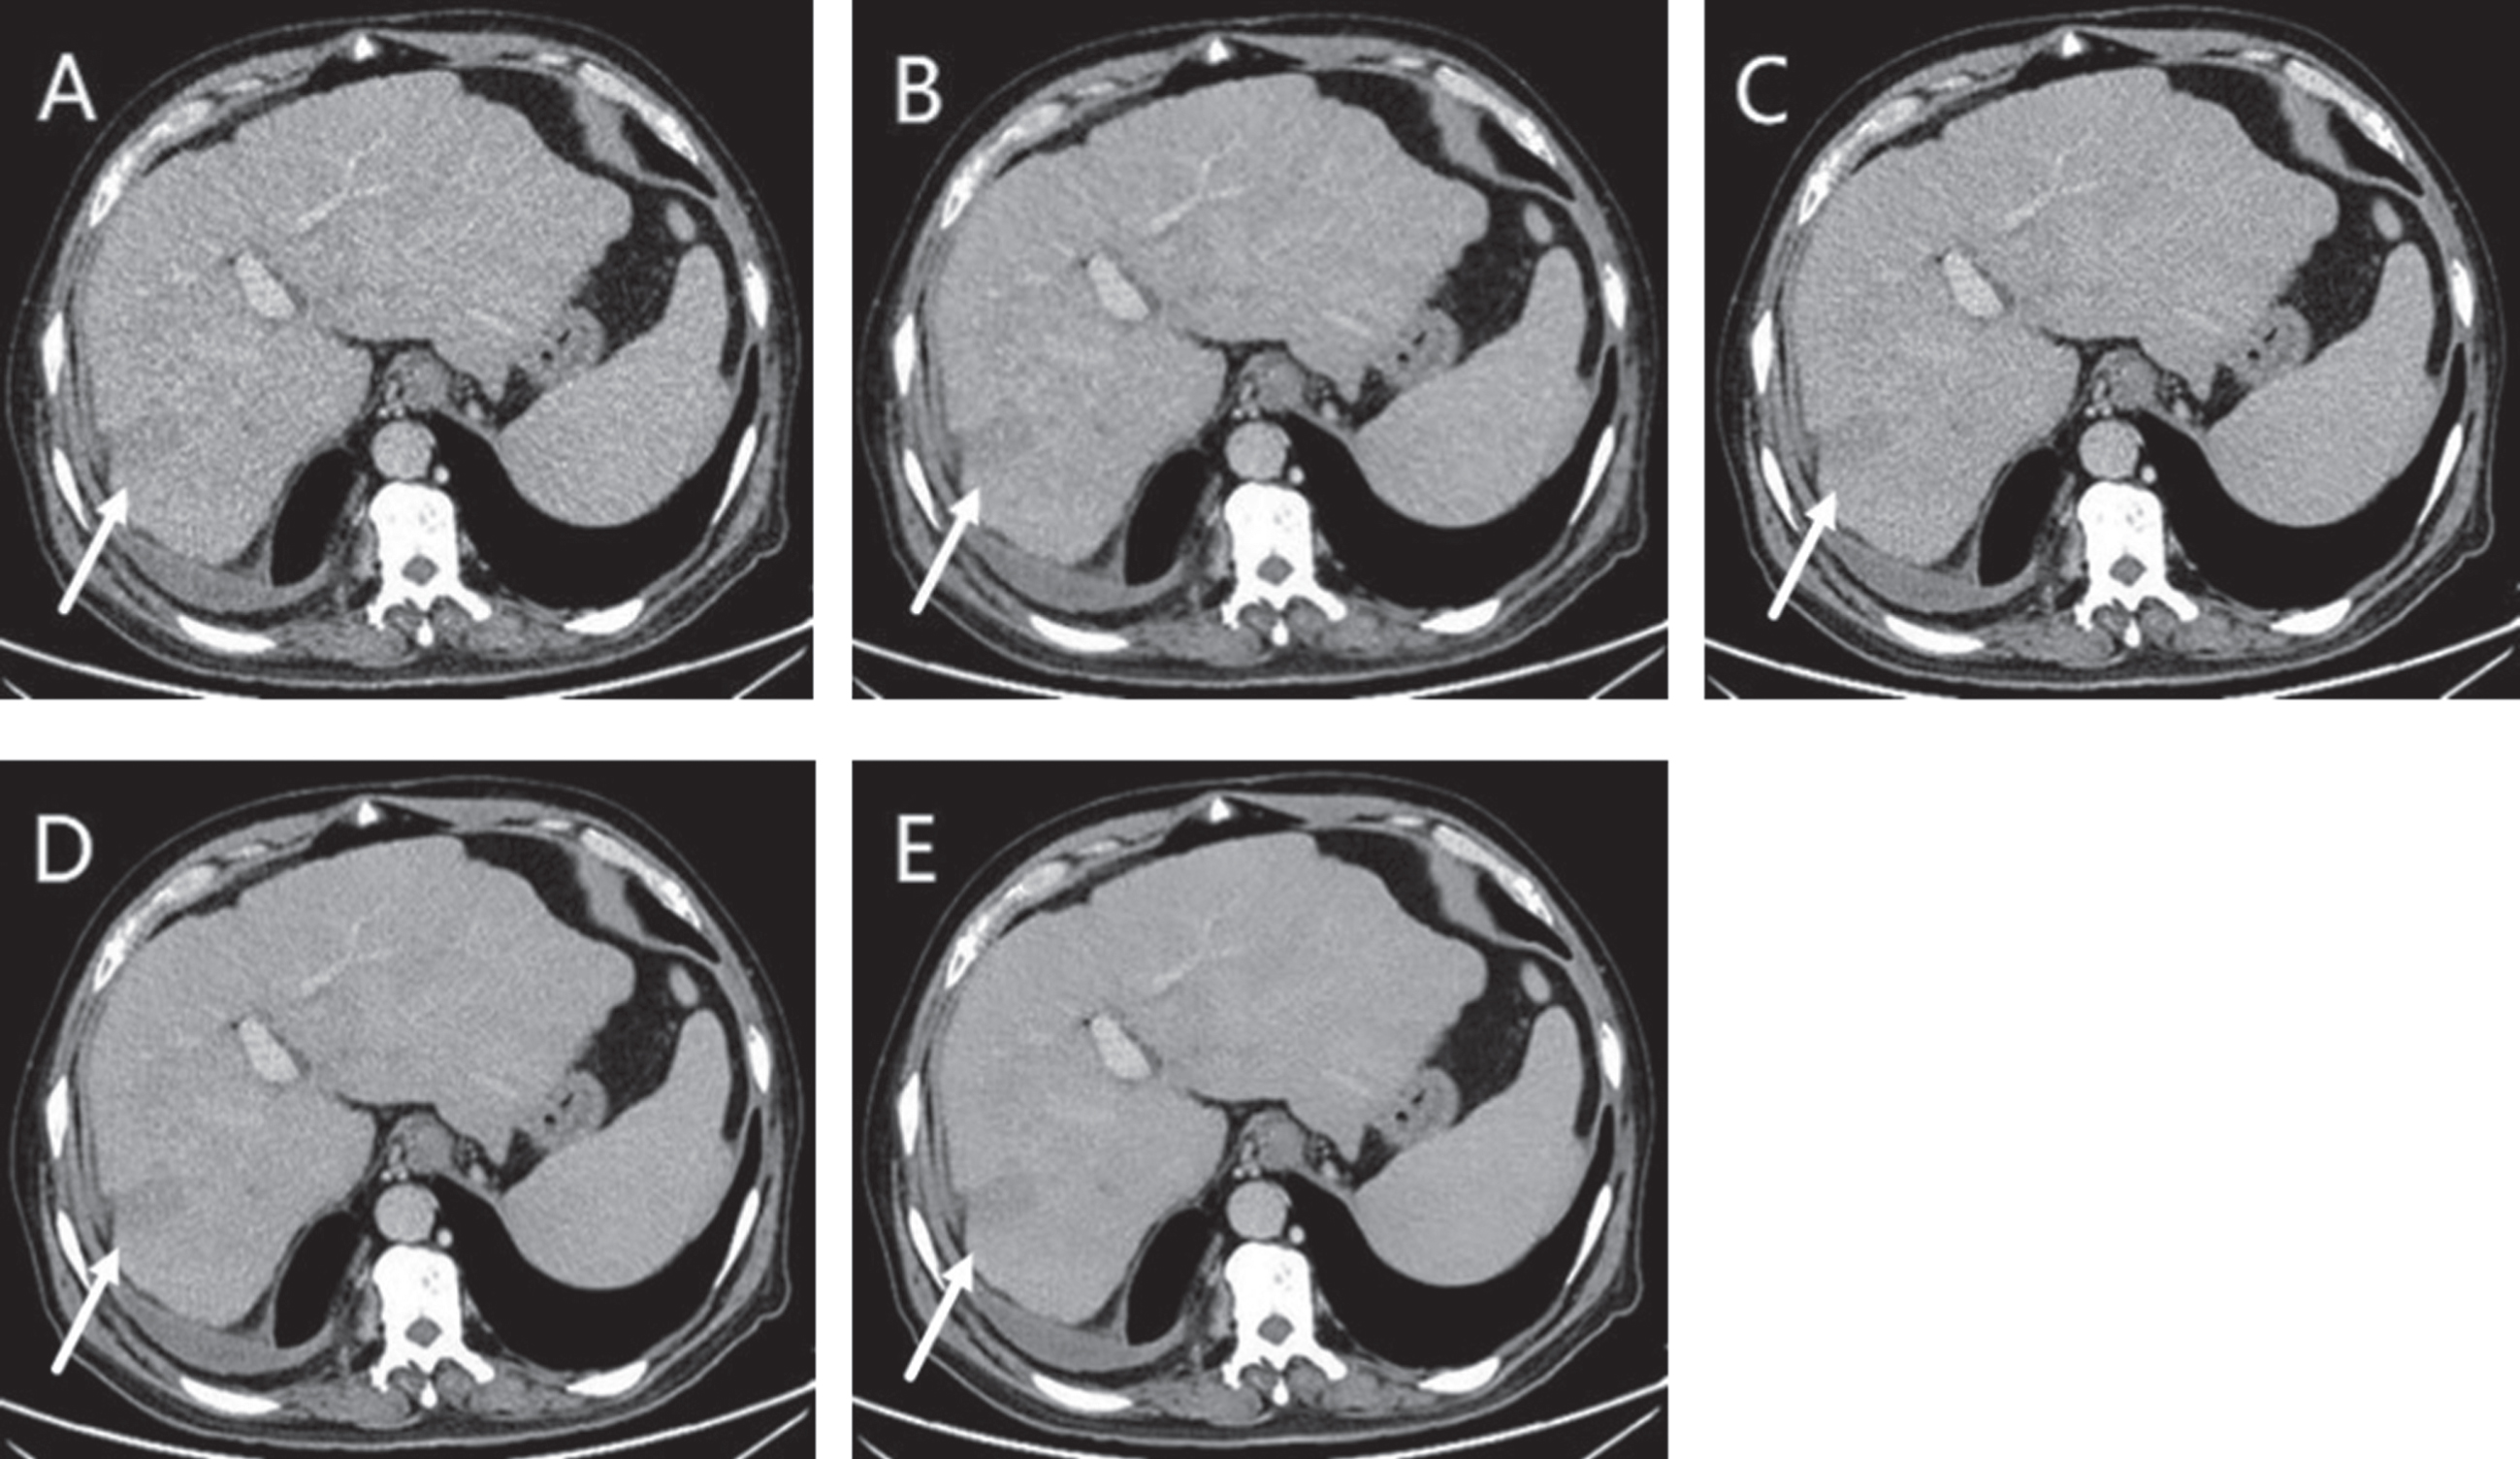
Fig. 4
A 65-year-old male with liver metastases with weakly enhancement (arrows) showed on ASIR-V 30 (AV-30) (A), ASIR-V 70 (AV-70) (B), DLIR-low (DL-L) (C), DLIR-medium (DL-M) (D), DLIR-high (DL-H) (E). DL-M and DL-H provided better visual image quality, which was mainly due to lower image noise. DL-M even had better lesion-clarity than DL-H because of the blurring observed in DLIR-high reconstructions.
When we combined the four subjective parameters to calculate an overall quality score, we found that DL-H and DL-M were both superior to AV-30 and AV-70. However, there was no statistically difference between DL-M and DL-H. This finding was precisely due to the higher noise score, but lower vein-clarity score and lesion-clarity score in DL-H.
Up to now, fewer studies have discussed the clinical value of the algorithm in abdominal imaging from the perspective of lesions detection rate. To preliminary verify this application, we used MRI examinations as the gold standard for lesions detection and evaluated the detection rate of the different reconstructions against the MRI examinations. The results revealed that all five algorithms had the same detection rate (25/45, 55.6%). The findings further revealed that DLIR did not increase the lesions detection rate compared to ASIR-V. A recent study from Dominik C regarding DLIR in coronary CT angiography also found no significant improvement in the diagnostic accuracy compared to AV-30 [20]. The reason why the lesion detection rate was not improved may lie in that the revolution CT and ASIR-V algorithm already have high clinical diagnostic accuracy under routine dose CT. We believe that the advantage of DLIR algorithm may be reflected in the potential to further reduce CT scanning dose on the premise of ensuring image quality, which is of great clinical significance. In the future, with the accumulation of data, we will further explore the clinical application value of DLIR algorithm in low-dose CT scanning while improving the content of the accuracy of lesion diagnosis.
Our study has several limitations. First, as a retrospective, single-center study, our study included only a few patients (19.0%, 8/42) that underwent both CT and MRI examinations. This was mainly because the cases enrolled in this study were all patients who were suspected of liver tumors for the first time. Most of the patients detected no tumor lesion or detected lesions of clear qualitative diagnosis after CT examination. Larger-scale multicenter trials are necessary to evaluate the accuracy and replicability of the results. Second, as a preliminary discussion on the efficacy of DLIR algorithm in accuracy of lesions detection, only lesions detection rate was evaluated in this study but not evaluated diagnostic sensitivity and specificity. Further studies are needed to increase the credibility of this part. Third, we only assess different reconstructed images under routine dose. We did not know whether the results would also apply to low dose images or even present better clinical value. The evaluation of DLIR on low dose images need to be evaluated in the future.
In summary, compared to AV-30 and AV-70, DL-H provided superior image performance because of the lower image noise on the premise of ensuring the accuracy of lesion detection under routine dose. We believe that DLIR algorithm has the potential to further reduce CT scanning dose, which is of great clinical significance. We will explore if low-dose DLIR can achieve better image quality than routine-dose ASIR-V while improving the content of the accuracy of lesion diagnosis with the accumulation of data in the future.
Funding
Nil
Conflict of interest
The authors declare that they have no conflict of interest.
References
[1] | Brenner D.J. and Hall E.J. Computed tomography –an increasing source of radiation exposure, N Engl J Med 357: (22) ((2007) ), 277–2284. |
[2] | Moreno C.C. , Hemingway J. , Johnson A.C. et al., Changing abdominal imaging utilization patterns: Perspectives from Medicare beneficiaries over two decades, J Am Coll Radiol 13: (8) ((2016) ), 894–903. |
[3] | Booij R. , Budde R.P.J. , Dijkshoorn M.L. et al., Technological developments of X-ray computed tomography over half a century: User’s influence on protocol optimization, Eur J Radiol 131: (2020), 109261. |
[4] | Mileto A. , Guimaraes L.S. , McCollough C.H. et al., State of the art in abdominal CT: The limits of iterative reconstruction algorithms, Radiology 293: (3) ((2019) ), 491–503. |
[5] | Chen L.H. , Jin C. , Li J.Y. et al., Image quality comparison of two adaptive statistical iterative reconstruction (ASiR, ASiR-V) algorithms and filtered back projection in routine liver CT, Br J Radiol 91: (1088) ((2018) ), 20170655. |
[6] | Hardie A.D. , Nelson R.M. , Egbert R. et al., What is the preferred strength setting of the inogram-affirmed iterative reconstruction algorithm in abdominal CT imaging, Radiol Phys Technol 8: (1) ((2015) ), 60–63. |
[7] | Matenine D. , Schmittbuhl M. , Bedwani S.P. , et al., Iterative reconstruction for image enhancement and dose reduction in diagnostic cone beam CT imaging, J Xray Sci Technol 27: (5) ((2019) ), 805–819. |
[8] | Fält T. , Söderberg M. , Hörberg L. et al., Simulated dose reduction for abdominal CT with filtered back projection technique: Effect on liver lesion detection and characterization, AJR Am J Roentgenol 212: (1) ((2019) ), 84–93. |
[9] | Baker M.E. , Dong F. , Primark A. et al., Contrast-to-noise ratio and low-contrast object resolution on full- and low-dose MDCT: SAFIRE versus filtered back projection in a low-contrast object phantom and in the liver, AJR Am J Roentgenol 199: (1) ((2012) ), 8–18. |
[10] | Chartrand G. , Cheng P.M. , Vorontsov E. et al., Deep learning: A primer for radiologists, Radiographics 37: (7) ((2017) ), 2113–2131. |
[11] | Kambadakone A. Artificial intelligence and CT image reconstruction: Potential of a new era in radiation dose reduction, J Am Coll Radiol 17: (5) ((2020) ), 649–651. |
[12] | Kordolaimi S.D. , Argentos S. , Pantos L. et al., A new era in computed tomographic dose optimization: the impact of iterative reconstruction on image quality and radiation dose, J Comput Assist Tomogr 37: (6) ((2013) ), 924–931. |
[13] | Cunha G.M. , Fowler K.J. et al., Imaging diagnosis of hepatocellular carcinoma: The liver imaging reporting and data system, why and how, Clin Liver Dis 24: (4) ((2020) ), 623–636. |
[14] | Cao L. , Liu X. , Li J.Y. et al., A study of using a deep learning image reconstruction to improve the image quality of extremely low-dose contrast-enhanced abdominal CT for patients with hepatic lesions, Br J Radiol 94: (1118) ((2021) ), 20201086. |
[15] | Li L. , Wang H. , Song J. et al., A feasibility study of realizing low-dose abdominal CT using deep learning image reconstruction algorithm, J Xray Sci Technol 29: (2) ((2021) ), 361–372. |
[16] | Jensen C.T. , Liu X.M. , Tamm E.P. et al., Image quality assessment of abdominal CT by use of new deep learning Image reconstruction: Initial experience, AJR Am J Roentgenol 215: (1) ((2020) ), 50–57. |
[17] | Greffier J. , Hamard A. , Pereira F. et al., Image quality and dose reduction opportunity of deep learning image reconstruction algorithm for CT: a phantom study, Eur Radiol 30: (7) ((2020) ), 3951–3959. |
[18] | Akagi M. , Nakamura Y. , Higaki T. et al., Deep learning reconstruction improves image quality of abdominal ultra-high-resolution CT, Eur Radiol 29: (8) ((2019) ), 6163–6171. |
[19] | Kwon H. , Cho J. , Oh J. et al., The adaptive statistical iterative reconstruction-V technique for radiation dose reduction in abdominal CT: comparison with the adaptive statistical iterative reconstruction technique, Br J Radiol 88: (1054) ((2015) ), 20150463. |
[20] | Benz D.C. , Benetos G. , Rampidis G. et al., Validation of deep-learning image reconstruction for coronary computed tomography angiography: Impact on noise, image quality and diagnostic accuracy, J Cardiovasc Comput Tomogr 14: (5) ((2020) ), 444–451. |


