
Longitudinal changes of laboratory measurements after discharged from hospital in 268 COVID-19 pneumonia patients
Abstract
BACKGROUND AND OBJECTIVE:
Monitoring recovery process of coronavirus disease 2019 (COVID-19) patients released from hospital is crucial for exploring residual effects of COVID-19 and beneficial for clinical care. In this study, a comprehensive analysis was carried out to clarify residual effects of COVID-19 on hospital discharged patients.
METHODS:
Two hundred sixty-eight cases with laboratory measured data at hospital discharge record and five follow-up visits were retrospectively collected to carry out statistical data analysis comprehensively, which includes multiple statistical methods (e.g., chi-square, T-test and regression) used in this study.
RESULTS:
Study found that 13 of 21 hematologic parameters in laboratory measured dataset and volume ratio of right lung lesions on CT images highly associated with COVID-19. Moderate patients had statistically significant lower neutrophils than mild and severe patients after hospital discharge, which is probably caused by more efforts on severe patients and slightly neglection of moderate patients. COVID-19 has residual effects on neutrophil-to-lymphocyte ratio (NLR) of patients who have hypertension or chronic obstructive pulmonary disease (COPD). After released from hospital, female showed better performance in T lymphocytes subset cells, especially T helper lymphocyte% (16% higher than male). According to this sex-based differentiation of COVID-19, male should be recommended to take clinical test more frequently to monitor recovery of immune system. Patients over 60 years old showed unstable recovery process of immune cells (e.g., CD45 + lymphocyte) within 75 days after discharge requiring longer clinical care. Additionally, right lung was vulnerable to COVID-19 and required more time to recover than left lung.
CONCLUSIONS:
Criterion of hospital discharge and strategy of clinical care should be flexible in different cases due to residual effects of COVID-19, which depend on several impact factors. Revealing remaining effects of COVID-19 is an effective way to eliminate disorder of mental health caused by COVID-19 infection.
1Introduction
Currently, the novel coronavirus disease 2019 (COVID-19) is still pandemic all around the world, and severe acute respiratory syndrome coronavirus 2 pandemic affect clinical treatment and research in all facets deeply [1, 2]. At the beginning of COVID-19, a lot of research were implemented based on both Computed Tomography (CT) and Digital Radiography (DR) image data. Y. Wang et al. [3] found that different lung CT manifestations changes in a specific pattern temporally and it could be considered as an indicator of disease progression. With the research of COVID-19 ongoing, various data like routine blood parameters were included in analysis. Both F. Zeng et al. [4] and F. Ok et al. [5] used routine blood parameters to explore the relationship between blood components and severity of COVID-19. These two research activities divided patients into severe and non-severe groups and found higher white blood cells (WBC), neutrophils and neutrophil-to-lymphocyte ratio (NLR) in severe group and greater counts of lymphocytes in non-severe group. Moreover, according to D. Ferrari et al. [6], aspartate aminotransferase (AST) and Lactate dehydrogenase (LDH) could assist in identifying potential COVID-19 patients. Being equipped with short turnaround time and excluding radioactivity, it is of clinical significance to trace and monitor process of diagnosis with dynamic changes of routine blood parameters [7]. Different hematologic parameters require different lengths of time to resume. Approximately, eosinophils required 12 days to recovery which is earlier than others and could be considered as judgment indicator of treatment progress [7]. Aside from routine laboratory indicators, abnormal immune-related index such as interleukin (IL)-2 and IL-4 had higher frequency in critically severe patients than severe and moderate patients [8]. Lymphopenia and eosinopenia could have function of judging disease severity and progression [9]. As for T-lymphocyte subsets, severe patients had higher proportion of CD4 + T cells than those of moderate patients [9, 10]. Some machine learning classification models were implemented by D. Brinati et al. [11], with routine blood test data as input to predict whether patients were infected.
In the post-pandemic era, the number of discharged patients kept increasing. It must be noted that continuous monitoring and precautionary measures are still necessary, even the patient has been discharged from the hospital [12]. Most research on COVID-19 focused on diagnosing and therapy evaluation, but few focused on follow-up studying of patients after discharge. Even if there are, follow-up studies published in the past have a small sample size and a short time span, usually 3 months after discharge. Follow-up after healing is of great significance to the overall revealing of the occurrence, development and outcome of the COVID-19 and understanding of its mechanism. Inspired by former researchers, routine laboratory indicators were analyzed to explore whether COVID-19 still has effects on discharged patients continuously. COVID-19 was found has property of side-preference on lung lesions during hospitalization [13]. Besides, discharged criterion did not require completely absorption of lesions. Hence it is also valuable for clinical research to analyze absorption process indicated by decreasing of lung lesions volumes on CT images which were calculated by our well-trained deep learning neural network model [14].
This research was carried out to clarify continuous effects of COVID-19 on hospital discharged patients and provide some suggestions for clinicians to promote clinical treatment and care. A total number of 268 cases with laboratory measured data at hospital discharge date and five follow-up visits were retrospectively collected to carry out statistical analysis comprehensively. The time span of the data used is longer than six months which is long enough to make conclusion of this study reliable and convictive. We implemented a comprehensive analysis with dividing patients into groups respectively according to age, gender, severity, underlying diseases and so on. 21 hematologic indicators and lung lesions in CT images were analyzed in very detail and meaningful findings are displayed in this article. Herein, a longitudinal comparison experiment of changes in hematologic indicators and lungs lesions were performed.
2Materials and methods
This study was approved by our institutional review board, and the written informed consent for this study was waived for the data was collected and analyzed anonymously without any potential risks to patients.
2.1Patients
This study was conducted with 268 COVID-19 pneumonia patients who had been confirmed with positive nucleic acid and discharged from the hospital between 30 Jan. and 6 Aug. of 2020. Demographic information is provided in the Table 1, and most of those patients (76.9%) are not elderly (younger than 60 years old). Moreover, the ratio of female to male is 1.39 which means the distribution of gender is not unbalanced enabling the reasonability of further analysis between men and women.
Table 1
Clinical characteristics of COVID-19 patients include in this study
| Discharge patients (268) | |
| Age | |
| mean | 45.34±15.43 |
| min, max | 14, 82 |
| < = 30 | 53 |
| 30–60 | 153 |
| > = 60 | 62 |
| Sex | |
| Male | 112 |
| Female | 156 |
| Underlying diseases | |
| Hypertension | 47 |
| Diabetes mellitus | 17 |
| Cardiovascular disease | 4 |
| COPD | 1 |
| Symptom (before discharge) | |
| Fever | 182 |
| Cough | 137 |
| Chills | 45 |
| Respiratory | 15 |
| Expectoration | 57 |
| Digestive | 8 |
| Severity (before discharge) | |
| Mild type | 18 |
| Moderate type | 222 |
| Severe | 28 |
2.2Routine blood indicators
The dataset consists of 21 clinical routine blood indicators such as C-reactive protein (CRP), WBC, neutrophil, lymphocyte, monocytes, IL-6 and so on. These 21 indicators are summarized in Table 2, as well as normal value ranges of each indicator. The columns from discharge to follow-up 5 represent statistic values (mean±standard deviation) of that hematologic parameter (row) at discharge and 5 follow-up visits. Patients took blood test of these 21 indicators about to be discharge and required to take the test continuously six times after discharge. Theoretically, datasets should have 147 (21*7) blood indicators in total. Otherwise, hospital visits are not compulsory resulting in that not all patients underwent a complete blood test in each visit. Even worse, only one (0.37%) patient took blood test in the sixth visit which was not used in analysis due to lack of data. Although some patients did not participate the whole 6 follow up visits, research on this dataset is still meaningful due to long time span of follow up visits and competitive number of patients.
Table 2
Statistic values of routine blood parameters in each stage and its normal range
| Parameters | Discharge | Follow-up 1 | Follow-up 2 | Follow-up 3 | Follow-up 4 | Follow-up 5 | Normal range |
| C-reactive protein (mg/L) | 5.96±7.23 | 5.42±3.27 | 5.23±3.39 | 4.94±0.4 | 5.03±0.69 | 5±0 | < 10 |
| White blood cells (10∧9/L) | 5.66±1.66 | 5.80±1.44 | 5.75±1.53 | 5.7±1.42 | 5.66±1.36 | 5±1.1 | 3.5-9.5 |
| Neutrophils (10∧9/L) | 3.31±1.43 | 3.4±1.1 | 3.34±1.11 | 3.27±1.0 | 3.25±1.12 | 2.76±0.75 | 1.8–6.3 |
| Lymphocytes (10∧9/L) | 1.77±0.57 | 1.81±0.53 | 1.84±0.58 | 1.87±0.5 | 1.88±0.48 | 1.79±0.49 | 1.1–3.2 |
| Monocytes (10∧9/L) | 0.40±0.12 | 0.38±0.12 | 0.36±0.12 | 0.35±0.1 | 0.34±0.11 | 0.29±0.09 | 0.1–3.6 |
| Eosinophils (10∧9/L) | 0.14±0.12 | 0.17±0.14 | 0.18±0.18 | 0.18±0.27 | 0.14±0.11 | 0.14±0.05 | 0.02–0.52 |
| Basophils (10∧9/L) | 0.03±0.02 | 0.03±0.02 | 0.03±0.02 | 0.03±0.02 | 0.03±0.02 | 0.03±0.01 | 0–0.06 |
| Creatine kinase (U/L) | 56.17±28.53 | 69.53±42.32 | 128.36±518.18 | 99.31±111.94 | 103.39±67.41 | 73.71±22.86 | 40–200 |
| Lactate dehydrogenase(U/L) | 174.78±51.83 | 175.17±49.97 | 170.36±42.58 | 174.64±37.73 | 173.65±33.43 | 152.57±31.31 | 120–250 |
| CK-MB isoenzyme (U/L) | 10.54±5.09 | 12.36±17.64 | 11.66±6.05 | 12.32±4.21 | 13.81±7.98 | 152.57±31.31 | 0–24 |
| CD45 + lymphocyte count | 1547.33±420.24 | 1617.77±487.81 | 1697.27±583.00 | 1752.61±533.16 | 1808.93±442.04 | 1824.71±641.86 | 1488–4483 |
| Absolute value of T lymphocytes | 1127.53±348.28 | 1180.63±423.56 | 1156.81±418.31 | 1200.41±395.01 | 1229.87±363.1 | 1234.86±501.9 | 955–2860 |
| T lymphocyte% | 71.7±8.21 | 71.33±7.59 | 69.83±8.6 | 68.31±9.06 | 67.94±9.57 | 67.43±6.60 | 50–84 |
| T helper lymphocyte absolute count | 639.46±239.98 | 642.46±237.43 | 637.50±220.91 | 643.53±233.06 | 646.94±197.08 | 693.29±267.45 | 550–1440 |
| T helper lymphocyte% | 41.25±8.42 | 39.39±7.32 | 38.88±7.35 | 36.74±8.30 | 35.91±7.88 | 38.29±6.4 | 26–61 |
| T suppress lymphocyte absolute count | 421.95±183.94 | 462.88±220.01 | 452.38±232.34 | 480.7±214.11 | 494.51±223.72 | 453.71±216.77 | 320–1250 |
| T inhibit lymphocyte% | 29.39±24.39 | 30.54±29.20 | 27.99±15.85 | 27.28±8.19 | 26.91±8.31 | 24.14±3.93 | 15–44 |
| CD3 + CD4 + CD8 + lymphocyte count | 10.89±20.46 | 9.49±7.13 | 10.37±10.86 | 9.14±9.22 | 8.82±7.61 | 4.86±3.13 | – |
| CD3 + CD4 + CD8 + /CD45+ | 0.63±0.98 | 0.52±0.73 | 0.53±0.65 | 0.42±0.66 | 0.39±0.60 | 0±0 | – |
| T helper/suppressor lymphocytes (CD4 + /CD8+) | 1.61±0.71 | 14.87±118.27 | 1.57±0.64 | 1.49±0.63 | 1.49±0.62 | 1.63±0.48 | 1.4–2.0 |
| Interleukin(IL)-6(pg/ml) | 4.71±5.74 | 4.71±11.91 | 2.47±5.37 | 1.55±1.98 | 0.92±0.48 | 1.06±0.83 | 0–7 |
Of note, except for different discharge dates of each patient, patients took follow up visits at non-uniform time leading to different time intervals between any two examinations. As a result, 102 (38.06%) patients participated in the first visit within 7 days and half of patients finished their first visit within two weeks after discharge. The time intervals between discharge date and first visit date variates from 1 day to 116 days with standard deviation equaling 17.37 days. Similar are the other follow up visits. Hence, it will probably introduce time bias if dynamic changes of routine blood parameters and ratios of lesions volumes are analyzed directly.
2.3Volume ratio of lesion for left and right lungs in CT images
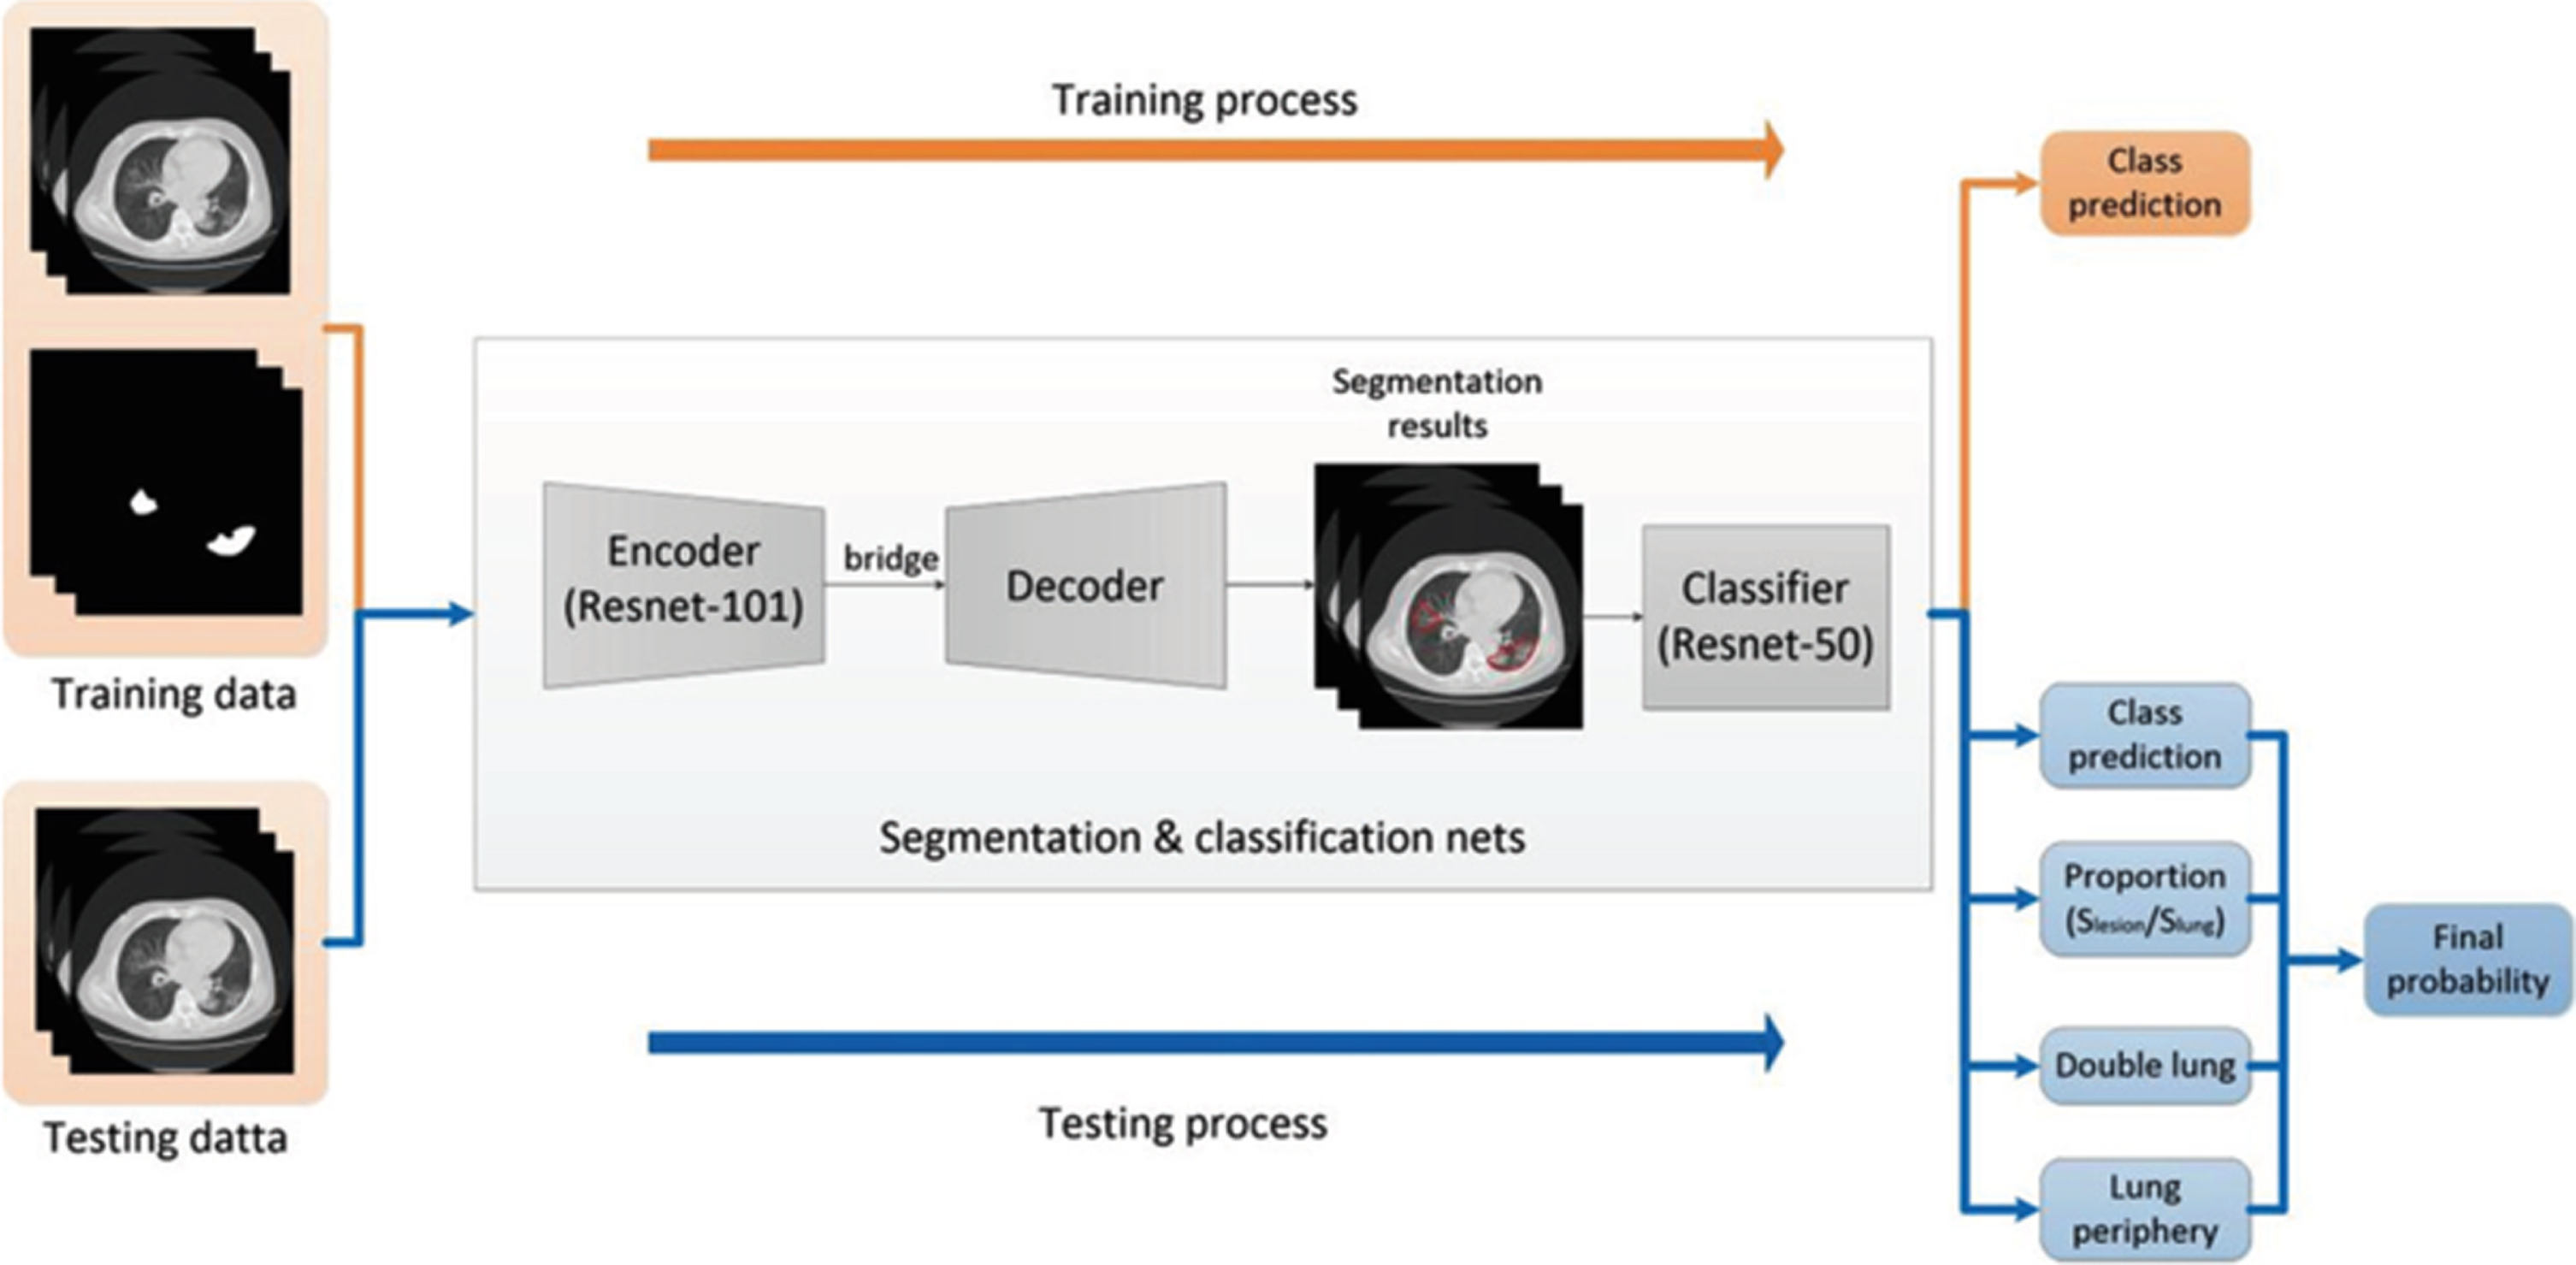
With aim of measuring effects of COVID-19 on cured people multimodally, CT images of these patients’ lungs were also included in analysis. In previous work of our team [14], a ResUNet network model was developed to assist radiologists in distinguishing COVID-19 infected pneumonia patients from other pulmonary infections on CT images (as shown in Fig. 1). That well-trained model was transferred to calculate volume of lung lesions in these CT images. Volume ratio of lesions was defined as the ratio between volumes of lesions and lungs. According to one of the criterions for hospital discharged, pulmonary images of patients must show obvious absorption of inflammation. Inspired by the criterion, these data were used to analyze process of absorbing after hospital discharge.
Fig. 1
A flow diagram of ResUNet network to process and analyze CT images.
2.4Statistical analysis
T-test was implemented and 0.05 was chosen as the threshold to indicate statistically significant difference (P value). The statistical analysis was carried out with Python 3.8.1 in MacOS 10.15.3. Due to the fact that sample size used in this study might not be equal, an adapted two-tailed and unequal variances t-test was chosen to be implemented actually. Moreover, chi-square was also used for binary feature.
2.5Normalization of the time interval
As mentioned in section 2.2, these 268 patients did not take hospital follow-up visits with the same time interval and lengths of periods between each visit varied greatly, resulting in that pre-processing is necessary before analyzing dynamic changes of indicators on time series. Dates at which patients took tests were subtracted by their discharge dates to calculate time length between follow-up visits and discharge. The longest time length is 186 days and 25 days was chosen as threshold to form 8 durations ([0,25], [25,50], . . ., [175,200]). The measured data were rearranged into corresponding durations based on time length. Under this normalization method, it was possible that one patient took more than one routine blood test within one duration and all blood tests data were considered independently no matter whether it from the same patients. Besides that, data of these 21 indicators sometimes were recorded in string type like “< 10”, “< 5” or “< 1.25”, etc. In order to make mathematical calculation feasible, these string values were set equaling half of the number on the right of inequality sign.
3Results
3.1Linear relationship
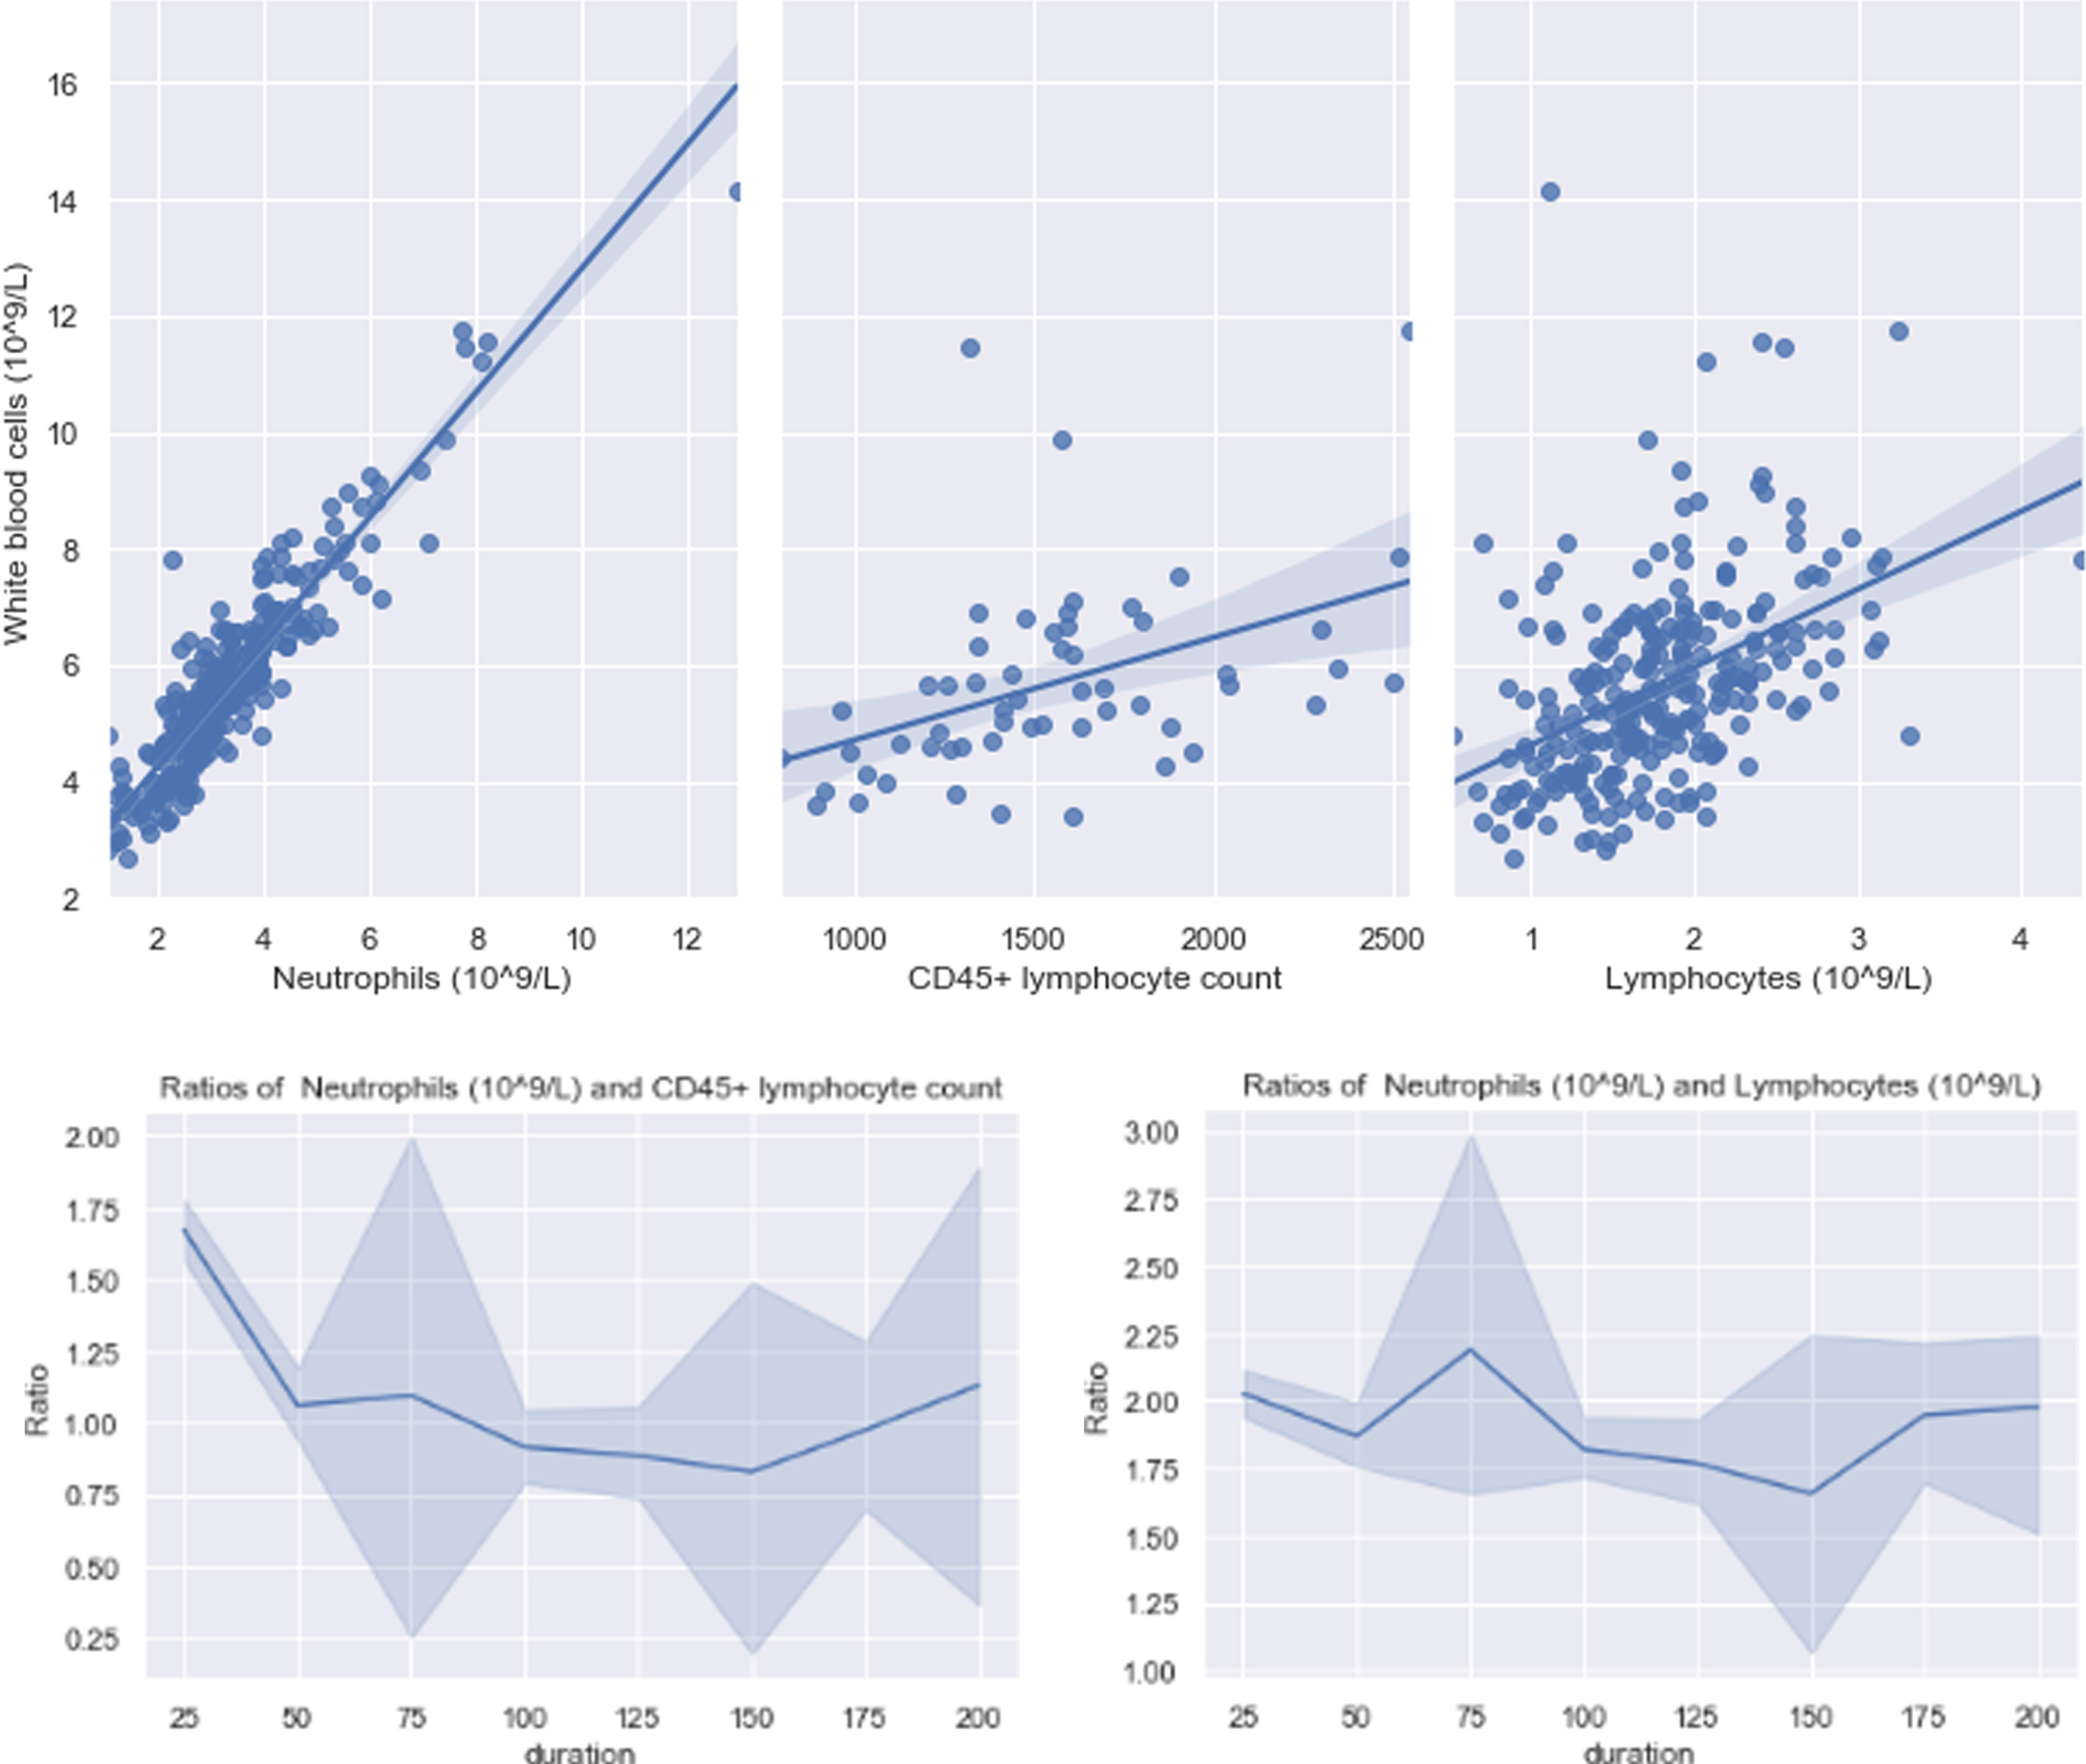
According to X. Feng et al. [15], white blood cell and neutrophils increased but lymphocyte subtypes decreased, resulting in high ratio of white blood cell to lymphocyte subtypes. Moreover, value of NLR associated with mortality was 1.05 (1.02–1.07 with 95% confidence interval) and higher NLR contributed to increasing risk of one-month mortality [16]. After healing of COVID-19, it was found that patients’ WBC could have a positive linear relationship with neutrophils, CD45 + lymphocyte count and lymphocytes. Linear regression model was trained to fit these relationships and the weights of the tuned models were 1.07, 0.0018 and 1.34 respectively which are shown in Fig. 2. Of note, weight equaling 1.07 implies that ratios of neutrophils to WBC are probably higher than 0.8 which is upper bound of the normal value range, and most white blood cells in patients’ body were neutrophils. Ratios shown in two figures at bottom of Fig. 2 were not in safety range. In other words, COVID-19 probably still has residual effects on triggering inflammation.
Fig. 2
Relationship between WBC and lymphocyte subset indicators.
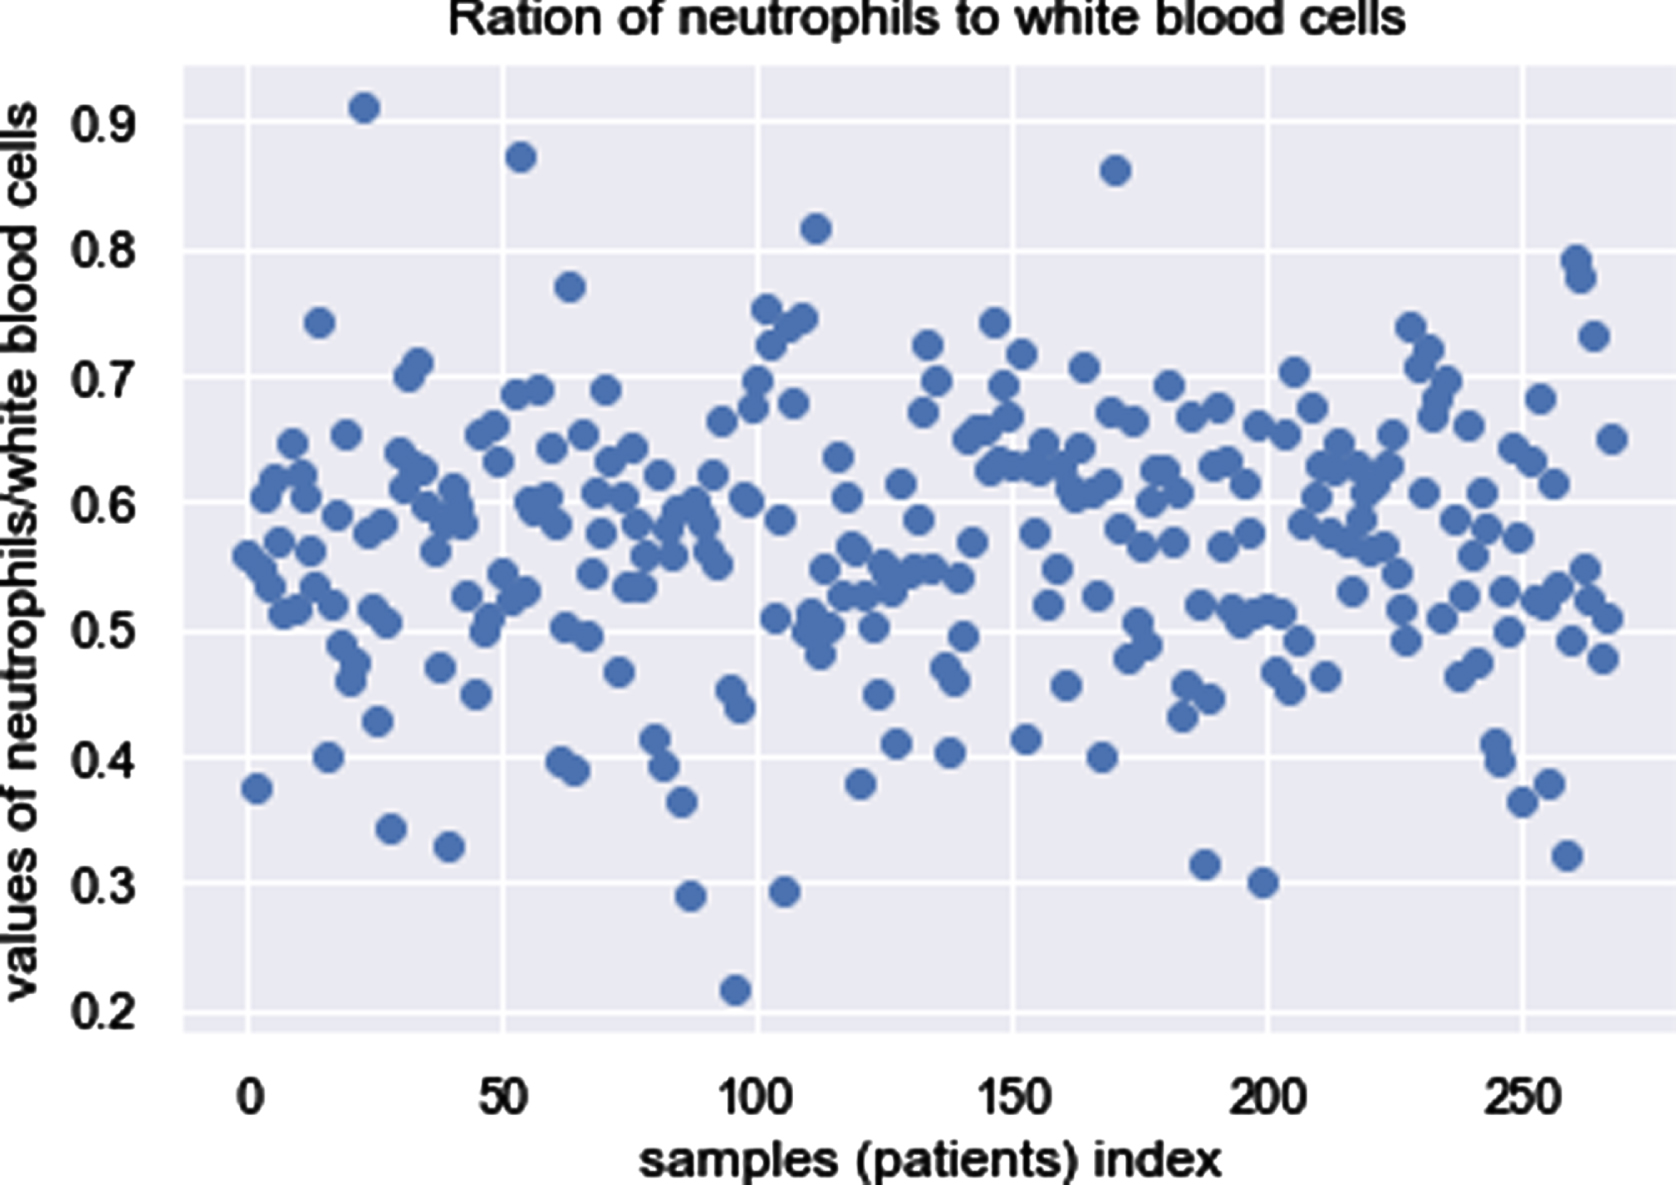
In order to evaluate the reliability of the weight, which is 1.07, the ratio of neutrophils to WBC was calculated and results are displayed in scatter below. As shown in Fig. 3, there have five patients with the ratios equaling to or larger than 0.8, indicating infection.
Fig. 3
Ratios of neutrophils to WBC.
Except exploring the relationships among indicators, analyzing hematologic parameters among sex-specific, age-specific, underlying disease-specific and severity-specific subgroups might be meaningful as well. A critical factor that played a part in susceptibility to SARS-CoV is gender [17]. Females are equipped with immune responses innately more enhanced than that of males [18]. Moreover, elderly patients having a history of hypertension are more likely to be severe COVID-19 [8]. In addition, elderly men with comorbidities are more probable to be infected COVID-19 [19]. The probability of infection, disease severity and risk of mortality were proved to be correlated with older age and diabetes [20–23].
With demographic data such as gender, age, underlying disease and severity of COVID-19 available, datasets were grouped by these features respectively to explore whether statistical significance would be observed. The analysis in detail is explained in following Section 3.2.
3.2Tendency of dynamic changes analysis for routine blood parameters
In order to analyze the dynamic changes of hematologic parameters, considering related factors at the same time, 268 patients were divided into groups by gender, age and severity respectively. Before that, with the aim of having an overview of changes on each parameter, analysis of them on whole patients was carried on firstly. In this section, the horizontal red dotted lines represent the upper and lower bounds of normal range. If only one line in the figure, it represents upper bound. For all figures in this section, x-axis represents the time after hospital discharge, e.g., “0” represents the date of discharge, “50” represents that patient had been discharged from hospital for 50 days and the value on the left of “0” represents date of hospitalization. The “-” in the table represents the P value cannot be calculated due to lacking data.
3.2.1Routine blood test indicators’ changes on whole patients
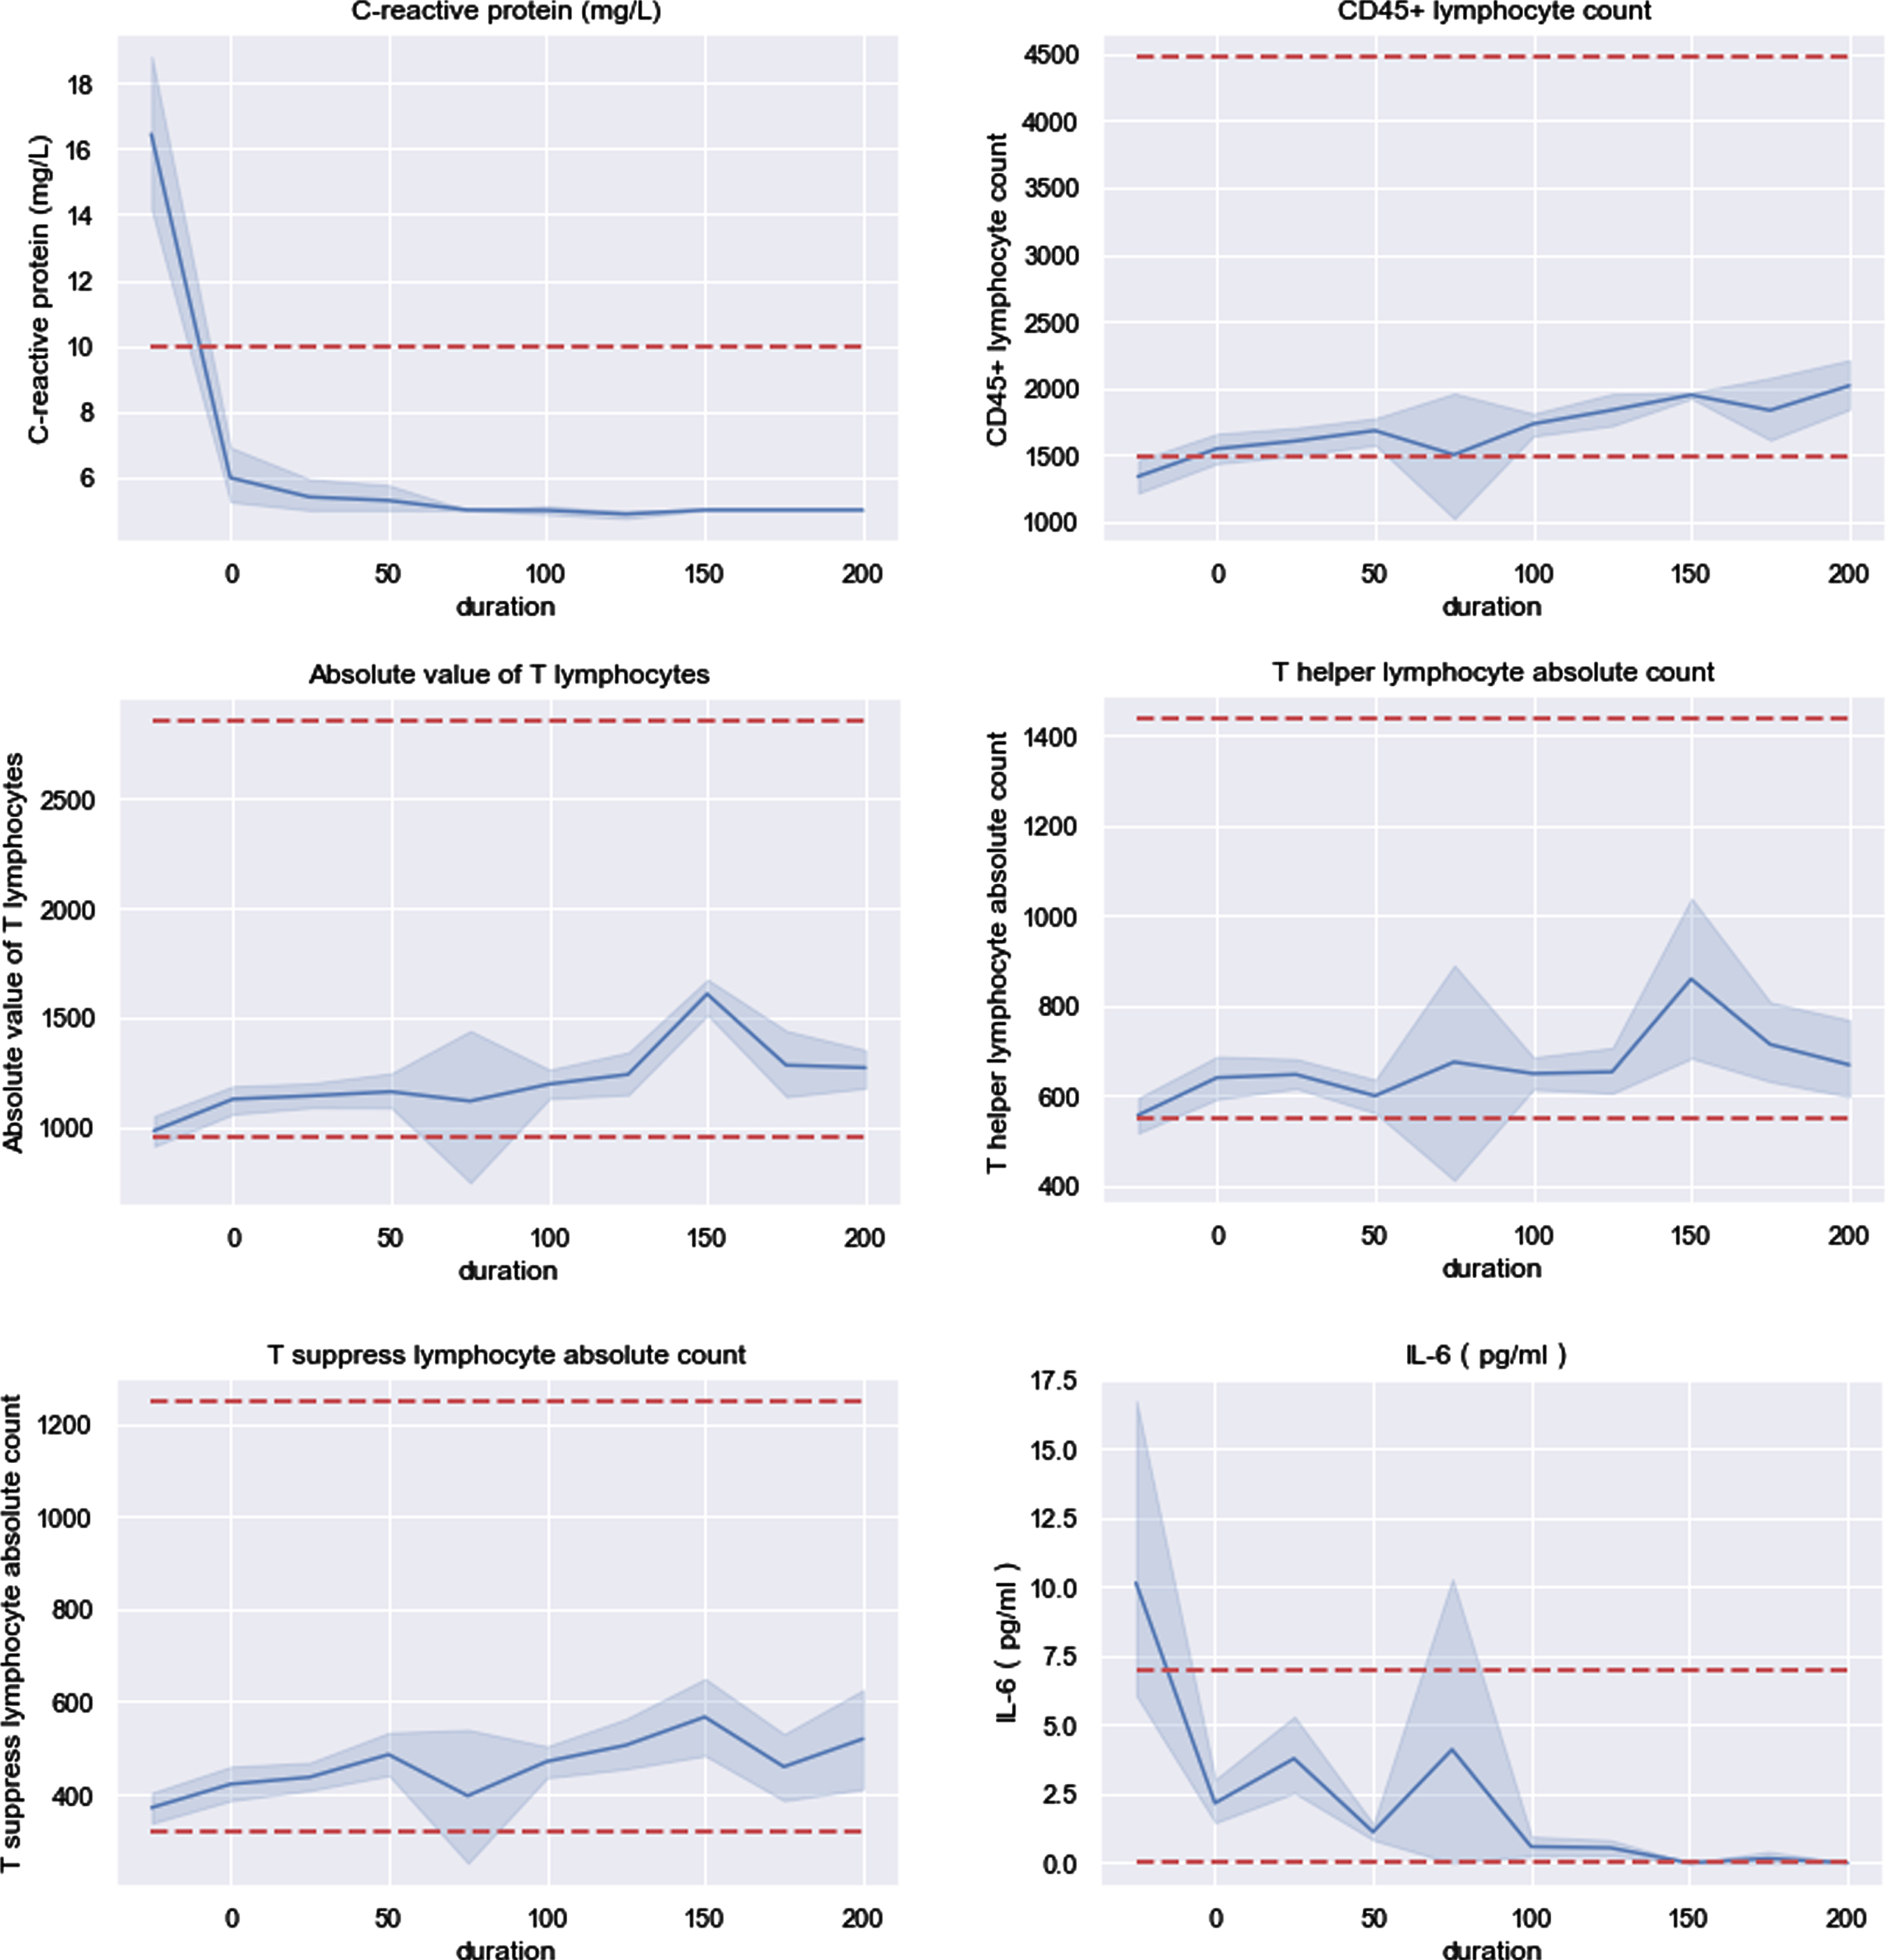
Figure 4 shows that CRP were 50% higher than upper bound of normal range at the time of hospitalization and mean of it resumed normal value at discharge. Both mean and variance of CRP kept decreasing through time series. As for T lymphocyte subset, four indicators were needed to be noticed which are CD45 + lymphocyte count, Absolute value of T lymphocytes (AVTL), T helper lymphocytes absolute count (THLA) and T suppress lymphocyte absolute count (TSLAC). CD45 + lymphocyte count was lower than lower bound of normal range at the time of on admission to hospital. Value of these four indicators kept near and even reached lower bound within 75 days after patients released from hospital. At the time instance of 75 days after released from hospital, they would probably drop below lower bound (95% confidence interval cross red dotted line). Additionally, AVTL, THLA and TSLAC changed in similar pattern and CD45 + lymphocyte count was closer to lower bound than another three. Being similar with CRP, IL-6 was nearly 33% higher than upper bound in admission day and resumed at discharge. The blood parameters stably resuming at discharge, such as CRP and IL-6, could be considered as marker to assist judging progression and treatment of COVID-19.
Fig. 4
Six indicators were abnormal at time of in hospital and discharge.
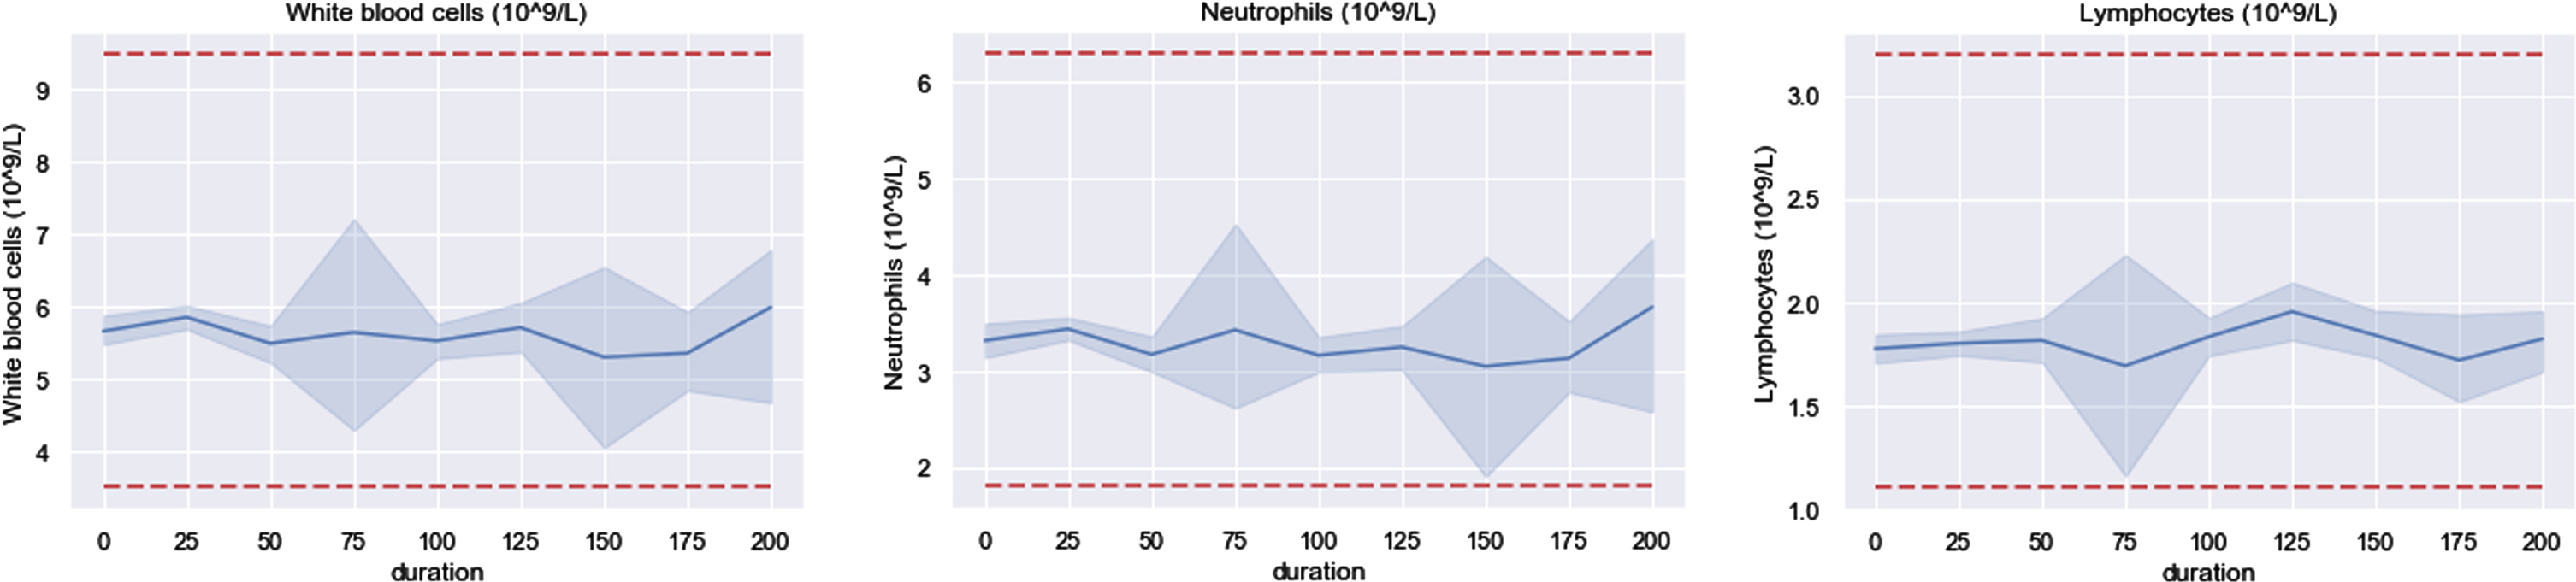
It had been reported that WBC, neutrophils and lymphocytes were statistically significant between severe and non-severe groups in previous study [4, 5, 7, 19]. After patients being discharged, these three indicators all distributed in normal range. Furthermore, WBC and neutrophils had similar changes through time series shown in Fig. 5. It will be discussed in section 3.2.2 that whether there still existing statistical significance between severe and non-severe groups of these three indicators after discharge.
Fig. 5
Three indicators fluctuate within normal range.
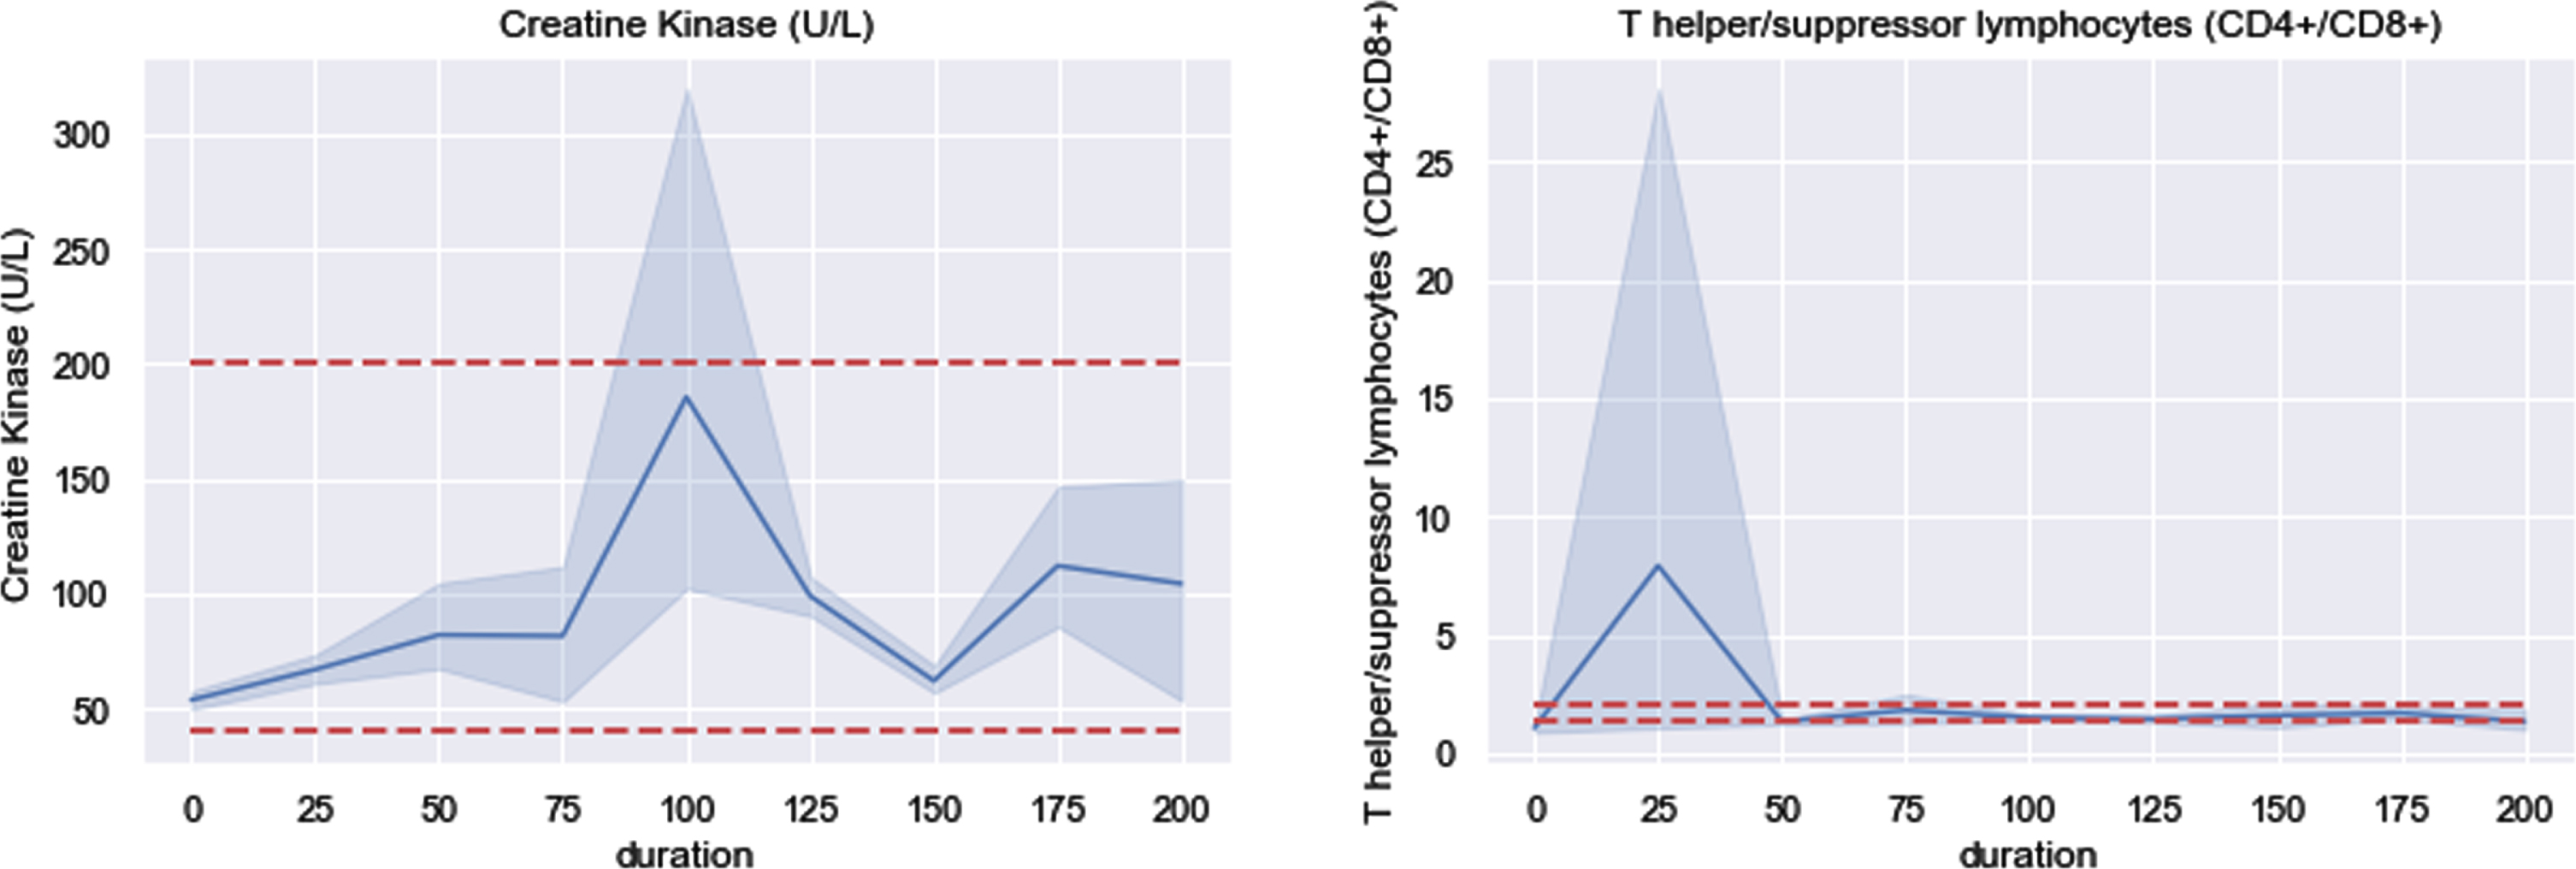
As for creatine kinase (CK), the mean increased sharply at duration of 100 days and showed high volatility in this time interval. The phenomenon was caused by that five patients’ CK dominated others which are 6997, 2379, 928, 539 and 412. Obviously, shown in Fig. 6, the 95% confidence interval (CI, blue shadow area) beyond upper bound of normal range implied that CK was probably larger than upper bound at 100 days after discharge. Coincidentally, at 25 days after discharge, T helper/suppressor lymphocytes (CD4 + /CD8+) was dominated by a male patient with value equaling 1046. In the remaining durations, the mean of this indicator fluctuated between 1.0 and 1.8 and its standard deviation ranged from 0.45 to 0.95.
Fig. 6
Two indicators dominated by few patients.
3.2.2Tendency of data group divided by severity
A lot of previous works had been done by comparing routine blood indicators between severe and non-severe groups and had some findings with great value of clinic, e.g. [24, 25]. There is a wide variety in symptoms reported of patients with COVID-19, varying from mild symptoms to severe [26]. For this study, to continue previous works in hospital discharged patients, patients were divided by severity into three groups, mild, moderate and severe. There are 222 moderate patients, 28 severe patients and 18 mild patients, with average age of 44.7, 57.2 and 34.4 respectively. P-values of patients’ age between any two of these three groups are far smaller than 0.01 implying that differences of age are statistically significant. It is consistent with acknowledge that older patients are more likely to be severe. Association between severity and gender was tested by chi-square and statistically significant difference was observed with P value equaling 0.02.
Figure 7 shows dynamic changes of these three severity groups and corresponding P values are displayed in Table 3. Although majority of P values in Table 3 are larger than 0.05, statistically significant difference still exists. Neutrophils are the most abundant immune cells in human blood and activation of it is highly activated processes in SARS infection [27, 28]. Recruitment of neutrophils was found in immune response triggered by SARS-CoV-2 [29]. In previous bioinformatic study, an increasing trend of neutrophils was found in immune response triggered by SARS-CoV-2 and could be considered as an indicator of severe respiratory symptoms and a poor outcome in patients with COVID-19 [30–32]. For patients released from hospital, significant difference was observed in neutrophils between mild and moderate groups. It is probably that more efforts were put on severe patients and neutrophils of moderate patients were slightly neglected in hospital, leading to that severe patients were as good as mild patients in neutrophils but moderate patients were not. It suggests that moderate patients should be paid equal attention to with severe patients in neutrophils. However, for those four indicators shown in Fig. 7, there is not statistically significant between mild and severe groups.
Fig. 7
Four indicators dynamic changes after discharge.
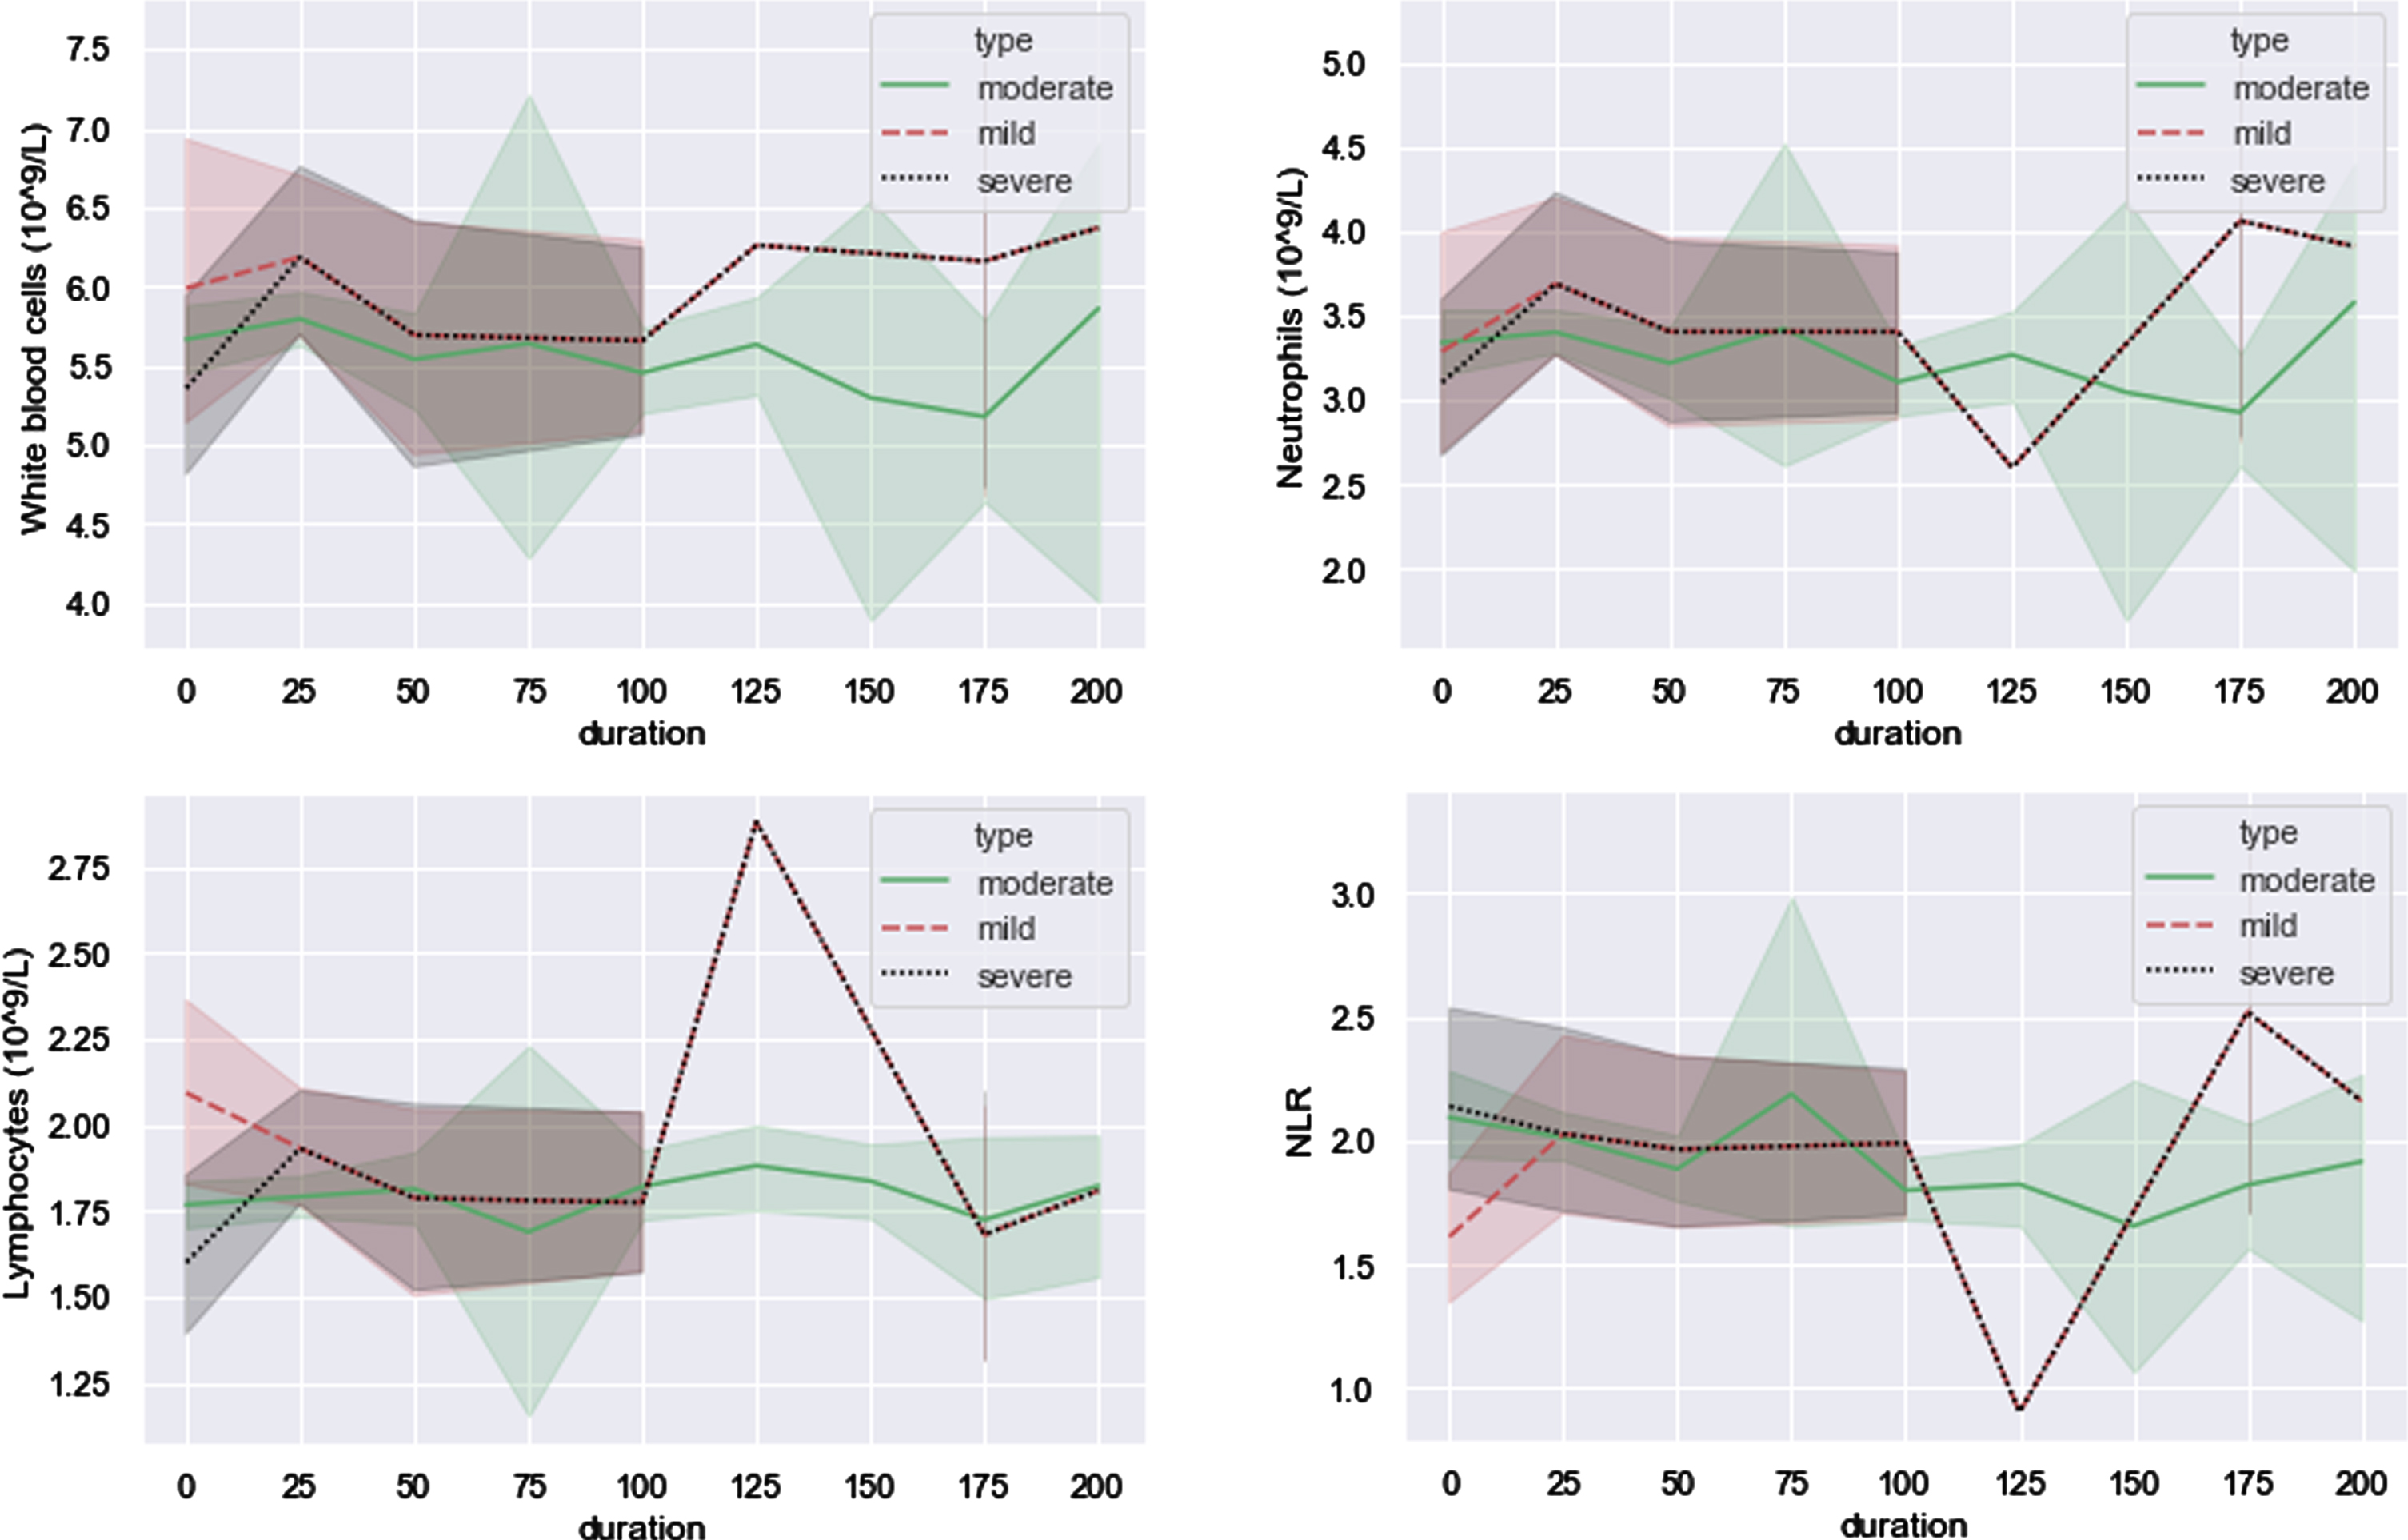
Table 3
P values of four indicators in nine durations
| 0 | 25 | 50 | 75 | 100 | 125 | 150 | 175 | 200 | |
| WBC (mild &moderate) | 0.43 | 0.003 | 0.01 | – | 0.39 | 0.79 | – | 2.98e-05 | 0.69 |
| WBC (moderate &severe) | 0.35 | 0.0001 | 0.05 | – | 0.25 | 0.43 | – | 0.002 | 0.80 |
| WBC (mild &severe) | 0.25 | 0.37 | 0.89 | – | 0.69 | 0.13 | – | 0.53 | 0.82 |
| Neutrophils (mild &moderate) | 0.89 | 0.002 | 0.02 | – | 0.03 | 0.002 | – | 6.40e-08 | 0.75 |
| Neutrophils (moderate &severe) | 0.41 | 2.0e-05 | 0.03 | – | 0.07 | 0.05 | – | 8.99e-07 | 0.75 |
| Neutrophils (mild &severe) | 0.67 | 0.31 | 0.8 | – | 0.88 | 0.12 | – | 0.92 | 0.94 |
| Lymphocytes (mild &moderate) | 0.02 | 0.03 | 0.19 | – | 0.002 | 1.54e-07 | – | 0.28 | 0.14 |
| Lymphocytes (moderate &severe) | 0.14 | 0.12 | 0.73 | – | 0.12 | 2.26e-07 | – | 0.6 | 0.24 |
| Lymphocytes (mild &severe) | 0.01 | 0.86 | 0.52 | – | 0.30 | 0.22 | – | 0.18 | 0.61 |
| NLR (mild &moderate) | 0.13 | 0.37 | 0.83 | – | 0.0002 | 3.04e-06 | – | 0.001 | 0.32 |
| NLR (moderate &severe) | 0.86 | 0.03 | 0.45 | – | 0.008 | 0.0002 | – | 5.90e-05 | 0.39 |
| NLR (mild &severe) | 0.05 | 0.36 | 0.50 | – | 0.33 | 0.13 | – | 0.27 | 0.96 |
3.2.3Tendency of data group divided by underlying disease
Hypertension, diabetes, cardiovascular disease (CVD) and chronic obstructive pulmonary disease (COPD) were four main underlying diseases among 268 patients, and 57 patients had at least one of them. Mean age of 57 patients is 57.9 and half of them are male. P values of each indicator were calculated between patients with and without the underlying disease, and part of them are shown in the Table 4. Few patients had COPD and CVD resulting in many missing values in the table. Four indicators, T helper lymphocyte% (THL%), CD3 + CD4 + CD8 + lymphocyte count, IL-6 and CD3 + CD4 + CD8 + /CD45 + did not show statistically significant difference for all four underlying diseases in majority of time intervals. Inversely, NLR showed statistically significant under both Hypertension and COPD, and is suggested to be added as an indicator in routine hematologic parameters for patients with underlying diseases.
Table 4
P values of several indicators after discharge under four underlying diseases
| 0 | 25 | 50 | 75 | 100 | 125 | 150 | 175 | 200 | |
| Hypertension | |||||||||
| T helper lymphocyte% | 0.15 | 0.55 | 0.07 | 0.50 | 0.003 | 0.02 | – | 0.001 | – |
| CD3 + CD4 + CD8 + lymphocyte count | 0.76 | 0.17 | 0.87 | 0.88 | 0.57 | 0.94 | – | 0.02 | – |
| NLR | 0.20 | 8.5e-11 | 8.07e-08 | 0.0004 | 1.80e-10 | 1.6e-06 | – | 0.97 | – |
| IL-6 | 0.23 | 0.80 | 6.68e-05 | 0.91 | 0.21 | 0.73 | – | 0.39 | – |
| CD3 + CD4 + CD8 + /CD45+ | 0.95 | 0.01 | 0.35 | 0.12 | 0.51 | 0.26 | – | 0.29 | – |
| T lymphocyte% | 0.53 | 0.1 | 0.4 | 0.39 | 0.02 | 0.26 | – | 0.001 | – |
| Neutrophils | 0.22 | 0.0001 | 1.09e-05 | 0.08 | 2.52e-11 | 2.1e-08 | – | 9.3e-09 | – |
| WBC | 0.45 | 0.21 | 0.006 | 0.003 | 4.56e-07 | 2.3e-07 | – | 3.0e-10 | – |
| CRP | 0.9 | 0.007 | 0.013 | – | 0.0002 | 7.8e-07 | – | – | – |
| Diabetes | |||||||||
| T helper lymphocyte% | 0.41 | 3.4e-05 | 0.15 | 0.05 | 1.1e-06 | 0.0003 | – | 9.4e-06 | 0.06 |
| CD3 + CD4 + CD8 + lymphocyte count | 0.92 | 0.04 | 0.93 | 0.88 | 0.17 | 0.98 | – | 0.25 | 0.70 |
| NLR | 0.70 | 0.91 | 0.21 | 0.0004 | 0.37 | 0.23 | – | 0.08 | 0.19 |
| IL-6 | 0.86 | 0.15 | 2.01e-11 | 0.91 | 0.03 | 0.88 | – | 0.36 | 0.06 |
| CD3 + CD4 + CD8 + /CD45+ | 0.54 | 0.05 | 0.85 | 0.12 | 0.43 | 0.9 | – | 1.0 | 0.65 |
| T lymphocyte% | 0.84 | 0.04 | 0.77 | 0.4 | 0.03 | 0.27 | – | 0.36 | 0.001 |
| Neutrophils | 0.49 | 0.14 | 0.06 | 0.08 | 0.10 | 0.13 | – | 3.5e-15 | 0.1 |
| WBC | 0.48 | 0.03 | 0.06 | 0.003 | 0.03 | 0.01 | – | 1.4e-13 | 0.16 |
| CRP | 0.63 | 0.39 | 0.03 | – | 0.38 | 0.62 | – | – | – |
| CVD | |||||||||
| T helper lymphocyte% | – | – | 0.69 | – | 0.12 | 0.22 | – | – | – |
| CD3 + CD4 + CD8 + lymphocyte count | – | – | 0.44 | – | 0.10 | 0.83 | – | – | – |
| NLR | 0.06 | 3.7e-10 | 0.26 | – | 0.29 | 0.79 | – | – | – |
| IL-6 | – | – | – | – | 0.87 | 0.99 | – | – | – |
| CD3 + CD4 + CD8 + /CD45+ | – | – | 0.34 | – | 0.36 | 0.82 | – | – | – |
| T lymphocyte% | – | – | 0.03 | – | 1.9e-05 | 0.03 | – | – | – |
| Neutrophils | 0.48 | 0.0003 | 0.57 | – | 0.03 | 6.9e-06 | – | – | – |
| WBC | 0.97 | 0.07 | 0.91 | – | 0.0004 | 1.0e-08 | – | – | – |
| CRP | 0.74 | 0.72 | 0.75 | – | 0.67 | 0.83 | – | – | – |
| COPD | |||||||||
| T helper lymphocyte% | – | 0.07 | 0.05 | – | – | 0.02 | – | – | – |
| CD3 + CD4 + CD8 + lymphocyte count | – | 0.32 | 0.6 | – | – | 0.3 | – | – | – |
| NLR | – | 0.0002 | 0.0002 | – | – | 9.4e-07 | – | – | – |
| IL-6 | – | 0.96 | 0.54 | – | – | 0.62 | – | – | – |
| CD3 + CD4 + CD8 + /CD45+ | – | 0.27 | 0.93 | – | – | 0.37 | – | – | – |
| T lymphocyte% | – | 0.17 | 0.26 | – | – | 0.013 | – | – | – |
| Neutrophils | – | 1.8e-06 | 0.001 | – | – | 1.8e-07 | – | – | – |
| WBC | – | 6.23–05 | 0.02 | – | – | 0.001 | – | – | – |
| CRP | – | 0.77 | 0.77 | – | – | 0.82 | – | – | – |
3.2.4Tendency of data group divided by gender
According to N. Gadi et al. [33], with respect to infections and vaccinations, female is equipped with stronger immune responses and outlive male. Additionally, SARS-CoV-2 infection is more likely to trigger a sex-based differential immune response [34]. Therefore, in order to explore whether gender is an effecting factor, patients were divided into male and female groups for analysis. Figures in this section always have a gap of shadow at duration of 75 days on the “male line” (orange line) which is caused by the fact that only two male patients were included in that period and the 95% confidence interval could not be estimated. More importantly, to analyze the differences of hematologic parameters between males and females, effects of age should be eliminated first. Means of age in male and female groups both are equal to 45 and P value between their ages is 0.99. Nevertheless, statistically significant was observed in durations of “50”, “75”, “100” and “200”, so demonstrating the effect of gender requires further test to eliminate noisy effects of age first, which was carried out in following content.
Like Fig. 5, Fig. 8 shows that changes of WBC, neutrophils and lymphocytes still have the similar tendency in both male and female cases. For WBC, orange line dominated the blue line through all the time, and P values between males and females were smaller than 0.05 except duration equaling 25, 50, 175. Neutrophils were in same pattern, but lymphocytes were not. As shown in the sub-figure of lymphocytes below, orange line and bule line intersected three times and P values fluctuated across 0.05 four times. In general, males recovered better in WBC, neutrophils, monocytes and CK than females. Moreover, the tendency of both men and women in monocytes and CK indicators were nearly similar. Of note, the mean value of CK in the male group had high volatility in duration of both 100 days and 175 days. With respect to duration of 100 days, males’ mean increased to nearly 300, which was 50% higher than the upper bound of the normal value range and still had a large volatility at the same time. P values of these five indicators are displayed in Table 5.
Fig. 8
Five indicators that male recovered better.
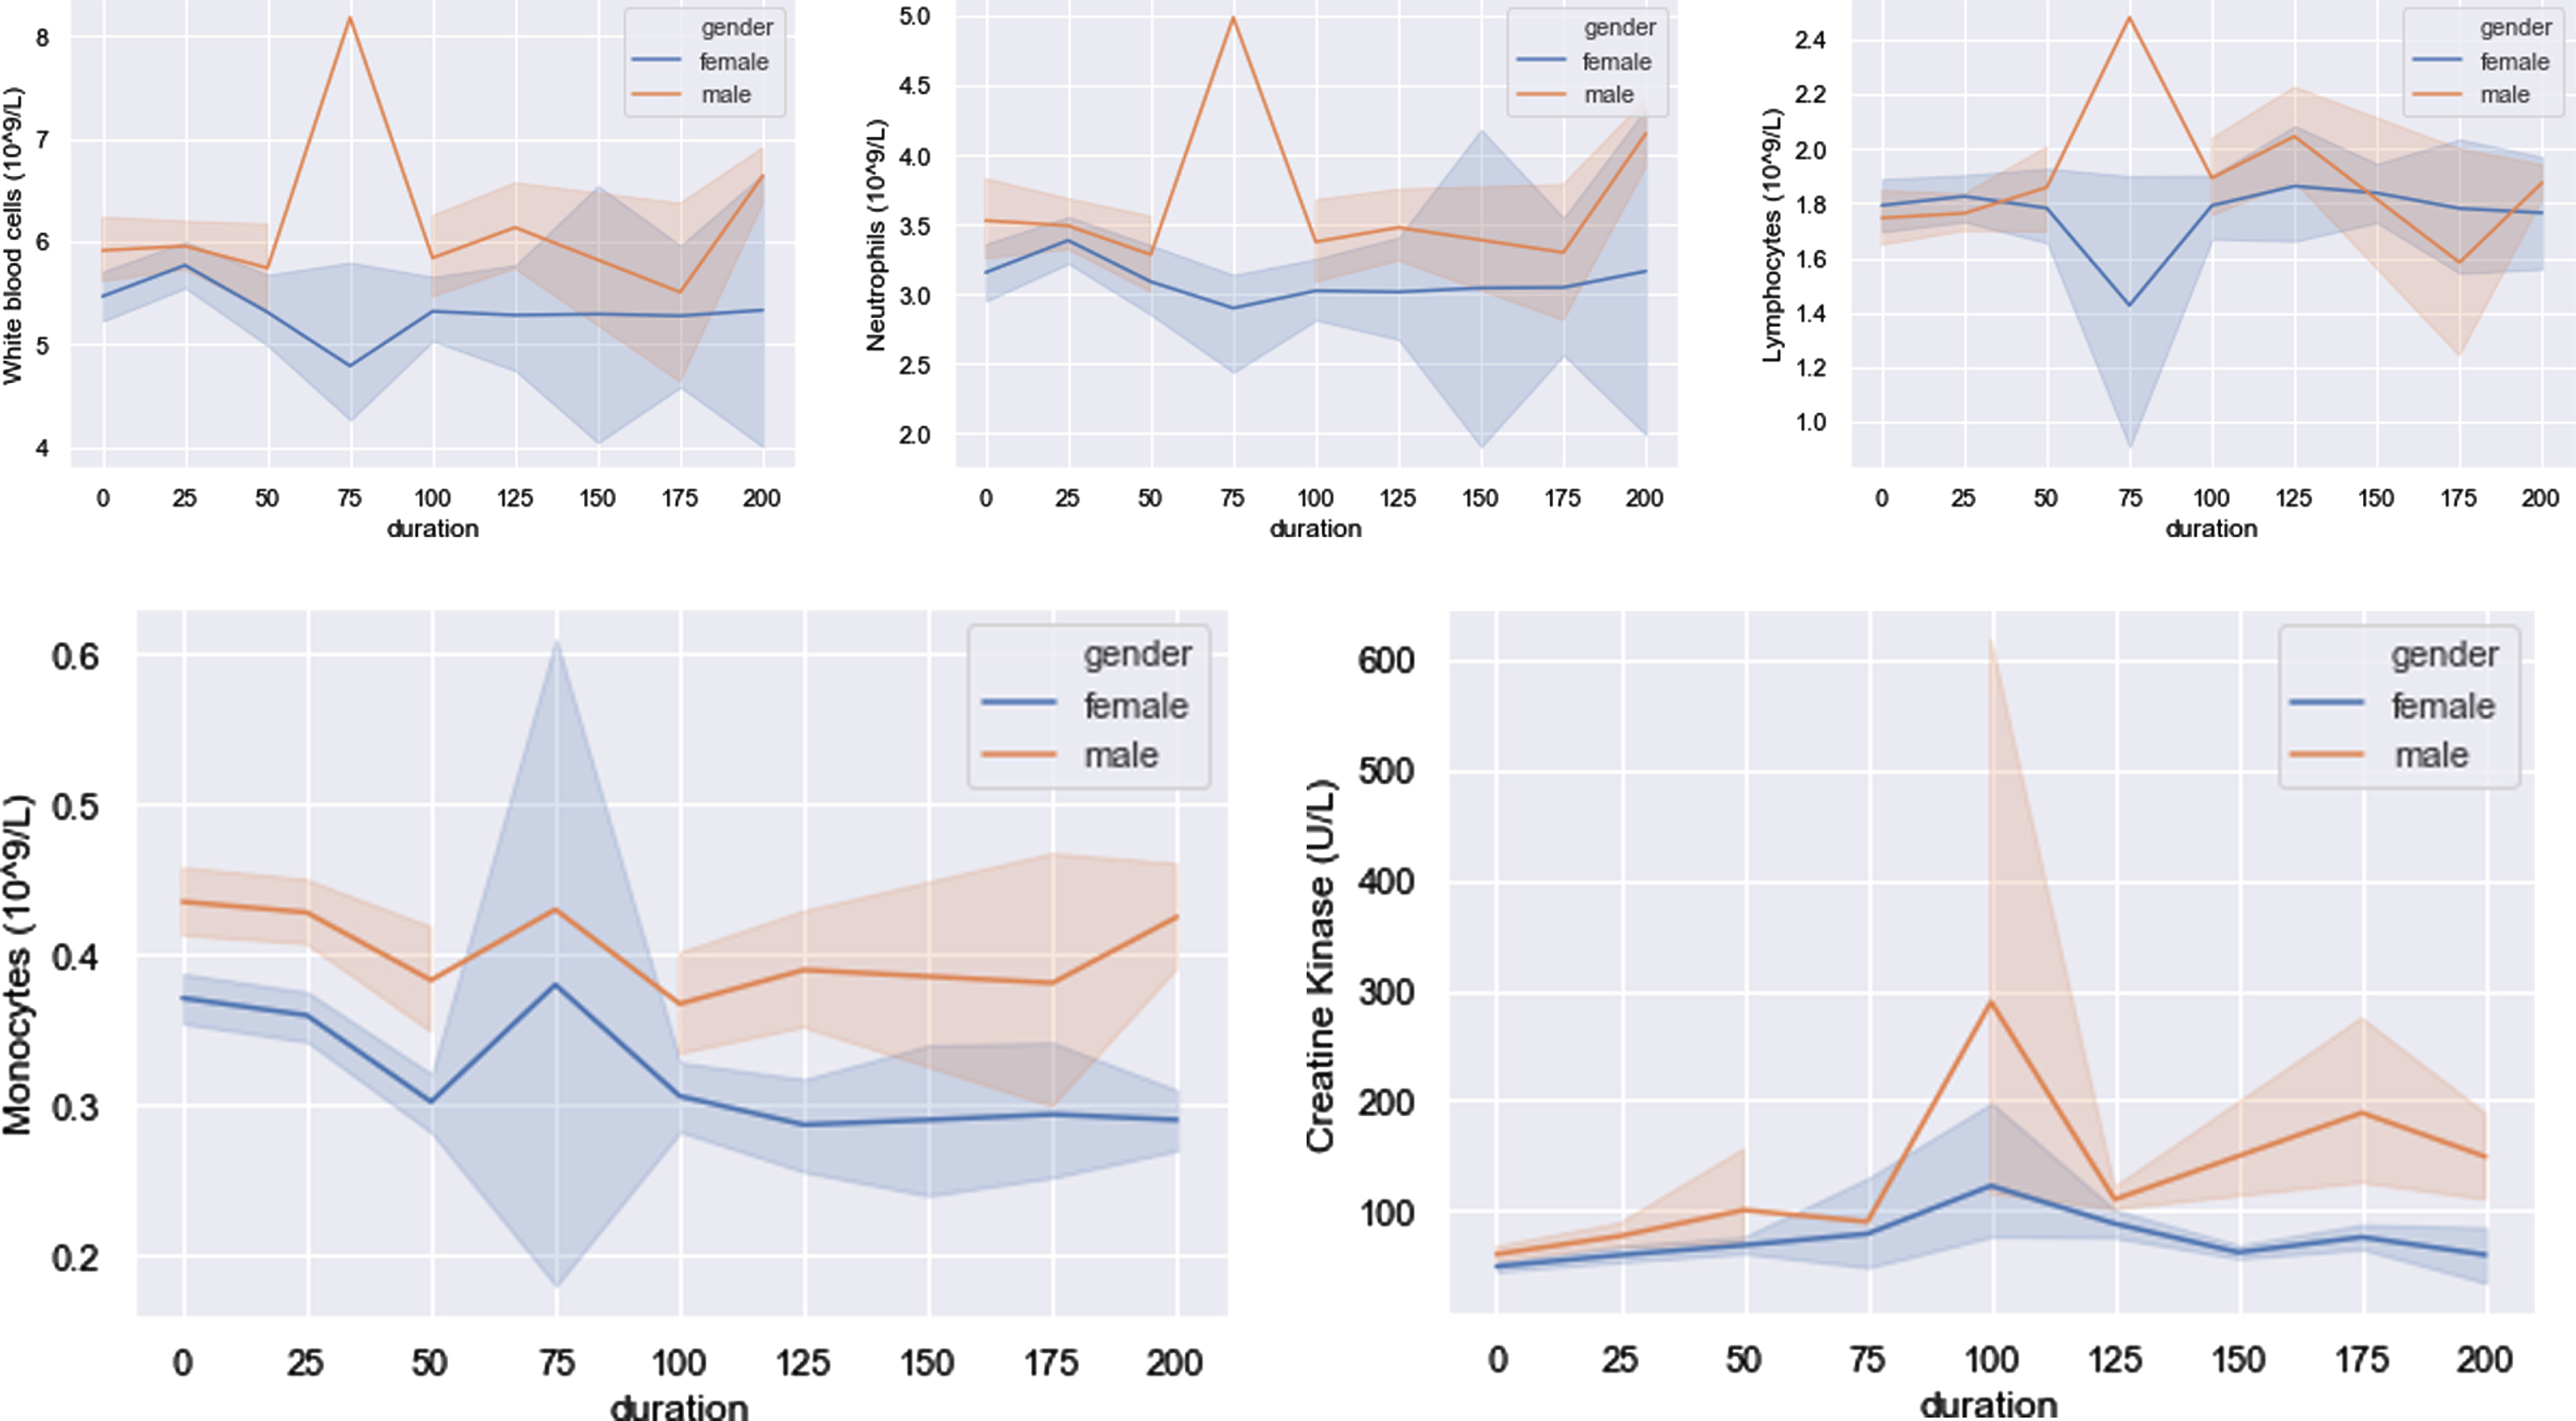
Table 5
P values of indicators that male recovered better
| 0 | 25 | 50 | 75 | 100 | 125 | 150 | 175 | 200 | |
| WBC (male/female) | 0.03 | 0.19 | 0.16 | 2.2e–06 | 1.2e–08 | 1.3e–12 | – | 0.07 | 0.001 |
| wbc_female (0–30/30–60) | 0.88 | 0.45 | 2.4e-06 | – | 2.57e-07 | 0.18 | 9.0e-08 | 0.34 | – |
| wbc_female (30–60/60–90) | 0.35 | 0.18 | 0.74 | 0.53 | 0.74 | 0.99 | 0.07 | 0.49 | 0.24 |
| wbc_female (0–30/60–90) | 0.52 | 0.78 | 3.24e-07 | – | 1.34e-07 | 0.18 | 3.8e-08 | 0.09 | – |
| Neutrophils (male/female) | 0.03 | 0.10 | 0.35 | 0.0004 | 6.9e-07 | 7.46e-10 | – | 0.075 | 0.002 |
| neutrophils_female (0–30/30–60) | 0.35 | 0.34 | 0.003 | – | 0.003 | 0.001 | 1.9e-05 | 0.70 | – |
| neutrophils_female (30–60/60–90) | 0.43 | 0.21 | 0.67 | 0.38 | 0.77 | 0.82 | 0.08 | 0.77 | 0.33 |
| neutrophils_female (0–30/60–90) | 0.15 | 0.07 | 0.0007 | – | 0.002 | 0.001 | 0.0002 | 0.50 | – |
| Lymphocytes (male/female) | 0.51 | 0.003 | 0.07 | 0.002 | 0.1 | 0.17 | – | 0.26 | 0.29 |
| lymphocyte_female (0–30/30–60) | 0.006 | 1.78e-06 | 2.59e-08 | – | 1.26e-10 | 6.54e-06 | 1.8e-08 | 0.08 | – |
| lymphocyte_female (30–60/60–90) | 0.79 | 0.77 | 0.62 | 0.87 | 0.72 | 0.43 | 0.43 | 0.30 | 0.72 |
| lymphocyte_female (0–30/60–90) | 0.09 | 1.85e-05 | 5.68e-06 | – | 7.28e-11 | 0.0001 | 1.8e-06 | 0.008 | – |
| Monocytes (male/female) | 1.32e-05 | 2.83e-12 | 3.38e-09 | 0.04 | 1.13e-23 | 5.05e-32 | – | 2.15e-12 | 0.0004 |
| monocytes_female (0–30/30–60) | 0.68 | 0.07 | 0.01 | – | 3.90e-12 | 0.7 | 0.0002 | 0.09 | – |
| monocytes_female (30–60/60–90) | 0.24 | 0.96 | 0.02 | 0.69 | 0.2 | 0.33 | 0.48 | 0.08 | 0.36 |
| monocytes_female (0–30/60–90) | 0.57 | 0.09 | 5.53e-06 | – | 2.15e-14 | 0.85 | 0.004 | 0.003 | – |
| CK (male/female) | 0.002 | 8.67e-05 | 1.2e-05 | 0.55 | 0.19 | 7.77e-05 | – | 0.003 | 4.03e-05 |
| ck_female (0–30/30–60) | 0.16 | 0.27 | 0.21 | – | 0.0001 | 0.14 | 0.41 | 0.39 | – |
| ck_female (30–60/60–90) | 0.52 | 0.74 | 0.26 | 0.59 | 0.13 | 0.11 | 0.08 | 0.08 | 0.72 |
| ck_female (0–30/60–90) | 0.07 | 0.51 | 0.64 | – | 0.004 | 0.02 | 0.14 | 0.83 | – |
With the aim of eliminating effect of age in each duration, gender was chosen as control variable during analysis. Due to that number of females is larger than that of males in dataset, female patients were selected and divided into three subgroups, young (< 30 years), middle (30 years≤and < 60 years) and old (≥60 years). In Table 5, P values of blood test indicators between sex-specific groups as well as age-specific subgroups are displayed, e.g., “WBC(male/female)” represents P values of WBC between men and women, and “wbc_female(0–30/30–60)” represents P values of WBC between young and middle female patients. The age effect could be excluded in CK indicator, because almost all P values were larger than 0.05 between age-specific subgroups when CK in males are statistically different with those of females.
Inversely with what had been mentioned above, in Fig. 9, THL% and CD3 + CD4 + CD8 +lymphocyte count showed higher values in the female group than that in male group through all time periods. The values of THL% are very closed between male and female at duration of 75 and 200 due to only one male data including in these durations which were not considered in analysis. Similar with Table 5, relevant P values are listed in Table 6. THL% and CD3 + CD4 + CD8 + lymphocyte count are two important parameters in T lymphocyte subsets. Female recovered better than male in these two indicators implied that: The resuming ability of COVID-19 patients’ immune systems in female is better than that in male, being consistent with S. Jaillon et al. and N. Gadi et al. [18, 33].
Fig. 9
Two T subset indicators that female recovered better.
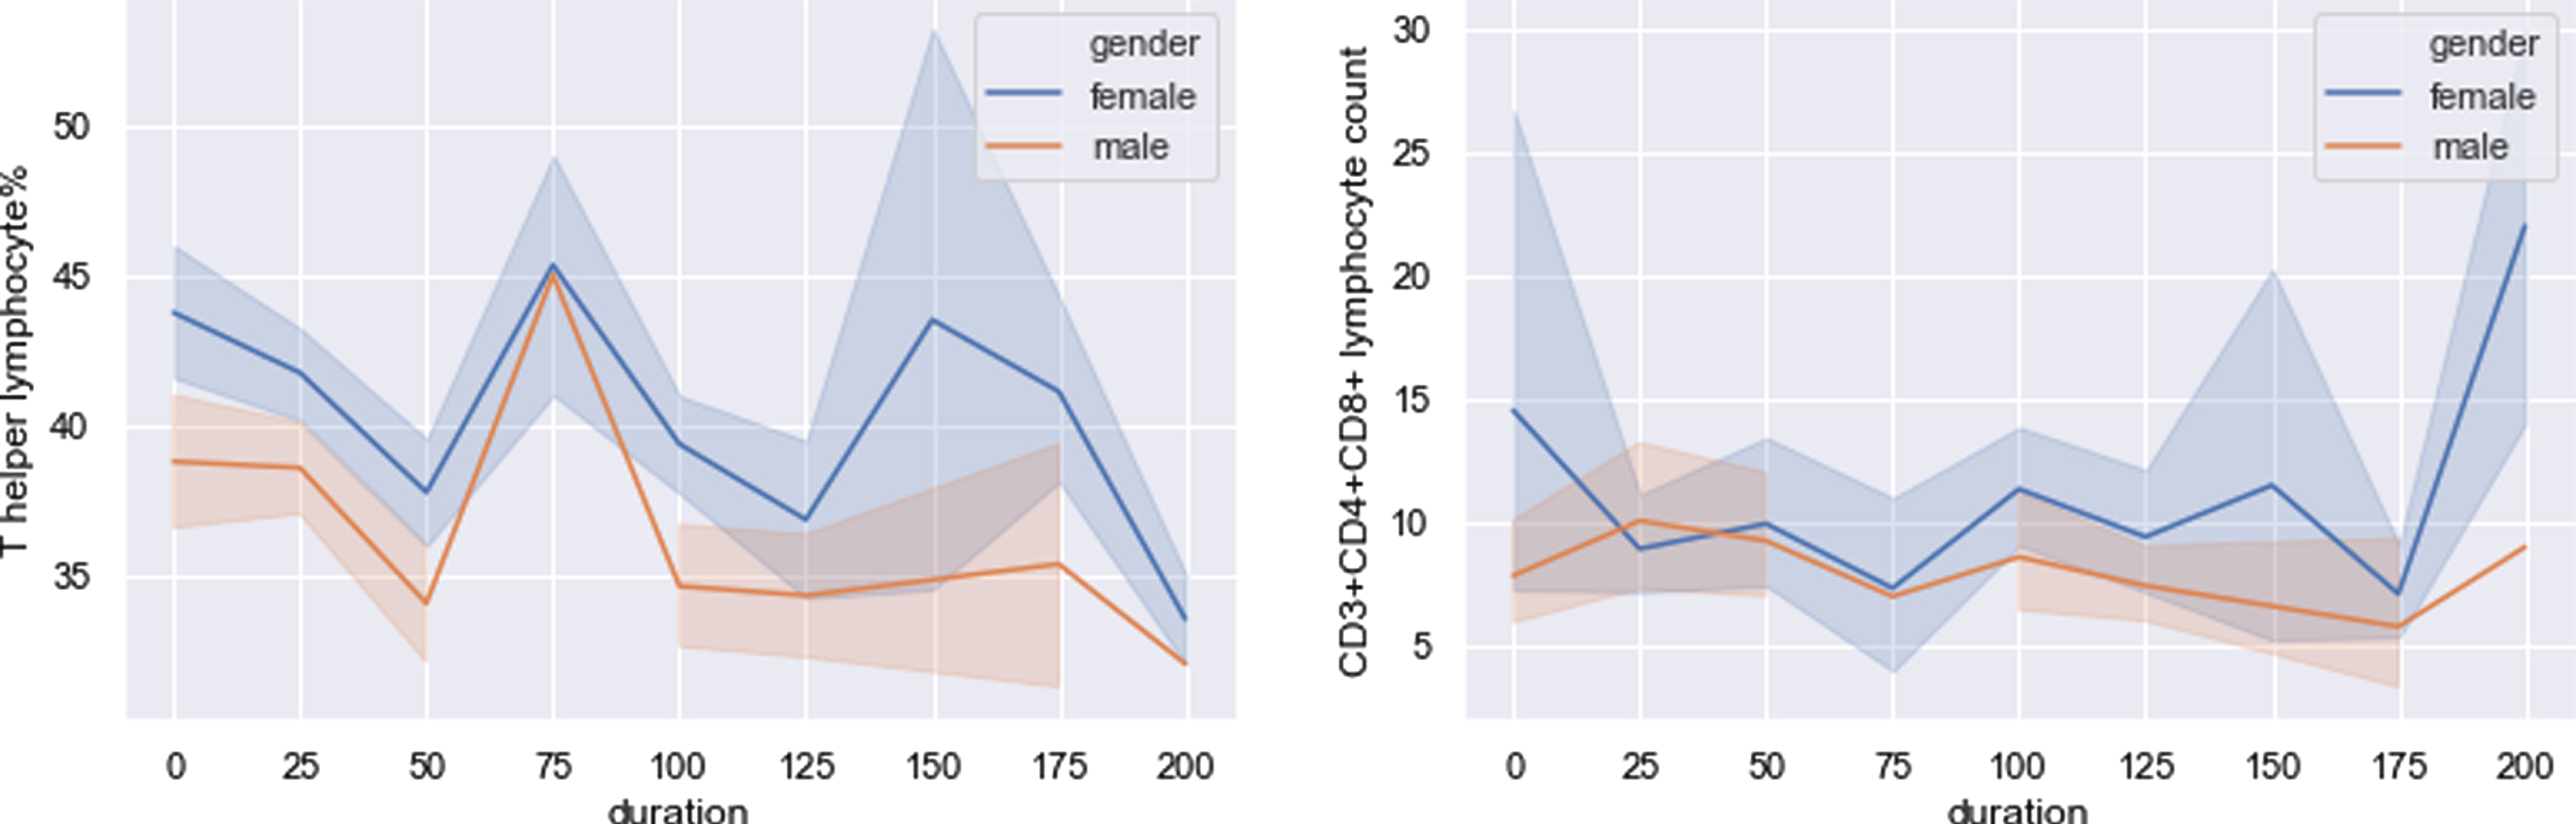
Table 6
P values of two indicators that female recovered better
| 0 | 25 | 50 | 75 | 100 | 125 | 150 | 175 | 200 | |
| T helper lymphocyte% (male/female) | 0.003 | 6.13e-07 | 3.12e-05 | – | 2.75e-10 | 2.12e-08 | – | 2.84e-09 | 0.51 |
| T helper lymphocyte%_female(0–30/30–60) | 0.07 | 0.05 | 0.78 | – | 0.73 | 0.08 | 8.4e-15 | 7.77e-06 | – |
| T helper lymphocyte%_female((30–60/60–90) | 0.51 | 0.52 | 0.36 | 1 | 0.25 | 0.34 | 1.0 | 0.9 | 1.0 |
| T helper lymphocyte%_female((0–30/60–90) | 0.49 | 0.19 | 0.82 | – | 0.46 | 0.22 | 8.4e-15 | 1.5e-5 | – |
| CD3 + CD4 + CD8 + lymphocyte count (male/female) | 0.22 | 0.75 | 0.01 | – | 0.49 | 0.44 | – | 0.001 | 0.0001 |
| CD3 + CD4 + CD8 + lymphocyte_female (0–30/30–60) | 0.89 | 3.85e-05 | 0.85 | – | 0.002 | 0.003 | 0.38 | 0.04 | – |
| CD3 + CD4 + CD8 + lymphocyte_female (30–60/60–90) | 0.11 | 0.24 | 0.85 | 1 | 0.85 | 0.69 | 1.0 | 0.83 | 1.0 |
| CD3 + CD4 + CD8 + lymphocyte_female (0–30/60–90) | 0.62 | 1.42e-05 | 0.81 | – | 0.001 | 0.01 | 0.38 | 0.06 | – |
3.2.5Tendency of data group divided by age
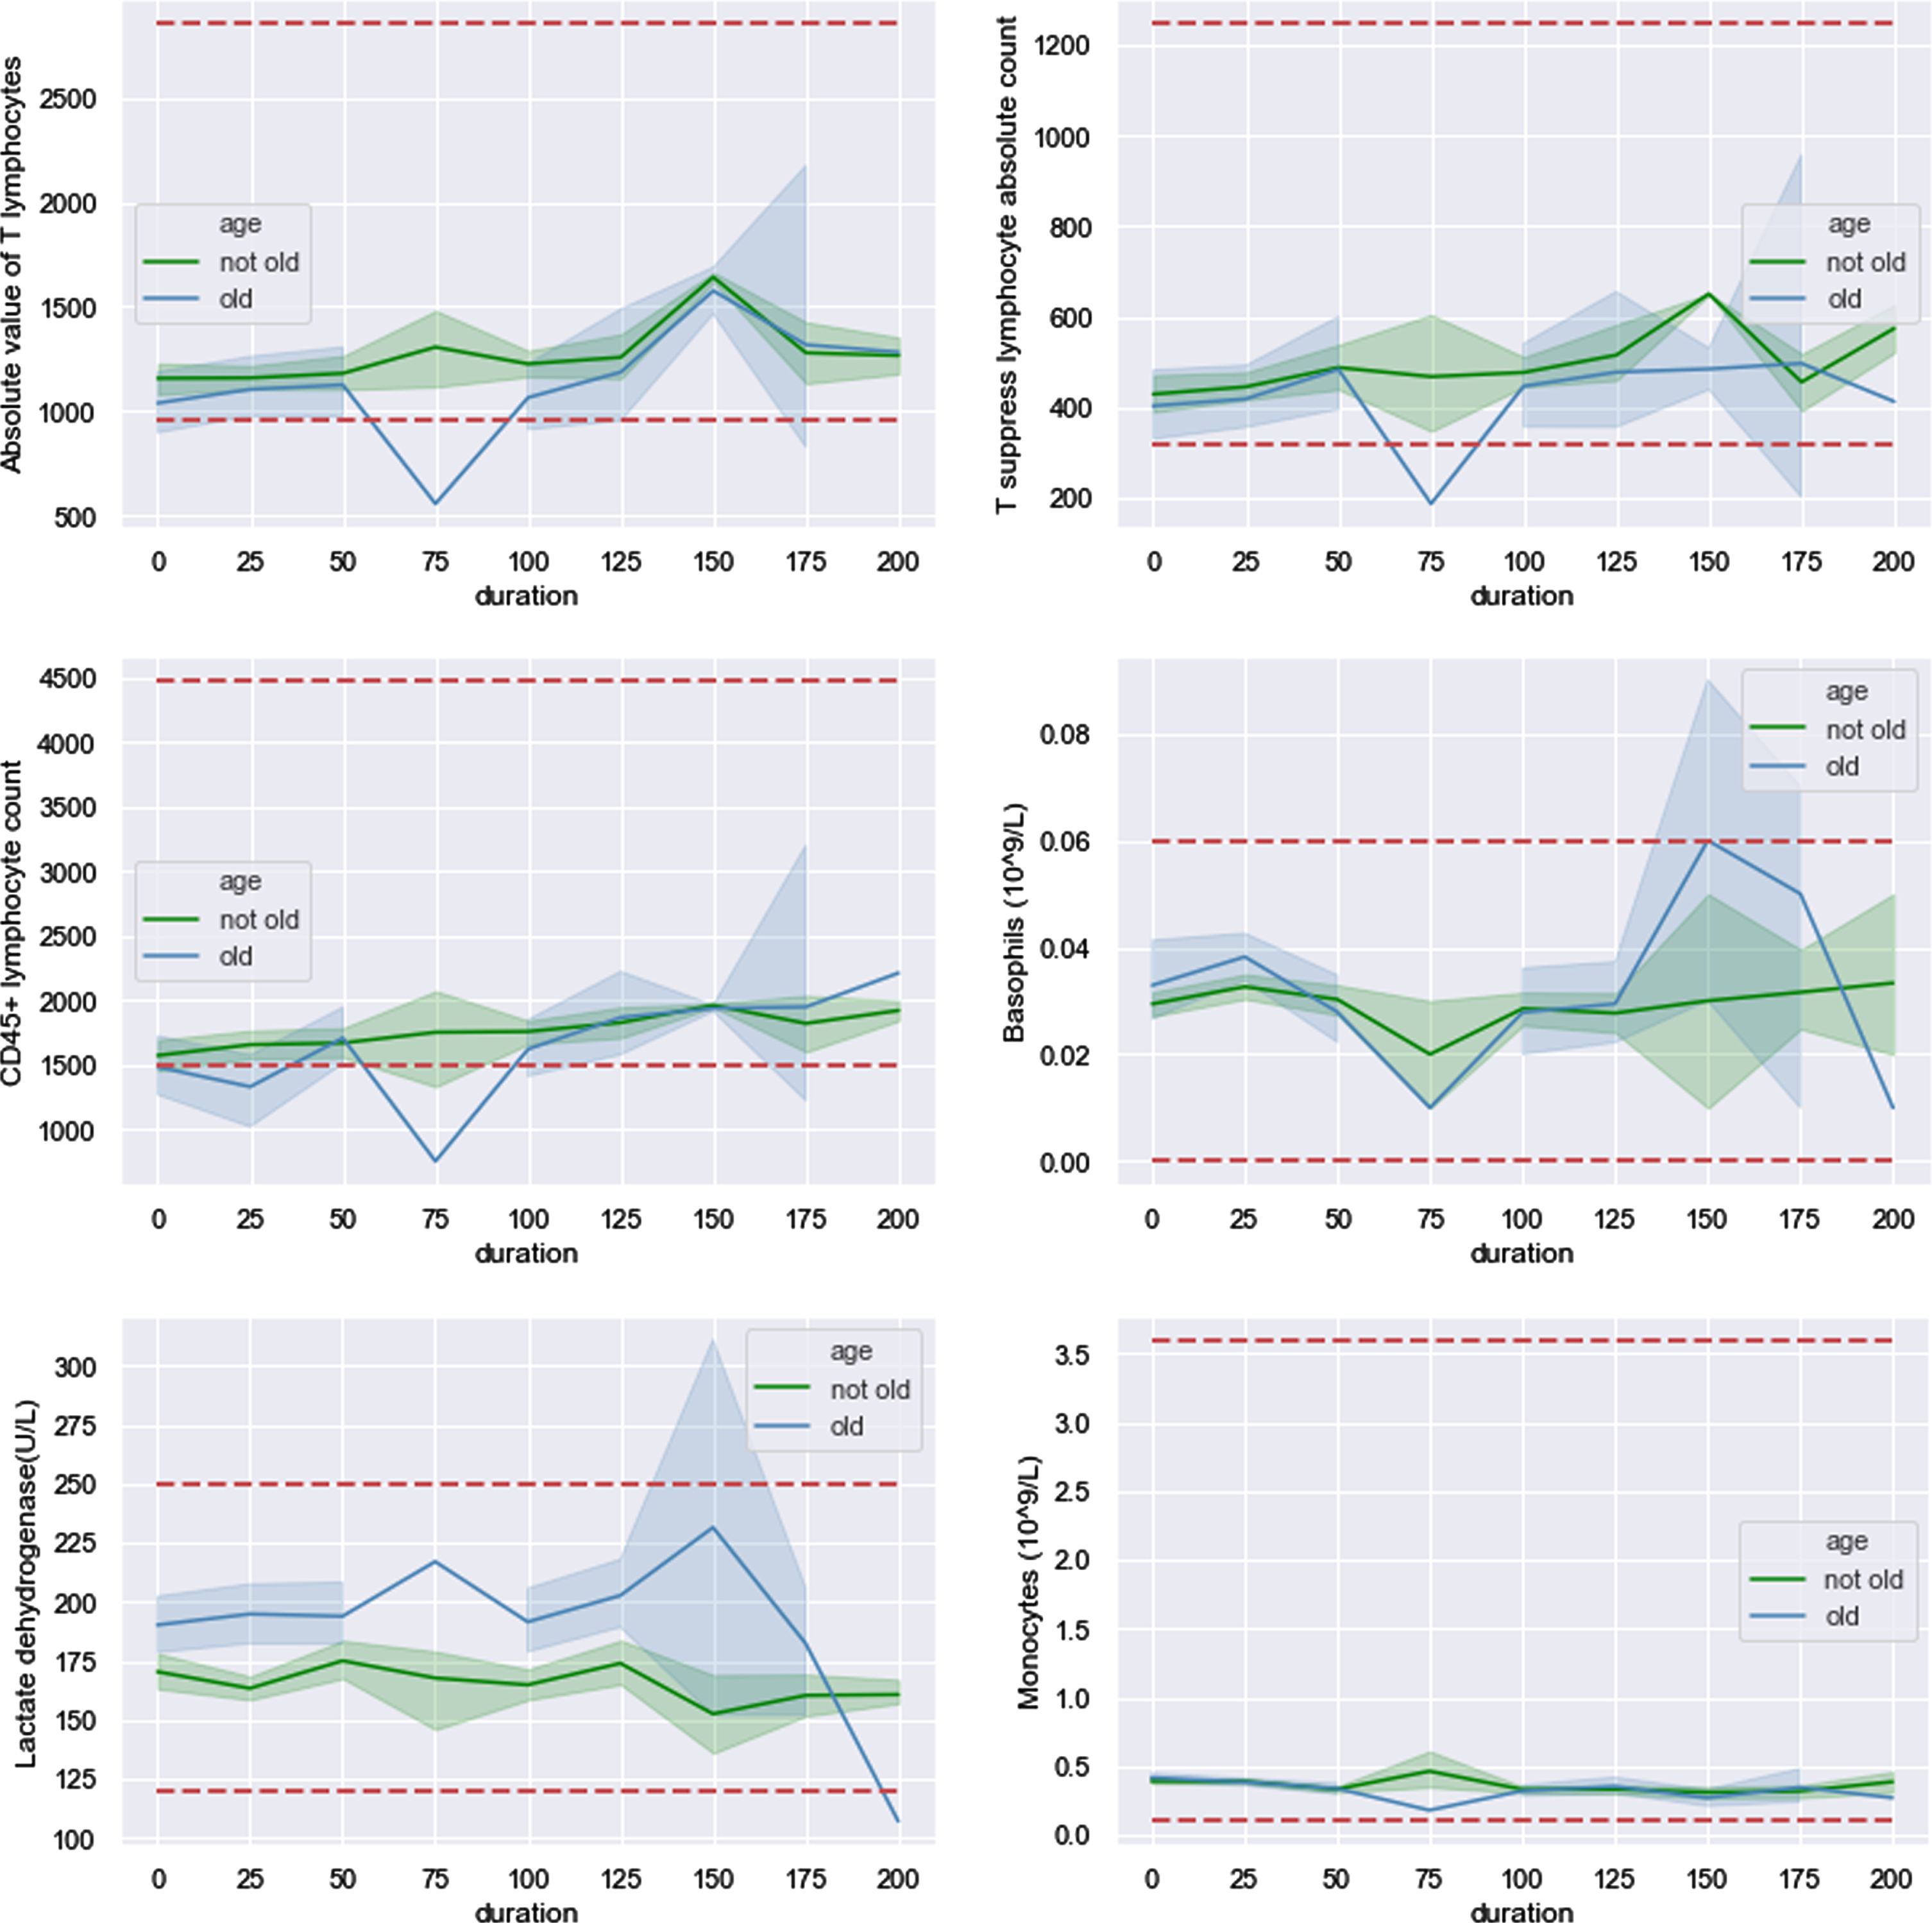
268 patients were assigned into old and non-old groups by age and 60 was chosen as cutoff. With 95% confidence level, six indicators shown in Fig. 10 are less volatility in non-old group than that in old group (green shadow narrower than blue shadow). As common sense, health condition of young patient is more stable than that of old patient and stronger to resist external infection. Be consistent with what have been mentioned in Section 3.2.1, AVTL, TSLAC and CD45 + lymphocyte count of old group changed in similar pattern. The curve of old group for all these three indicators dropped below lower bound at 75 days after hospital discharge. Besides, curve of CD45 + lymphocyte count for old group crossed lower dotted line four times within 100 days after hospital discharge. These phenomena above indicated that patients with age over 60 years would be more sensitive to COVID-19 which could still have effects on them after released from hospital for a period (more than 2 months). Basophils and LDH crossed upper and lower bound respectively in the time series. It may be sequela of COVID-19 or perhaps other external effects requiring further data to support analysis.
Fig. 10
Six indicators show the difference between old and not old groups.
3.3Tendency of dynamic changes analysis for volume ratio of lung lesions
Same with that of Section 3.2, analysis of lung lesions absorbing process was carried out for the whole 268 patients as well as divided them into subgroups by age, gender and underlying disease. Figures in this section were plotted with means of ratios (circles) and one standard deviation (vertical lines).
3.3.1Tendency of lung lesions changing on overall patients
With the time going on, volumes of lesions kept decreasing on both left and right lungs indicating process of recovery and ratios of volumes were closed to zero at 100 days. Whereas significant differences were observed between right and left lungs. As indicated by Fig. 11 and Table 7, volumes of lung lesions on right side were bigger than that on left which is statistically significant at date of hospital discharged and first two periods.
Fig. 11
Tendency of lesions changing on right and left lungs overall.
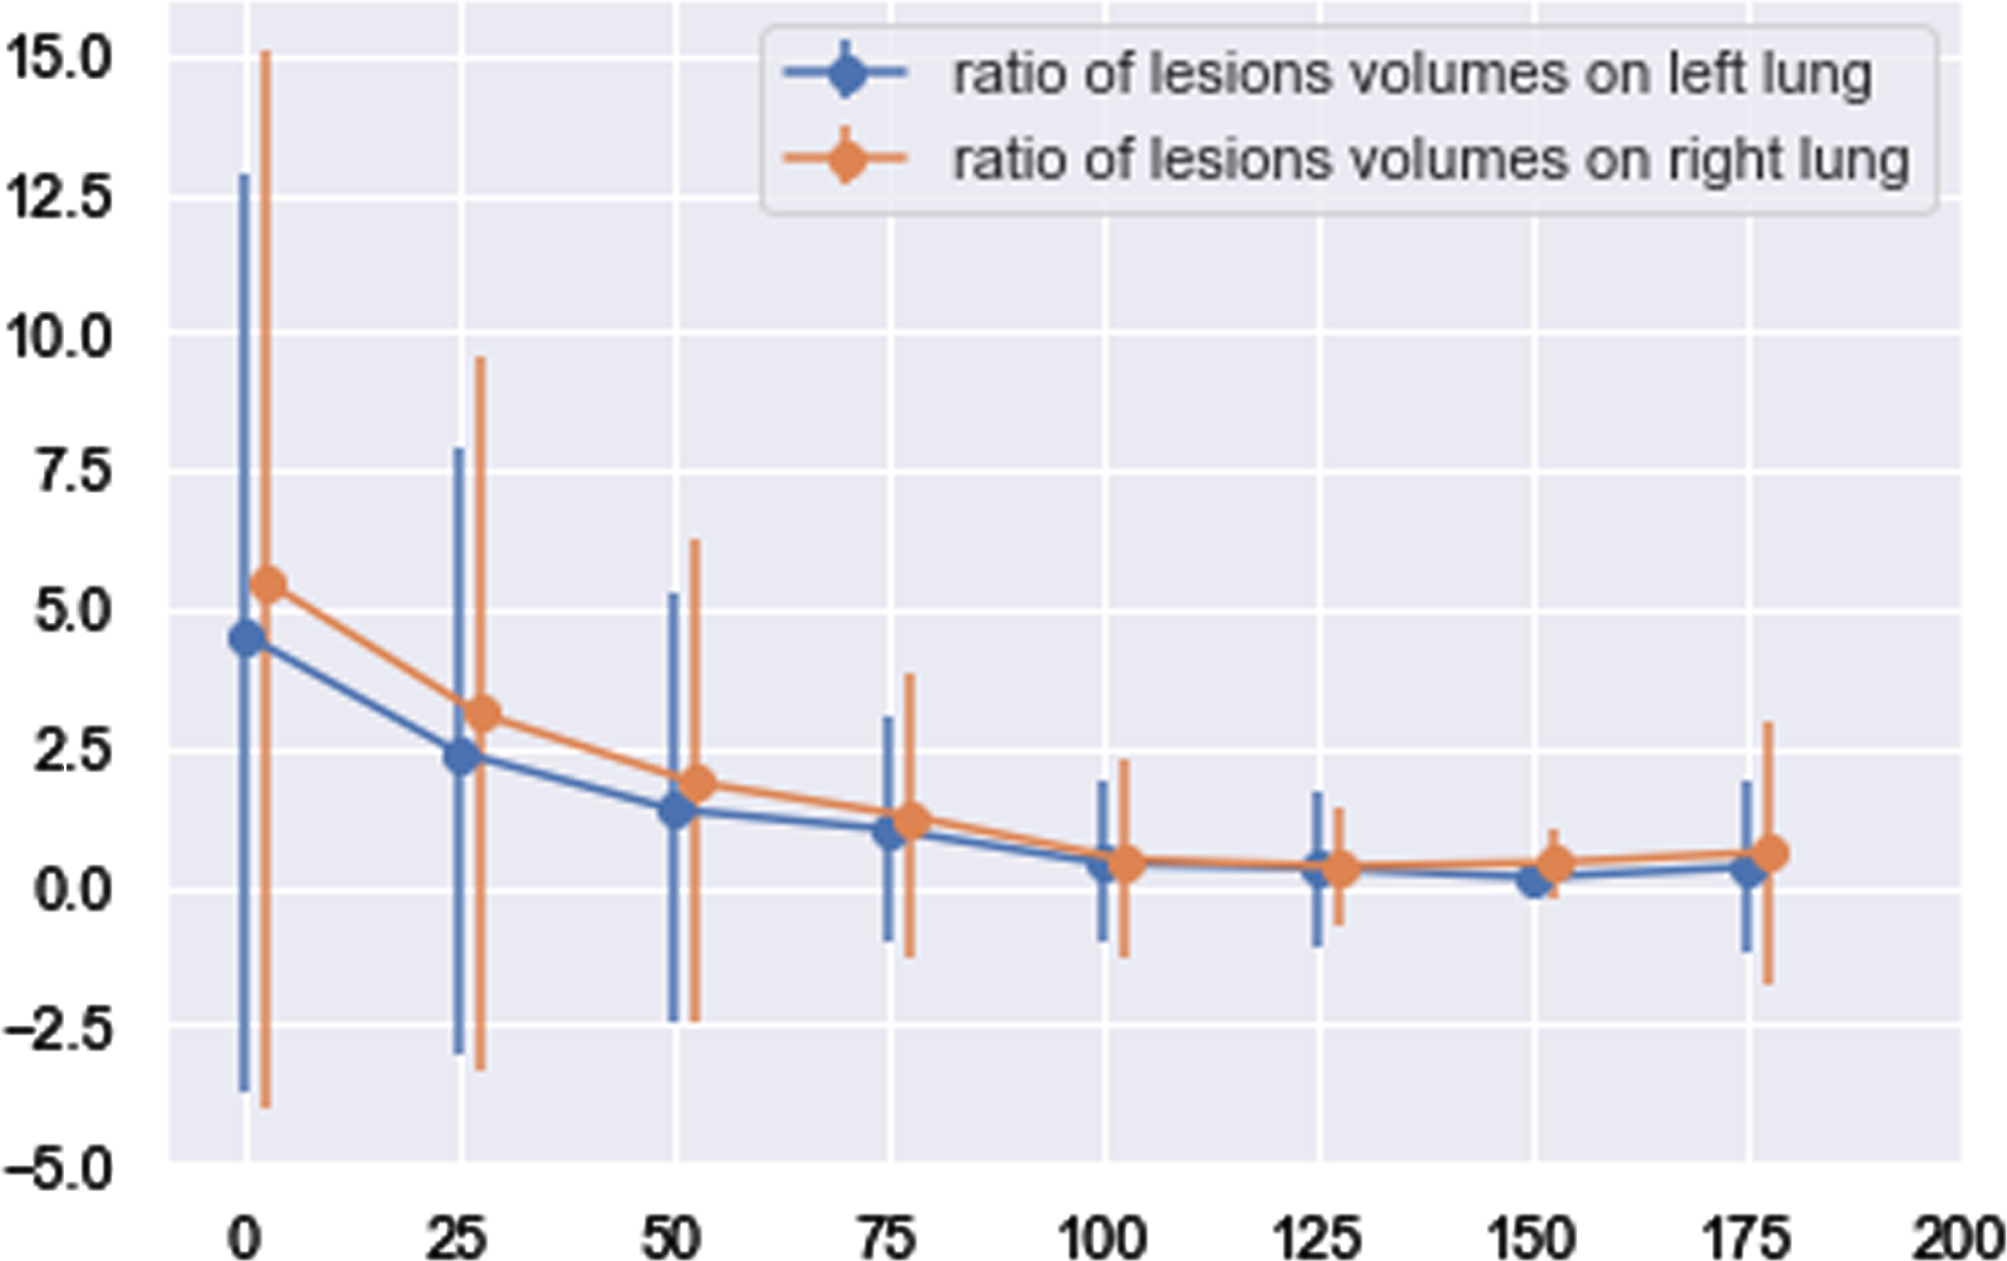
Table 7
P-values of lesions volumes of left and right lungs overall
| 0 | 25 | 50 | 75 | 100 | 125 | 150 | 175 | 200 | |
| P value | 0.003 | 0.0003 | 0.0012 | 0.39 | 0.42 | 0.87 | 0.57 | 0.11 | – |
3.3.2Tendency of lung lesions changing on patients divided by gender
The 268 patients were also divided into male and female subgroups with purpose of exploring whether volumes of lung lesions caused by COVID-19 would be different between genders, and the results are shown in detail in Fig. 12 and Table 8. For both male and female, mean volumes of right lung lesions were always bigger than that of left lung and significant differences between them were observed at discharged date and first period. In addition, right lung of male recovered to the same health level with left lung faster than that of female, due to that statistical significance was observed in female but not in male after first period. However, differences between volumes of lung lesions for female and male were not significant not only in left lung, but also in right lung.
Fig. 12
Tendency of lung lesions changing for gender-based subgroups.
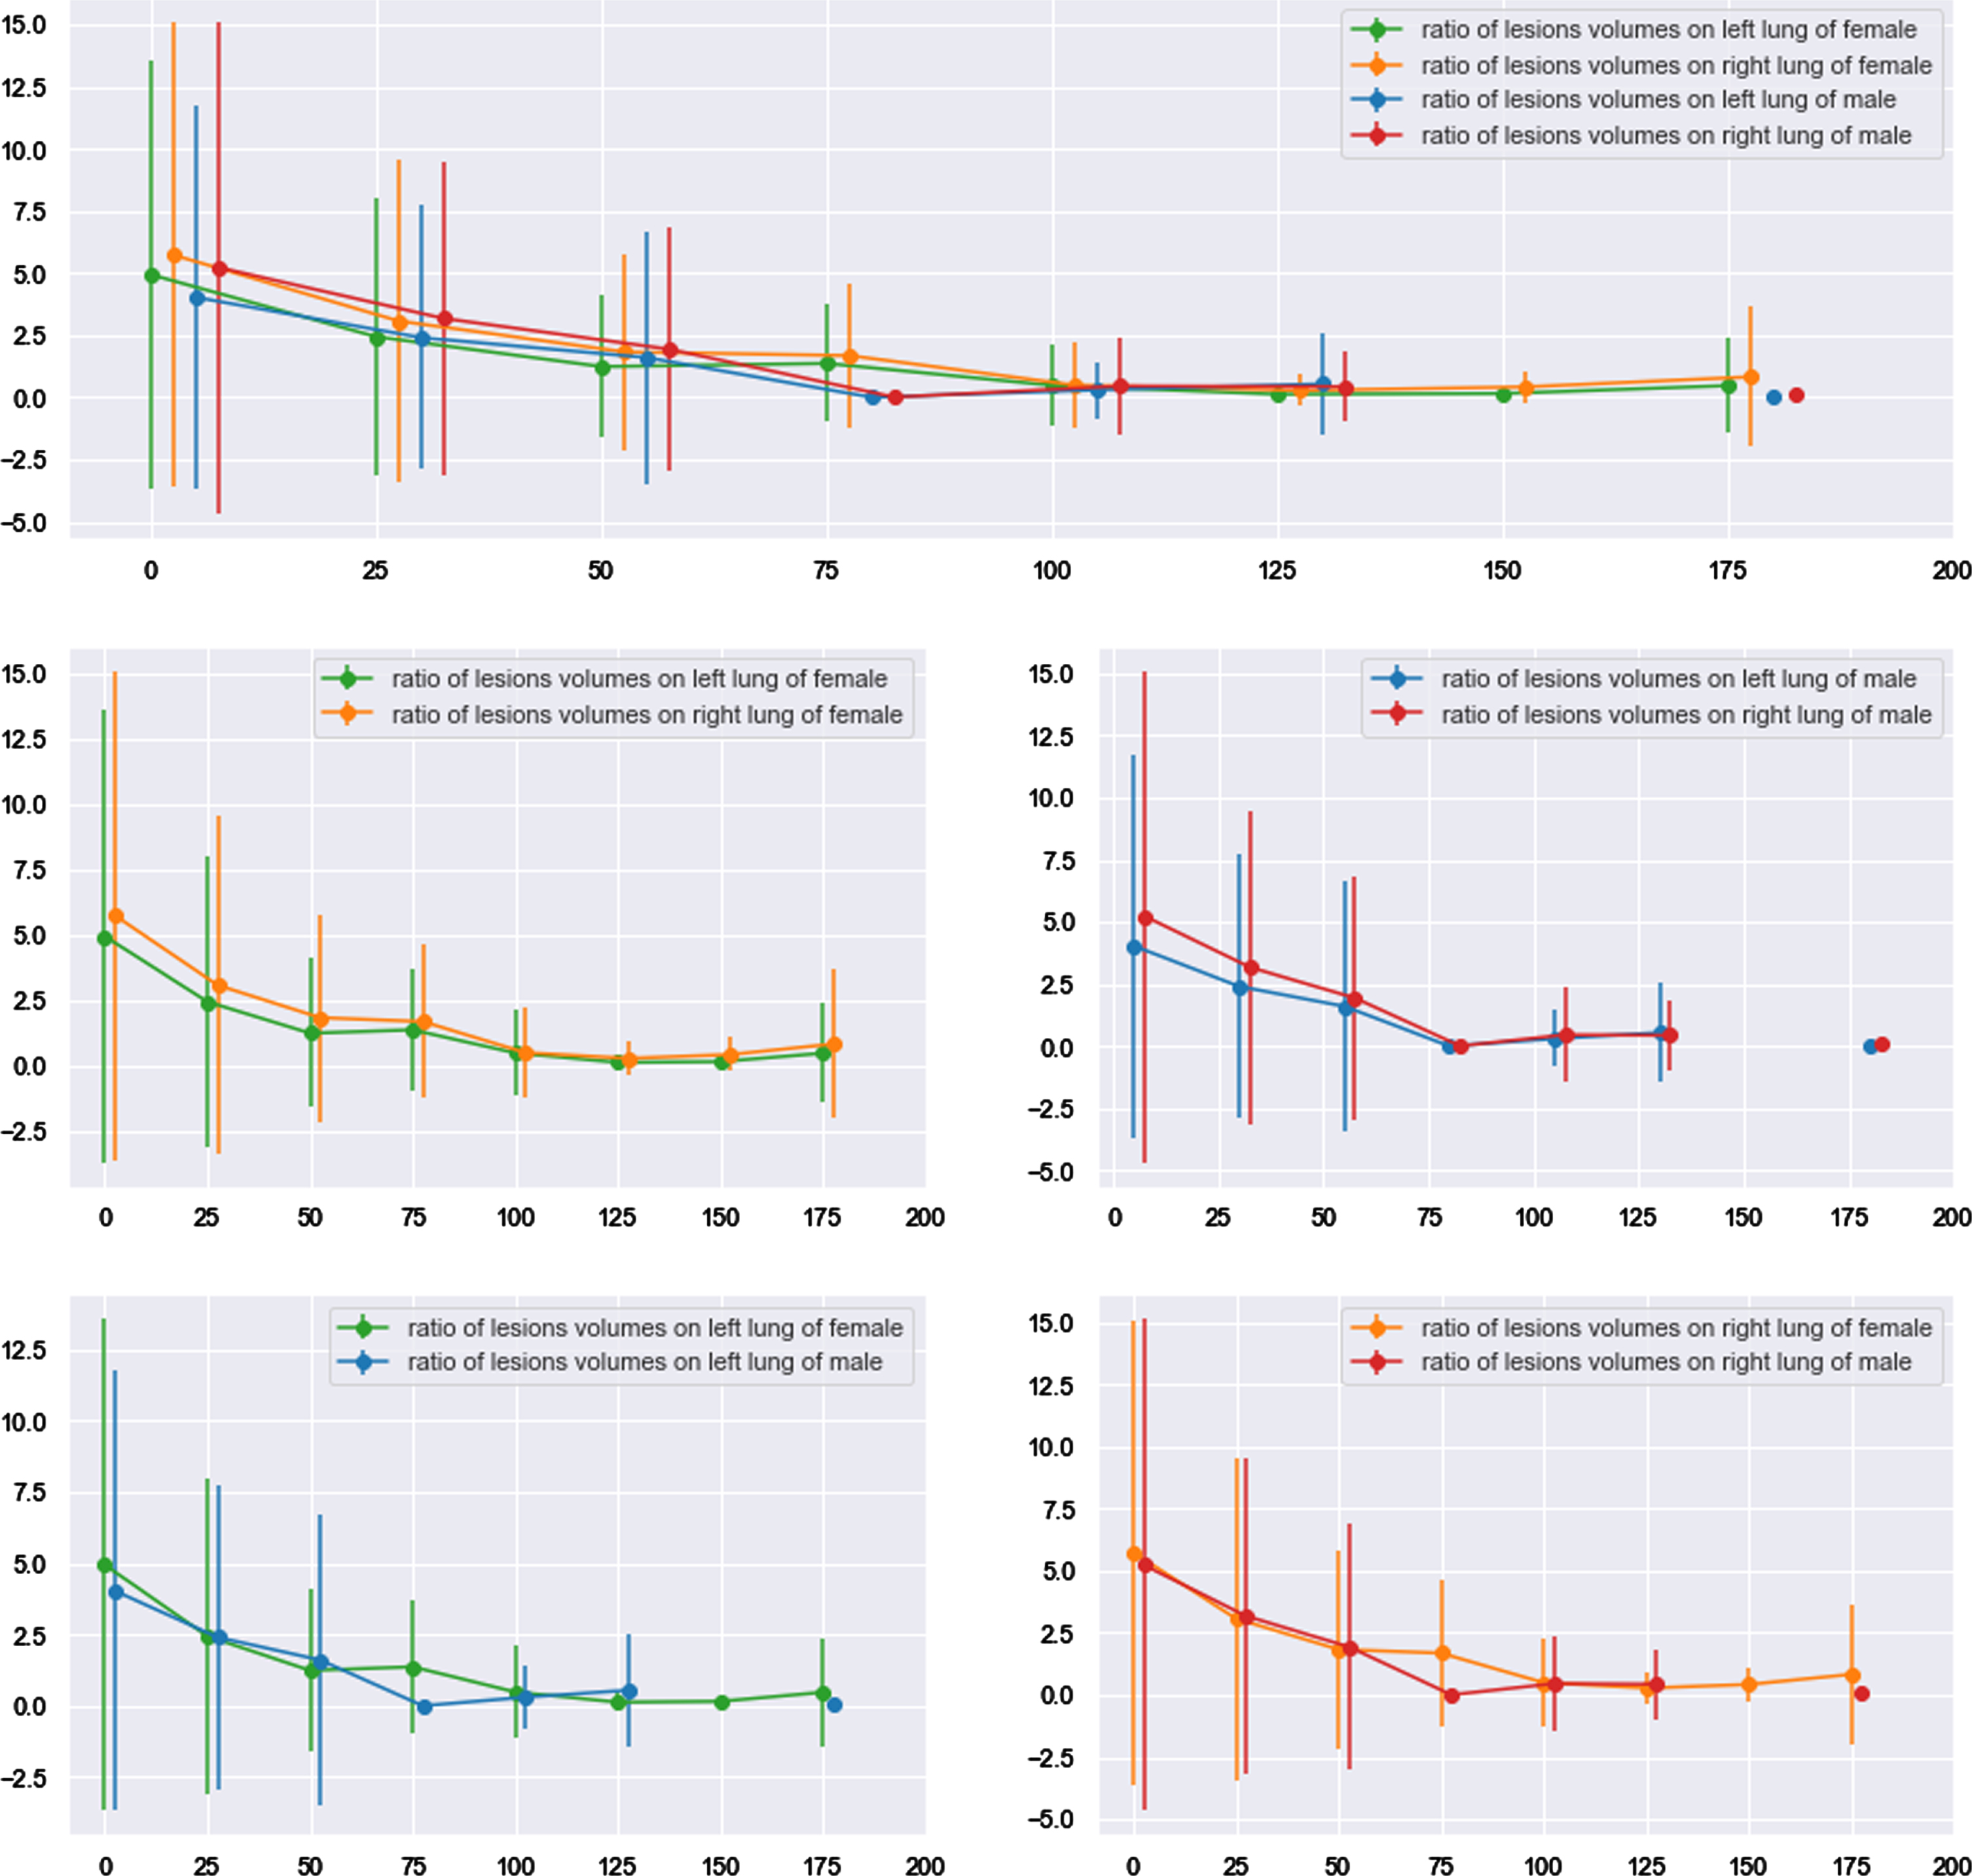
Table 8
P-values of left and right lung lesions volumes for gender-based subgroups
| 0 | 25 | 50 | 75 | 100 | 125 | 150 | 175 | 200 | |
| Left and right lungs of female | 0.05 | 0.01 | 0.01 | 0.43 | 0.9 | 0.06 | 0.57 | 0.15 | – |
| Left and right lungs of male | 0.02 | 0.01 | 0.14 | – | 0.29 | 0.67 | – | 0.24 | – |
| Left lungs of female and male | 0.37 | 0.95 | 0.56 | – | 0.5 | 0.19 | – | 0.51 | – |
| Right lungs of female and male | 0.67 | 0.88 | 0.88 | – | 0.91 | 0.52 | – | 0.48 | – |
3.3.3Tendency of lung lesions changing on patients divided by age
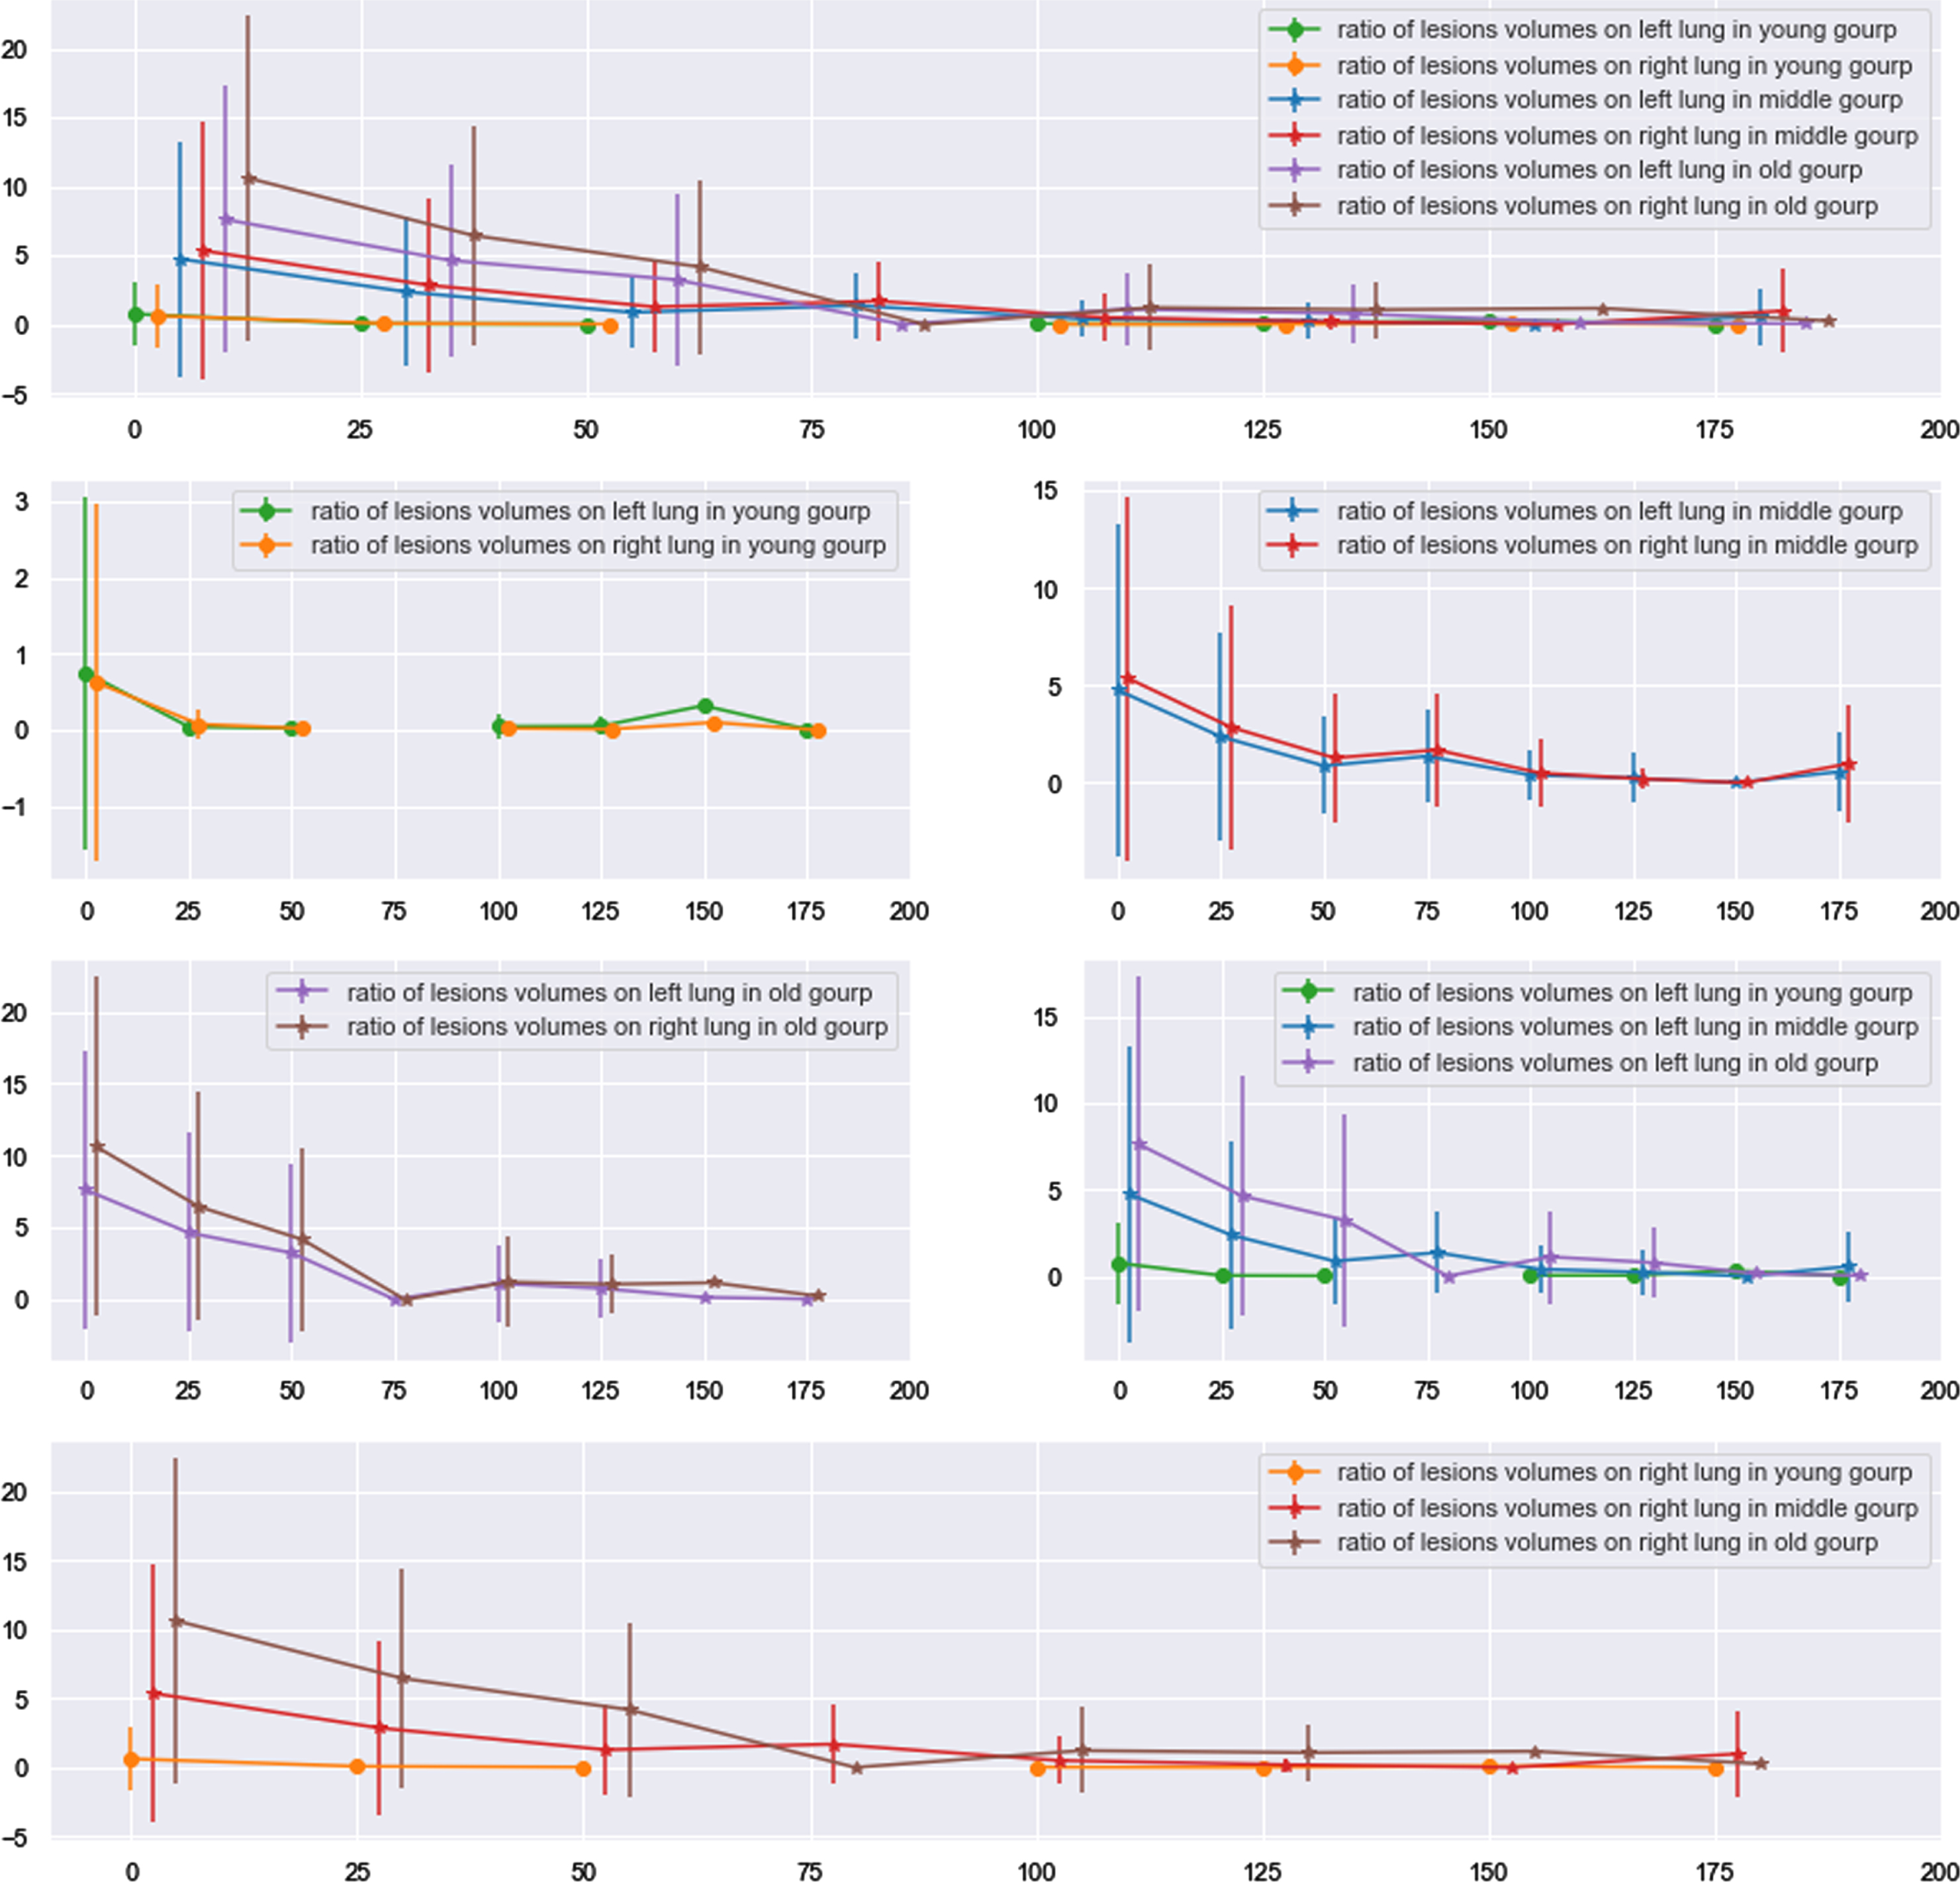
Definitely, age is an unignorable factor in researching of infectious diseases including COVID-19. The whole patients were assigned into three subgroups age_30, age_60 and age_90 which represented ages of patients in the subgroups are smaller than or equal to 30, larger than 30 but smaller than or equal to 60 and larger than 60 but smaller than or equal to 90 respectively, and were named young group, middle group and old group in order. As the Fig. 13 showing, In the young group, differences of lesions volumes between right and left lungs were not significant through the whole time series since hospital discharged (P values > 0.05 for all time). When comparing across subgroups, a regular phenomenon was found. Comparing young and middle groups, there are significant differences in volumes of lesions for both left and right lungs at date of discharged (Pleft lung value 0.001; Pright lung value: 0.003) and first period (Pleft lung value 0.0004; Pright lung value: 0.0003). With respect to contrasting middle and old groups, except in the date of discharged and first period, statistical significance of lung lesions volumes was also observed in second period (Pleft lung value 0.002; Pright lung value: 0.001). In addition, statistical difference of lung lesions volumes was also existing in fourth period (P values are 0.03), besides in date of discharged and first two periods (third period did not have P value due to lacking data), for young and old subgroups.
Fig. 13
Tendency of lung lesions changing for age-based subgroups.
3.3.4Tendency of lung lesions changing on patients divided by underlying disease
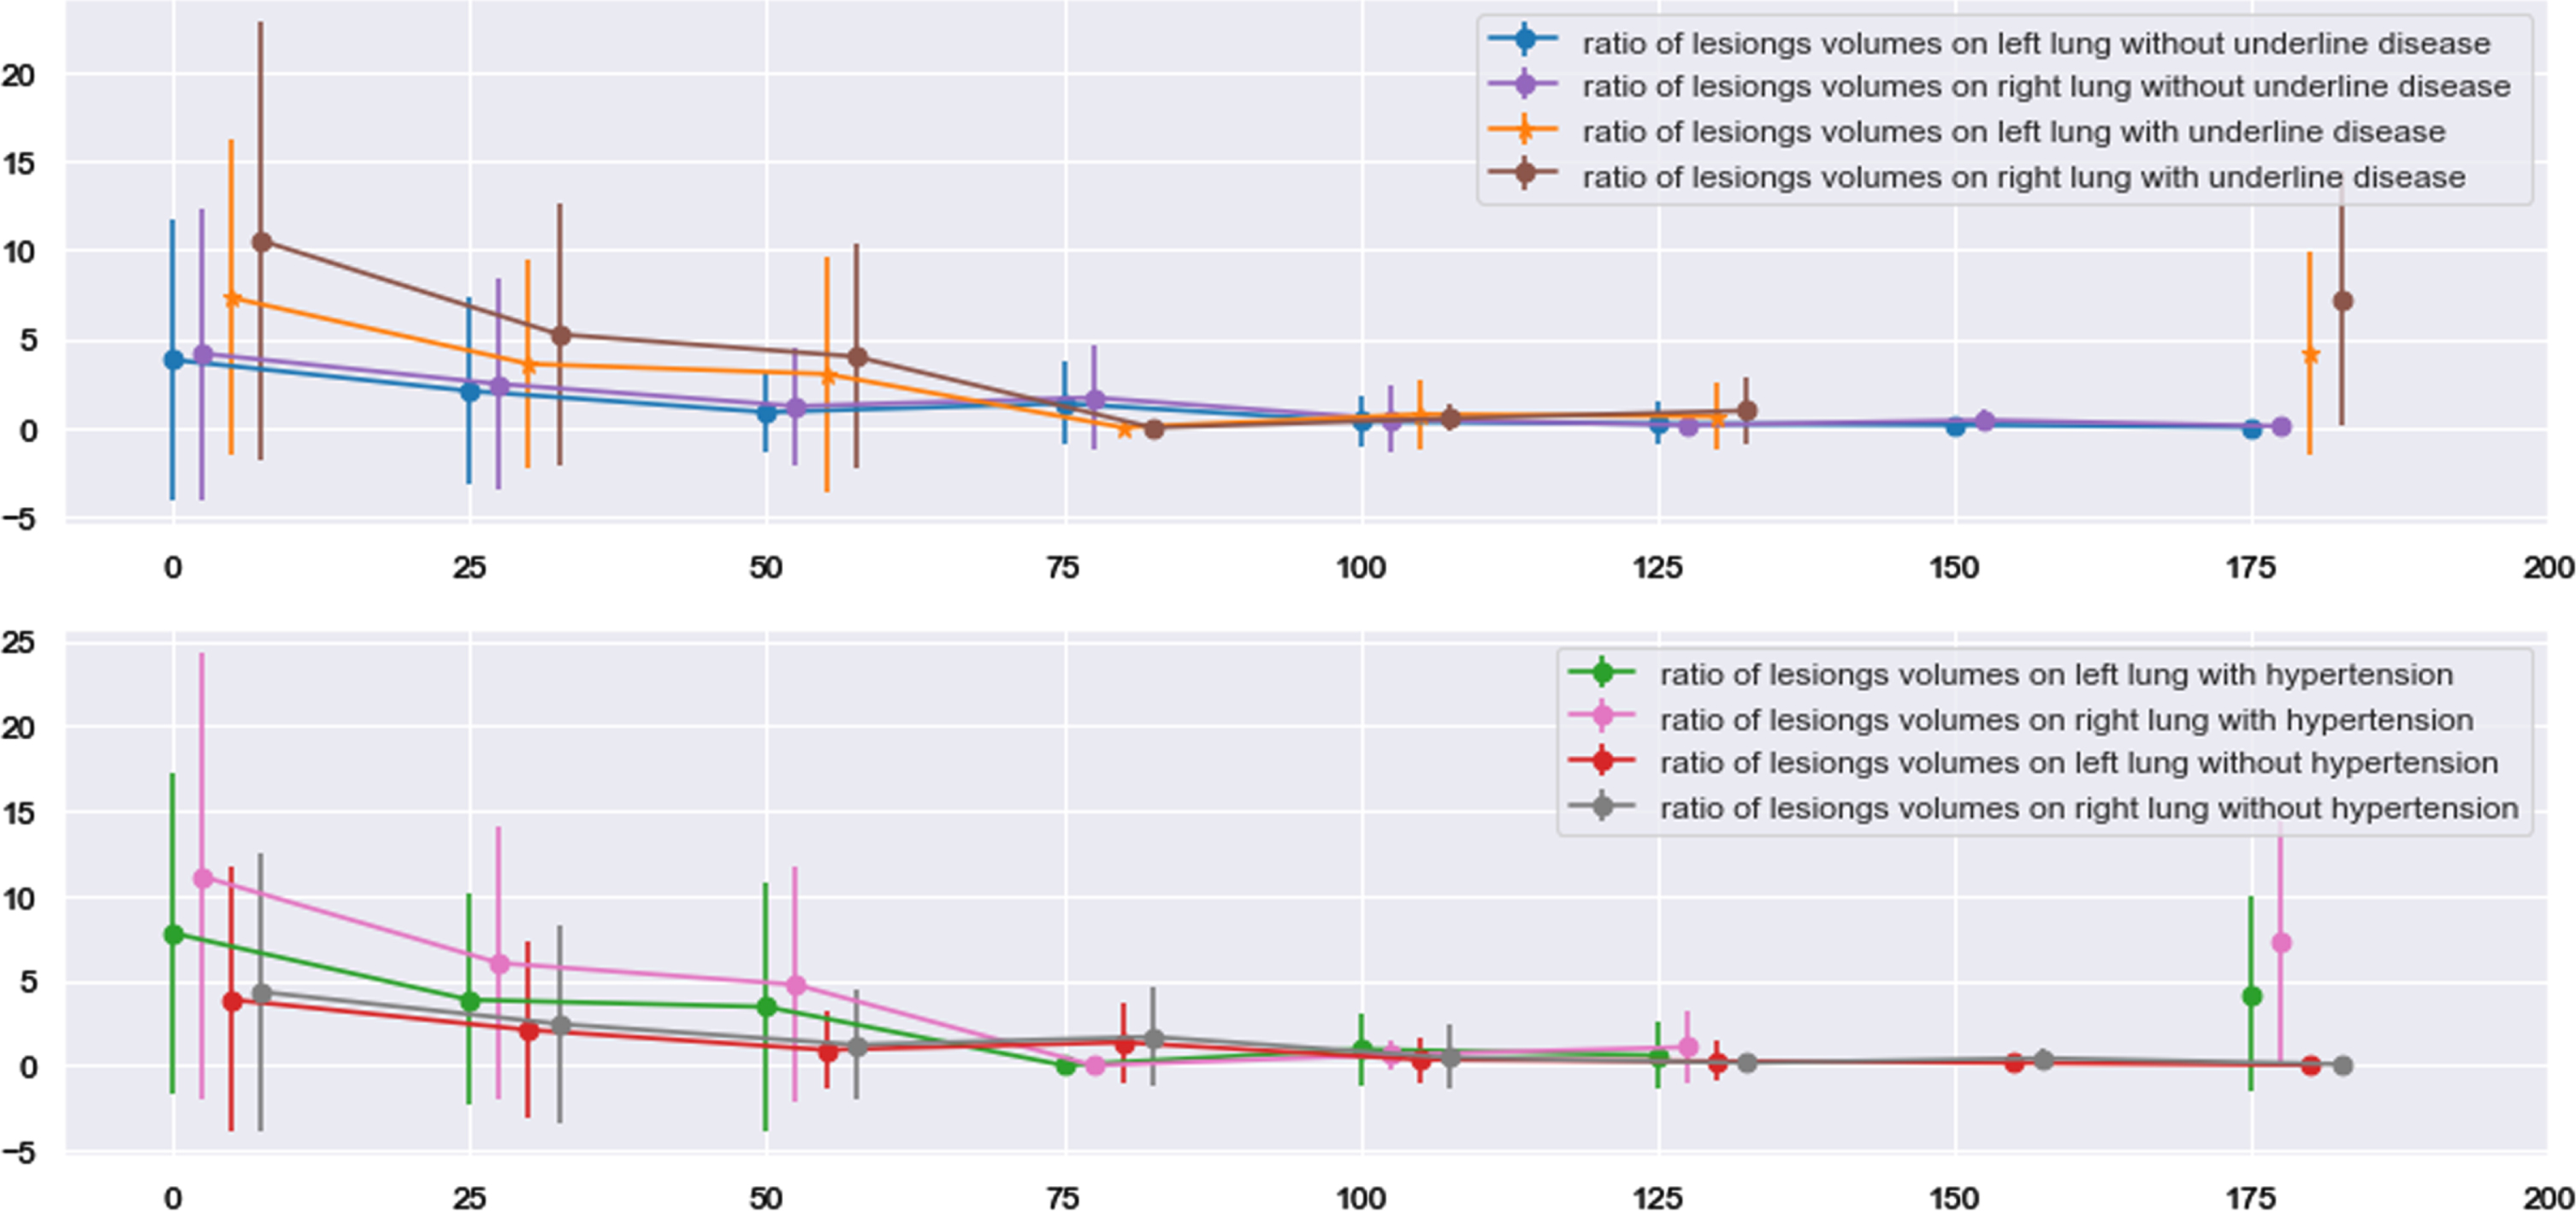
As mentioned in 3.2.3, 57 patients had at least one underlying disease of hypertension, diabetes, CVD and COPD before infected COVID-19. Only one and four of them suffered from COPD and CVD respectively and these two diseases were not considered during analyzing. In Fig. 14, hypertension was chosen as an instance, volumes of lung lesions for patients with underlying diseases were bigger than that for patients without underlying diseases and statistical significance was observed until the third period. Moreover, comparing volumes of lesions between left and right lungs, statistical significance was observed in patients with underlying diseases at date of discharged (P value: 0.001) and first two periods (P values: 0.002; 0.04) which is consistent with results in section 3.3.1.
Fig. 14
Tendency of lung lesions changing for age-based subgroups.
4Discussion
Monitoring the health condition of patients discharged from hospital for a period of time is meaningful for not only researching continuous effects of COVID-19 on recovery, but also assisting treatment of COVID-19 in hospital. Furthermore, potential threats of COVID-19 were overestimated which had resulted disorder in mental health, especially for anxiety and depressive individuals [35, 36]. A deeper understanding of residual effects of COVID-19 is an effective way to reveal its potential threats and avoid disorder in mental health. In this study, multiple statistical investigative methods, such as chi-square test, t-test, linear regression and interval estimation, were used to explore changes of hematologic parameters and volume of lung lesions after discharged. As the result, all laboratory measured data (hematologic parameters and CT images) showed that residual influence and prognosis of COVID-19 pneumonia depends on many factors (e.g., age, gender, severity, underlying diseases, side of lung and so on) and should be discussed case by case. According to this study, criterion of hospital discharge and healthcare strategy for hospital released patients should be flexible in different cases instead of uniform.
Regardless of patient’s age and gender, it is better to do routine blood test many times within one month to monitor the recovery condition of the immune system. Be consistent with the study of C. Munayco et al. [37], female patients recovered better in T lymphocyte subset from COVID-19 than male after discharge, especially in T helper lymphocyte%, implying that residual effects of COVID-19 are also sex-based differentiated. In clinical treatment, male should take blood test more frequently than female to monitor recovery process of T lymphocyte subset. Part of lymphocyte subsets of older patients (> 60 years) kept near or even dropped below lower bound of normal range within 75 days after released from hospital implying that discharge standard should be stricter for older patients to keep them in clinical care until their hematologic parameters keep in normal range stably. Clinician should pay equal attention to moderate and severe patients in clinical treatment, especially in neutrophils. CRP and IL-6, resuming at discharged, could be considered as marker to help in identifying whether patients could be released from hospital. It observed a statistically significant difference in CK parameters between gender-specific groups through all the time, and CK in males dominated those in females.
Besides, CT images of lungs provide an opportunity to explore COVID-19 effects on human health after hospital discharged intuitively. COVID-19 side-preference property on lung was discovered not only during hospitalization [13], but also after hospital discharge. The work of J. Li et al. [13] pointed out a positive correlation between size of right lung lesions and mortality risk. Consistently, lesions on right lung are harder to recover than that on left in the recovery phase. In this study, we found that right lung was more likely to be affected by COVID-19 than left lung and needed at least 50 days to recover to the same health condition as left lung, except patients younger than 30 years old. A reasonable explanation was provided by W. Luo et al. [38] that right lung is more likely to suffer hemorrhage in COVID-19. In addition, short, wide and straight path of right bronchus and oxygen distribution ratio might result in right lung sensitivity [38, 39]. Both in clinical treatment and care, right lung of patients over 30 years old recovered from COVID-19 slowly and some assistance could be carried on by clinician if needed. For both left and right lungs, old patients (age > 60) required at least 50 and 100 days to achieve the same health conditions with middle age (60 > age > 30) and young patients (age < 30), and middle age patients need 25 days to reach the same health levels with young patients. Compared with patients not suffering any underlying diseases, patients with underlying diseases recover slower in lung lesions and need at least 75 days to reach the same health level. Because all hematologic parameters have stayed in normal range stably when volume ratio of lesions getting close to 0, the lesions on lung totally disappear could be considered as an indicator of full recovery of COVID-19 after discharge.
5Conclusions
After analyzing hematologic indicators and lung CT images of 268 patients by dividing them into groups depending on severity, gender, age and underlying disease respectively, we found that residual effects of COVID-19 on discharge patients were differentiated under different cases. It is better to suggest that Criterion of hospital discharge and strategy of clinical care should be flexible in different cases instead of uniform. Specifically, male was recommended to take more times blood test than female and the time length of monitoring elderly patients should be not less than three months. Left and right lungs would be affected by COVID-19 unequally and always need more than one or two months for right lung recover as health as left lung. Overall, lesions on both right and left lungs needed at least 125 days to disappear which could be considered as indicator of full recovery from COVID-19. Revealing remaining effects of COVID-19 is an effective way to eliminate disorder of mental health caused by COVID-19 infection.
Acknowledgments
The research was supported by Shenzhen Science and Technology Program (Grant No. KQTD2017033110081833) as well as partially supported by the Intramural Research Program of the Lister Hill National Center for Biomedical Communications (LHNCBC) at the U.S. National Library of Medicine (NLM), National Institutes of Health (NIH). The content is solely the responsibility of the authors and does not necessarily represent the official views of the Shenzhen Science and Technology Program.
Conflicts of interest
All authors have read the journal’s policy on disclosure of potential conflicts of interest and have none to declare.
Ethical approval
This study was approved by the local Institutional Review Board with a waiver of informed consent.
References
[1] | Ejtahed H-S. , Hasani-Ranjbar S. , Siadat S.D. and Larijani B. The most important challenges ahead of microbiome pattern in the post era of the COVID-19 pandemic, Journal of Diabetes & Metabolic Disorders 19: (2) ((2020) ), 2031–2033. |
[2] | Verna E.C. , Serper M. , Chu J. et al., Clinical research in hepatology in the COVID-19 pandemic and post-pandemic era: Challenges and the need for innovation, Hepatology 72: (5) ((2020) ), 1819–1837. |
[3] | Wang Y. , Dong C. , Hu Y. et al., Temporal changes of CT findings in 90 patients with COVID-19 pneumonia: A longitudinal study, Radiology 296: (2) ((2020) ), E55–64. |
[4] | Zeng F. , Li L. , Zeng J. et al., Can we predict the severity of coronavirus disease 2019 with a routine blood test? Polish Archives of Internal Medicine 130: (5) ((2020) ), 400–406. |
[5] | Ok F. , Erdogan O. , Durmus E. et al., Predictive values of blood urea nitrogen/creatinine ratio and other routine blood parameters on disease severity and survival of COVID-19 patients, Journal of Medical Virology 93: (2) ((2021) ), 786–793. |
[6] | Ferrari D. , Motta A. , Strollo M. et al., Routine blood tests as a potential diagnostic tool for COVID-19, Clinical Chemistry and Laboratory Medicine (CCLM) 58: (7) ((2020) ), 1095–1099. |
[7] | Lu G. and Wang J. Dynamic changes in routine blood parameters of a severe COVID-19 case, Clin Chim Acta 508: ((2020) ), 98–102. |
[8] | Zhao Y. , Zhou J. , Pan L. et al., Detection and analysis of clinical features of patients with different types of coronavirus disease 2019, Journal of Medical Virology 93: (1) ((2021) ), 401–408. |
[9] | Sun D.W. , Zhang D. , Tian R.H. et al., The underlying changes and predicting role of peripheral blood inflammatory cells in severe COVID-19 patients: A sentinel? Clin Chim Acta 508: ((2020) ), 122–129. |
[10] | Zheng H.Y. , Zhang M. , Yang C.X. et al., Elevated exhaustion levels and reduced functional diversity of T cells in peripheral blood may predict severe progression in COVID-19 patients, Cellular & Molecular Immunology 17: (5) ((2020) ), 541–543. |
[11] | Brinati D. , Campagner A. , Ferrari D. et al., Detection of COVID-19 infection from routine blood exams with machine learning: A feasibility study, Journal of Medical Systems 44: (8) ((2020) ), 135. |
[12] | Wei J. , Yang H. , Lei P. et al., Analysis of thin-section CT in patients with coronavirus disease (COVID-19) after hospital discharge, Journal of X-ray Science and Technology 28: (3) ((2020) ), 383–389. |
[13] | Li J. , Yu X. , Hu S. et al., COVID-19 targets the right lung, Critical Care 24: ((2020) ), 339. |
[14] | Yang Y. , Lure F. , Miao H. et al., Using artificial intelligence to assist radiologists in distinguishing COVID-19 from other pulmonary infections, Journal of X-Ray Science and Technology 29: (1) ((2021) ), 1–17. |
[15] | Feng X. , Li S. , Sun Q. et al., Immune-inflammatory parameters in COVID-19 cases: a systematic review and meta-analysis, Frontiers in Medicine 7: ((2020) ), 301. |
[16] | Vafadar Moradi, E. , Teimouri, A. , Rezaee, R. et al., Increased age, neutrophil-to-lymphocyte ratio (NLR) and white blood cells count are associated with higher COVID-19 mortality, American Journal of Emergency Medicine 40: ((2021) ), 11–14. |
[17] | Channappanavar R. , Fett C. , Mack M. et al., Sex-based differences in susceptibility to severe acute respiratory syndrome coronavirus infection, Journal of Immunology 198: (10) ((2017) ), 4046–4053. |
[18] | Jaillon S. , Berthenet K. and Garlanda C. Sexual dimorphism in innate immunity, Clinical Reviews in Allergy & Immunology 56: (3) ((2019) ), 308–321. |
[19] | Chen N. , Zhou M. , Dong X. et al., Epidemiological and clinical characteristics of 99 cases of 2019 novel coronavirus pneumonia in Wuhan, China: a descriptive study, The Lancet 395: (10223) ((2020) ), 507–513. |
[20] | Wynants L. , Van Calster B. , Collins G.S. et al., Prediction models for diagnosis and prognosis of covid-19: systematic review and critical appraisal, BMJ (2020), m1328. |
[21] | Zhou F. , Yu T. , Du R. et al., Clinical course and risk factors for mortality of adult inpatients with COVID-19 in Wuhan, China: a retrospective cohort study, The Lancet 395: (10229) ((2020) ), 1054–1062. |
[22] | Guo W. , Li M. , Dong Y. et al., Diabetes is a risk factor for the progression and prognosis of COVID-19, Diabetes/Metabolism Research and Reviews 36: (7) ((2020) ), e3319. |
[23] | Singh A.K. , Gupta R. , Ghosh A. and Misra A. Diabetes in COVID-19: Prevalence, pathophysiology, prognosis and practical considerations, Diabetes & Metabolic Syndrome: Clinical Research & Reviews 14: (4) ((2020) ), 303–310. |
[24] | Xiang T.X. , Liu J.M. , Xu F. et al., Analysis of clinical characteristics of 49 patients with coronavirus disease in Jiangxi, Chinese Journal of Respiratory and Critical Care Medicine 19: (2) ((2020) ), 154–160. |
[25] | Qu R. , Ling Y. , Zhang Y. et al., Platelet-to-lymphocyte ratio is associated with prognosis in patients with coronavirus disease-19, Journal of Medical Virology 92: (9) ((2020) ), 1533–1541. |
[26] | Zhang H. , Liu X. , Yu P. et al., Dynamic CT assessment of disease change and prognosis of patients with moderate COVID-19 pneumonia, Journal of X-ray Science and Technology 28: (5) ((2020) ), 851–861. |
[27] | Rosales C. Neutrophil: a cell with many roles in inflammation or several cell types? Frontiers in Physiology 9: ((2018) ), 113. |
[28] | Hemmat N. , Derakhshani A. , Bannazadeh Baghi H. et al., Neutrophils, crucial, or harmful immune cells involved in coronavirus infection: a bioinformatics study, Frontiers in Genetics 11: ((2020) ), 641. |
[29] | Cavalcante-Silva L.H.A. , Carvalho D.C.M. É de Almeida Lima, et al., Neutrophils and COVID-19: The road so far, International Immunopharmacology 90: ((2021) ), 107233. |
[30] | Wang J. , Jiang M. , Chen X. and Montaner L.J. Cytokine storm and leukocyte changes in mild versus severe SARS-CoV-2 infection: Review of 3939 COVID-19 patients in China and emerging pathogenesis and therapy concepts, J Leukoc Biol 108: ((2020) ), 17–41. |
[31] | Singh K. , Mittal S. , Gollapudi S. et al., A meta-analysis of SARS-CoV-2 patients identifies the combinatorial significance of D-dimer, C-reactive protein, lymphocyte, and neutrophil values as a predictor of disease severity, Int J Lab Hematol 43: (2) ((2021) ), 324–328. |
[32] | Guan J. , Wei X. , Qin S. et al., Continuous tracking of COVID-19 patients’ immune status, Int Immunopharmacol 89: (Pt A) ((2020) ), 107034. |
[33] | Gadi N. , Wu S.C. , Spihlman A.P. and Moulton V.R. What’s sex got to do with COVID-19? Gender-based differences in the host immune response to coronaviruses, Frontiers in Immunology 11: ((2020) ), 2147. |
[34] | Zeng Z. , Yu H. , Chen H. et al., Longitudinal changes of inflammatory parameters and their correlation with disease severity and outcomes in patients with COVID-19 from Wuhan, China, Critical Care 24: ((2020) ), 525. |
[35] | Daly M. , Sutin A.R. and Robinson E. Longitudinal changes in mental health and the COVID-19 pandemic: evidence from the UK household longitudinal study, Psychological Medicine (2020), 1–10. doi:10.1017/s0033291720004432. |
[36] | Bendau A. , Kunas S.L. , Wyka S. et al., Longitudinal changes of anxiety and depressive symptoms during the COVID-19 pandemic in Germany: The role of pre-existing anxiety, depressive, and other mental disorders, Journal of Anxiety Disorders 79: ((2021) ), 102377. |
[37] | Munayco C. , Chowell G. , Tariq A. et al., Risk of death by age and gender from CoVID-19 in Peru, March-May, Aging 12: (14) ((2020) ), 13869–13881. |
[38] | Luo W. , Yu H. , Gou J. et al., Clinical pathology of critical patient with novel coronavirus pneumonia (COVID-19), Preprints, (2020), 202002.0407. |
[39] | Chen C.H. , Lai C.L. , Tsai T.T. et al., Foreign body aspiration into the lower airway in Chinese adults, Chest 112: (1) ((1997) ), 129–133. |


