
COVID-19 diagnosis from chest X-ray images using transfer learning: Enhanced performance by debiasing dataloader
Abstract
BACKGROUND:
Chest X-ray imaging has been proved as a powerful diagnostic method to detect and diagnose COVID-19 cases due to its easy accessibility, lower cost and rapid imaging time.
OBJECTIVE:
This study aims to improve efficacy of screening COVID-19 infected patients using chest X-ray images with the help of a developed deep convolutional neural network model (CNN) entitled nCoV-NET.
METHODS:
To train and to evaluate the performance of the developed model, three datasets were collected from resources of “ChestX-ray14”, “COVID-19 image data collection”, and “Chest X-ray collection from Indiana University,” respectively. Overall, 299 COVID-19 pneumonia cases and 1,522 non-COVID 19 cases are involved in this study. To overcome the probable bias due to the unbalanced cases in two classes of the datasets, ResNet, DenseNet, and VGG architectures were re-trained in the fine-tuning stage of the process to distinguish COVID-19 classes using a transfer learning method. Lastly, the optimized final nCoV-NET model was applied to the testing dataset to verify the performance of the proposed model.
RESULTS:
Although the performance parameters of all re-trained architectures were determined close to each other, the final nCOV-NET model optimized by using DenseNet-161 architecture in the transfer learning stage exhibits the highest performance for classification of COVID-19 cases with the accuracy of 97.1 %. The Activation Mapping method was used to create activation maps that highlights the crucial areas of the radiograph to improve causality and intelligibility.
CONCLUSION:
This study demonstrated that the proposed CNN model called nCoV-NET can be utilized for reliably detecting COVID-19 cases using chest X-ray images to accelerate the triaging and save critical time for disease control as well as assisting the radiologist to validate their initial diagnosis.
1Introduction
The new coronavirus disease 2019 (COVID-19) caused by severe acute respiratory syndrome coronavirus 2 (SARS-CoV-2) has spread all over the world and has become a global public health issue [1]. COVID-19 that has been declared as a pandemic by World Health Organization (WHO) on 11th March 2020 leads clinical symptoms such as acute respiratory disorder, fever, cough, sore throat, headache, fatigue, muscle pain, and shortness of breath [1–3]. According to the statistical reports, it has been reported that one of the most crucial step in the fight against the COVID-19 is early identifying the infected individuals and commencement of treatment procedures in severe cases as well as quarantine procedures to mitigate the spread [3–6].
Diagnosis procedure of COVID-19 disease mainly follows these steps; i) clinical symptoms; ii) epidemiological history, and iii) viral nucleic acid test or CT images [7–9]. Although the real-time reverse transcription- polymerase chain reaction (RT-PCR) test is mainly accepted as a standard diagnostic method, it has several shortcomings such as lack of test kits for tens of thousands of suspected patients especially in hyper-affected areas, availability in rural areas, and lower sensitivity (60%–70%), reproducibility, and specificity compared to CT chest images [1, 10–11]. Moreover, the RT-PCR method has a quite complicated manual and time-consuming process and shows relatively low positive detection rates in early stages of the disease [9, 10]. Another major tool utilized for COVID-19 screening is the radiological imaging techniques where chest x-ray or CT can be conducted [12, 13]. The obtained images or scans need to be analyzed by radiologist to detect the visual radiograph pattern associated with SARS-CoV-2 viral infection. However, it is not easy to distinguish COVID-19 pneumonia from other types of pneumonia since they are similar to each other and sometimes certain manifestations may overlap with other lung infections [9].
CT techniques take considerably more time than x-ray imaging as well as in many under-developed countries/regions or rural areas CT may not be available whereas x-ray imaging considered standard equipment in most healthcare systems is a widely available and low-cost radio-diagnostic technique [11]. With the help of the utilization of the x-ray imaging technique for COVID-19 detection, the triage step could be accelerated so the application of the treatment, and taking measures could significantly speed up. Furthermore, the portable roentgen systems enable us to perform diagnosis in an isolation room, home, etc. so that the transmission risk could be remarkably reduced [12]. However, the biggest challenge faced is it is required expert radiologists to evaluate the x-ray images. In some cases, the quality of radiographs may not be high enough to evaluate accurately by radiologists.
Bearing all of this information in mind, it can be concluded that the developing of deep learning models is of great importance to the screening and diagnosis of all infections, especially COVID-19 in early stages. Specifically, CNN capable to enhance the quality of low-light images helps to identify the hallmarks of disease that might be difficult for visual recognition [13]. By implementation of deep learning models in the healthcare system, not only the quality of healthcare and the welfare of the patients can be improved but also the diagnostic can be more effective [14]. Additionally, it is possible to lower healthcare costs by means of utilizing artificial intelligence and machine learning models in such systems. Especially the healthcare system still needs such practical solutions for rapid, cost-effective, diagnosis, treatment, and quarantine measures of COVID -19 pneumonia cases. Hence, for onsite applications it is critical developing a fast automated tool that can process chest x-ray images and detect COVID-19 pneumonia. Deep-learning algorithms intended to analyze the radiodiagnostic images to screen the disease in the early-stage is revolutionary [15]. These algorithms should be fueled by big datasets to train themselves to attain a particular task. During the last decades, in literature, there has been a number of studies based on deep learning motivated by the requirement of rapid diagnosis by means of medical imaging [9, 16]. The results obtained by chest CT scans have been shown to be very promising in terms of accuracy in detecting the patients infected with COVID-19 [1, 9, 17, 18]. On the other hand, an artificial intelligence model based on chest x-ray images will provide a method to assist clinicians in improved screening, as it can diagnose cases of COVID -19 pneumonia quickly and cost-effectively.
The number of data and the method for classification of COVID-19 cases used in studies vary. Among the studies, the most preferred method is the convolutional neural network (CNN). In a study conducted by Jain et al., examined three different models including Inception V3, Xception, and ResNeXt for on screening of Covid-19 from Chest -ray scans. They reported Xception model has the best performance with an accuracy of 97.97% [19]. Similar to our study Minaee et al. developed a deep learning model for detection of COVID-19 infected patients from Chest x-ray images by fine-tuning four different pre-trained CNN architectures including ResNet18, ResNet50, SqueezeNet, and DenseNet-121, and they reported SqueezeNet and ResNet18 have achieved relatively higher performance that the other models [20] Quchicha et al., proposed a deep CNN model called CVDNet based on the residual neural network to classify COVID-10 infection from normal and other pneumonia cases from Chest x-ray images, and they reported that the model can classify COVID-19 class with an accuracy of 97.20% [21]. Panwar et al. also have developed a deep learning model with the same purpose. They reported that the proposed model was able to detect COVID-19 positive cases in lower than 2 seconds with an accuracy of 95.61% [22]. In another work conducted by Ozturk et al., a deep learning based model to detect and classify COVID-19 cases from X-ray images collected from “COVID-19 image data collection” database was provided. The proposed model has developed for both binary (COVID and no-findings) and multi-class (COVID, no-findings and pneumonia) cases. They reported the highest accuracy was obtained as 98.08% and 87.02% for binary classes and multi-classes, respectively [23]. In another work reported by Albahli and Albattah, a transfer learning approach was proposed. Three different deep learning architectures including Inception ResNetV2, InceptionNetV3, and NASNetLarge were selected and fine-tuned for detection of COVID-19 cases from chest x-ray images. It was declared that InceptionNetV3 yielded the best accuracy level as 98.63% [24]. Asnaoui et al., compared different deep CNN architectures including VGG16, VGG19, DenseNet201, InceptionResNetV2, InceptionV3, ResnNet50, MobileNetV2, and Xception for automatic binary classification of pneumonia images such as SARS, COVID-19. The fine-tuned version of CNN architectures exhibited high performance rate in training and validation accuracy (up to 96%) [25]. Azamin et al., implemented a deep learning model based on the ResNet101 CNN architecture for the same purpose. The training and validation datasets were collected from ChestX-ray14 database, and the accuracy of the model was reported as 71.9% [26]. Bassi et al., used ChestX-Ray14 database, too. They fine-tuned CNN architectures and applied a twice step transfer learning approach, and they reported test accuracy of 99.4% [27].
The developed nCoV-NET designed for the automatic screening of COVID-19 without requiring any handcrafted techniques helps to provide a second opinion to expert radiologists in health centers. It is predicted to significantly reduce the workload of clinicians and assist them to make an accurate diagnosis in their daily routine work.
2Materials and method
2.1Preparing of datasets
In this work, datasets collected from three different sources, including “ChestX-ray14,” “COVID-19 image data collection”, and “Chest X-ray collection from Indiana University” [28] were used for the diagnosis of COVID-19 from chest x-ray images. The first data set, ChestX-ray14 [29], consisted of 112, 120 frontal-view chest radiographs of 30, 805 patients. Only chest radiographs labeled with 1431 pneumonia were used in this data set that was labeled automatically with Natural Language Processing (NLP) techniques of radiographic interpretations received from the Picture Archiving and Communication System (PACS). The accuracy of these labels is reported to be over 90% [30]. The bit-depth of the radiographs in 16-bit Digital Imaging and Communications in Medicine (DICOM) format was reduced to 8-bit Portable Network Graphics (PNG) format without compression (without Joint Photographic Experts Group (JPEG) artifacts). At this stage, 256 times data loss was experienced.
In the second data set, called COVID-19 image data collection [31], there are 208 radiographs for COVID-19 case and 41 radiographs for non-COVID-19 (bacterial, fungal or other viral types of pneumonia) cases (with Posteroanterior (PA) and Anteroposterior (AP) views). However, this database, which also includes contralateral and lateral view chest radiographs, is created to transform the data obtained from the articles into a database for access to COVID-19 radiological data. Hence, it contains lossy-images taken from articles. In addition, it has been noticed that the some of the properties such as brightness, contrast, sharpness are modified by the authors in most of the images. It can be said that the database may be biased due to such effects. For this reason, in this study, to eliminate the probable bias problem on the database pre-processing explained in the following section have been proposed.
The third dataset, “Chest X-ray collection from Indiana University”, was used as testing dataset for non-COVID-19 cases. The cases of pneumonia in this dataset were manually detected together with the radiologists from the Akdeniz University, Turkey. 50 non-COVID-19 pneumonia cases were tagged by the experts and used as testing datasets.The collected data were classified as non-COVID-19 pneumonia and COVID-19 pneumonia. The total number of non-COVID-19 cases is 1,522 whereas the number of COVID-19 pneumonia cases is 299 (∼5.0 times less). Thanks to the structure of the selected architectures that will be used in the transfer learning and optimization step, it was aimed to avoid the unbalanced dataset problem. Whereas 199 training data,50 validation data, and 50 testing data of “COVID-19 Pneumonia” class were used, 1177 training data and 295 validation data, and 50 testing data were used for the “Other Pneumonias” class.
2.2Pre-processing
In order to solve the probable bias problem mentioned in the Section 2.1, chest x-ray radiographs without JPEG artifacts were recorded in JPEG format by changing the IMWRITE_JPEG_QUALITY value between 30 and 70 randomly with the imwrite() method in the OpenCV [32] library. Furthermore, the bias problem was tried to be solved by adding random brightness, contrast, sharpness adjustments in addition to JPEG artifacts to this data.
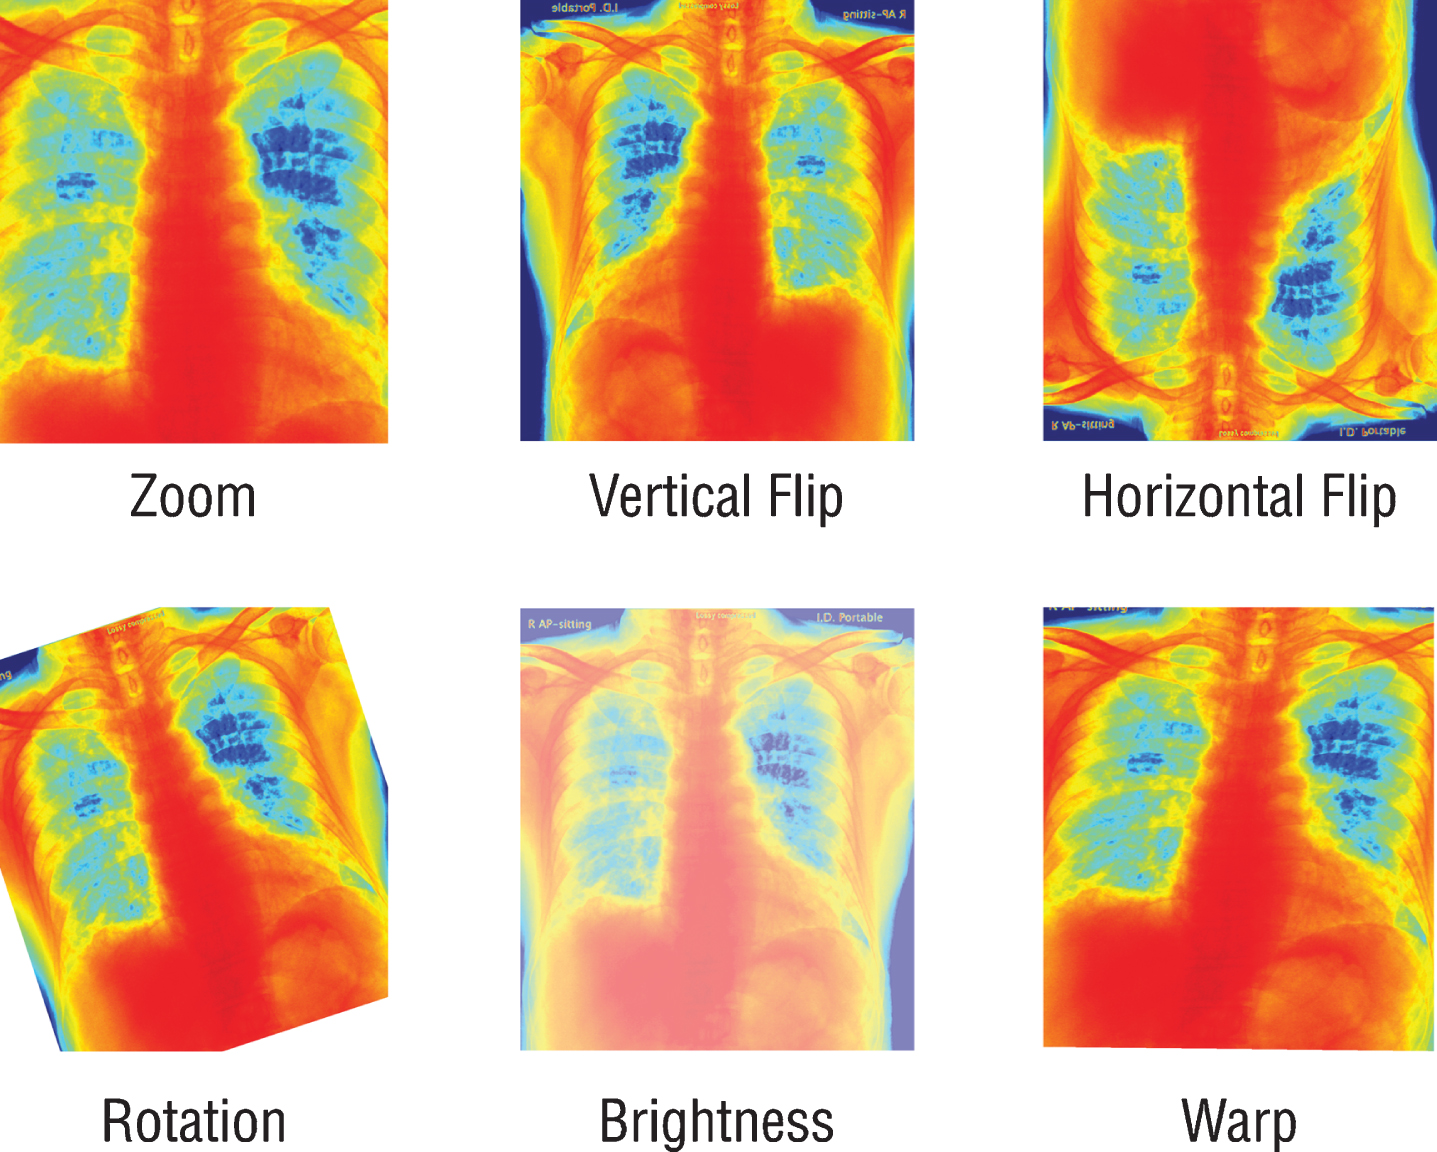
Since the previously trained Convolutional Neural Networks (CNN) networks to be used work with RGB (Red, Green, Blue) inputs, grayscale radiographs need to be colored with colormap (Fig. 1). Although all the data used are 8-bit grayscale images, the main reason for applying colormap to the graphics is to create a custom dataloader ready to work with 16-bit DICOM formats. By this way, when DICOM files are used on the model, 16-bit data can be transferred to 24-bit RGB color space without loss. It is also expected that the coloring process may provide a solution to the probable bias problem. For this purpose, all radiographs are colored with the colormap named COLORMAP_JET in the OpenCV library and transferred to 24-bit space. Due to the few numbers of data and unbalanced classes in the dataset, all the radiographs were augmented randomly by horizontal and vertical flipping, rotating, zooming, changing brightness values, and warping (Fig. 2). Since these augmentations also simulate different types of images created by different x-ray devices, it is a very crucial step to generalize the suggested model.
Fig.1
Schematic presentation of pre-processing step.
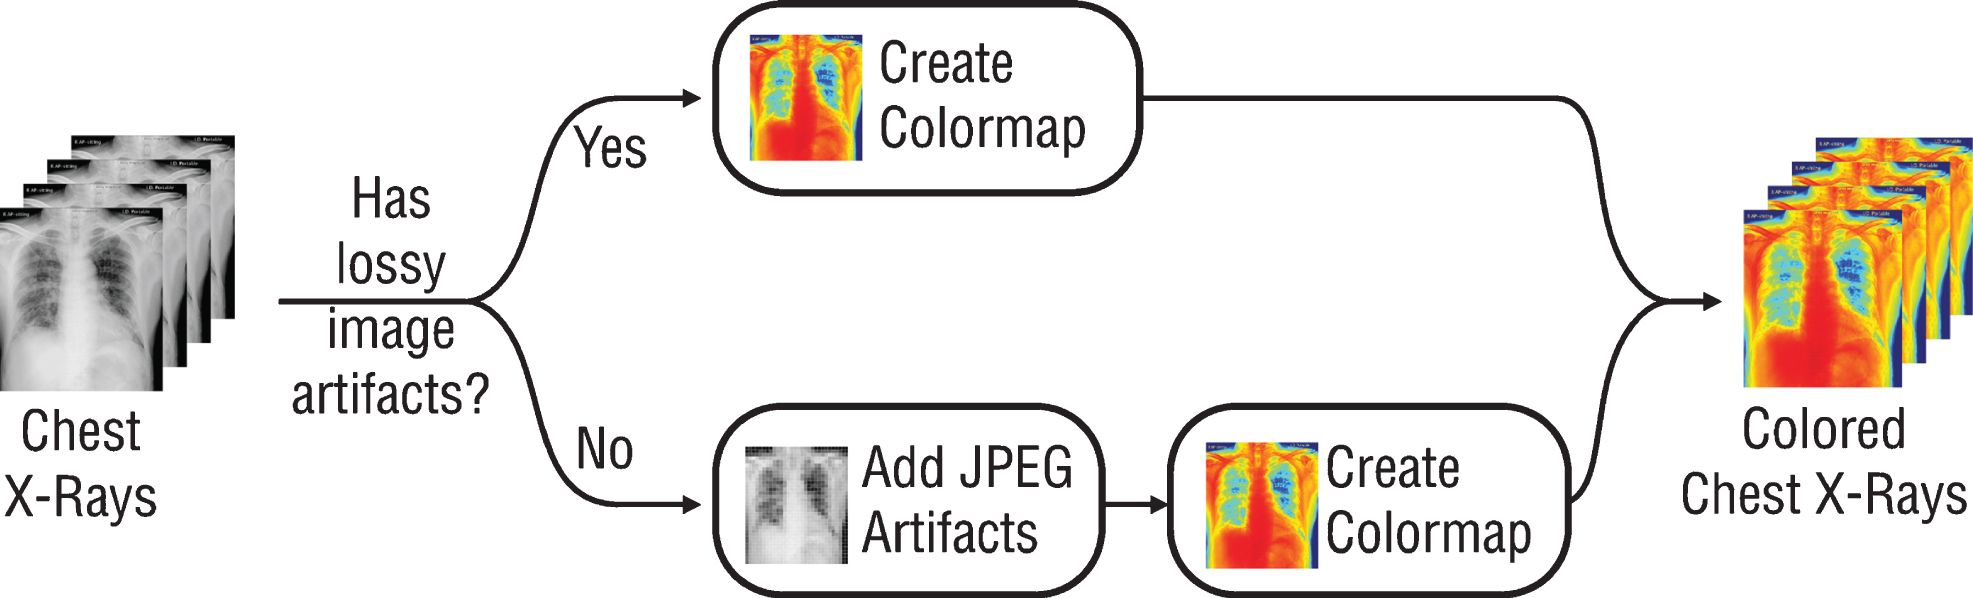
Fig.2
Schematic representation of the augmentation process.
2.3Transfer learning and optimization
Transfer learning technique was used in this work since there are few numbers of the available dataset. The transfer learning and optimization of the model was conducted on a personal computer (Ryzen 5 1600 CPU, 16GB DDR4 RAM, Nvidia RTX 2080 Ti Graphics Card). Fastai [33] and OpenCV [32] libraries were used to develop the model. Residual Neural Network (ResNet) [34], Dense Convolutional Network (DenseNet) [35], and Visual Geometry Group (VGG) [36] architectures, which have already been trained by ImageNet [37] database, and therefore already able to classify in 1,000 different classes, were re-trained to distinguish COVID-19 pneumonia and non-COVID-19 pneumonia by transfer learning. It is an advantage to use pre-trained architectures to enhance training speed and accuracy of the new proposed model, since the main image features that have already been learned can be transferred to the new task.
During transfer learning studies, the convolution layers of ResNet18, Resnet34, ResNet50, ResNet101, ResNet152, DenseNet121, DenseNet161, DenseNet169, DenseNet201, VGG16, and VGG19 architectures, which have previously trained by ImageNet to achieve the accurate results with few datasets, were frozen and only fully connected layers were re-trained. The numbers in the name of architectures such as 34, 50, 152, and 121, etc. represents the number of weight layers within the respective neural network. The VGG Net is developed a result of an idea of much deeper networks with much smaller filters. There are three types of VGG Net architectures including VGG-11, VGG-16, and VGG-19 and these networks contain 11, 16 and 19 convolutional and fully connected layers. The VGG network is characterized by its simplicity, using only 3×3 convolutional layers stacked on top of each other in increasing depth. Reducing volume size is handled by max pooling. The configuration of VGG- 16 is as follows: the number of convolutions and max- pooling layers: 13, max-pooling layer: 1, fully connected layers: 3, and Softmax layer: 1. Total weights is 138 million. The VGG-19 consisted of 16 convolutional layers, one max-pooling layer, 3 fully connected layers followed by a Softmax layer [36].
The main base element of ResNet is the residual blocks. In ResNet, all these residual blocks are stacked together very deeply. Thanks to this, it prevents the distortion that occurs as the network gets deeper and more complex. In addition, bottleneck blocks are used to make training faster in the ResNet model. Another thing with this very deep architecture is that it is enabling up to 150 layers deep of this. The number of filters can be doubled and downsample spatially using stride two in ResNet [34]. DenseNet is densely connected CNN where each layer is connected to all previous layers. Therefore, it forms very dense connectivity between the layers. The DenseNet consists of several dense blocks, and the layer between two adjacent blocks is called transition layers. The former define how the inputs and outputs are concatenated, while the latter control the number of channels so that it is not too large. DenseNet uses the modified “batch normalization, activation, and convolution” structure of ResNet [35].
The learning rate were explored from 1.0×10⁻⁶ to 1.0 over 170 iterations for all architectures, then it was stopped when loss diverged. Following the completion of the learning rate exploration process, the learning rate values for each architecture were similarly determined as 1.0×10⁻² and they were trained in a total of 40 epochs. During the training process, the radiographs were used at a resolution of 224×224 pixels. On the other hand, the patterns on chest x-ray images cause the pneumonia are usually thin and tiny. Therefore, it is important to enhance the resolution of the radiograph for the optimization of the model. For this purpose, all the radiographs were re-sizes at a resolution of 448×448 pixels, then the pre-processing step was applied to each radiograph.
Another issue to be considered in the optimization process is fine-tuning. In fine-tuning process, the frozen convolutional layers were re-trained by unfreezing the layers. In the backpropagation process, the “stochastic gradient descent with restarts” [38] technique is used to find the minimum points on the loss function. As the iterations progress, the learning rate value is updated by repeating with the “cosine annealing” method and by expanding the period. Thanks to the dynamically updated learning rate, the minimum points on the “loss function” can be determined more accurately. In order to apply the “stochastic gradient descent with restarts” technique to the network trained at transfer learning stage (1st stage), the limits of the learning rate values should be determined. To determine the limit of the learning rate values, following the completion of the 1st transfer learning stage as stated above, the learning rate exploration process of unfrozen networks was repeated and the appropriate learning rate interval to be studied was determined. At the end of the transfer learning and optimization step, the final model (optimized nCoV-NET model) was applied to a independent testing dataset to verify its performance.
2.4Activation maps
Gradient-weighted Class Activation Mapping (Grad-CAM) method helping to improve causality and intelligibility was used to create activation maps that highlights the crucial areas of the radiograph [39–41]. In the Grad-CAM method, the gradients of the radiographs flowing into the final convolutional layer to produce a rough localization map in which the important areas are highlighted is used. It has been reported that the deeper presentations in a convolutional neural network capture upper-level visual constructs [42, 43]. Additionally, the convolutional layers able to keep spatial information which is lost in fully-connected layers. Thus, it can be expected the last convolutional layers to have the perfect concurrence between high-level semantics and detailed spatial information. The semantic class-specific information in the image are tried to find by the neurons (i.e. object parts). Grad-CAM uses the gradient information flowing into the last convolutional layer to assign significance values to each neuron.
2.5Performance evaluation criteria
The accuracy, recall (sensitivity) and precision (positive predictive value) parameters are the main parameters to determine the performance of the model. In confusion matrix there is four possible outcomes including true positive (TP), true negative (TN), false positive (FP), false negative (FN). When the case is actually positive, if it is classified as positive it is labeled as TP, in contrast, if it is classified as negative it is labeled as FN. Similarly, in the case of negative, if the case is classified as negative it is TN, if is classified as positive it is labelled as FP [44]. To evaluate the performance of the tailored convolutional neural networks the accuracy, recall and precision coefficients were determined as followings.
(1)
(2)
(3)
A confusion matrix is a performance measurement technique for summarizing the performance of a developed deep learning classification model. Calculating a confusion matrix provides a better representation of what classification model is getting right and what types of errors it is making. It also ensures insight not only into the errors being made by the classifier but more importantly the types of errors. It is a matrix including the different combinations of predicted and actual values.
3Results
The training process consists of three basic stages as followings; i) different architectures in various depths including ResNet, VGG and DenseNet were examined and all convolutional layers were frozen and trained ii) the most appropriate architecture was determined and fine-tuning process was performed for each architecture iii) the inference results of the activation map were evaluated, which establishes a bridge between radiologists and artificial intelligence for understanding.
3.1 The 1 st stage: Transfer learning
In the first stage of transfer learning, fully connected layers of ResNet, DenseNet, and VGG architectures, previously trained by ImageNet datasets with different layer numbers, were re-trained and structured to distinguish between COVID-19 pneumonia and non-COVID-19 pneumonia. All training conditions were set as a resolution of 224×224 pixels, batch size of 16, the learning rate of 1.0×r10–2 to compare different architectures.
The obtained accuracy, recall and precision values for each architecture were depicted in Fig. 4. As can be seen from Fig. 4, in the 1st stage transfer learning step, all models conducted by different numbers of layers showed similar performances on different types of CNN architectures. Since the dataset consists small and unbalanced data and the learning rate used in the first stage were relatively large, performance charts varied in each epoch value, causing noise in the charts, thus making it difficult to determine the performance criteria of the networks. According to the results determined by the training, it was determined that the values of accuracy, recall, and precision were very close to each other. Thus, it was decided that the bottleneck both for data set and parameters used in training process was not CNN architectures.
![A typical learning rate schedule vs several learning rate annealing cycles [29].](https://content.iospress.com:443/media/xst/2021/29-1/xst-29-1-xst200757/xst-29-xst200757-g003.jpg)
Fig.4
The performance graphs for each architecture.
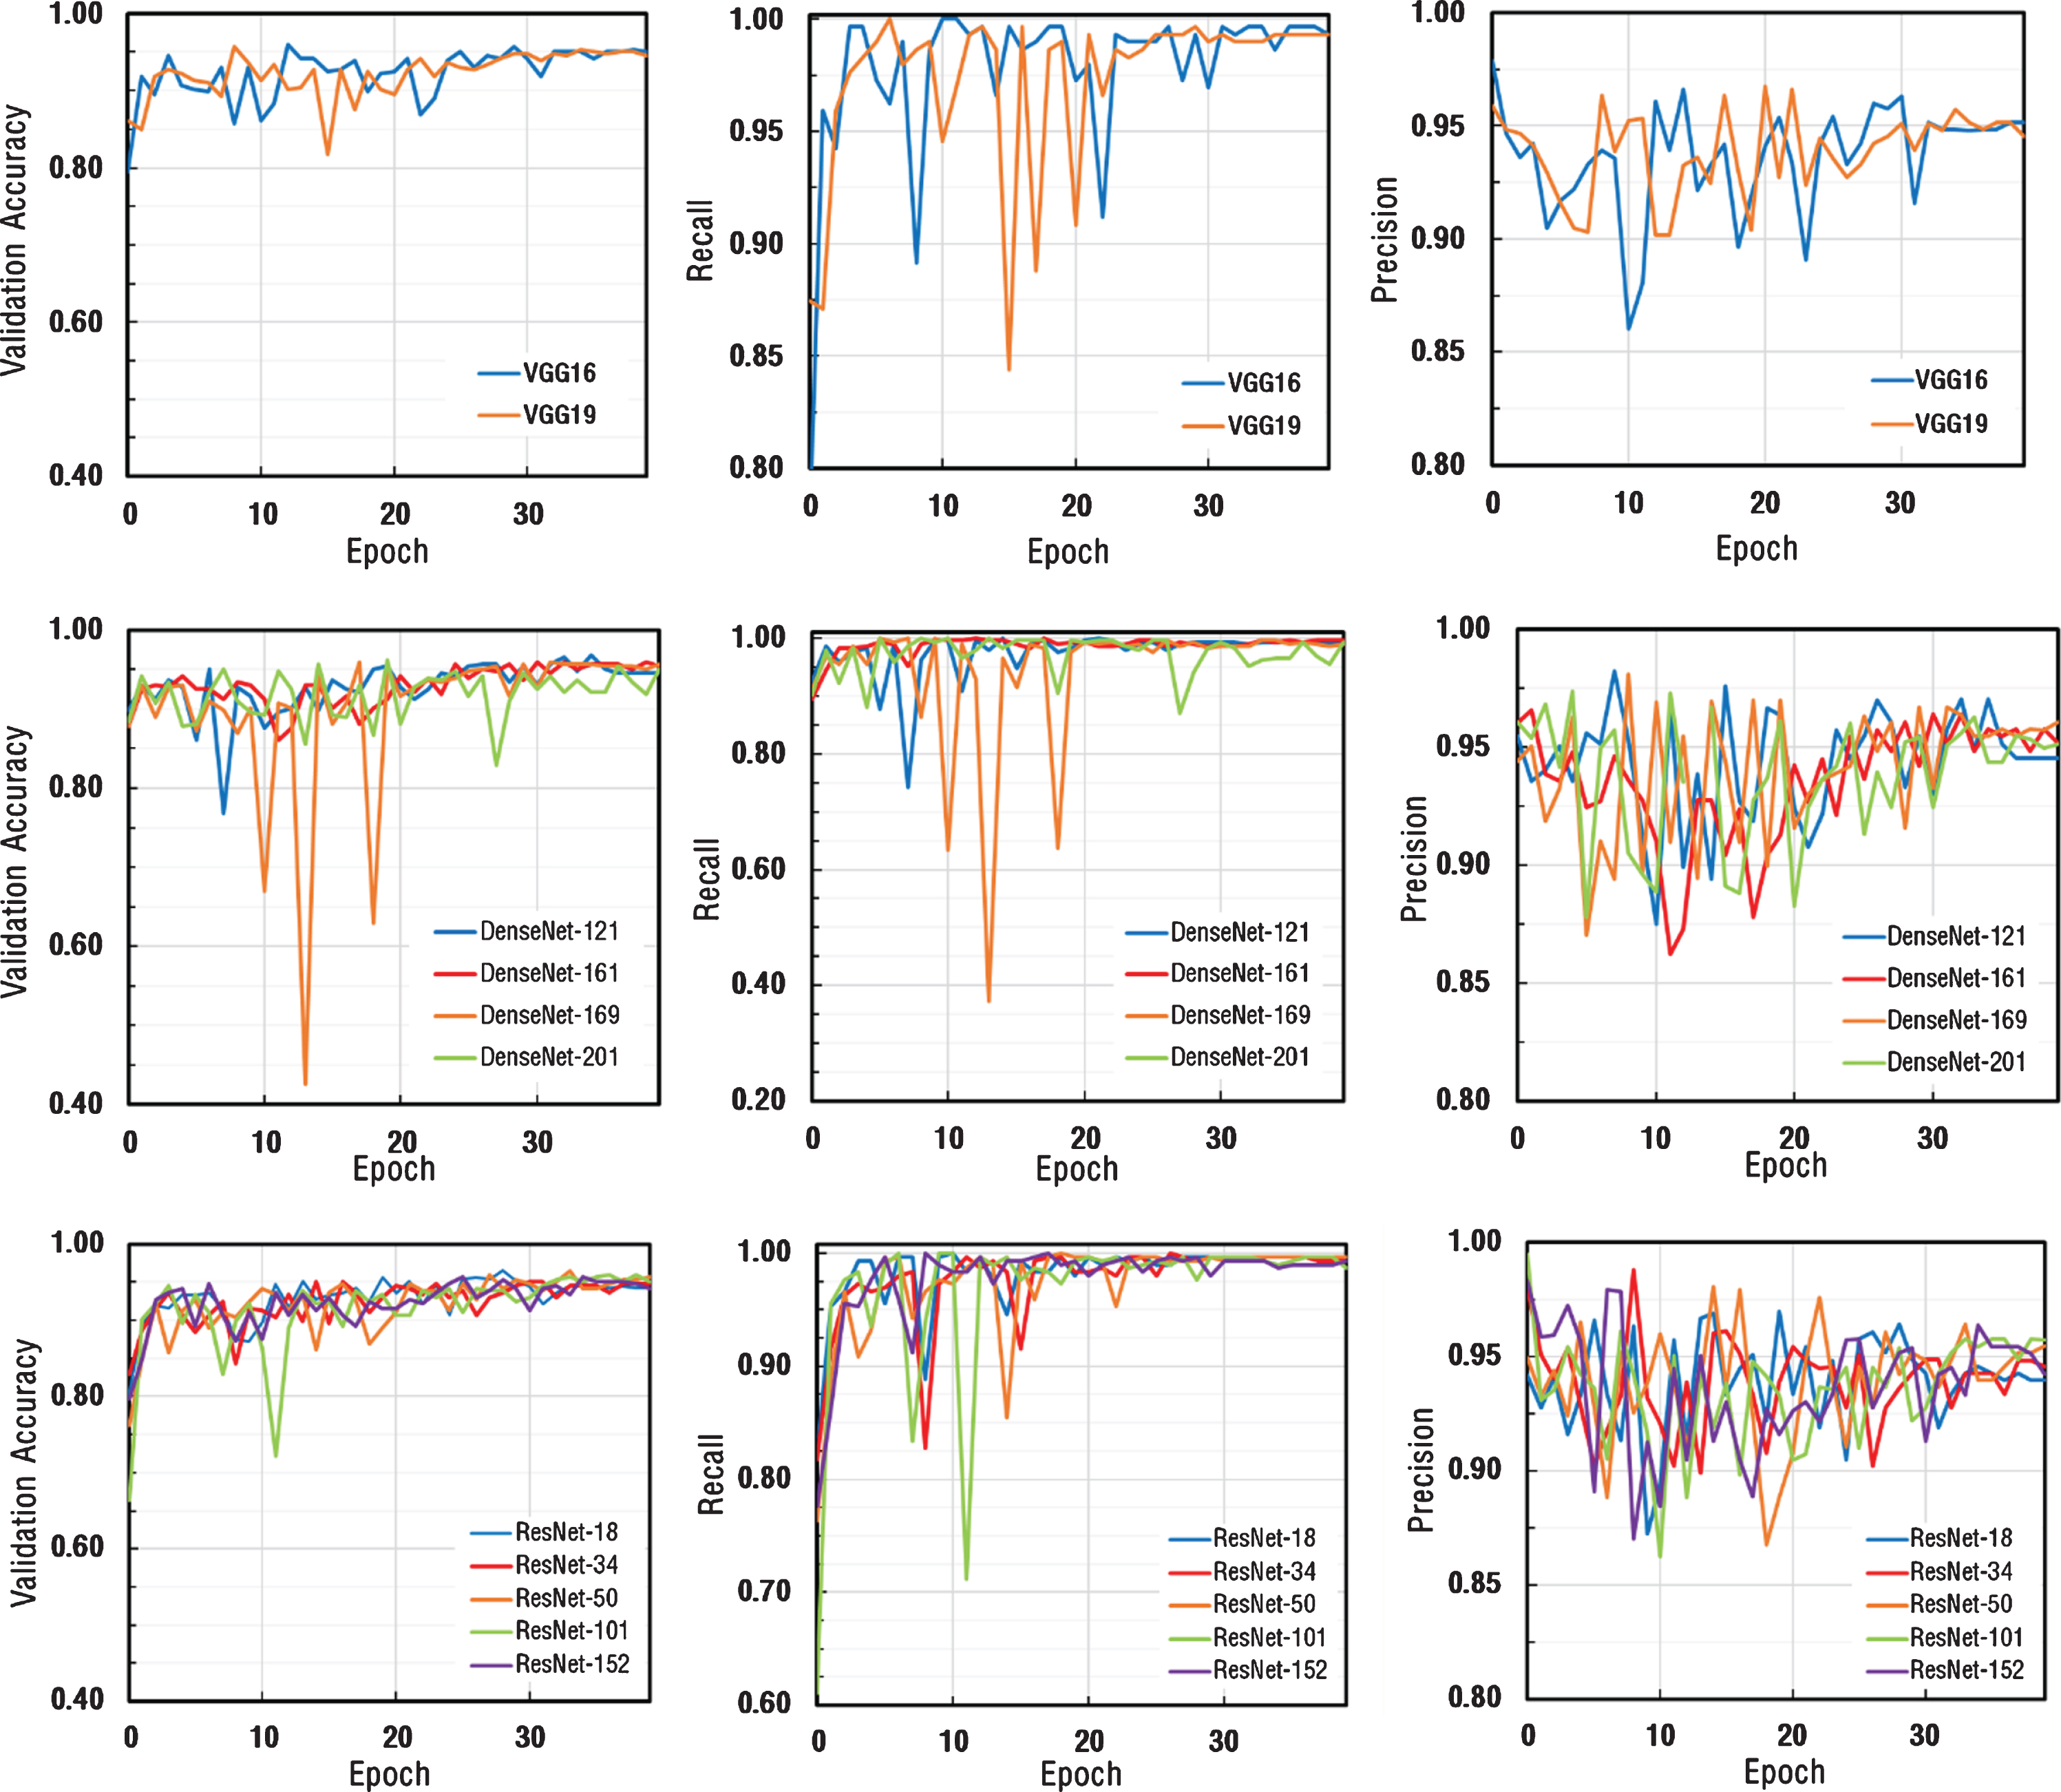
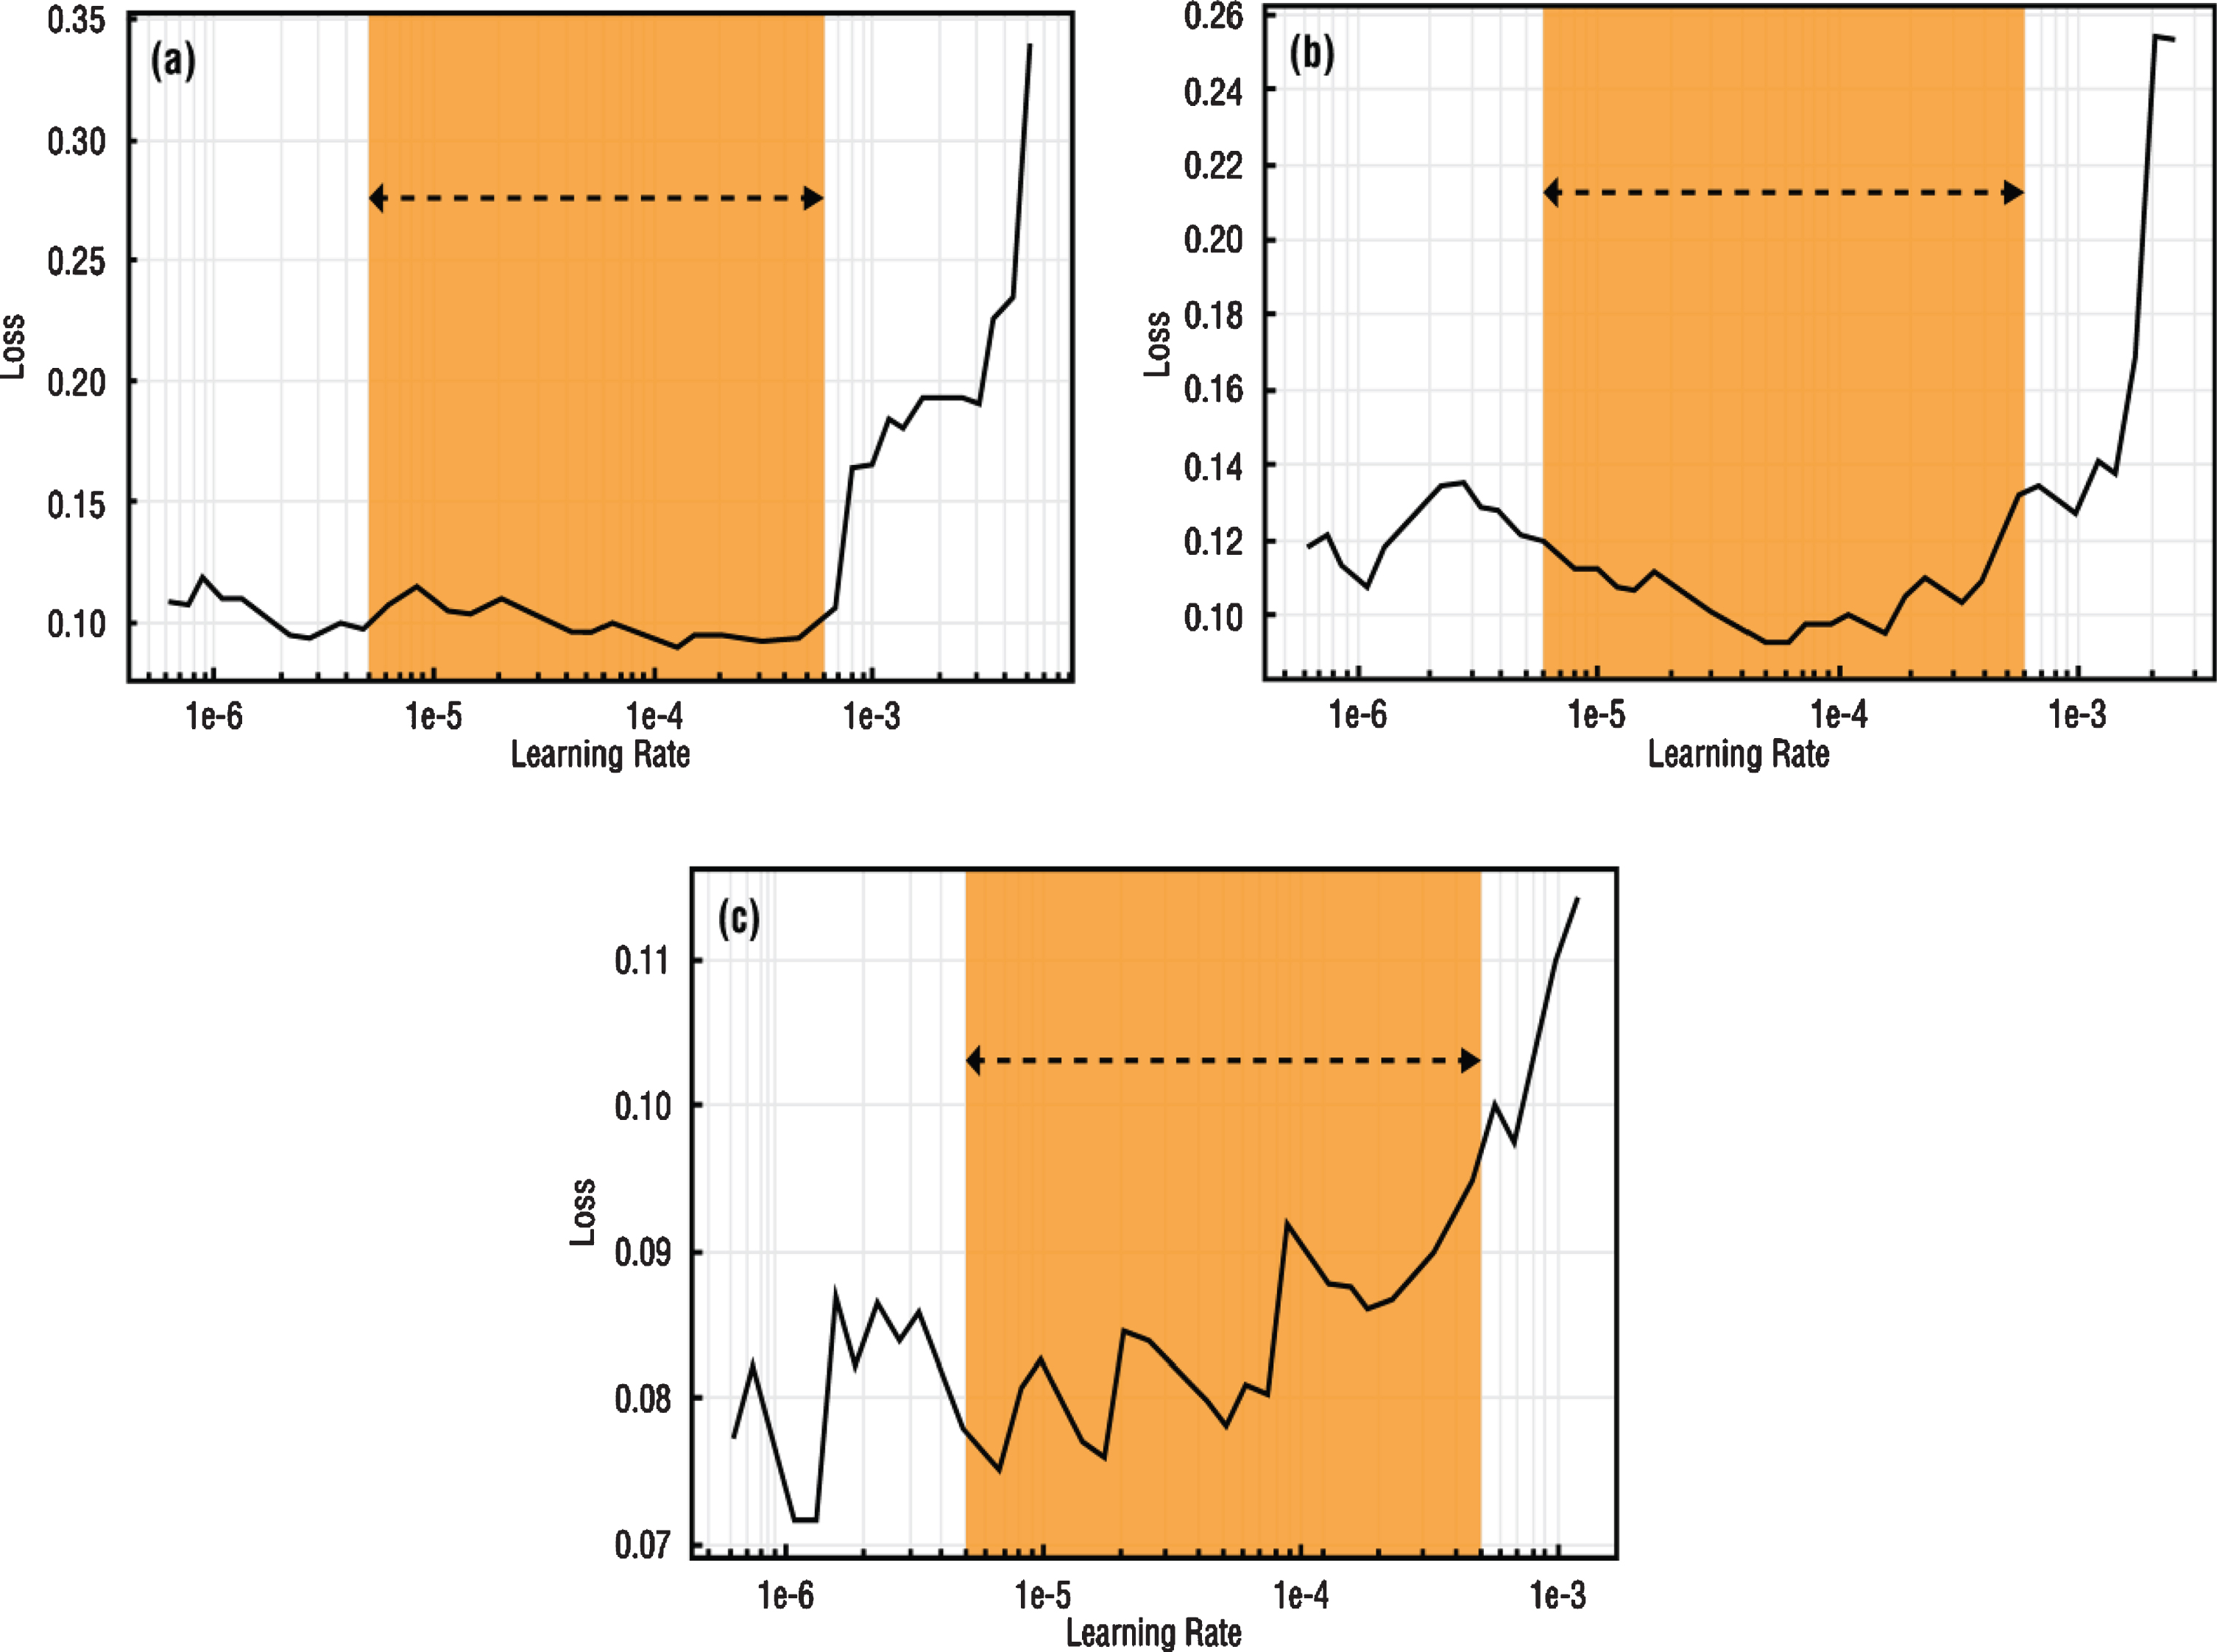
Fig.5
Learning rate intervals of (a) VGG-16 (b) DenseNet-161 (c) ResNet-50 architectures.
In the light of this information, it was decided to perform fine-tuning on VGG-16, DenseNet-161 and ResNet-50 architectures by considering both computational efficiency and the performance of networks in similar medical studies [45–47]. Also, it was aimed to improve the performance criteria.
3.2 The 2 nd stage: Fine-tuning and optimizations
Following the 1st stage transfer learning process, it was decided to improve the image resolution value for selected architectures including VGG-16, DenseNet-161 and ResNet-50. The most important reason for this was that pneumonia findings on chest x-ray images might contain small features compared to the lung itself. Therefore, in the studies conducted with the new input resolution determined as 448×448 pixels, the learning rate values of networks whose input resolution was changed after the learning rate exploration process were similarly determined as 1×10⁻². Convolutional layers were trained for 20 training epochs by setting batch size as 8 while frozen.
To apply SGDR to the model, the learning rate exploration process must be repeated on the unfrozen model and the maximum and minimum learning rate limits to be used must be determined [38]. These determined learning rate values were used as maximum and minimum learning rate values in the cosine annealing process. In Fig. 5, loss values versus learning rate values and preferred learning rate intervals for use in SGDR were specified for each network. Learning rate intervals to be used in training are indicated with orange fields (Fig. 5).
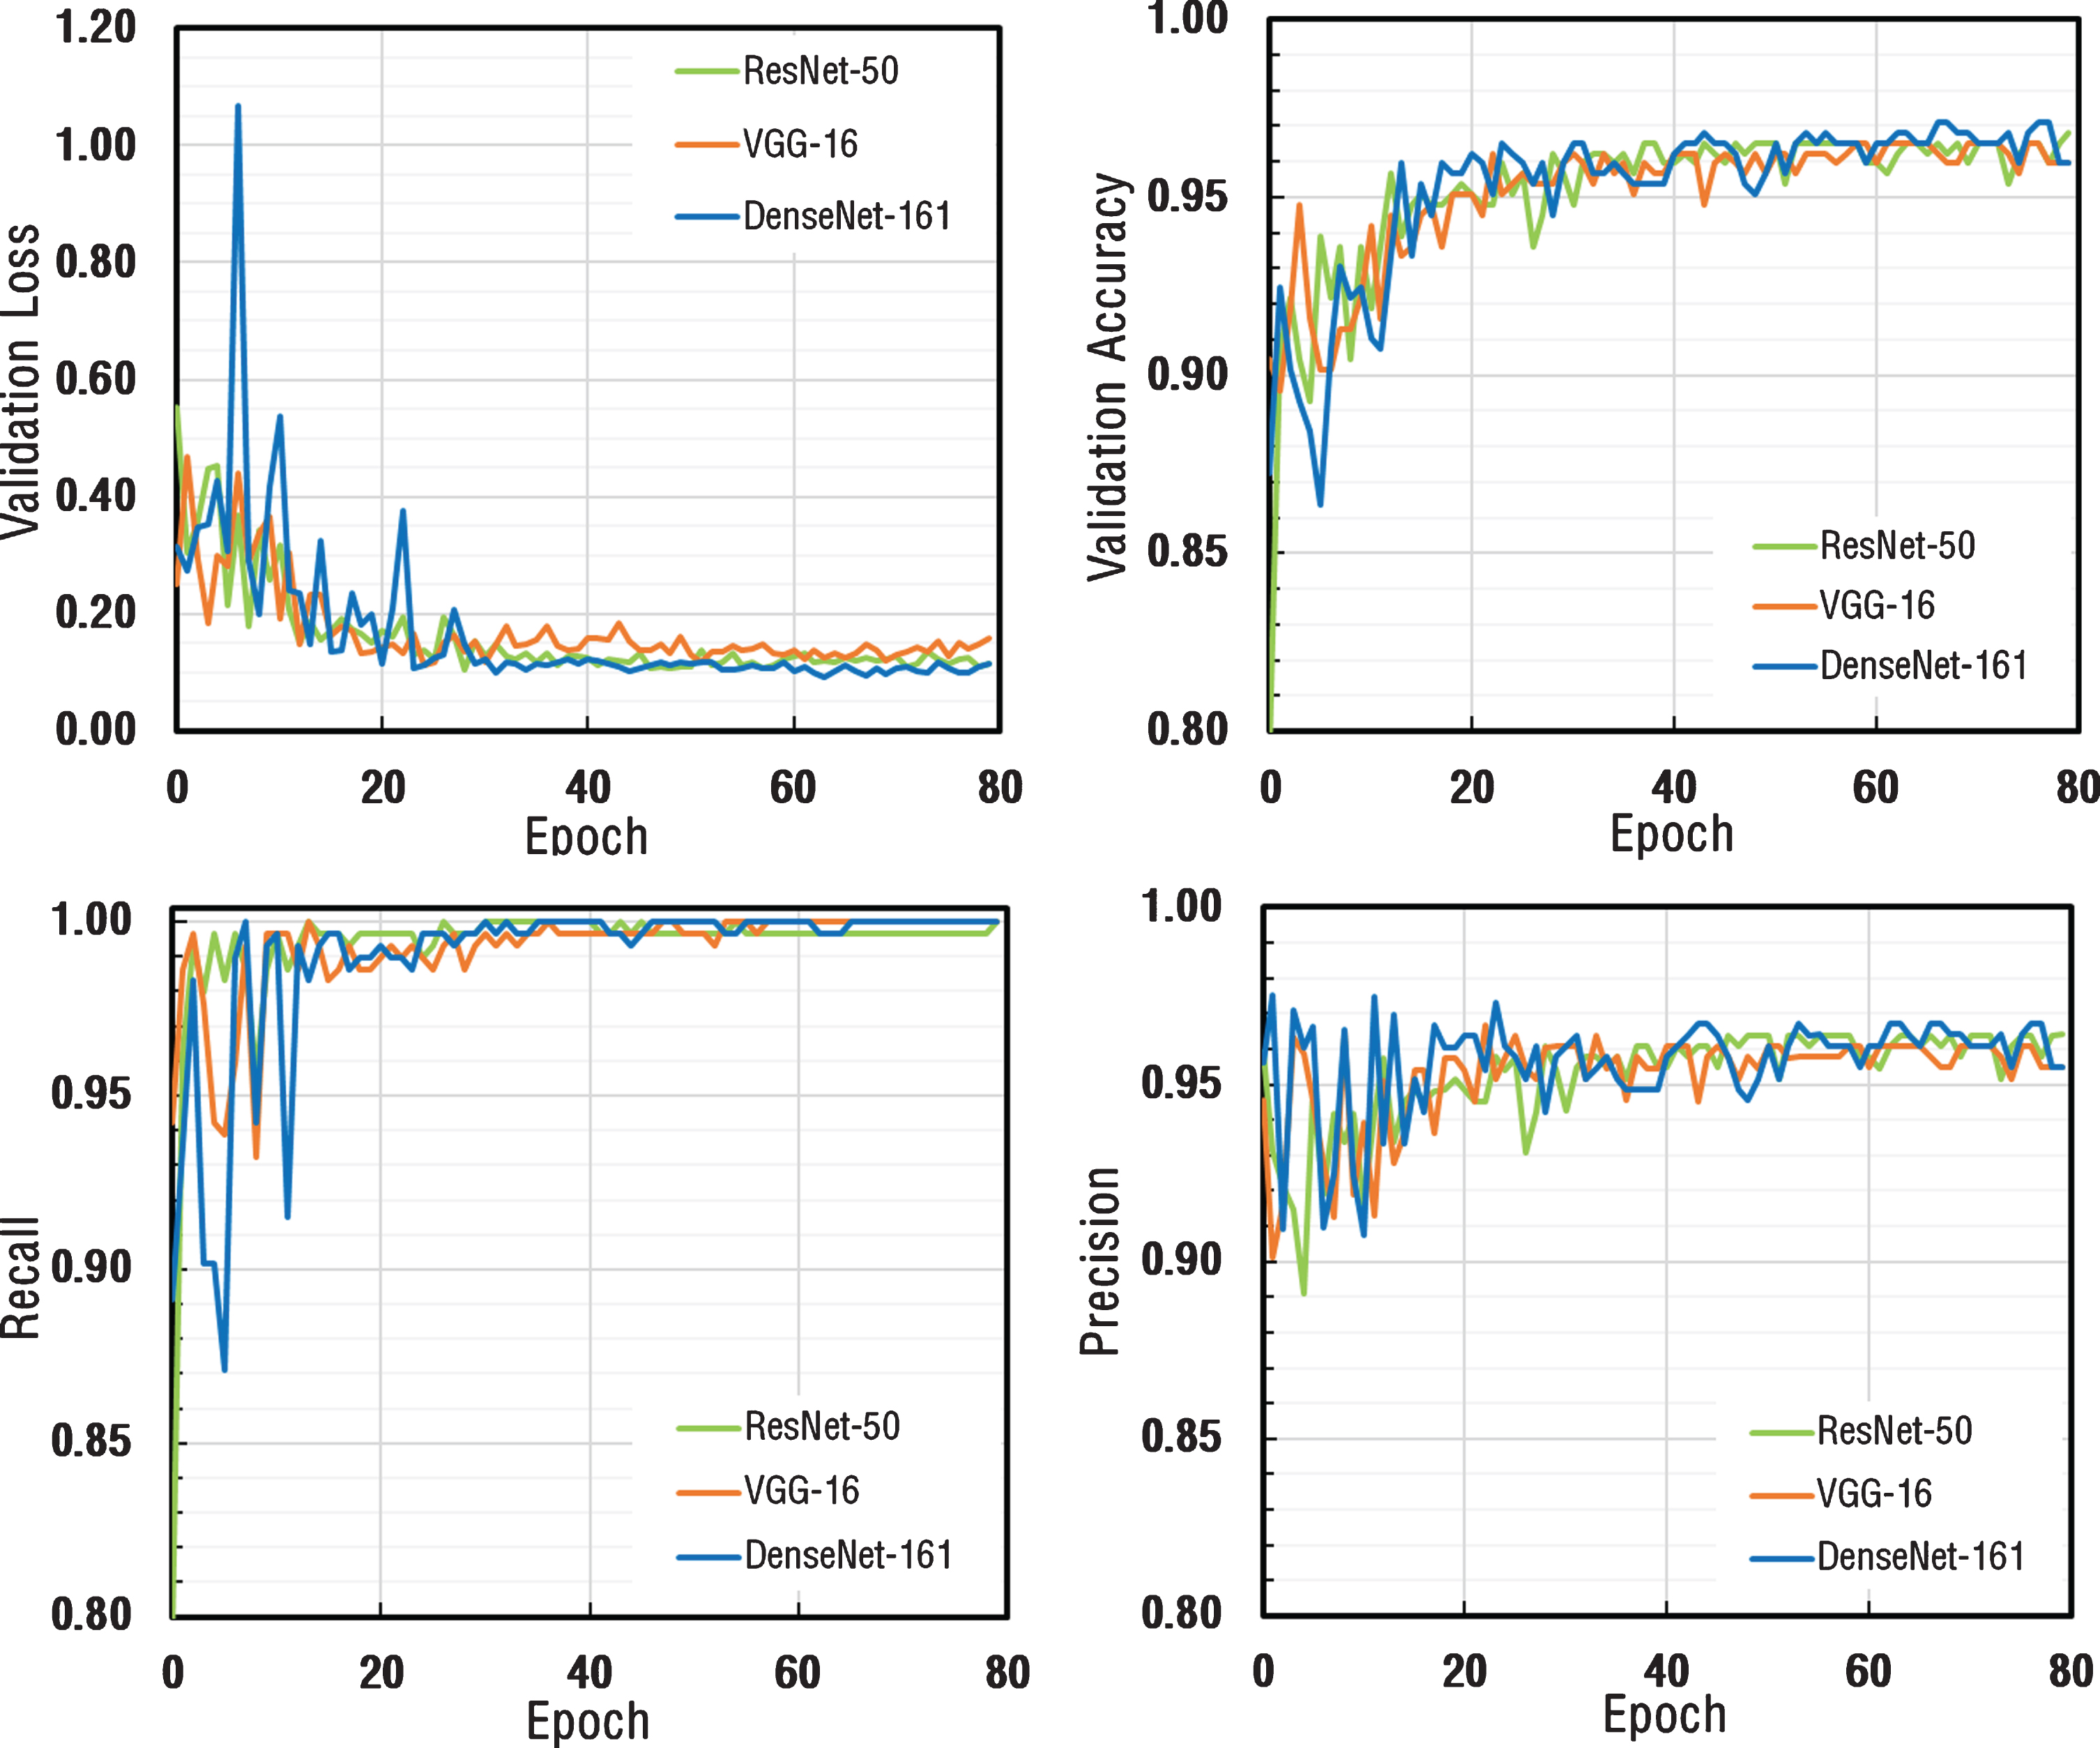
As a result of the total of 80 Epoch training process, validation loss, validation accuracy, recall and precision metrics were calculated after each epoch and the results were plotted as depicted in Fig. 6. Validation loss values for all three architectures appeared to decrease exponentially and had a stable structure by reaching saturation. Validation accuracy, recall and precision values appeared to be very close to each other for all three architectures.
Fig.6
The comparison of performance graphs of different metrics for ResNet-50, VGG-16, and DenseNet-161 architectures.
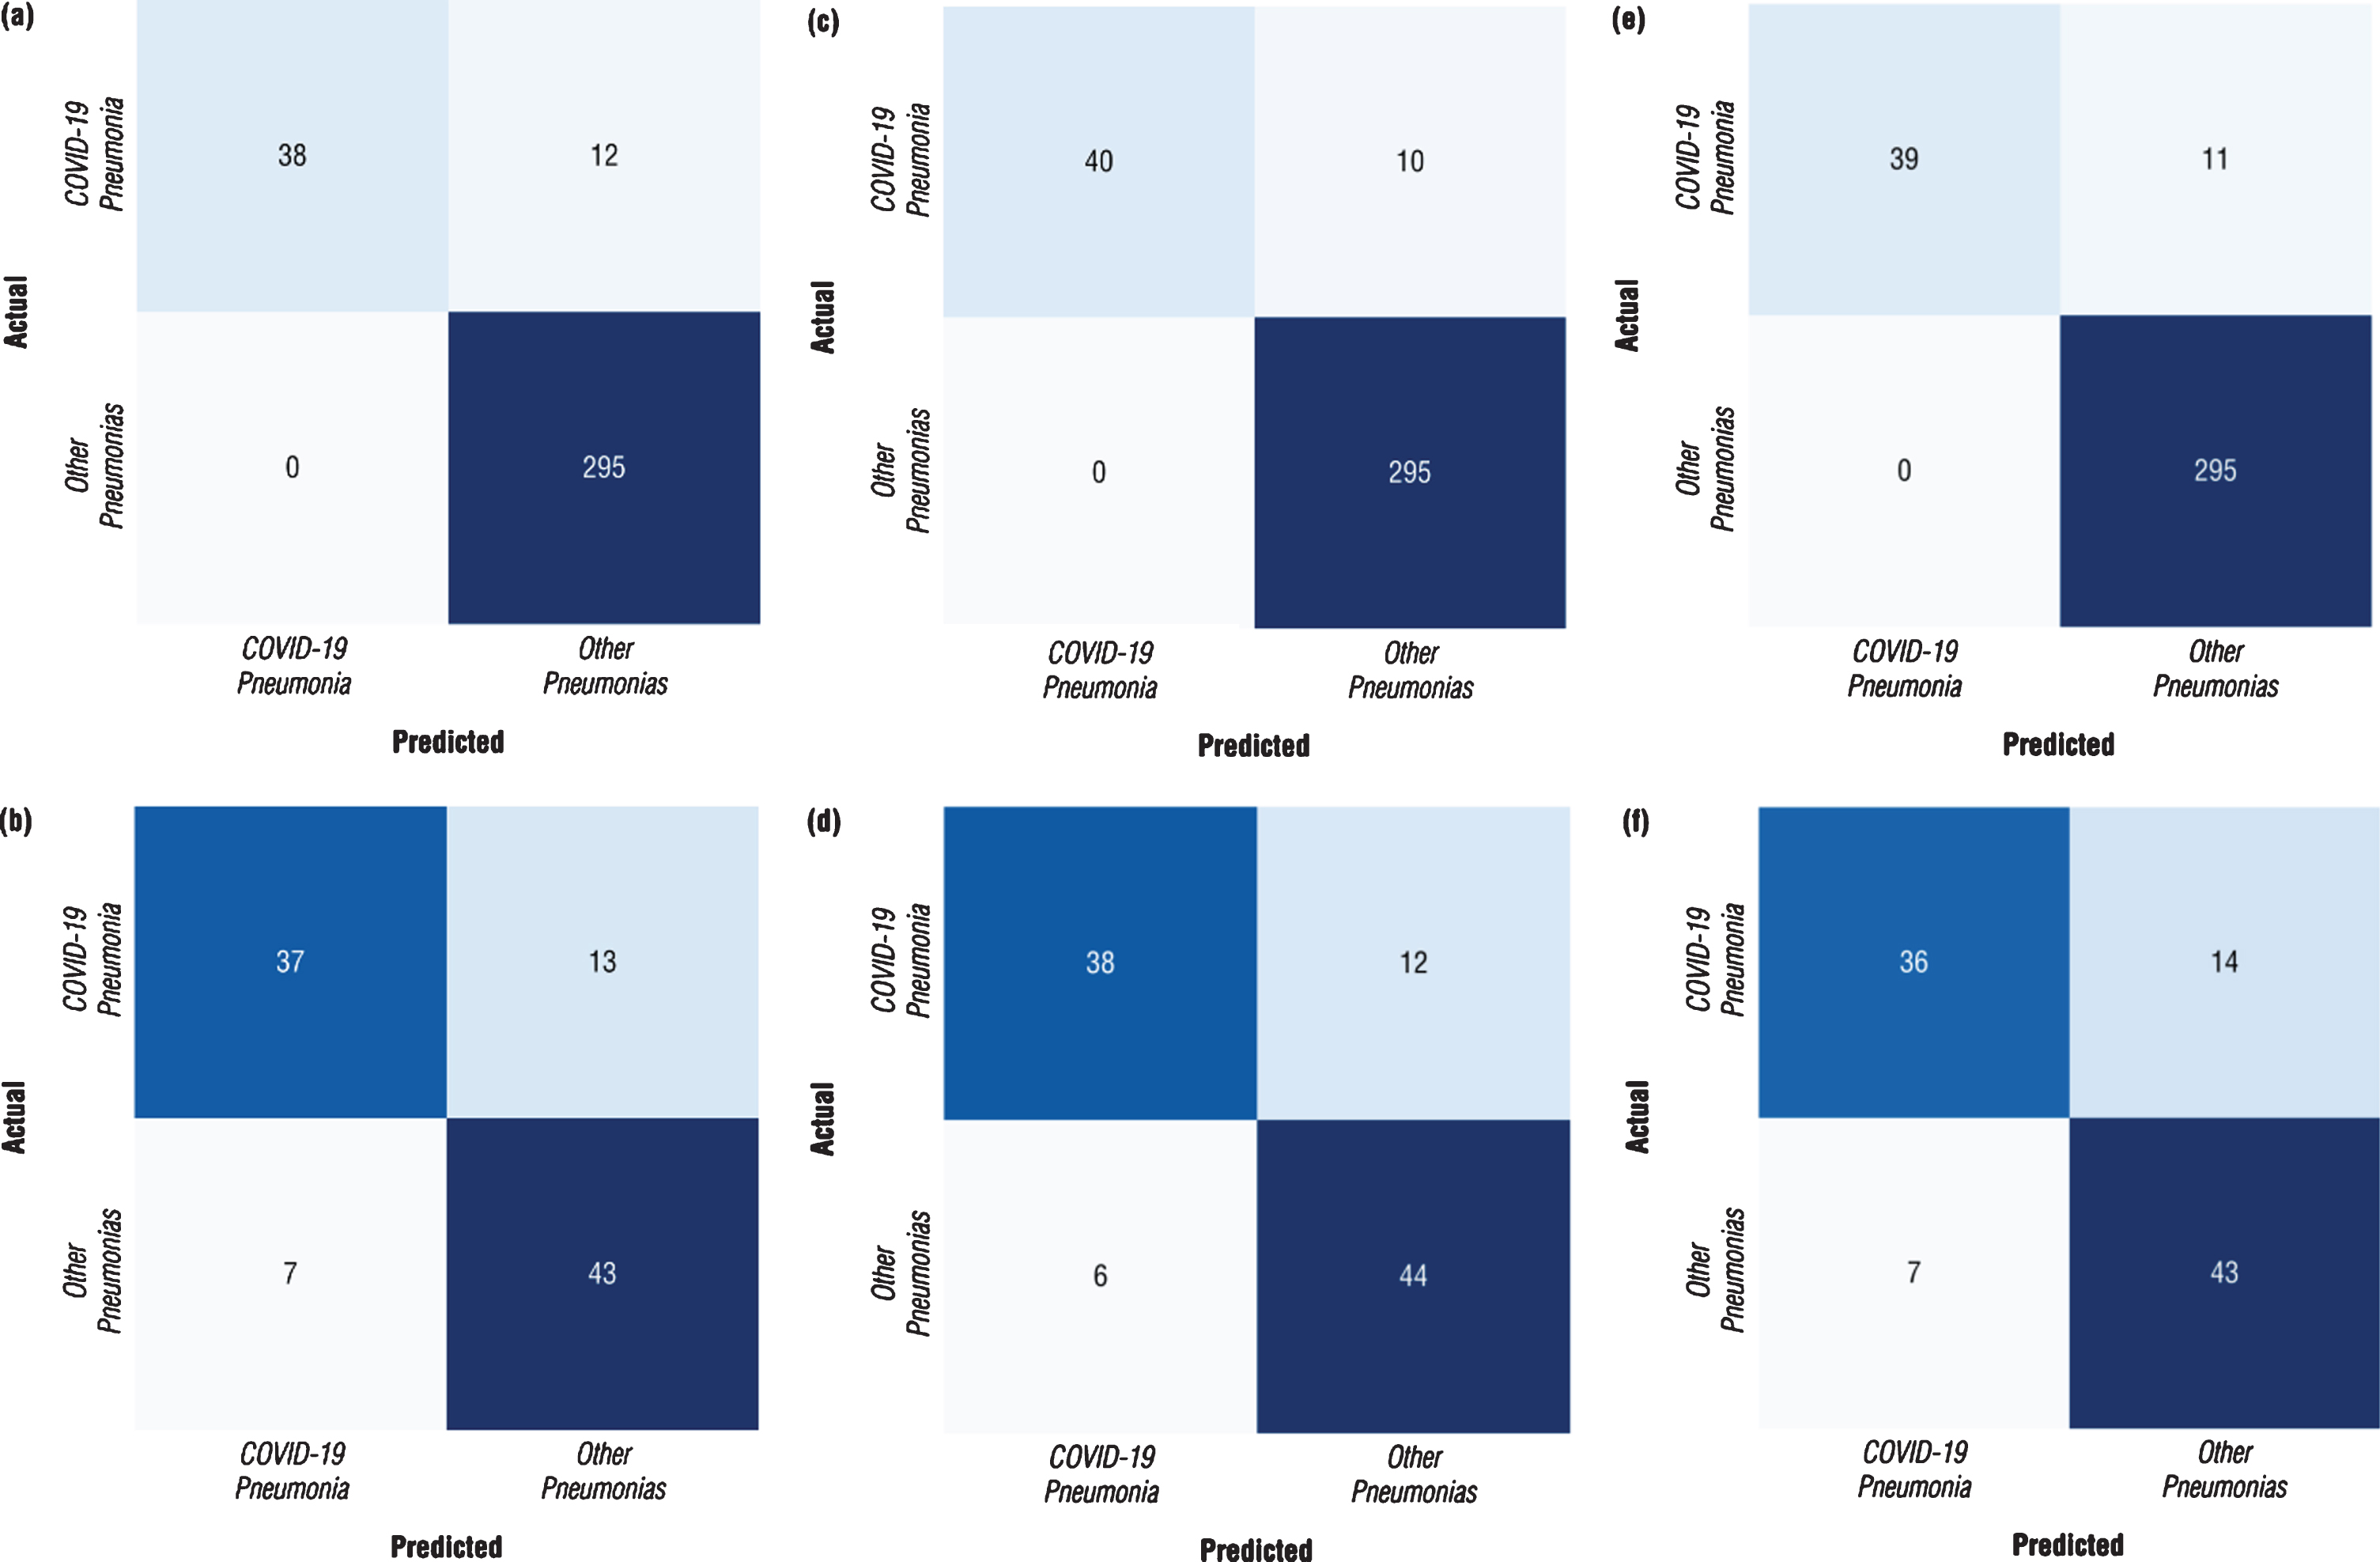
Confusion matrix is a performance measurement for machine learning classification problem where output contains two or more classes. The confusion matrices for each model with different architecture were calculated at the points where the models perform at maximum to obtain a better idea of the performance of the developed models. The confusion matrices calculated for both validation dataset and testing datasets were depicted in Fig. 7. The results revealed that the DenseNet-161 architecture performs better than other architectures with the following graphs (Fig. 7). It was observed from the confusion matrix of DenseNEt-161 architecture calculated for the validation dataset reported in Fig. 7c that the nCoV-NET model can detect 38 out of 50 patients with COVID-19 as having COVID-19, 295 out of 295 non-COVID-19 cases as non-COVID-19. On the other hand, it was seen that it misclassified 12 non-COVID-19 cases as COVID-19 case. Moreover, from the confusion matrix of DenseNet-161 architecture calculated for the testing dataset proposed nCoV-NET model achieved an accuracy of 82.0 % to classify COVID-19 cases (Fig. 7d).
Fig.7
Confusion matrix of optimized nCoV-NET model for (a, b) VGG-16 (c, d) DenseNet-161 (e, f) ResNet-50 architectures (a, c, e represents the calculated confusion matrices for the validation dataset, and b, d, e represents the calculated confusion matrices for the testing dataset).
In Table 1, the results of the fine-tuning process including the first stage and the second training stage were tabulated. As can be seen from the chart, DenseNet-161 architecture exhibited the best performance in accuracy, recall and precision metrics. Additionally, it should be noted that all trained networks presented high recall (sensitivity) values. Moreover, the performance parameters of optimized nCoV-NET (final model) calculated for the independent testing dataset were listed in Table 1. It was clearly seen that DenseNet-161 presented the highest accuracy value as 82% amongst the other architectures.
Table 1
Comparison of performance metrics of nCoV-NET for different architectures
| Performance | Architecture | ||||||||
| Metrics | VGG-16 | DenseNet-161 | ResNet-50 | ||||||
| Accuracy | Recall | Precision | Accuracy | Recall | Precision | Accuracy | Recall | Precision | |
| 1st Learning Stage | 95.36 | 99.66 | 95.14 | 95.94 | 99.66 | 95.76 | 95.65 | 99.66 | 95.45 |
| 2nd Learning Stage | 96.52 | 100.00 | 96.09 | 97.10 | 100.0 | 96.72 | 96.81 | 100.00 | 96.40 |
| nCoV-Net (applied to the testing data) | 80.00 | 84.00 | 74.00 | 82.00 | 86.30 | 76.00 | 79.00 | 83.70 | 72.00 |
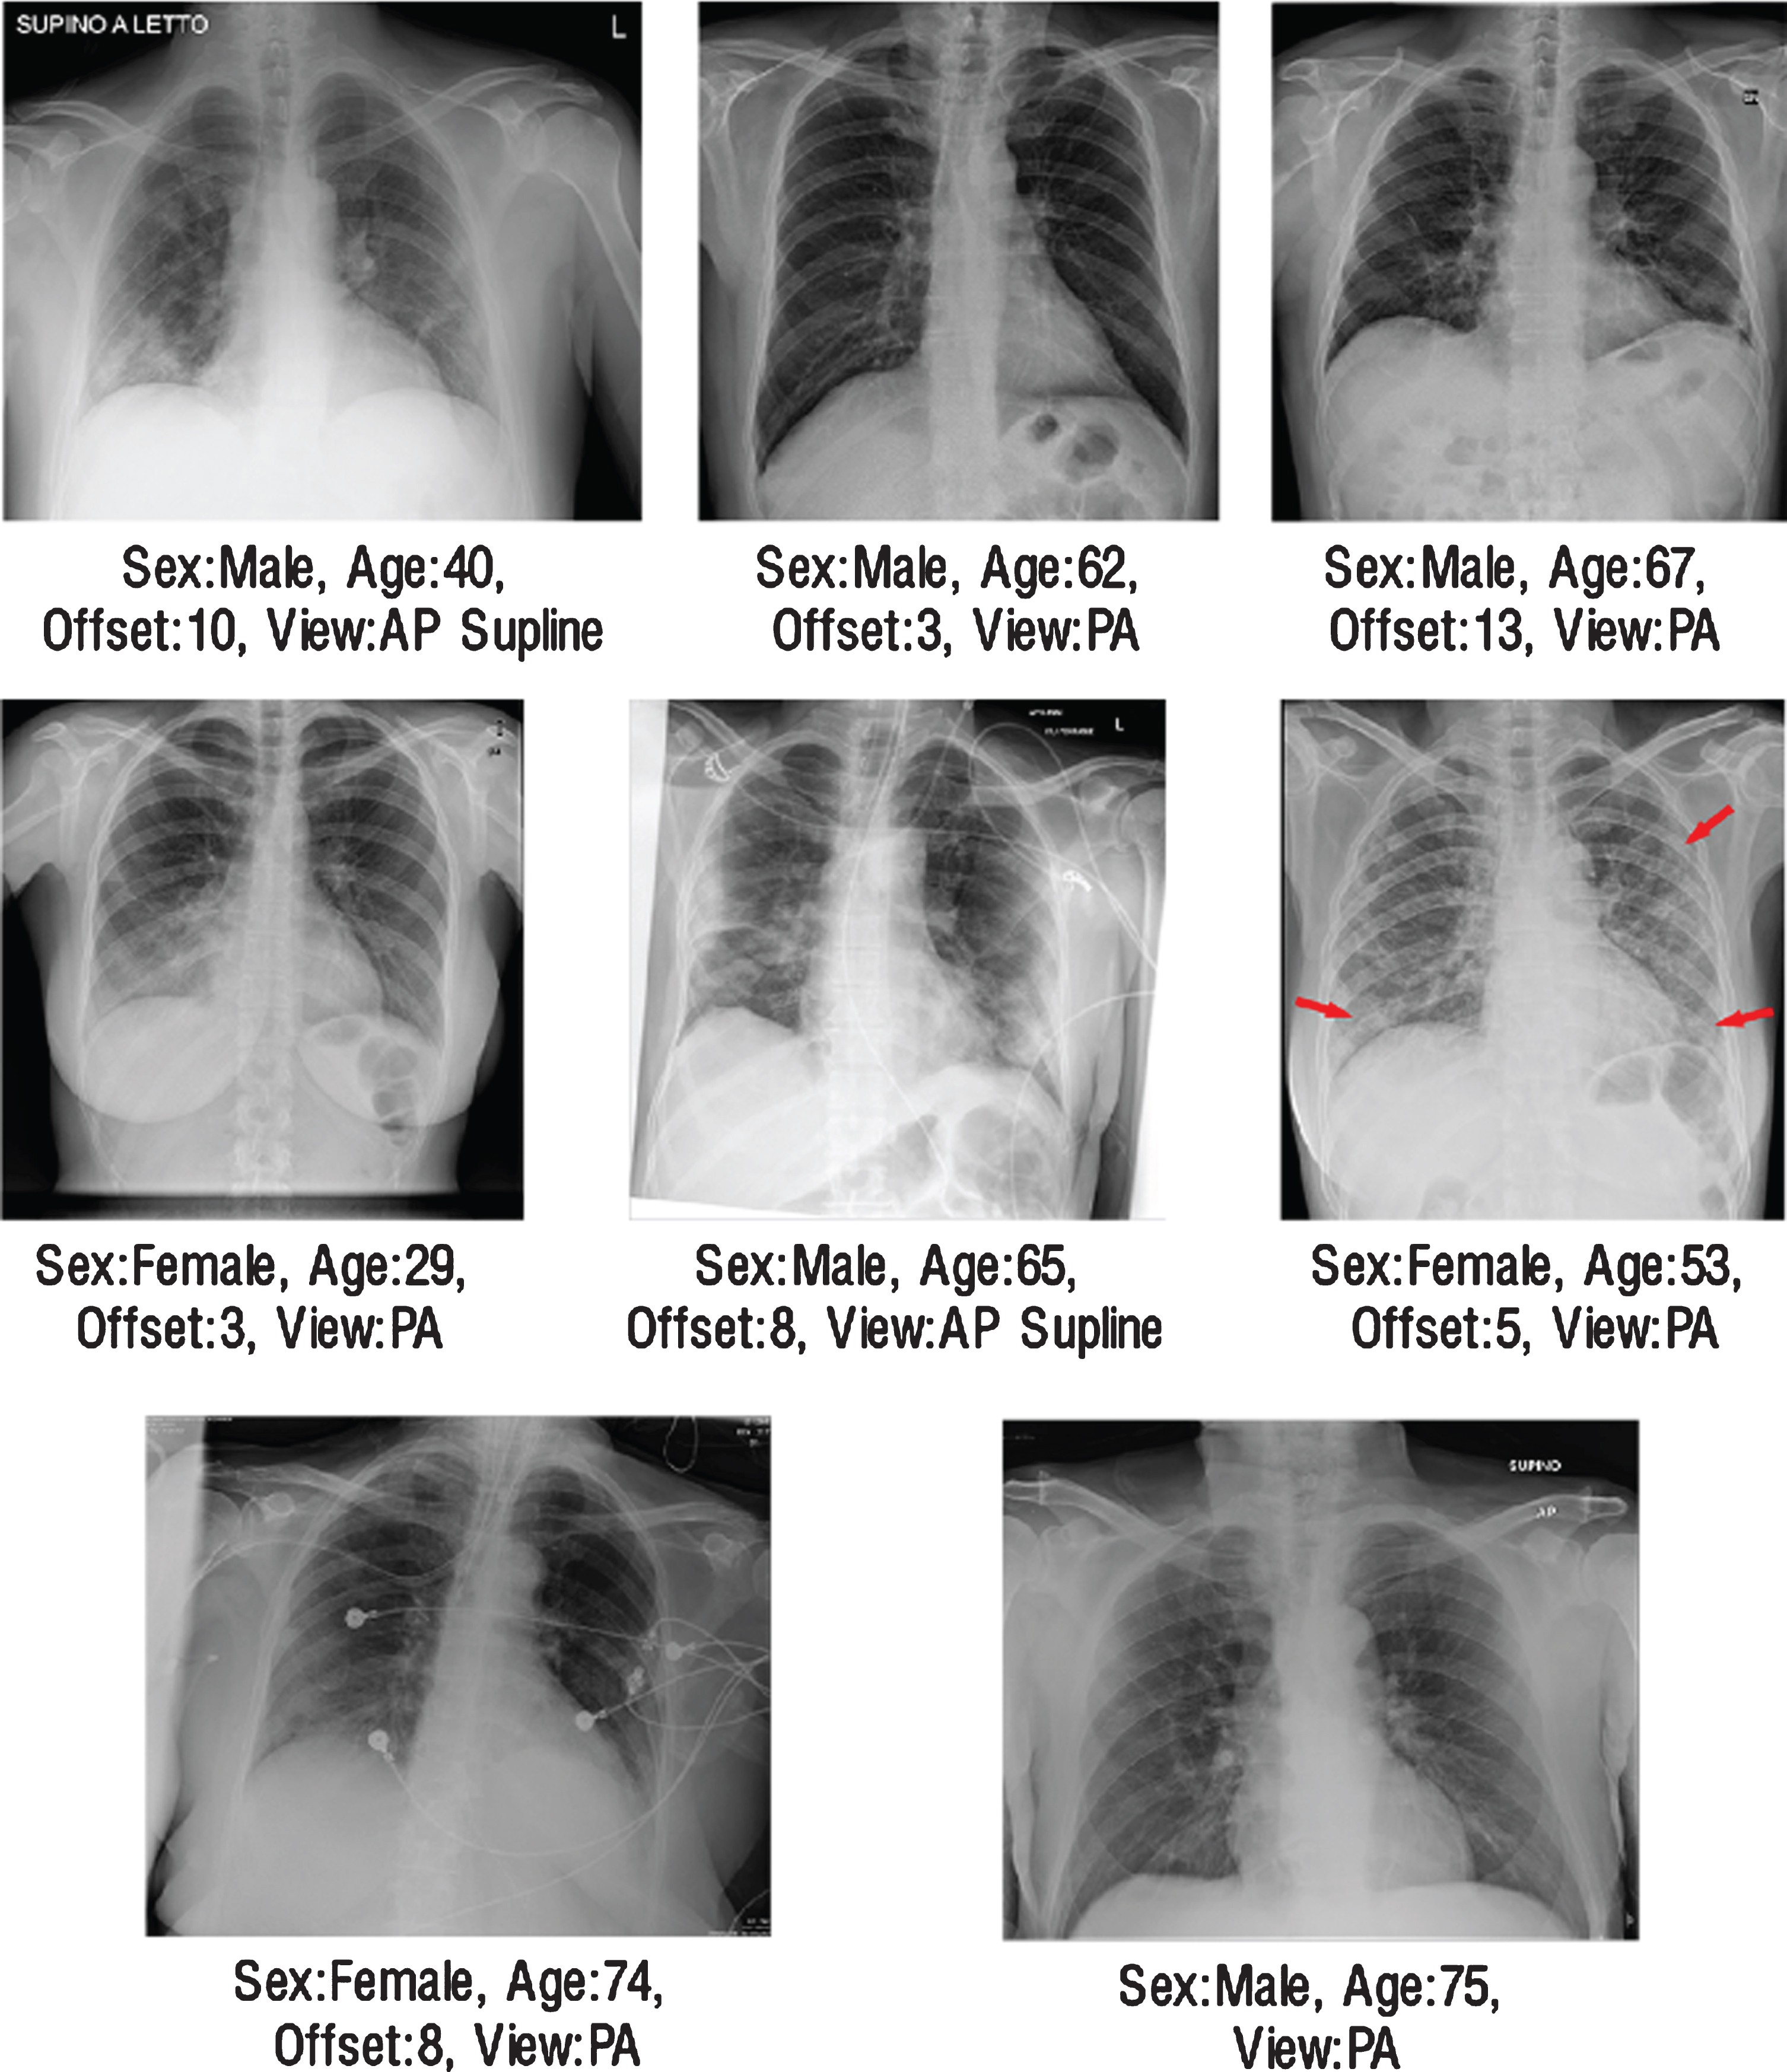
On validation dataset, for the COVID-19 pneumonia class, 12 false-negative cases were encountered in VGG-16 architecture, 10 in DenseNet-161 architecture, and 11 in ResNet-50 architecture (Fig. 7). As a result of the examinations with radiologist, 8 same data were predicted as false-negative for each architecture. In Fig. 8 these radiographs were presented with their metadata. In the light of these findings, two hypotheses have been developed that cause this problem. The first one could be the bias problem in the dataset since the same errors were repeated in the same way by all networks [48]. It is difficult to examine chest radiographs only for pneumonia because the lungs belonging to the non-COVID-19 pneumonia or COVID-19 pneumonia classes, in addition to healthy lungs, atelectasis, cardiomegaly, effusion, infiltration, mass, nodule, pneumothorax, consolidation, edema, emphysema, fibrosis, pleural thickening and may have one or more different pathologies such as hernia [49]. This is why it is crucial that the data set contains large enough and large numbers of sub-pathology groups. As the databases expand and generalization is achieved, it will be possible to decrease the bias on the database. Another point suggested by radiologists was that in these cases both the involvement was mild and could not be detected due to limitations that could be caused by monitoring materials.
Fig.8
The illustration of radiographs where all networks made same mistakes.
3.3Activation map and radiologist expert interactions
Since radio-diagnosis takes an important role in the detection of early-stage COVID-19 cases and taking further measures, it is crucial to train the CNN model to detect more sensitively of COVID-19 positive lung. Thus, in the last stage of the study, the original labels of the radiographs of COVID-19 cases confirmed positive by the RT-PCR test and the predictions errors of the nCoV-NET outputs were evaluated by an expert radiologist to confirm model robustness. The nCoV-NET is capable to determine the pathognomonic findings for COVID-19 including ground-glass opacities, consolidation areas, and nodular opacities. In the chest x-ray images of COVID-19 infected patients, bilateral, lower lobe and peripheral involvement can be observed. Thus, the developed model should detect the localization of these to identify the early stages of COVID-19 cases [23].
The activation mapping was applied to the chest x-ray images by Grad-CAM algorithm so that radiologists could diagnose the artificial neural network chest x-ray and determined which regions the diagnosis was based on and decided accordingly (Fig. 9).
Fig.9
The illustration of (a) original radiograph entered to the network, (b) calculated activation map, (c) superimposed version of the original radiography and its activation map.
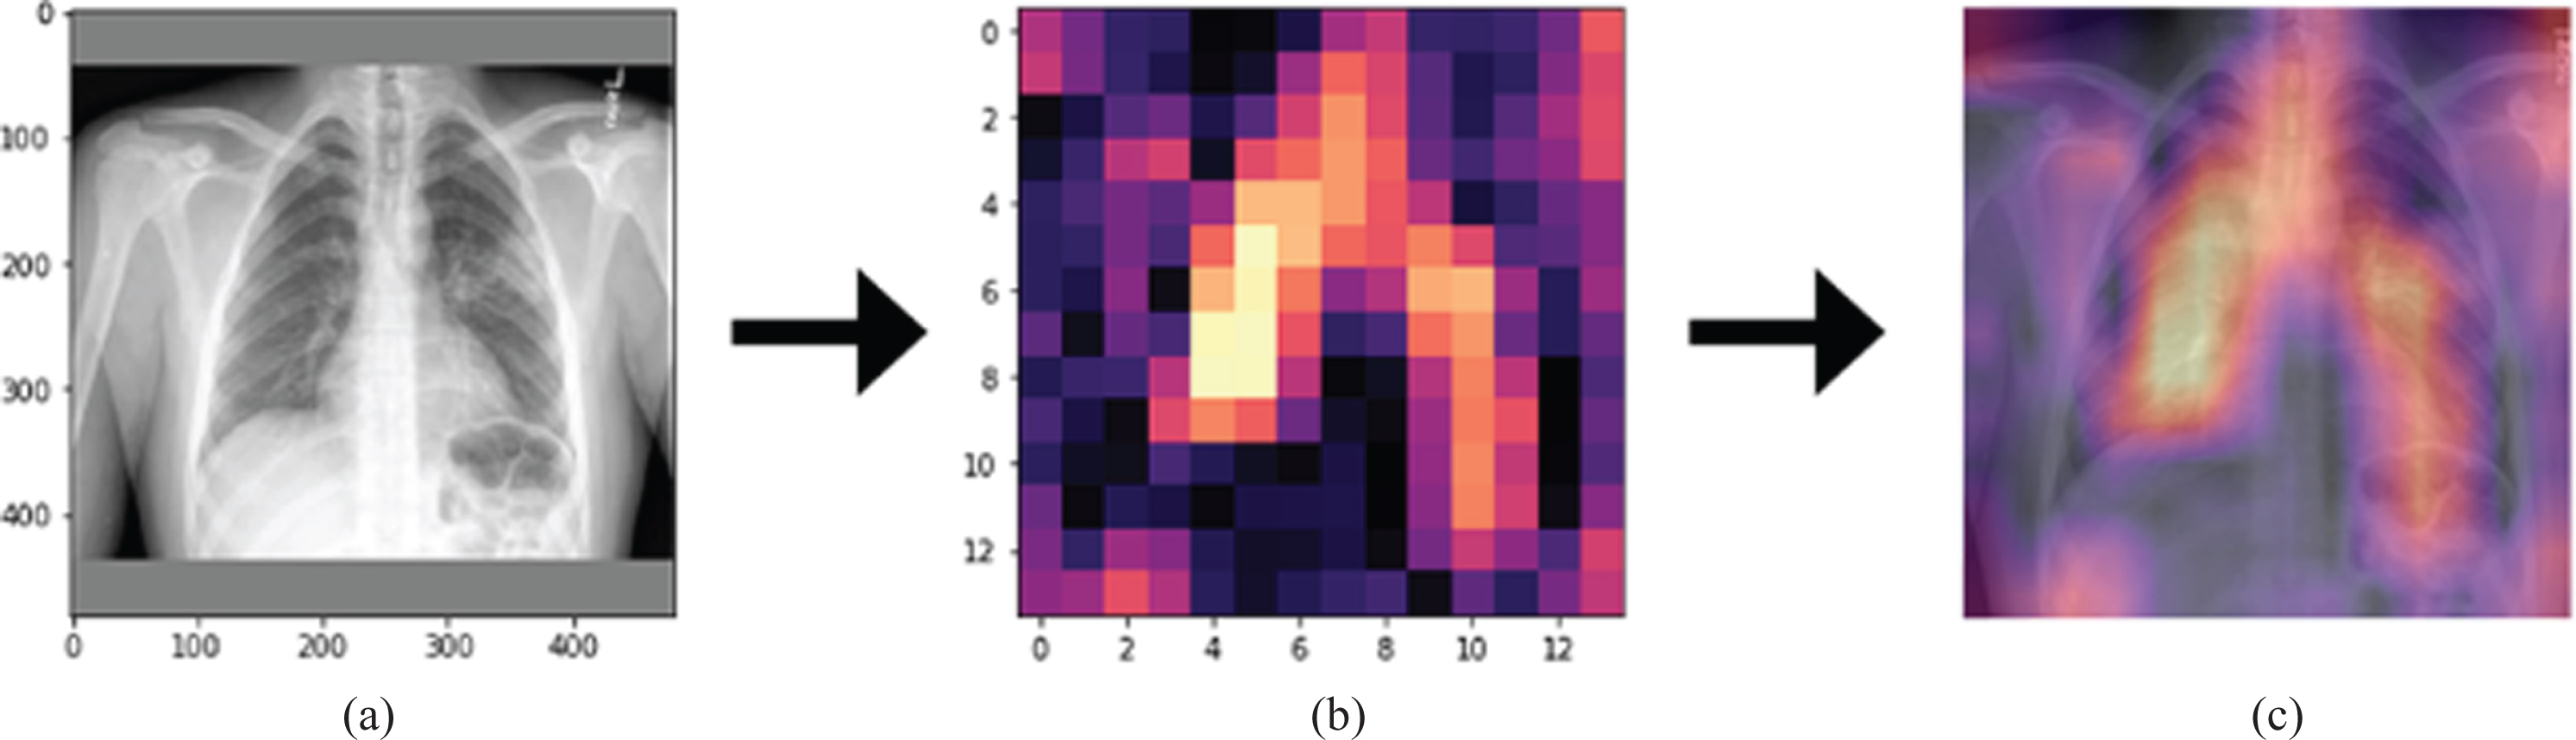
In Fig. 9, the original radiograph, the activation map obtained by the Grad-CAM algorithm, the overlaying of the original radiograph with the activation map was presented on the left, in the middle, and on the right, respectively. As can be seen from Fig. 9, on the far right, bright regions could be defined as regions containing the features that had the most effective role in artificial neural network decision making. In this way, causality and explainability were included in the study [23]. It was concluded that the developed model could be used in healthcare centers so that would no need to wait long times for the radiologists to interpret the images.
4Discussion
The rapid diagnosis and triaging are vital for the control of infectious diseases, specifically COVID-19. There is urgent requirement for alternative effective and timely diagnosis methods that can be utilized by front-line health care personal to quick and accurate diagnosis of COVID-19. The utilization of artificial intelligence-based models becomes prominent in screening of COVID-19 infected patients from radiological images. As depicted in Table 2. in literature, there are plenty of valuable works which used the similar datasets to train the CNN model to differentiate COVID-19 pneumonia from Chest CT scans of Chest x-ray images.
Table 2
The comparison of similar works for artificial intelligence based automated detection of COVID-19 pneumonia from chest x-ray images
| Study | Number of Cases | Method Used | Accuracy (%) |
| Apostolopoulos et al. [52] | 224 COVID-19 (+) | VGG-19 | 93.48 |
| 504 Healthy | |||
| Wang and Wong [51] | 53 COVID-19 (+) | ResNet-50 | 93.3 |
| 5526 COVID-19 (-) | |||
| 8066 Healthy | |||
| Hemdan et al. [50] | 25 COVID-19 (+) | VGG-19 | 90.0 |
| 25 Normal | |||
| Khobani et al. [56] | 76 COVID-19 (+) | ResNet-18 | 93.5 |
| 5526 Pneumonia | |||
| 8066 Healthy | |||
| Zhang et al. [57] | 493 COVID-19 (+) | ResNet-18 | 83.61 |
| 24596 Pneumonia | |||
| 18774 Healthy | |||
| Sethy and Behra [58] | 25 COVID-19 (+) | ResNet-50 | 95.38 |
| 25 COVID-19 (-) | |||
| Rahimzadeh and Attar [59] | 118 COVID-19 (+) | ResNet50V2/Xception | 91.4 |
| 6037 Pneumonia | |||
| 8868 Healthy | |||
| Hall et al. [60] | 33 COVID-19 (+) | VGG16/ResNet-50 | 93.12 |
| 208 Pneumonia | |||
| This study | 299 COVID-19 | nCOV-NET (optimized by finetuning with DenseNET-161) | 97.10 |
| 1522 Pneumonia |
For example, in a study conducted by Hemdan et al., the COVIDX-Net model with a 90% accuracy rate was developed to screen COVID-19 from x-ray images [50]. In another study reported by Wang and Wong, a deep learning approach based model called COVID-NET with 92.4% accuract rate was suggested for COVID-19 detection by using 16,756 chest x-ray images collected from different open access sources [51]. Ioannis et al. proposed a transfer learning model with a high accuracy rate of 98.75% for the detection of COVID-19 cases from radiology images [52]. With a similar purpose of automatic detection of COVID-19 cases from radiology images Narin et al. utilized different CNN architectures including ResNet50, ResNet101, ResNet152, InceptionV3, and Inception-ResNetV2, and they reported that ResNet50 model provided the highest classification performance in a range changes between 96.1% and 99.7% [53]. Singh et al. presented the performance of their proposed model by dividing the dataset at various training and testing rates, and they reported the highest accuracy as 94.65 % at 70% training and % 30 testing ratios [54]. In another study, COVID-19 positive, pneumonia, and other infection classes were employed for training the CNN model developed by Das et al., and the dataset was divided 70% training, 10% validation, and 20% for the testing dataset. The results proved that the developed model achieved 94.40 % accuracy over the testing dataset for differentiation COVID-19 cases [55].
Bearing all summarized information in mind, it can be concluded that most of the studies have a limited number of COVID-19 data and most of them used biased datasets, and it was observed that common architectures such as VGG and ResNet were used. Therefore, considering this problem, a deep convolutional neural network model called nCoV-NET was developed to screen COVID-19 infected patients from chest x-ray images, and it is aimed to eliminate the debias issue in other works. Moreover, this study was developed to show whether the proposed CNN model, nCoV-NET, can be utilized for differentiating COVID-19 pneumonia and other pneumonia with high sensitivity and accuracy for practical use.
The performance evaluation results of the model have pointed out the proof of principle that nCoV-NET can extract hallmarks of COVID-19 from chest x-ray radiographs to diagnose the COVID-19 pneumonia with an accuracy of 97.1%. As a result of training steps, it was concluded that only fully-connected layers were not enough to re-train. Thus, convolutional layers were also re-trained and the performances of the networks were increased with fine-tuning after the first stage. Although the performance results of all CNN architectures were determined close to each other, DenseNet-161 was identified as the most suitable CNN architecture among fine-tuned architectures. In the last step of the model development, an activation map was created by implementing the Grad-CAM algorithm, and radiologists were informed about which points artificial intelligence focused on the graph. In the evaluation process, all CNN architectures found the same 8 data of COVID-19 pneumonia as false-negative. This situation could explain why all architectures gave close results. In addition, this situation was thought to be due to both medical reasons such as mild lung involvement and limitations of monitoring materials and bias problem, as stated in the two hypotheses described in the results and discussion section. However, the main shortage of this study is the limited number of available data. The performance of this model is expected to increase by increasing the number of datasets. Furthermore, since we have used the latest version of the “COVID-19 image data collection” database, which is constantly updated in our study, it is thought that this work will contribute to the future COVID-19 studies. In addition, it is thought that comparing different architectures and choosing suitable architecture will make a great contribution to the literature. The main advantages of the proposed CNN model, nCoV-NET, can be listed as follows:
• With the developed debiasing data loader, the model was tried to be generalized by eliminating the bias problem.
• The proposed model has been prepared for models planned to be developed in the future with a transfer learning technique by using high bit depth DICOM graphics.
• The model achieved to differentiate COVID-19 cases with an accuracy of 97.10%
• Thanks to the activation mapping the model can highlighst the crucial areas on chest x-ray images to improve the causality and intelligibility.
• Different architectures with different weight layers including ResNet, DenseNet and VGG have been utilized in transfer learning stages to optimize the model.
5Conclusion
In this work, the performance of the transfer learning model was enhanced by implementing a debiasing-data-loader approach to avoid the bias problem and to obtain high accuracy values for automatic detection of COVID-19 cases from Chest x-ray images. In essence, it can be concluded that by utilizing proposed transfer learning model called nCoV-NET in the healthcare system the diagnosis time can significantly shorten so the disease can be effectively controlled and the possible spreading risk of virus can thus be prevented. Moreover, in this way, the work-load of the experts in the field can significantly be reduced. The developed nCoV-NET model works online at www.notrino.com/ncov-net and says that as a result of the graphic files given to the model, the graphic belongs to the class “COVID-19 Pneumonia” or “Other Pneumonias” with an accuracy of 97.10%, and by visualizing the activation map on the graphic, provides graphical information. The performance of the proposed model is evaluated by the expert radiologist from Akdeniz University Hospital, Turkey, and it is proved that it is ready to be tested with larger datasets.
Conflict of interest
The authors declare that they have no conflict of interest.
Ethical approval
This article does not contain any studies with human participants or animals performed by any of the authors.
References
[1] | Butt C. , Gill J. , Chun D. , Babu B.A. , Deep learning system to screen coronavirus disease 2019 pneumonia, Applied Intelligence ((2020) ), 1. |
[2] | Singhal T. , A Review of Coronavirus Disease-2019 (COVID-19), The Indian Journal of Pediatrics 87: ((2020) ), 281–286. |
[3] | Coronavirus disease 2019 (COVID-19) Situation Report – 51, WHO. Available at: https://www.who.int/docs/default-source/coronaviruse/situation-reports/20200311-sitrep-51-covid-19.pdf?sfvrsn=1ba62e57_10. Accessed July 17, (2020) . |
[4] | Ebrahim S.H. , Ahmed Q.A. , Gozzer E. , et al., Covid-19 and community mitigation strategies in a pandemic, The British Medical Journal 368: ((2020) ), m1066. |
[5] | ECDC Resource estimation for contact tracing, quarantine and monitoring activities for COVID-19 cases in the EU/EEA European Centre for Disease Prevention and Control (ECDC): Stockholm; 2020. Available at: https://www.ecdc.europa.eu/en/publications-data/resource-estimation-contact-tracing-quarantine-and-monitoring-activities-covid-19.pdf. Accessed July 17, (2020) . |
[6] | Wang L. , Wong A. , COVID-Net: A tailored deep convolutional neural network design for detection of COVID-19 cases from chest radiography images, arXiv 2020, preprint arXiv:2003.09871. |
[7] | Ai T. , Yang Z. , Hou H. , et al., Correlation of chest CT and RT-PCR testing in coronavirus disease 2019 (COVID-19) in China: a report of 1014 cases, Radiology ((2020) ), 200642. |
[8] | Zheng Q. , Lu Y. , Lure F. , et al., Clinical and radiological features of novel coronavirus pneumonia, Journal of X-ray Science and Technology 28: ((2020) ), 391–404. |
[9] | Wang S. , Kang B. , Ma J. , et al., A deep learning algorithm using CT images to screen for Corona Virus Disease (COVID-19), MedRxiv ((2020) ). |
[10] | Kanne J.P. , Little B.P. , Chung J.H. , et al., Essentials for radiologists on COVID-19: an update radiology scientific expert panel, Radiology ((2020) ), 200527. |
[11] | Zhang J. , Xie Y. , Li Y. , et al., COVID-19 screening on chest x-ray images using deep learning based anomaly detection, arXiv (2020), preprint arXiv:2003.12338. |
[12] | Xie X. , Zhong Z. , Zhao W. , et al., Chest CT for typical 2019-nCoV pneumonia: relationship to negative RT-PCR testing, Radiology ((2020) ), 200343. |
[13] | Lee E.Y. , Ng M.Y. , Khong P.L. , COVID-19 pneumonia: what has CT taught us? The Lancet Infectious Diseases 20: ((2020) ), 384–385. |
[14] | Elavarasan R.M. , Pugazhendhi R. , Restructured society and environment: A review on potential technological strategies to control the COVID-19 pandemic, Science of the Total Environment ((2020) ), 138858. |
[15] | Kulkarni S. , Seneviratne N. , Baig M.S. , Khan A.H.A. , Artificial intelligence in medicine: where are we now? Academic Radiology 27: ((2020) ), 62–70. |
[16] | LeCun Y. , Bengio Y. , Hinton G. , Deep learning, Nature, 521: ((2015) ), 436–444. |
[17] | Gozes O. , Frid-Adar M. , Greenspan H. , et al., Rapid AI development cycle for the coronavirus (COVID-19) pandemic: Initial results for automated detection & patient monitoring using deep learning CT image analysis, arXiv (2020), preprint arXiv:2003.05037. |
[18] | Shan F. , Gao Y. , Wang J. , et al., Lung infection quantification of COVID-19 in CT images with deep learning, arXiv (2020), preprint arXiv:2003.04655. |
[19] | Jain R. , Gupta M. , Taneja S. , Hemanth D.J. , Deep learning based detection and analysis of COVID-19 on chest X-ray images, Applied Intelligence ((2020) ), 1–11. |
[20] | Minaee S. , Kafieh R. , Sonka M. , et al., Deep-covid: Predicting covid-19 from chest x-ray images using deep transfer learning, arXiv (2020) preprint arXiv:2004.09363. |
[21] | Ouchicha C. , Ammor O. , Meknassi M. , CVDNet: A novel deep learning architecture for detection of coronavirus (Covid-19) from chest x-ray images, Chaos, Solitons & Fractals 140: ((2020) ), 110245. |
[22] | Panwar H. , Gupta P.K. , Siddiqui M.K. , et al., A deep learning and grad-CAM based color visualization approach for fast detection of COVID-19 cases using chest X-ray and CT-Scan images, Chaos, Solitons & Fractals 140: ((2020) ), 110190. |
[23] | Ozturk T. , Talo M. , Yildirim E.A. , et al., Automated detection of COVID-19 cases using deep neural networks with X-ray images, Computers in Biology and Medicine ((2020) ), 103792. |
[24] | Albahli S. , Albattah W. , Detection of coronavirus disease from X-ray images using deep learning and transfer learning algorithms, Journal of X-ray Science and Technology 28: ((2020) ), 841–850. |
[25] | Asnaoui K.E. , Chawki Y. , Idri A. , Automated methods for detection and classification pneumonia based on x-ray images using deep learning. ArXiv (2020) preprint arXiv:2003.14363. |
[26] | Che Azemin M.Z. , Hassan R. Mohd Tamri M.I. , et al., COVID-19 deep learning prediction model using publicly available radiologist-adjudicated chest X-ray images as training data: preliminary findings, International Journal of Biomedical Imaging ((2020) ). |
[27] | Bassi P.R. , Attux R. , A Deep Convolutional Neural Network for COVID-19 Detection Using Chest X-Rays, ArXiv (2020) preprint arXiv:2005.01578. |
[28] | Open Access Biomedical Image Search Engine. Available at: https://openi.nlm.nih.gov/ Accessed November 2, (2020) . |
[29] | Rajpurkar P. , Irvin J. , Zhu K. , et al., CheXnet: Radiologist-level pneumonia detection on chest x-rays with deep learning. arXiv (2017), preprint arXiv:1711.05225. |
[30] | Wang X. , Peng Y. , Lu L. , et al., Chestx-ray8: Hospital-scale chest x-ray database and benchmarks on weakly-supervised classification and localization of common thorax diseases, In: Proceedings of the IEEE conference on computer vision and pattern recognition ((2017) ), 2097–2106. |
[31] | Cohen J.P. , Morrison P. , Dao L. , COVID-19 image data collection., arXiv (2020), preprint arXiv:2003.11597. |
[32] | Open Source Computer Vision (OpenCV) Library. Available at: https://github.com/opencv/opencv/wiki/CiteOpenCV Accessed July 17, (2020) . |
[33] | Fastai. Available at: https://www.fast.ai/ Accessed July 17, 2020. |
[34] | He K. , Zhang X. , Ren S. , Sun J. , Deep residual learning for image recognition, In: Proceedings of the IEEE conference on computer vision and pattern recognition ((2016) ), 770–778. |
[35] | Huang G. , Liu Z. , Van Der Maaten L. and Weinberger K.Q. , Densely connected convolutional networks, In: Proceedings of the IEEE Conference on Computer Vision and Pattern Recognition ((2017) ), 4700–4708. |
[36] | Simonyan K. , Zisserman A. , Very deep convolutional networks for large-scale image recognition, arXiv (2014), preprint arXiv:1409.1556. |
[37] | ImageNET. Available at: http://www.image-net.org/papers/imagenet_cvpr09.bi Accessed May 17, 2020. |
[38] | Loshchilov I. , Hutter F. , SGDR: Stochastic gradient descent with warm restarts, arXiv (2016), preprint arXiv:1608.03983. |
[39] | Huang G. , Li Y. , Pleiss G. , et al., Snapshot ensembles: Train 1, get M for free, arXiv (2017), preprint arXiv:1704.00109. |
[40] | Holzinger A. , Langs G. , Denk H. , et al., Causability and explainability of artificial intelligence in medicine, WIRES Data Mining and Knowledge Discovery 9: ((2019) ), 1312. |
[41] | Selvaraju R.R. , Cogswell M. , Das A. , et al., Grad-CAM: Visual explanations from deep networks via gradient-based localization, In Proceedings of the IEEE international conference on computer vision, ((2017) ), 618–626. |
[42] | Bengio Y. , Courville A. , Vincent P. , Representation learning: A review and new perspectives, IEEE Transactions on Pattern Analysis and Machine Intelligence 35: ((2013) ), 1798–1828. |
[43] | Mahendran A. , Vedaldi A. , Salient deconvolutional networks, In European Conference on Computer Vision ((2016) ), 120–135. |
[44] | Fawcett T. , An introduction to ROC analysis, Pattern Recognition Letters 27: ((2006) ), 861–874. |
[45] | Talo M. , Automated classification of histopathology images using transfer learning, Artificial Intelligence in Medicine 101: ((2019) ), 101743. |
[46] | Toğaçar M. , Cömert Z. and Ergen B. , Classification of brain MRI using hyper column technique with convolutional neural network and feature selection method, Expert Systems with Applications 149: ((2020) ), 113274. |
[47] | Vesal S. , Ravikumar N. , Davari A. , et al., Classification of breast cancer histology images using ransfer learning, In: International conference image analysis and recognition Springer, Cham ((2018) ), 812–819. |
[48] | Tommasi T. , Patricia N. , Caputo B. , et al., A deeper look at dataset bias, In: Domain adatation in computer vision applications Springer, Cham ((2017) ), 37–55. |
[49] | Khan A.N. , Al-Jahdali H. , Sarah A.G. , et al., Reading chest radiographs in the critically ill (Part II): Radiography of lung pathologies common in the ICU patient, Annals Thoracic Medicine 4: ((2009) ), 149. |
[50] | Hemdan E.E.D. , Shouman M.A. , Karar M.E. , COVIDX-Net: A framework of deep learning classifiers to diagnose COVID-19 in x-ray images, ArXiv (2020), preprint arXiv:2003.11055. |
[51] | Wang L. , Wong A. , COVID-Net: A Tailored Deep Convolutional Neural Network Design for Detection of COVID-19 Cases from Chest Radiography Images, arXiv (2020), preprint arXiv:2003.09871. |
[52] | Apostolopoulos I.D. , Mpesiana T.A. , Covid-19: automatic detection from x-ray images utilizing transfer learning with convolutional neural networks, Physical and Engineering Sciences in Medicine ((2020) ), 1. |
[53] | Narin A. , Kaya C. , Pamuk Z. , Automatic detection of coronavirus disease (covid-19) using x-ray images and deep convolutional neural networks, ArXiv(2020), preprint arXiv:2003.10849 |
[54] | Singh D. , Kumar V. , Kaur M. , Classification of COVID-19 patients from chest CT images using multi-objective differential evolution–based convolutional neural networks, European Journal of Clinical Microbiology & Infectious Diseases 8: ((2020) ), 1–11. |
[55] | Das N.N. , Kumar N. , Kaur M. , et al., Automated Deep Transfer LearningBased Approach for Detection of COVID-19 Infection in Chest X-rays, IRBM ((2020) ). |
[56] | Khobahi S. , Agarwa C. , Soltanalian M. , CoroNet: A deep network architecture for semi-supervised task-based identification of COVID-19 from chest X-ray images, medRxiv ((2020) ). |
[57] | Zhang J. , Xie Y. , Liao Z. , et al., Viral pneumonia screening on chest x-ray images using confidence-aware anomaly detection, arXiv (2020), preprint arXiv:2003.12338. |
[58] | Sethy P.K. , Behera S.K. , Detection of coronavirus disease (covid-19) based on deep features, Preprints ((2020) ), 2020030300. |
[59] | Rahimzadeh M. , Attar A. , A New Modified Deep Convolutional Neural Network for Detecting COVID-19 from X-ray Images, arXiv (2020) preprint arXiv:2004.08052. |
[60] | Hall L.O. , Paul R. , Goldgof D.B. , et al., Finding covid-19 from chest x-rays using deep learning on a small dataset, arXiv (2020) preprint arXiv:2004.02060. |


