
A retrospective study of the initial chest CT imaging findings in 50 COVID-19 patients stratified by gender and age
Abstract
OBJECTIVE:
To retrospectively analyze and stratify the initial clinical features and chest CT imaging findings of patients with COVID-19 by gender and age.
METHODS:
Data of 50 COVID-19 patients were collected in two hospitals. The clinical manifestations, laboratory examination and chest CT imaging features were analyzed, and a stratification analysis was performed according to gender and age [younger group: <50 years old, elderly group ≥50 years old].
RESULTS:
Most patients had a history of epidemic exposure within 2 weeks (96%). The main clinical complaints are fever (54%) and cough (46%). In chest CT images, ground-glass opacity (GGO) is the most common feature (37/38, 97%) in abnormal CT findings, with the remaining 12 patients (12/50, 24%) presenting normal CT images. Other concomitant abnormalities include dilatation of vessels in lesion (76%), interlobular thickening (47%), adjacent pleural thickening (37%), focal consolidation (26%), nodules (16%) and honeycomb pattern (13%). The lesions were distributed in the periphery (50%) or mixed (50%). Subgroup analysis showed that there was no difference in the gender distribution of all the clinical and imaging features. Laboratory findings, interlobular thickening, honeycomb pattern and nodules demonstrated remarkable difference between younger group and elderly group. The average CT score for pulmonary involvement degree was 5.0±4.7. Correlation analysis revealed that CT score was significantly correlated with age, body temperature and days from illness onset (p < 0.05).
CONCLUSIONS:
COVID-19 has various clinical and imaging appearances. However, it has certain characteristics that can be stratified. CT plays an important role in disease diagnosis and early intervention.
1Introduction
In late December 2019, a new coronavirus disease (COVID-19) caused by SARS-CoV-2 had been discovered and quickly spread to many countries around the world [1, 2]. World Health Organization (WHO) had declared this global outbreak disease as a pandemic [3].
SARS-CoV-2 is a new type of β coronavirus that has never been seen before. From the recently published literature, the epidemiologic, clinical features and radiological imaging of COVID-19 have been described [4– 6]. Clinical manifestations and chest CT examination were important for the clinical screening of COVID-19. CT imaging plays an important role in the diagnosis of COVID-19, especially in the early stages of the disease or with a low viral load; real-time reverse-transcriptase-polymerase chain reaction (rRT-PCR) may produce initial false negative results [7, 8]. Thus, it is important to study the initial features of patients with COVID-19. According to recent data, COVID-19 pneumonial has various clinical and imaging manifestations. GGO is the most common features, the other reported features include septal thickening, consolidation, pulmonary nodules, pulmonary nodules with a halo sign, crazy-paving pattern, microvascular dilation sign, pleural thickening, air bronchogram sign and so on [9– 12]. To date, most of reports have focused on the pattern and distribution of initial CT findings of COVID-19 pneumonial. However, whether these findings differ between different genders and ages has not been studied. Therefore, further subgroup analysis for individualizing diagnosis and improving clinicians and radiologists’ diagnostic confidence was needed.
The aim of this study was to analyze and stratify the clinical features and initial CT findings of 50 patients diagnosed with COVID-19 in two institution to better detect and diagnose this epidemic disease.
2Methods
2.1DATA sources
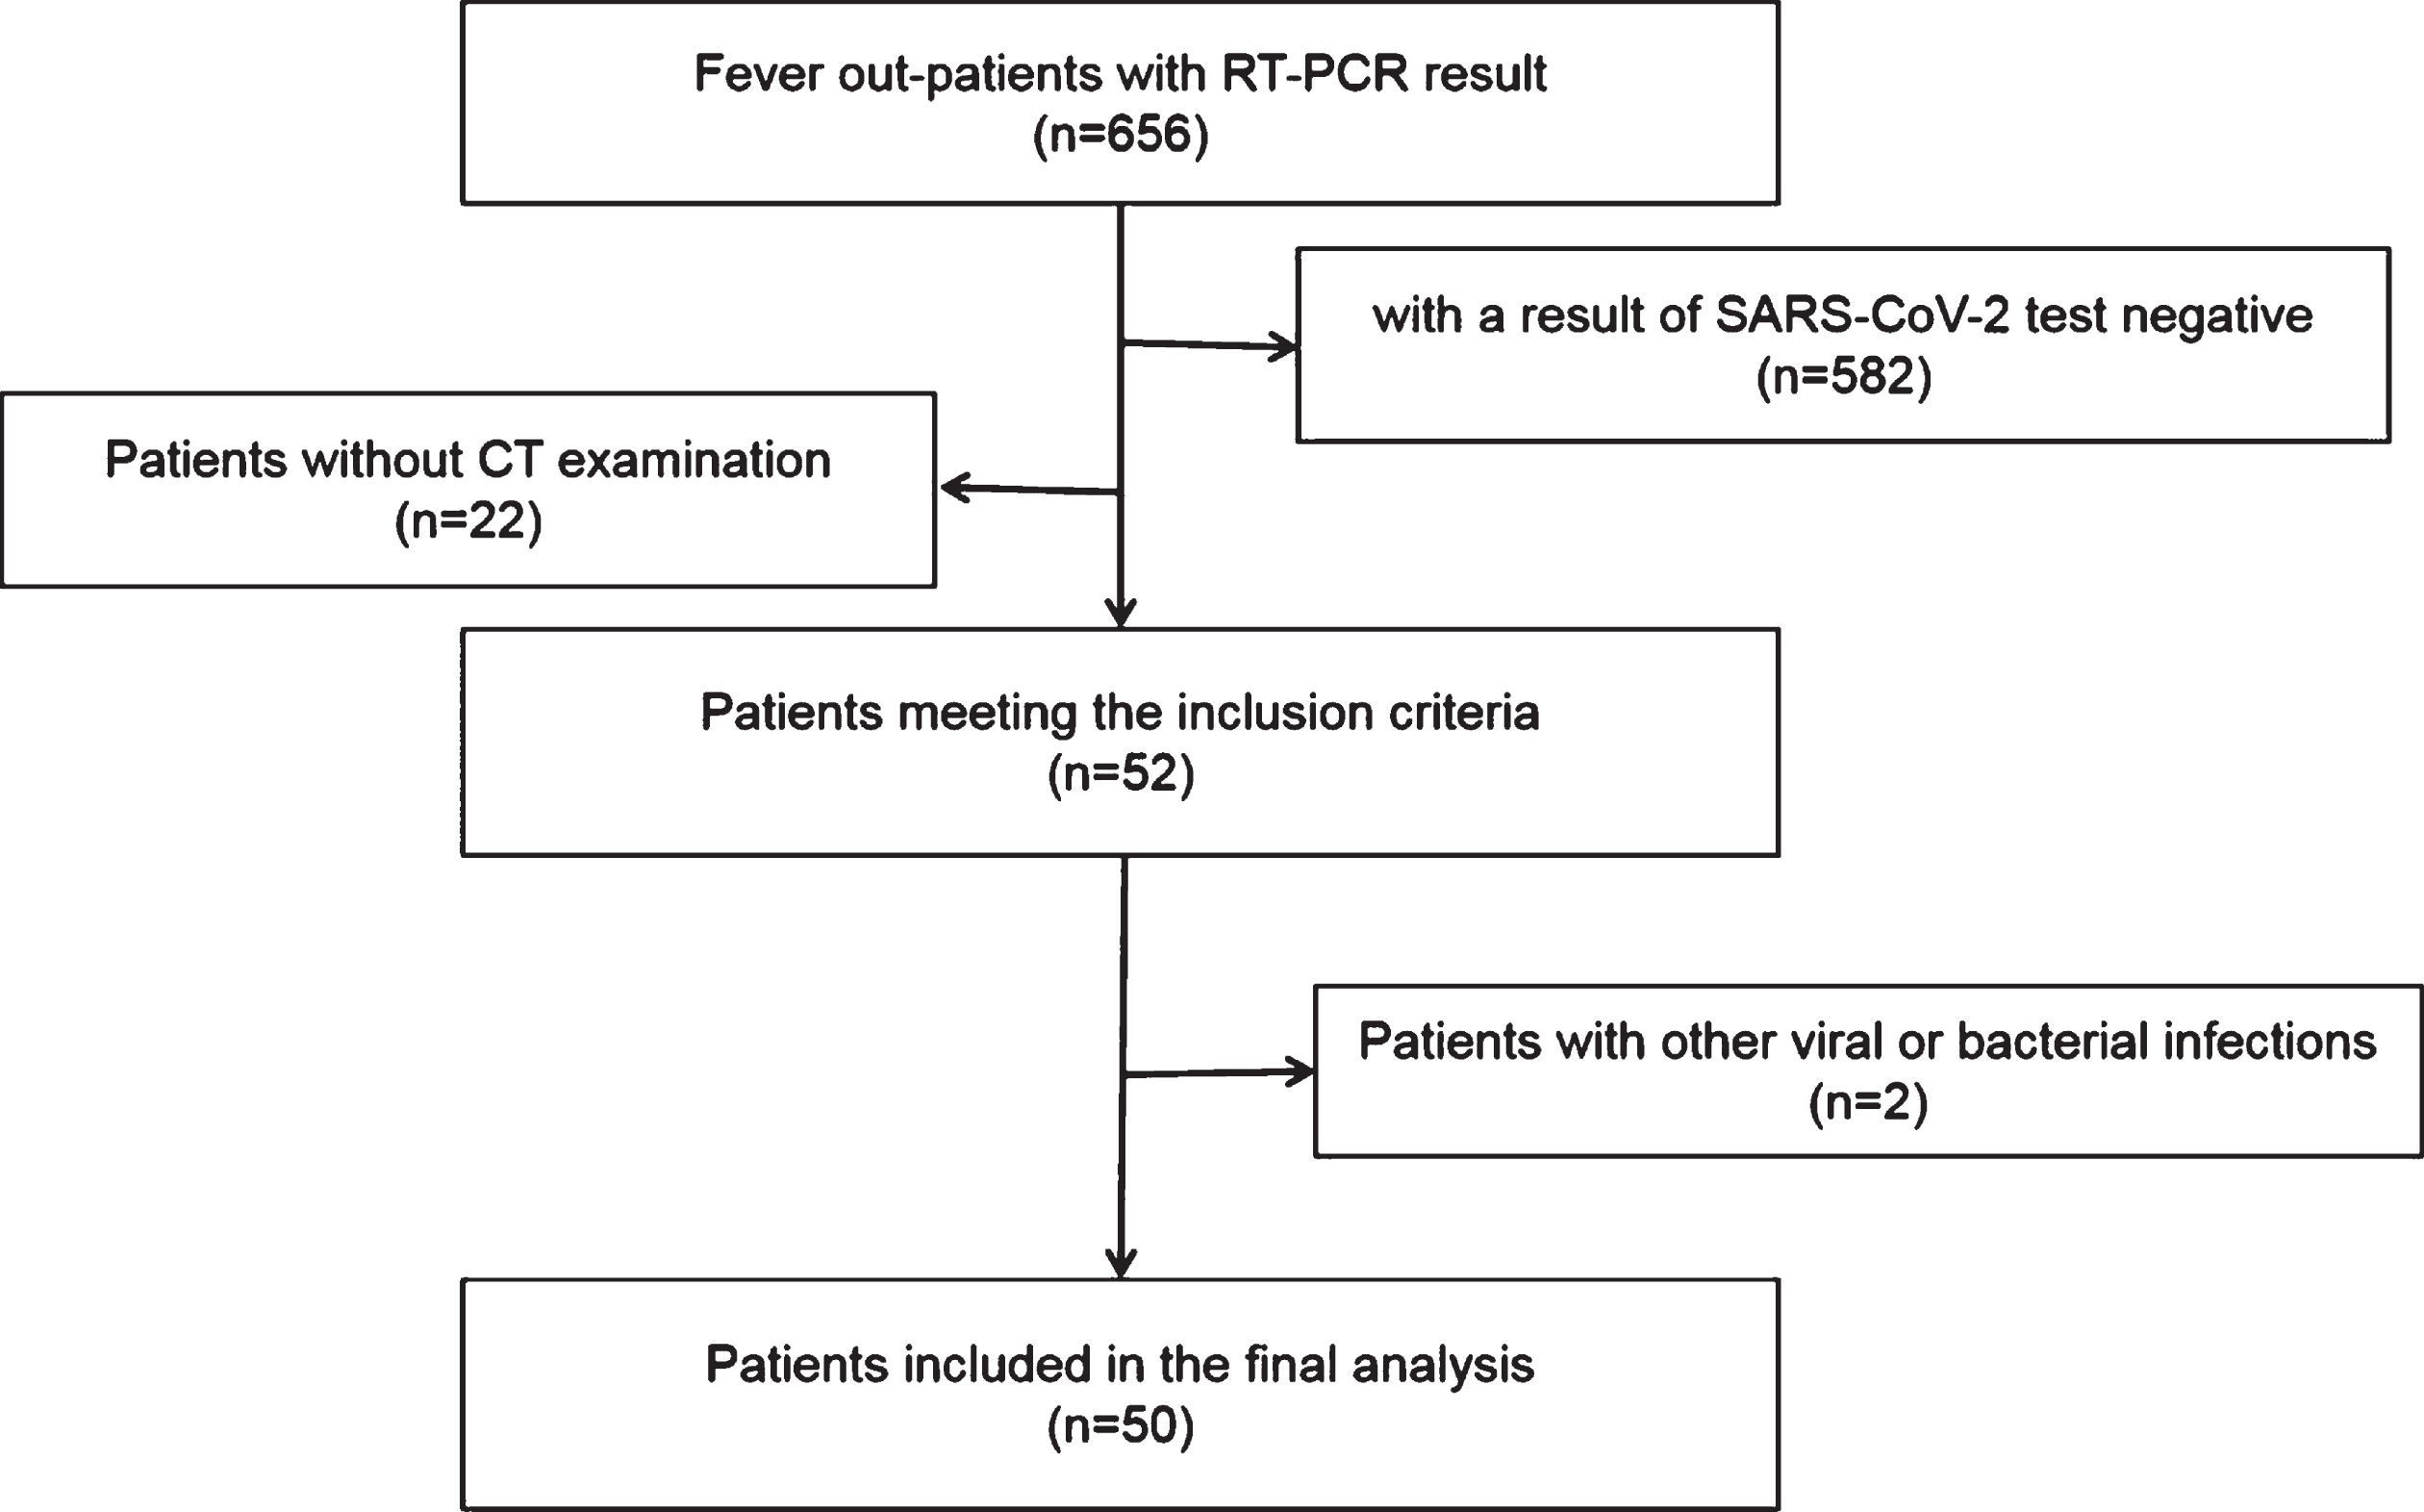
Two hospital ethics committee approved this retrospective study and waived the requirement for informed consent. We retrospectively collected the clinical, laboratory and CT imaging data of 656 outpatients who presented fever from the time of the initial outbreak of COVID-19 to February 25, 2020 in two hospital. Inclusion criteria were as follows: (1) Respiratory secretions (nasopharynx, oropharynx or bronchoalveolar lavage) were RT-PCR positive for SARS-CoV-2. (2) Laboratory examinations within 1 day before or after the initial CT scan. (3) Complete clinical data and CT imaging data. The exclusion criteria were as follows: 1. other influenza viruses, and 2. no initial imaging data. Among the 656 outpatients, 74 were positive for the SARS-CoV-2 nucleic acid test, 50 of whom were included in this study (Fig. 1). The median time from symptoms onset to first visit doctor was 5.8 (1– 14) days.
Fig.1
The workflow of patient data collection.
2.2High-resolution chest CT scanning protocol
All high-resolution CT examinations were performed with 16-row spiral CT (Brilliance 16, Philips, Holland). To minimize motion artifacts, patients was required to breath-holding, CT scan was completed during a single breast-hold. The CT parameters were as follows: tube voltage 100– 120 kV, and tube current 200– 300 mAs. CT images were reconstructed as axial images with a matrix size of 512×512 (slice thickness of 1.0 mm).
2.3CT Imaging evaluation
The evaluation of all CT imaging features was independently completed by three senior radiologists, and disagreements were decided by the most experienced radiologist after discussion. According to the viral pneumonia literature [13– 15], the imaging features of the evaluation include the following: (1) ground glass opacity (GGO), (2) lesion with dilatation of vessels, (3) the presences of interlobular thickening, (4) lesion-adjacent pleural thickening, (5) honeycomb pattern, (6) nodules, (7) consolidation, and (8) other abnormalities (including small airway wall thickening, fibrosis, pleural effusion and mediastinal lymph node lesions). The degree of pulmonary involvement of these abnormalities was evaluated by a semiquantitative scoring system [16]. Each of the five lung lobes was assessed for degree of involvement and scored as 0 (no involvement), 1 (<5% involvement), 2 (5– 25% involvement), 3 (26– 49% involvement), 4 (50– 75% involvement), or 5 (>75% involvement). The total CT score was the sum of the individual lobar scores and ranged from 0 (no involvement) to 25 (maximum involvement). Lesions located within 3 cm from the hilum were regarded as central distribution; lesions located within 3 cm from the visceral pleura were regarded as subpleural distribution; and mixed distribution were regarded as all other distribution patterns [17].
2.4Statistical analysis
All data were analyzed with SPSS 20.0 (IBM, Armonk, NY, USA) statistical software. The continuous measurements between two samples were compared with t-test or Whitney U test, the categorical variables were expressed as the frequency and percentage and were tested by the chi-squared test or Fisher exact probability method. The correlations between all parameters were calculated by using Spearman-rank correlation test. P value of <0.05 was considered statistically significant.
3Results
3.1Patients characteristics
Table 1 listed the clinical characteristics of the patients. A total of 50 patients (25 males and 25 females) were included in the study. The average age was 44.84±16.26 years, with a median age of 41 years (age range: 12– 84 years old). Mostly patients (46/50, 92%) had a history of direct or indirect exposure history within 2 weeks before they were seen at hospital. The main initial complaints were fever (27/50, 54%), cough (23/50, 46%) and fatigue (18/50, 36%). The highest body temperature was 38.8 °C, and there were no patients with high fever. The initial laboratory test of 50 patients showed normal (30/50, 60%) or decreased leukocyte (10/50, 20%), decreased lymphocyte counts (7/50, 14%) or increased lymphocyte counts (3/50, 6%)
Table 1
Basic Characteristics of 50 patients Diagnosed with COVID-19
| Characteristics | No. of patients |
| Sex | |
| Male | 25(50%) |
| Female | 25(50%) |
| Age (years) | |
| Mean±SD | 44.84±16.26 |
| Exposure history | |
| Yes | 46(92%) |
| Unknown | 4(8%) |
| Symptoms | |
| Fever | 27(54%) |
| Cough | 23(46%) |
| Fatigue | 18(36%) |
| Others | 16(32%) |
| Laboratory findings | |
| Normal | 30(60%) |
| Abnormal | 20(40%) |
3.2High-resolution chest CT findings
3.2.1Location and distribution
Of 50 confirmed patients, 38 (38/50, 76%) showed abnormal CT manifestations, and 12 (12/50, 24%) showed normal CT manifestations. Twenty-nine (29/38, 76%) showed bilateral lung lesions with subpleural (19/38, 50%) or mixed (19/38, 50%) distributions, but none of the patients presented with central distribution. The lower lobe of the lung was more involved than the upper lobe of the lung (50% vs. 36%), and the lower lobe of the right lung was quite commonly involved (32/120, 27%) (Table 2).
Table 2
CT Findings Distribution of the 50 Patients Diagnosed with COVID-19
| Characteristic | Findings | No. of patients (%) |
| Distribution | ||
| Periphery | 19 (42.31) | |
| Mixed | 19 (38.46) | |
| Involved lung | ||
| Left lung | 2 (5.26) | |
| Right lung | 7 (18.42) | |
| Both lung | 29 (76.32) | |
| Involved lobes | ||
| Right upper lobe | 22 (18.33) | |
| Right middle lobe | 16 (13.33) | |
| Right lower lobe | 32 (26.67) | |
| Left upper lobe | 22 (18.33) | |
| Left lower lobe | 28 (23.33) |
3.2.2CT features and scores
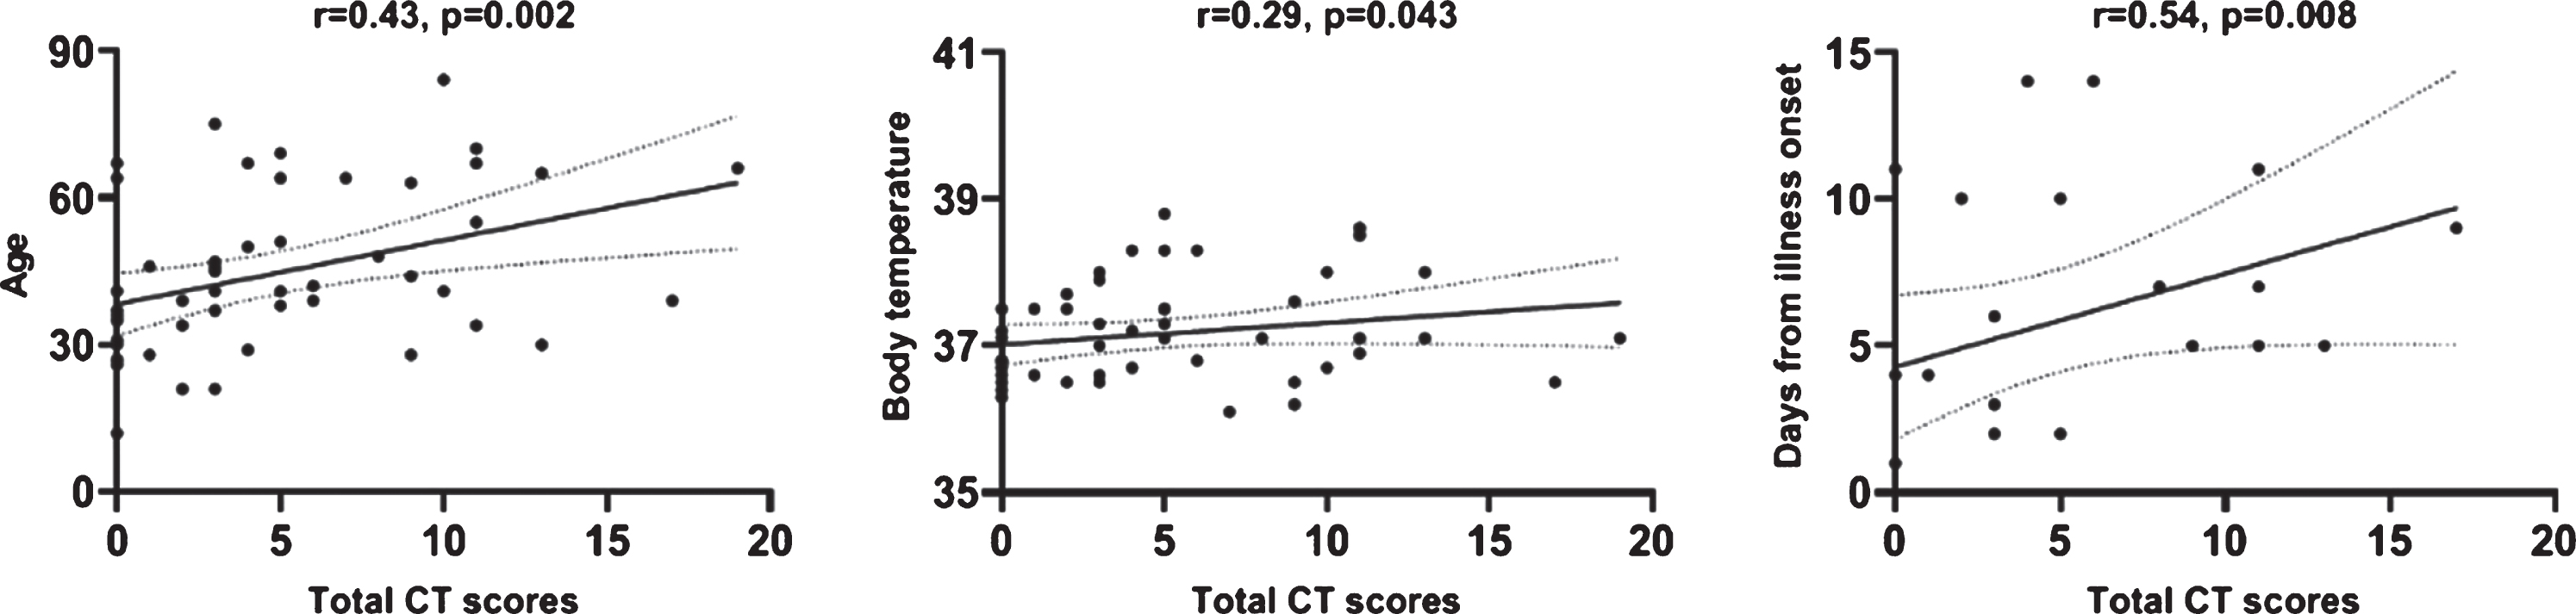
The CT imaging features were summarized in Figs. 2 and 3. GGO was the most common abnormality in all 38 cases with abnormal CT manifestations, with 4 cases (4/8, 11%) presenting an only GGO. Other concomitant abnormalities included dilatation of vessels in lesion (29/38, 76%), interlobular thickening (18/38, 47%), adjacent pleural thickening (14/38, 37%), focal consolidation (10/38, 26%), nodules (6/38, 16%) and honeycomb pattern (5/38, 13%). None of the patients had pleural effusion or mediastinal lymphadenopathy. After scoring the degree of pulmonary involvement, the 12 patients with a normal CT received a score of 0, and the average score of the other 38 patients was 6.61±4.40 (range 1– 19). Correlation analysis showed that CT score was significantly correlated with age, body temperature and days from illness onset. The correlation coefficient values were 0.43, 0.29, 0.54 respectively (Fig. 4).
Fig.2
Distribution of CT features. The number of patients with corresponding feature is presented on the right side of horizontal axis.
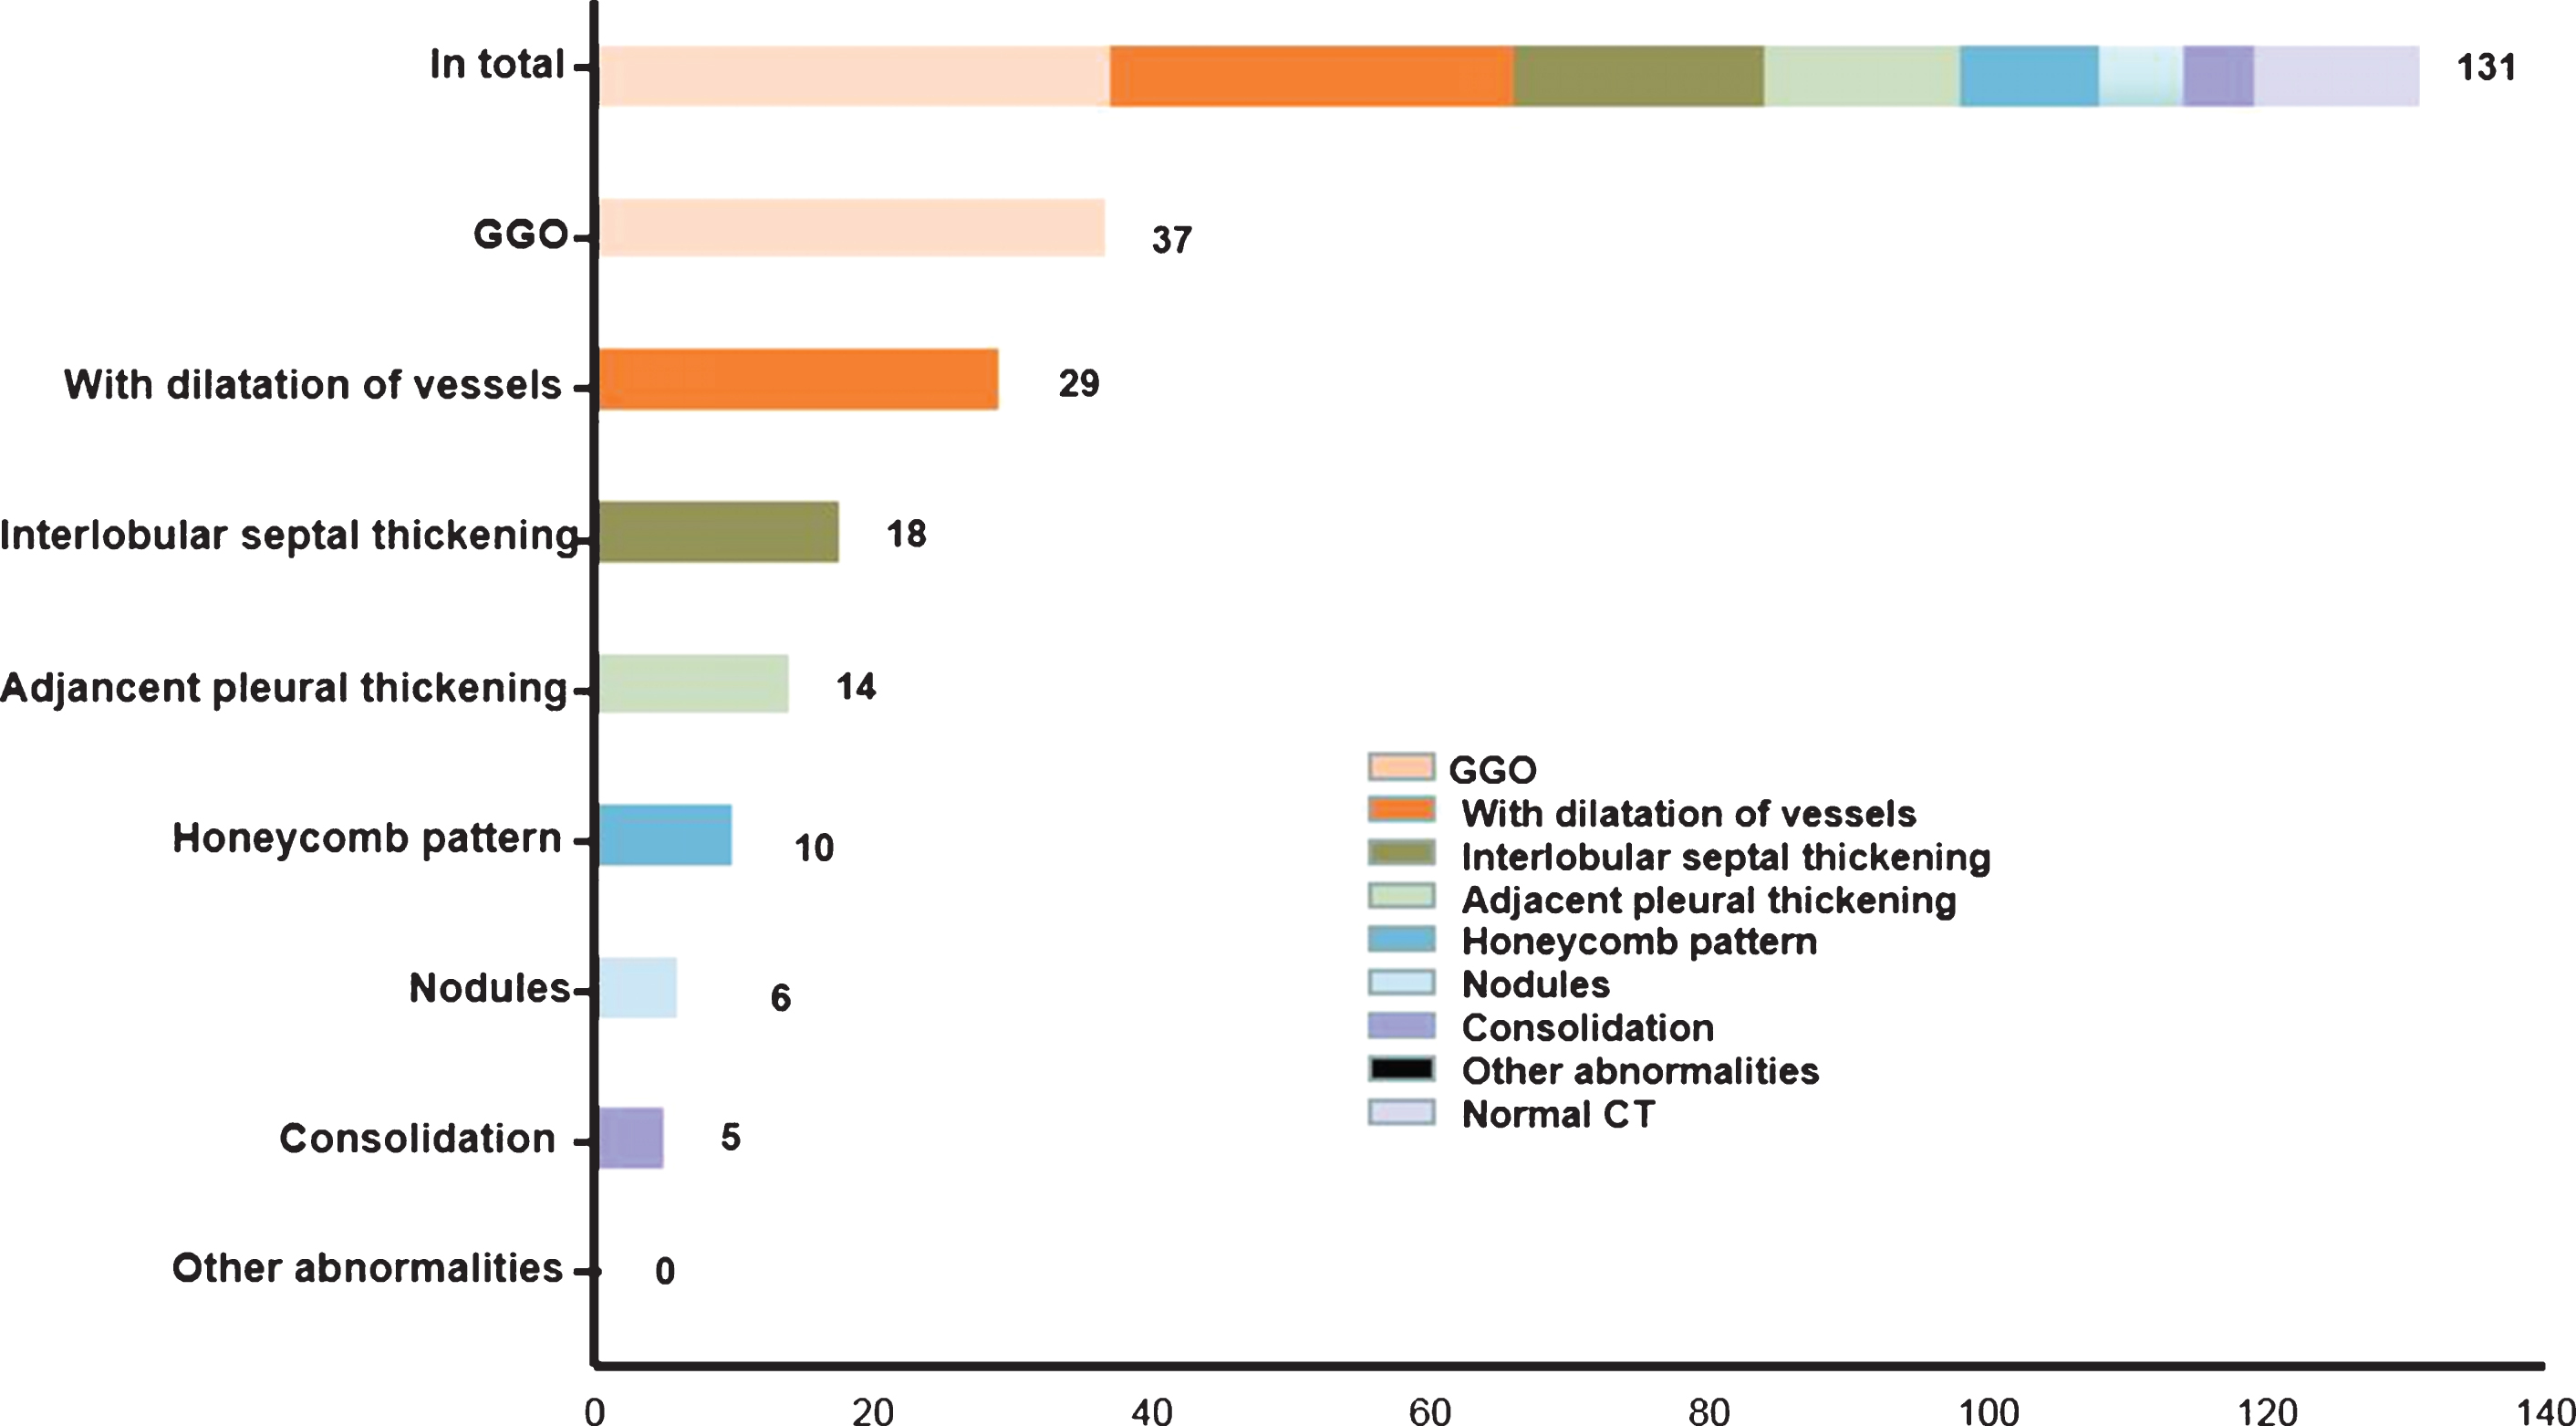
Fig.3
CT findings of COVID-19 pneumonia. The red arrows and boxes indicated the abnormalities. Multifocal GGO was showed in both lungs, subpleural distribution (a) or the mixed distribution (b). Concomitant features included lesion with dilatation of vessels (c, d), Interlobular septal thickening (c), and lesion adjacent pleural thickening (d). The rare CT features were nodules (e), honeycomb pattern (f), and focal consolidation (g).
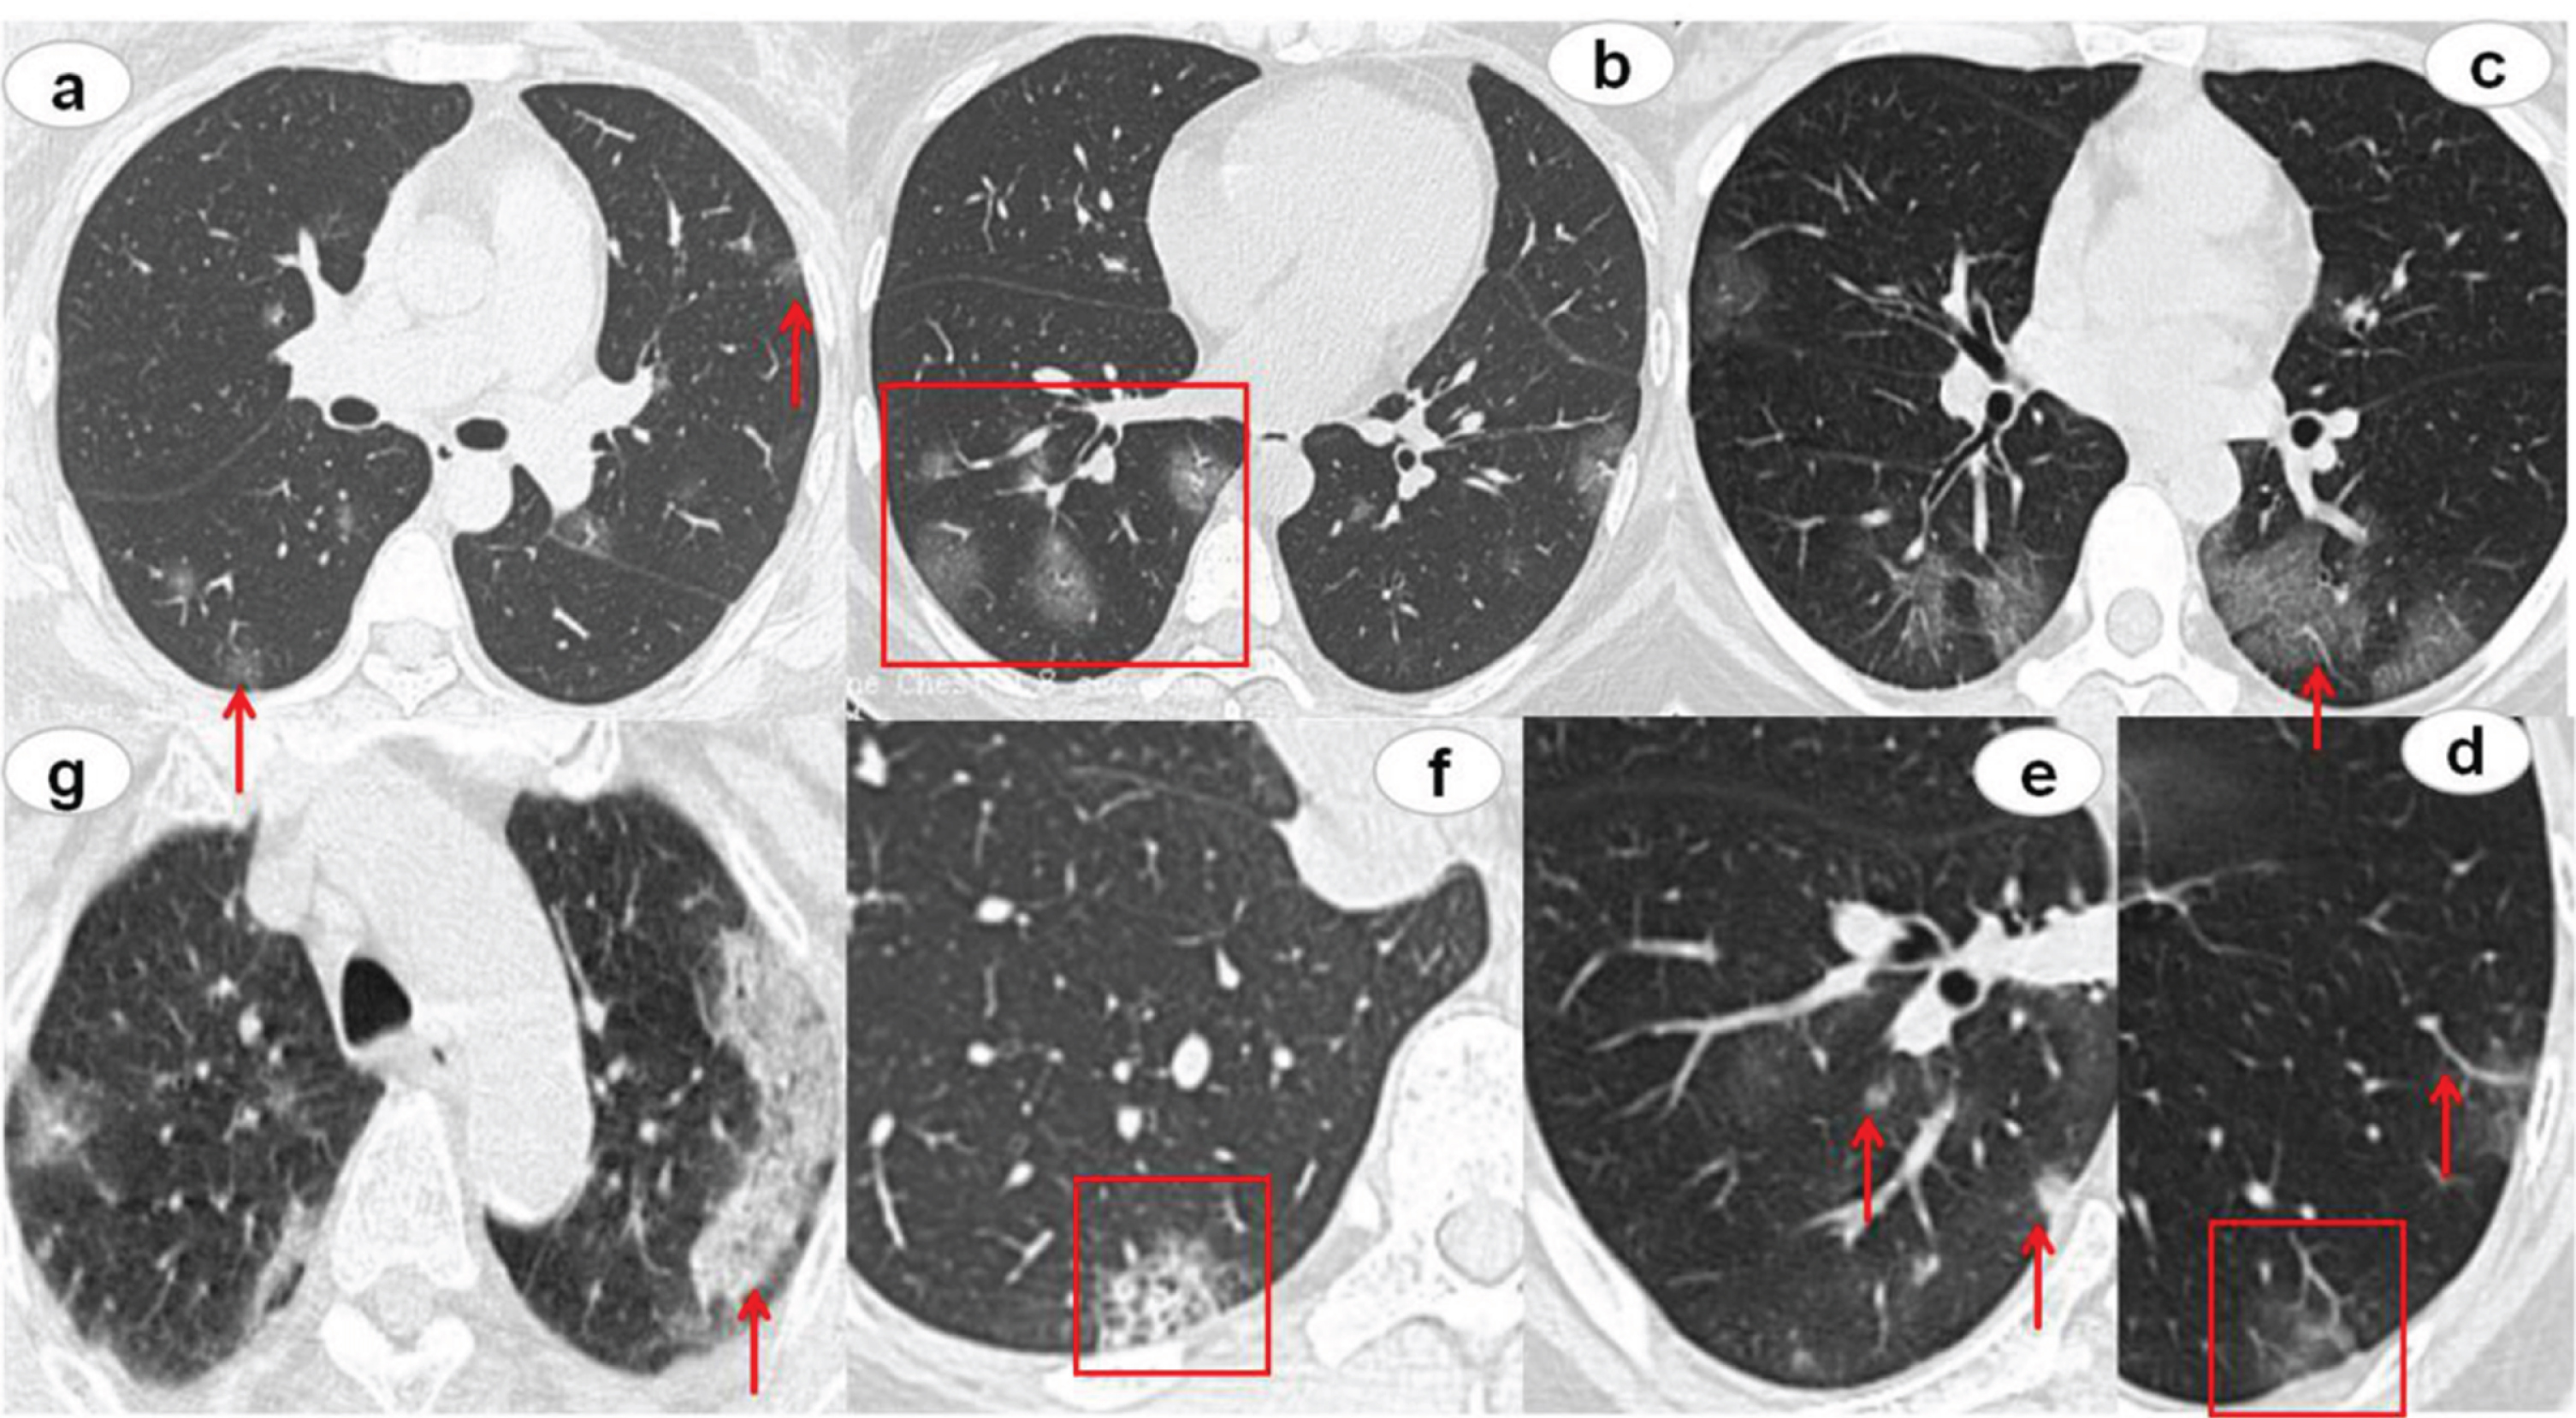
Fig.4
The graph of the data correlation analysis.
3.3Stratification analysis by sex and age
Furthermore, the patients’ clinical features and CT findings were stratified by sex and age. We found that there was no difference in the sex distribution of all the clinical and imaging features. However, the laboratory findings, interlobular thickening, honeycomb pattern and nodules demonstrated remarkable difference between younger group and elderly group (all P < 0.05). It seemed that normal laboratory results and interlobular thickening, honeycomb pattern were more likely to be found in the elderly group. Nodules were more common in the younger group. In addition, interestingly, the total CT score was significantly different between different age groups (P = 0.01), the average total CT score in elderly group was 7.3 while in younger group was 3.9 (Table 3).
Table 3
Clinical Characteristics and CT Findings among Different Patient Groups Stratified by Gender and Age
| Characteristics | Age<50years | Age≥50years | P | Male | Female | P |
| (n = 34) | (n = 16) | (n = 25) | (n = 25) | |||
| Laboratory findings | 0.01a | 0.56 | ||||
| Normal | 16 | 14 | 14 | 16 | ||
| Abnormal | 18 | 2 | 11 | 9 | ||
| Temperature | 0.41 | 0.78 | ||||
| Normal | 17 | 6 | 11 | 12 | ||
| Abnormal | 17 | 10 | 14 | 13 | ||
| Distribution | 0.18 | 0.75 | ||||
| Periphery | 14 | 5 | 10 | 9 | ||
| Mixed | 10 | 9 | 9 | 10 | ||
| GGO | 23 | 14 | 0.45 | 19 | 18 | 0.31 |
| With dilatation of vessels | 16 | 13 | 0.07 | 13 | 16 | 0.26 |
| Interlobular thickening | 8 | 10 | 0.02a | 6 | 12 | 0.05 |
| Adjacent pleural thickening | 8 | 6 | 0.56 | 8 | 6 | 0.50 |
| Honeycomb pattern | 1 | 4 | 0.03a | 3 | 2 | 0.63 |
| Nodules | 6 | 0 | 0.04a | 4 | 2 | 0.38 |
| Consolidation | 7 | 3 | 0.61 | 6 | 4 | 0.46 |
| Other abnormalities | 0 | 0 | NA | 0 | 0 | NA |
| Normal CT | 10 | 2 | 0.19 | 6 | 6 | 1.00 |
| CT score | 3.94(±4.29) | 7.31(±5.06) | 0.01a | 5.00(±5.39) | 5.04(±4.18) | 0.74 |
Note-Data are number of patients or P value. GGO = ground-glass opacities. NA = not applicable. aStatistically significant difference.
4Discussion
COVID-19 is an infectious disease that first appeared at the end of 2019 and has rapidly spread throughout the world. Its high transmissibility poses a tremendous threat to global public health [18, 19]. Therefore, detecting the disease quickly so that prevention and early control measures can be carried out in a timely manner is important. Compared with the current nucleic acid detection method, chest high-resolution CT has the advantages of high sensitivity, high universality and high efficiency, which plays a vital role in COVID-19 pneumonia screening. In this study, we analyzed and stratified the clinical and chest CT findings of 50 patients with COVID-19.
In this study, we found that many patients included in this study had a history of direct or indirect epidemic exposure within 2 weeks before their admission, indicating the importance for diagnosing COVID-19. Most patients were adults and there was no significant difference in sex. In accordance with previous studies, fever and cough were the most common clinical symptoms with normal or decreased laboratory index [20, 21].
For chest CT, 38 patients had abnormalities and GGO (37/38, 97%) was the most common CT feature. Consistent with previous reports, the initial CT showed GGOs were more common in the right lower lobe [22, 23]. In addition, we found that GGO was usually followed by dilatation of vessels in lesion (29/38, 76%), interlobular thickening (18/38, 47%) and adjacent pleural thickening (14/38, 37%). These lesions showed subpleural distribution or mixed distribution, with none showing an only central distribution; this consistent with the report by Li M et al. [24], but contrasted with the report by Shim SS et al on novel influenza A (H1N1) infection, which mainly involved the central lung parenchyma [17]. Previous studies had shown that GGO was related to alveolar wall injury with hyaline membrane formation [25, 26]. Earlier studies on coronavirus infections had shown that coronavirus easily colonizes the alveolar and respiratory bronchioles, which were rich in angiotensin converting enzyme II (ACE II [27]). Therefore, the characteristics of GGO and lung involvement with a peripheral predominance observed in SARS and MERS were also observed in COVID-19 pneumonia. However, multifocal involvement seems to more common in COVID-19 than the typically unifocal distribution of SARS and the basilar and subpleural distribution of MERS [28, 29]. In addition, a small number of patients also showed focal consolidation and nodules, which may be related to the degree of systemic inflammatory reaction or the progression of the disease.
For Stratified analysis, we found that normal laboratory findings, interlobular thickening and honeycomb pattern were more common in elderly people while nodules were more common in younger people. At present, to our knowledge, there were many studies showed that older age was a factor related to severity of COVID-2019 [30, 31]. However, few studies researched the imaging or pathology differences between elderly and younger people. Our study showed that the CT score which reflected the degree of pulmonary involvement was higher in elderly people than younger people. So, we speculated that because the immunity of elderly patients is relatively poor, the lesions are relatively extensive, which caused more pulmonary interstitial involved, so the presence of interlobular thickening and honeycomb pattern are more common. Younger people had stronger immunity, which caused inflammation limitation and presented nodules. The specific mechanism remains to be further studied.
Interestingly, after scoring the degree of pulmonary involvement in CT, we found that the CT score significantly correlated with age, body temperature. This implies that elderly people, higher temperature patients maybe more incline to have a lager pulmonary involvement (Fig. 5). After fellow-up to 24 patients, we found that CT score was correlated with days from illness onset but not significantly correlated with hospitalization days. This maybe because the degree of pulmonary involvement in CT reflected the course of lung changes in COVID-19 pneumonia [32], but not necessarily related to clinical actual severity, which should attract the attention from clinicians.
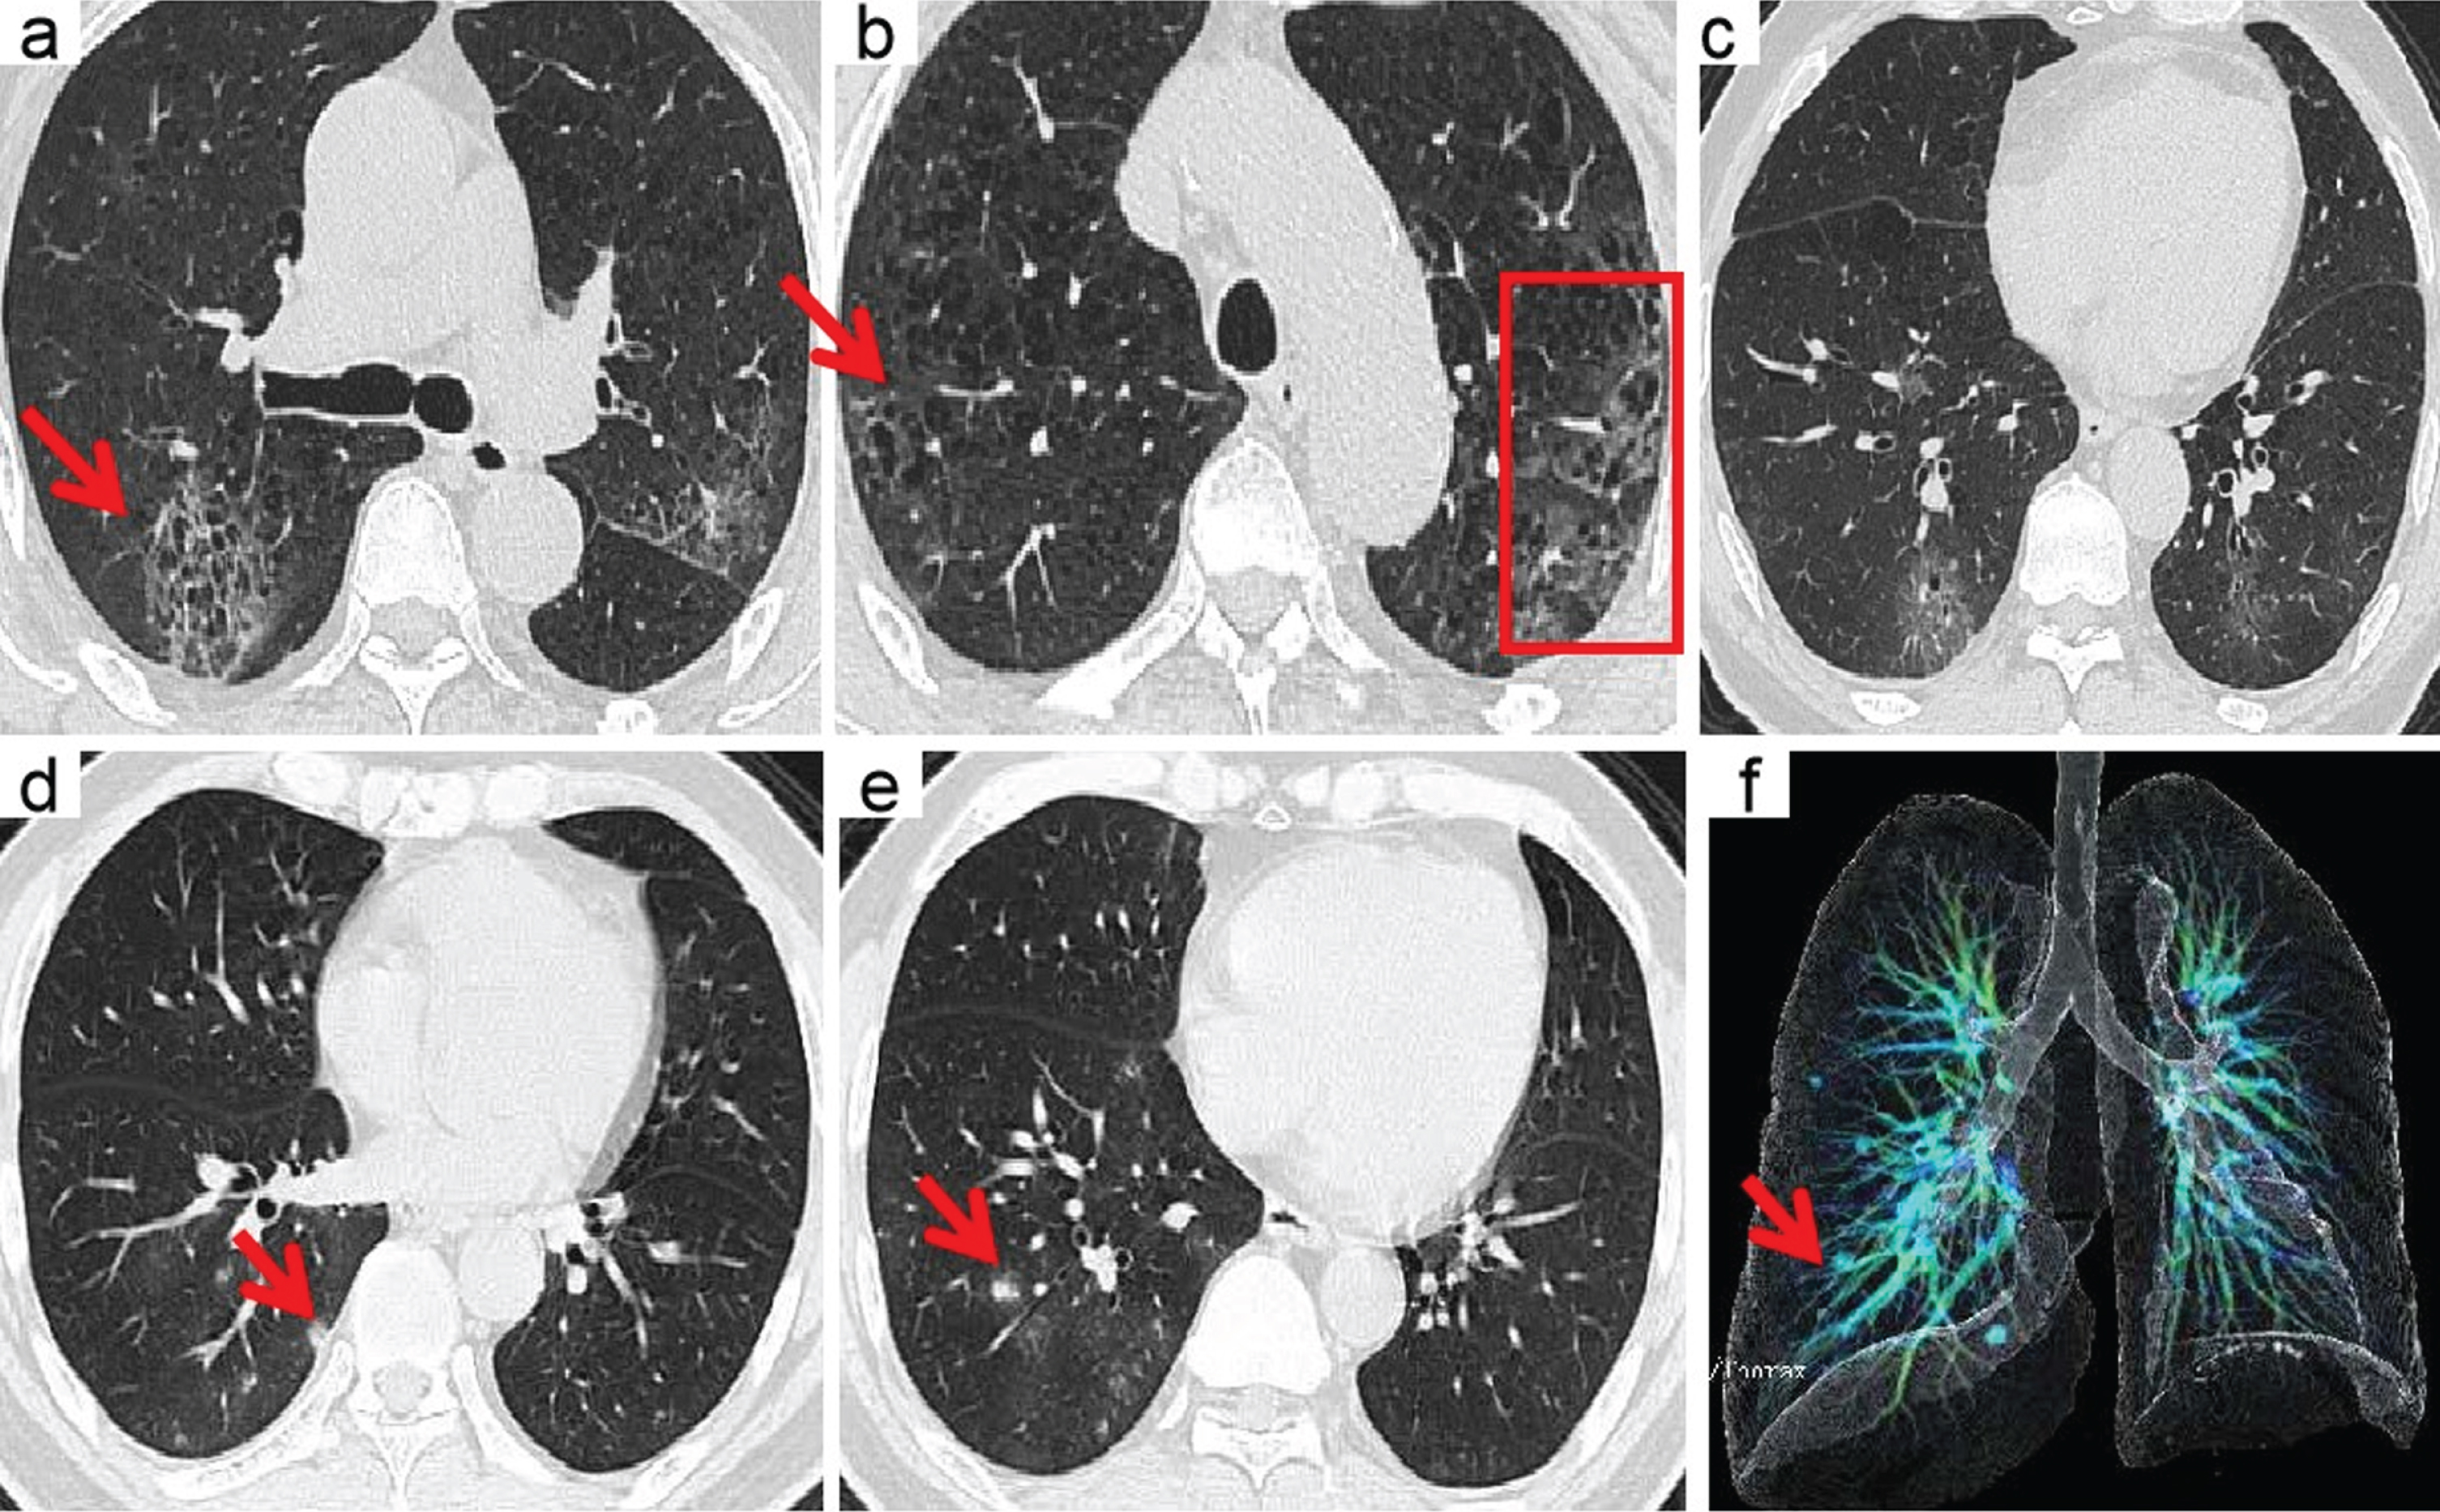
Fig.5
A 70-year-old man with confirmed COVID-19, Patient had short-term exposure history to Wuhan and onset symptoms of fever (38.5°C) and cough. CT images show bilateral mixed distributions of ground-glass opacities (GGO). The concomitant abnormalities included honeycomb pattern (red arrows) and interlobular thickening (boxes). CT involvement score is 11 (a– c). A 46-year-old man with confirmed COVID-19, Patient had short-term exposure history to Wuhan and onset symptoms of fever (37.3°C) and cough. CT images show lung right lobe multi ground-glass opacities (GGO) and nodules (red arrows). CT involvement score is 3 (d– f).
The limitations of this study include its small sample size, and there may be certain research bias. We studied the initial clinical features and CT findings of COVID-19 pneumonia, so the temporal changes after treatment have not been summarized.
In conclusion, Although COVID-19 has various clinical and imaging manifestations, it has certain characteristics and can be stratified. Comprehensive analysis and stratification of clinical and CT characteristics may help increase confidence in diagnosing COVID-19 pneumonia. Prevention and early intervention can be carried out immediately.
Conflicts of interest and source of funding
All authors declare that they have no conflict of interest.
References
[1] | Wang C. , Horby P.W. , Hayden F.G. , et al., A novel coronavirus outbreak of global health concern, Lancet 395: ((2020) ), 470–473. |
[2] | Jernigan D.B. , CDC COVID-19 Response Team, Update: Public Health Response to the Coronavirus Disease Outbreak-United States, February 24, 2020, Morb Mortal Wkly Rep (MMWR) 69: (8) ((2020) ), 216–219. |
[3] | World Health Organization Coronavirus disease 2019 (COVID-19) situation repor-51. World Health Organization, Geneva ((2020) ), Available at: https://www.who.int/docs/default-source/coronaviruse/situation-reports/20200311-sitrep-51-covid-19.pdf?sfvrsn=1ba62e57_10. |
[4] | Li Q. , Gua X. , Wu P. , et al., Early transmission dynamics in Wuhan, China, of novel coronavirus-infected pneumonia, N Engl J Med 382: (13) ((2020) ), 1199–1207. |
[5] | Huang C. , Wang Y. , Li X. , et al., Clinical features of patients infected with 2019 novel coronavirus in Wuhan, China, Lancet 395: ((2020) ), 497–506. |
[6] | Zheng Q. , Lu Y. , Lure F. , et al., Clinical and radiological features of novel coronavirus pneumonia, J Xray Sci Technol 28: (3) ((2020) ), 391–404. |
[7] | Xie X. , Zhon Z. , Zhao W. , et al., Chest CT for typical -nCoV pneumonia: relationship to negative RT-PCR testing, Radiology ((2020) ), DOI: 10.1148/radiol.2020200343. |
[8] | Long C. , Xu H. , Shen Q. , et al., Diagnosis of the coronavirus disease (COVID-19): rRT-PCR or CT? Eur J Radiol ((2020) ), DOI: 10.1016/j.ejrad.2020.108961. |
[9] | Salehi S. , Abedi A. , Balakrishnan S. , et al., Coronavirus disease 2019 (COVID-19): A systematic review of imaging findings in 919 patients, Am J Roentgenol 215: ((2020) ), 87–93. |
[10] | Zhou S. , Wang Y. , Zhu T. , et al., CT Features of coronavirus disease 2019 (COVID-19) pneumonia in 62 patients in Wuhan, China, Am J Roentgenol 214: ((2020) ), 1287–1294. |
[11] | Li Y. , Xia L. , Coronavirus disease 2019 (COVID-19): role of chest CT in diagnosis and management, Am J Roentgenol 214: ((2020) ), 1280–1286. |
[12] | Xu X. , Yu C. , Qu J. , et al., Imaging and clinical features of patients with 2019 novel coronavirus SARS-CoV-2, Eur J Nucl Med Mol Imaging 47: ((2020) ), 1275–1280. |
[13] | Koo H.J. , Lim S. , Choe J. , et al., Radiographic and CT features of viral pneumonia, Radiographic 38: ((2018) ), 719–739. |
[14] | Franquet T. , Imaging of pulmonary viral pneumonia, Radiology 260: ((2011) ), 18–39. |
[15] | Hansell D.M. , Bankier A.A. , MacMahon H. , et al., Fleischner Society: glossary of terms for thoracic imaging, Radiology 246: ((2008) ), 697–722. |
[16] | Chang Y.C. , Yu C.J. , Chang S.C. , et al., Pulmonary sequelae in convalescent patients after severe acute respiratory syndrome: evaluation with thin-section CT, Radiology 236: ((2005) ), 1067–1075. |
[17] | Shim S.S. , Kim Y. , Ryu Y.J. , Novel influenza A (H1N1) infection: chest CT findings from 21 cases in Seoul, Korea, Clinical Radiology 66: ((2011) ), 118–124. |
[18] | Liu Y. , Gayle A.A. , Wilder-Smith A. , et al., The reproductive number of COVID-19 is higher compared to SARS coronavirus,taaa, J Travel Med 27: (2) ((2020) ), 021–. |
[19] | Chan J.F. , Yuan S. , Kok K.H. , et al., A familial cluster of pneumonia associated with the 2019 novel coronavirus indicating person-to-person transmission: a study of a family cluster, Lancet 395: ((2020) ), 514–523. |
[20] | Guan W.J. , Ni Z.Y , Hu Y. , et al., Clinical Characteristics of Coronavirus Disease 2019 in China, N Engl J Med 382: ((2020) ), 1708–1720. |
[21] | Xu Y.H. , Dong J.H. , A W.M. , et al., Clinical and computed tomographic imaging features of Novel Coronavirus Pneumonia caused by SARS-CoV-2, J Infec 80: (4) ((2020) ), 394–400. |
[22] | Lei P. , Huang Z. , Liu G. , et al., Clinical and computed tomographic (CT) images characteristics in the patients with COVID-19 infection: What should radiologists need to know?, J Xray Sci Technol 28: (3) ((2020) ), 369–381. |
[23] | Lin X. , Gong Z. , Xiao Z. , et al., novel coronavirus pneumonia outbreak in: computed tomographic findings in two cases, Korean J Radiol 21: ((2020) ), 365–368. |
[24] | Li M. , Lei P. , Zeng B. , et al., Coronavirus disease (COVID-19): spectrum of CT findings and temporal progression of the disease, Acad Radiol 27: ((2020) ), 603–608. |
[25] | Nicholls J.M. , Poon L.L. , Lee K.C. , et al., Lung pathology of fatal severe acute respiratory syndrome, Lancet 361: ((2003) ), 1773–1778. |
[26] | Gao J.W. , Rizzo S. , Ma L.H. , et al., Pulmonary ground-glass opacity: computed tomography features, histopathology and molecular pathology, Transl Lung Cancer Re 6: ((2017) ), 68–75. |
[27] | Kuba K. , Imai Y. , Penninger J.M. , Angiotensin-converting enzyme 2 in lung diseases, Curr Opin Pharmacol 6: ((2006) ), 271–276. |
[28] | Won K.T. , Antonio G.E. , Hui D.S. , et al., Severe acute respiratory syndrome: radiographic appearances and pattern of progression in 138 patients, Radiology 228: ((2003) ), 401–406. |
[29] | Ajlan A.M. , Ahyad R.A. , Jamjoom L.G. , et al., Middle East respiratory syndrome coronavirus (MERSCoV) infection: chest CT findings, Am J Roentgenol 203: ((2014) ), 782–787. |
[30] | Wang W. , Tang J. , Wei F. , Updated understanding of the outbreak of 2019 novel coronavirus -nCoV) in Wuhan, Chinak, J Med Viro 92: ((2020) ), 441–447. |
[31] | Li K. , Wu J. , Wu F. , et al., The clinical and chest CT features associated with severe and critical COVID-19 pneumonia, Invest Radiol 55: (6) ((2020) ), 327–331. |
[32] | Pan F. , Ye T. , Sun P. , et al., Time course of lung changes on chest CT during recovery from 2019 novel coronavirus (COVID-19) pneumonia, Radiology ((2020) ), DOI: 10.1148/radiol.2020200370. |


