
Differentiating pneumonia with and without COVID-19 using chest CT images: from qualitative to quantitative
Abstract
BACKGROUND:
Pneumonia caused by COVID-19 shares overlapping imaging manifestations with other types of pneumonia. How to objectively and quantitatively differentiate pneumonia patients with and without COVID-19 virus remains clinical challenge.
OBJECTIVE:
To formulate standardized scoring criteria and an objective quantization standard to guide decision making in detection and diagnosis of COVID-19 virus induced pneumonia in clinical practice.
METHODS:
A retrospective dataset includes computed tomography (CT) images acquired from 43 pneumonia patients with COVID-19 virus detected by reverse transcription-polymerase chain reaction (RT-PCR) tests and 49 pneumonia patients without COVID-19 virus. All patients were treated during the same time period in two hospitals. Key indicators of differential diagnosis were identified in relevant literature and the scores were quantified namely, patients with more than 8 points were identified as high risk, those with 6–8 points as moderate risk, and those with fewer than 6 points as low risk for COVID-19 virus. In the study, 3 radiologists determined the scores for all patients. Diagnostic sensitivity and specificity were subsequently calculated.
RESULTS:
A total of 61 patients were determined as high risk, among which 42 were COVID-19 positive by RT-PCR tests. Next, 9 were identified as moderate risk, one of whom was COVID-19 positive. Last, 22 were classified into the low-risk group, all of them are COVID-19 negative. Based on these results, the sensitivity of detection COVID-19 positive cases between the high-risk group and the non-high-risk group was 0.98 with 95% confidence interval [0.88, 1.00], and the specificity was 0.61 [0.46, 0.75]. The detection sensitivity between the moderate-/high-risk group and the low-risk group was 1.00 [0.92, 1.00], and the specificity was 0.45 [0.31, 0.60].
CONCLUSION:
The proposed quantitative scoring criteria showed high sensitivity and moderate specificity in detecting COVID-19 using CT images, which indicates that these criteria may be beneficial for screening in real-world practice and helpful for long-term disease control.
1Introduction
The global outbreak of COVID-19 pneumonia has resulted in 512,701 confirmed cases and 23,495 deaths globally as of March 28, 2020. At present, reverse transcription-polymerase chain reaction (RT-PCR) is the gold standard method for diagnosis of COVID-19; however, computed tomography (CT) examination also has value in clinical diagnosis [1]. Importantly, COVID-19 shows overlapping manifestations with other community-acquired pneumonia with infection of COVID-19 virus, thereby leading to difficulties in differential diagnosis of COVID-19 using CT images [2, 3]. According to a study from Bai et al., compared with non-COVID-19 pneumonia, COVID-19 was more likely to result in peripheral distribution, ground-glass-like shadows, fine-mesh opacity, vascular thickening, and anti-halo signs, which is clearly valuable for differential diagnosis [4]. However, these results cannot be generalized due to the fact that the study was conducted based on subjective empirical judgement. Therefore, we reviewed existing literature and summarized our own experience with a view to developing scoring criteria for the objective and semi-quantitative differential diagnosis of COVID-19 pneumonia.
2Materials and methods
2.1Patients and data sources
This study was approved by the Institutional Review Committee, and informed consent was exempted due to the retrospective nature of the study. The cases reported in this study came from two hospitals in China. The case inclusion criteria are following: (a) Patients who had fever with body temperature >38C° and were clinically suspected of having COVID-19; (b) Patients who underwent chest thin-section CT with identified lesions; (c) Patients who underwent RT-PCR.
From January 20, 2019 to February 25, 2020, a total of 198 suspected patients underwent chest CT examinations (performed using a GE optima CT660 scanner or Phillips Brilliance CT scanner, with scanning interval of 5 mm and thinned to 1.25 mm by post-treatment), among whom 106 patients without abnormalities were excluded, and 92 cases with abnormal CT findings were included in this study. The gold standard for final diagnosis was: one or more positive rRT- PCR nucleic acid tests. On this basis, a total of 43 cases were diagnosed with COVID-19 pneumonia, and 49 cases were diagnosed with community-acquired pneumonia (without COVID-19).
According to the imaging findings for COVID-19 summarized in the literature [4–9], specific scoring criteria were proposed as follows. First, the following items will increase the scoring points.
1) Main distribution of lesions: those occurring in 1/3 of the subpleural area or other parts: 2 or 1 points, respectively;
2) Morphology of lesions: ground glass opacities (with or without consolidation or nodular shadows), nodular shadows, consolidation shadows or other forms: 2, 1 or 0 points, respectively;
3) Lesions with the long axis parallel or non-parallel to the pleura: 2 or 0 points, respectively;
4) Fine-mesh changes: yes or no, 2 or 0 points, respectively;
5) Bronchiectasis with rigid course: yes or no, 2 or 0 points, respectively;
6) Dilation of small vessels: yes or no, 2 or 0 points, respectively.
Second, the following items will decrease the scoring points:
1) formation of necrotic cavity: –1 point;
2) Formation of cyst: – 1 point;
3) Calcification: – 1 point;
4) Formation of mass: – 1 point;
5) Enlargement of mediastinal lymph node: – 1 point;
6) Pleural effusion: – 1 point.
Based on the above scoring criteria, patients with more than 8 points were considered high risk, those with 6–8 points were determined as medium risk, and those with fewer than 6 points were considered low risk of COVID-19 infection. Figures 1–5 show examples of CT images in these 3 risk groups.
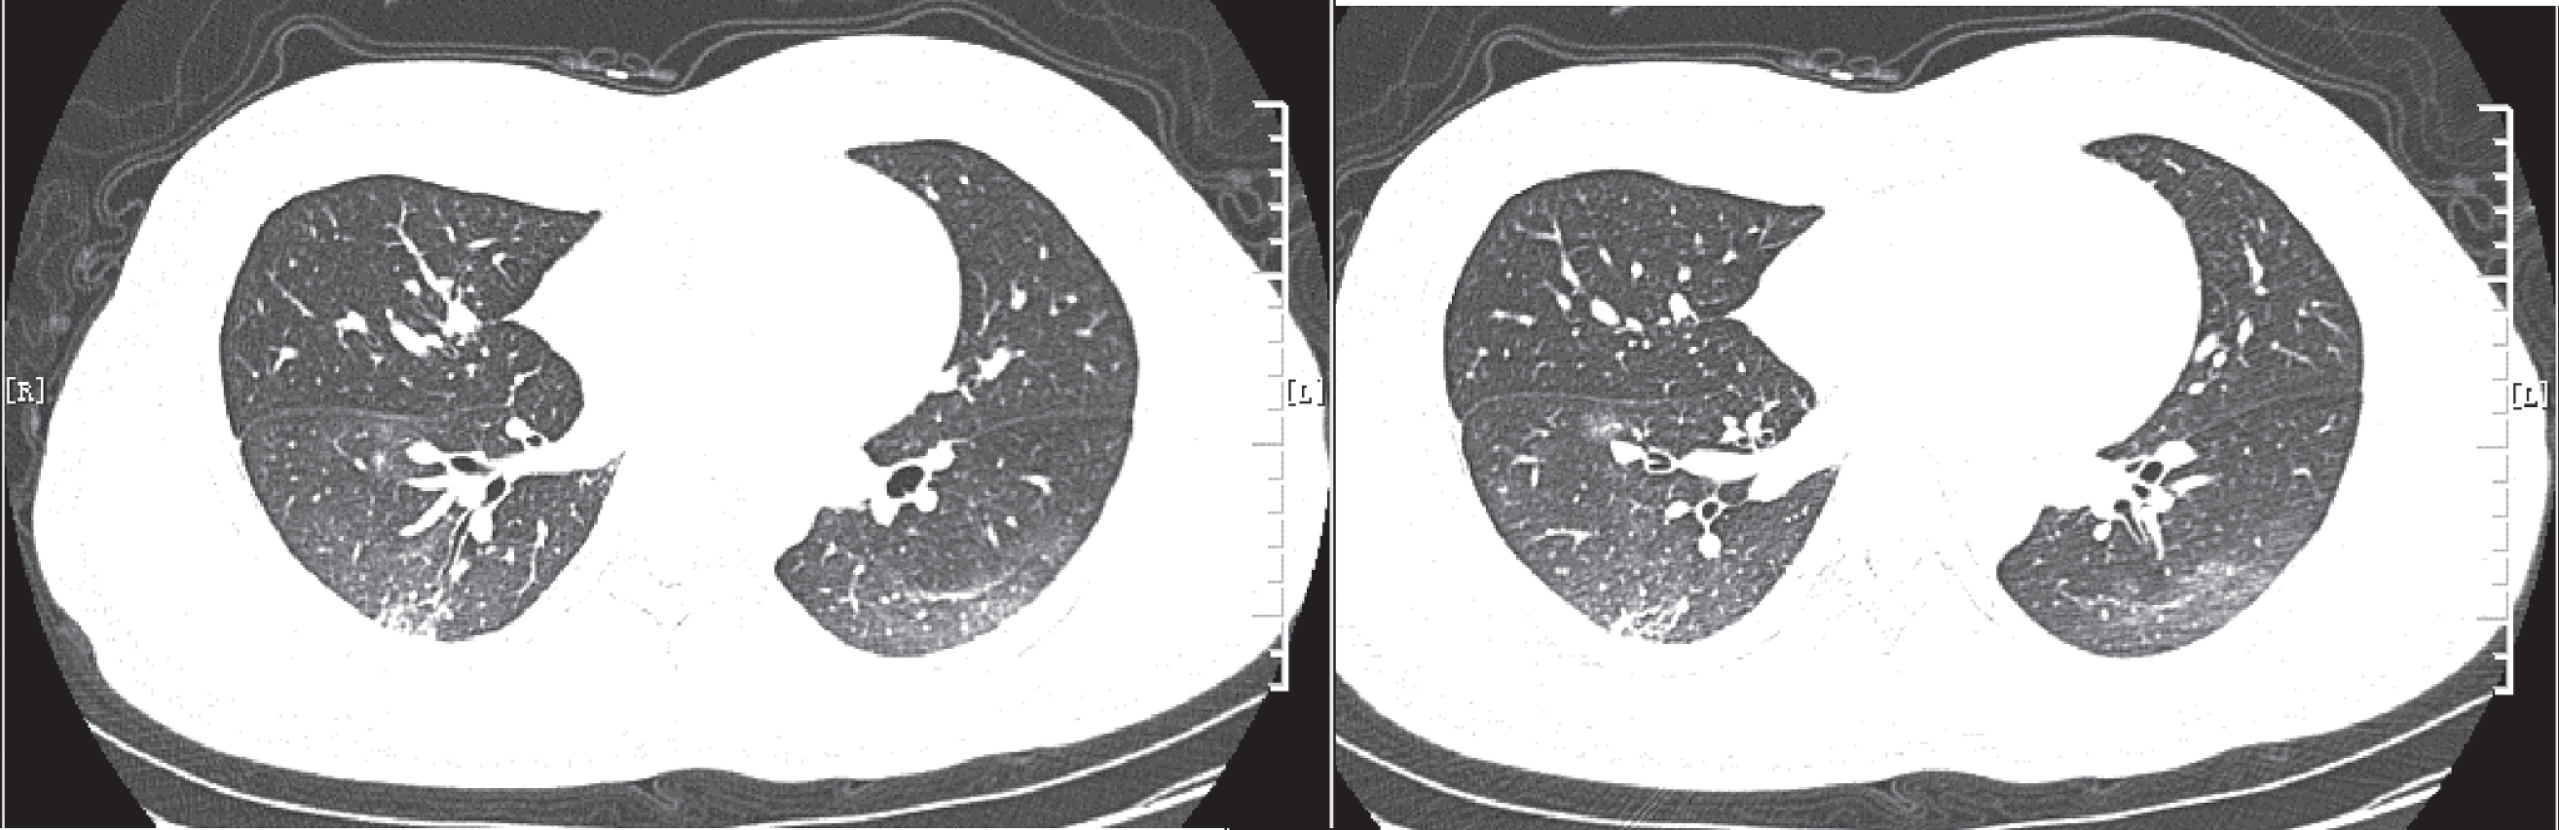
Fig. 1
The patient showed scattered distribution, small patchy ground glass opacities, bronchiectasis and vessel dilations. The patient was scored 8 points and had confirmed COVID-19 based on positive PCR results. PCR – polymerase chain reaction.
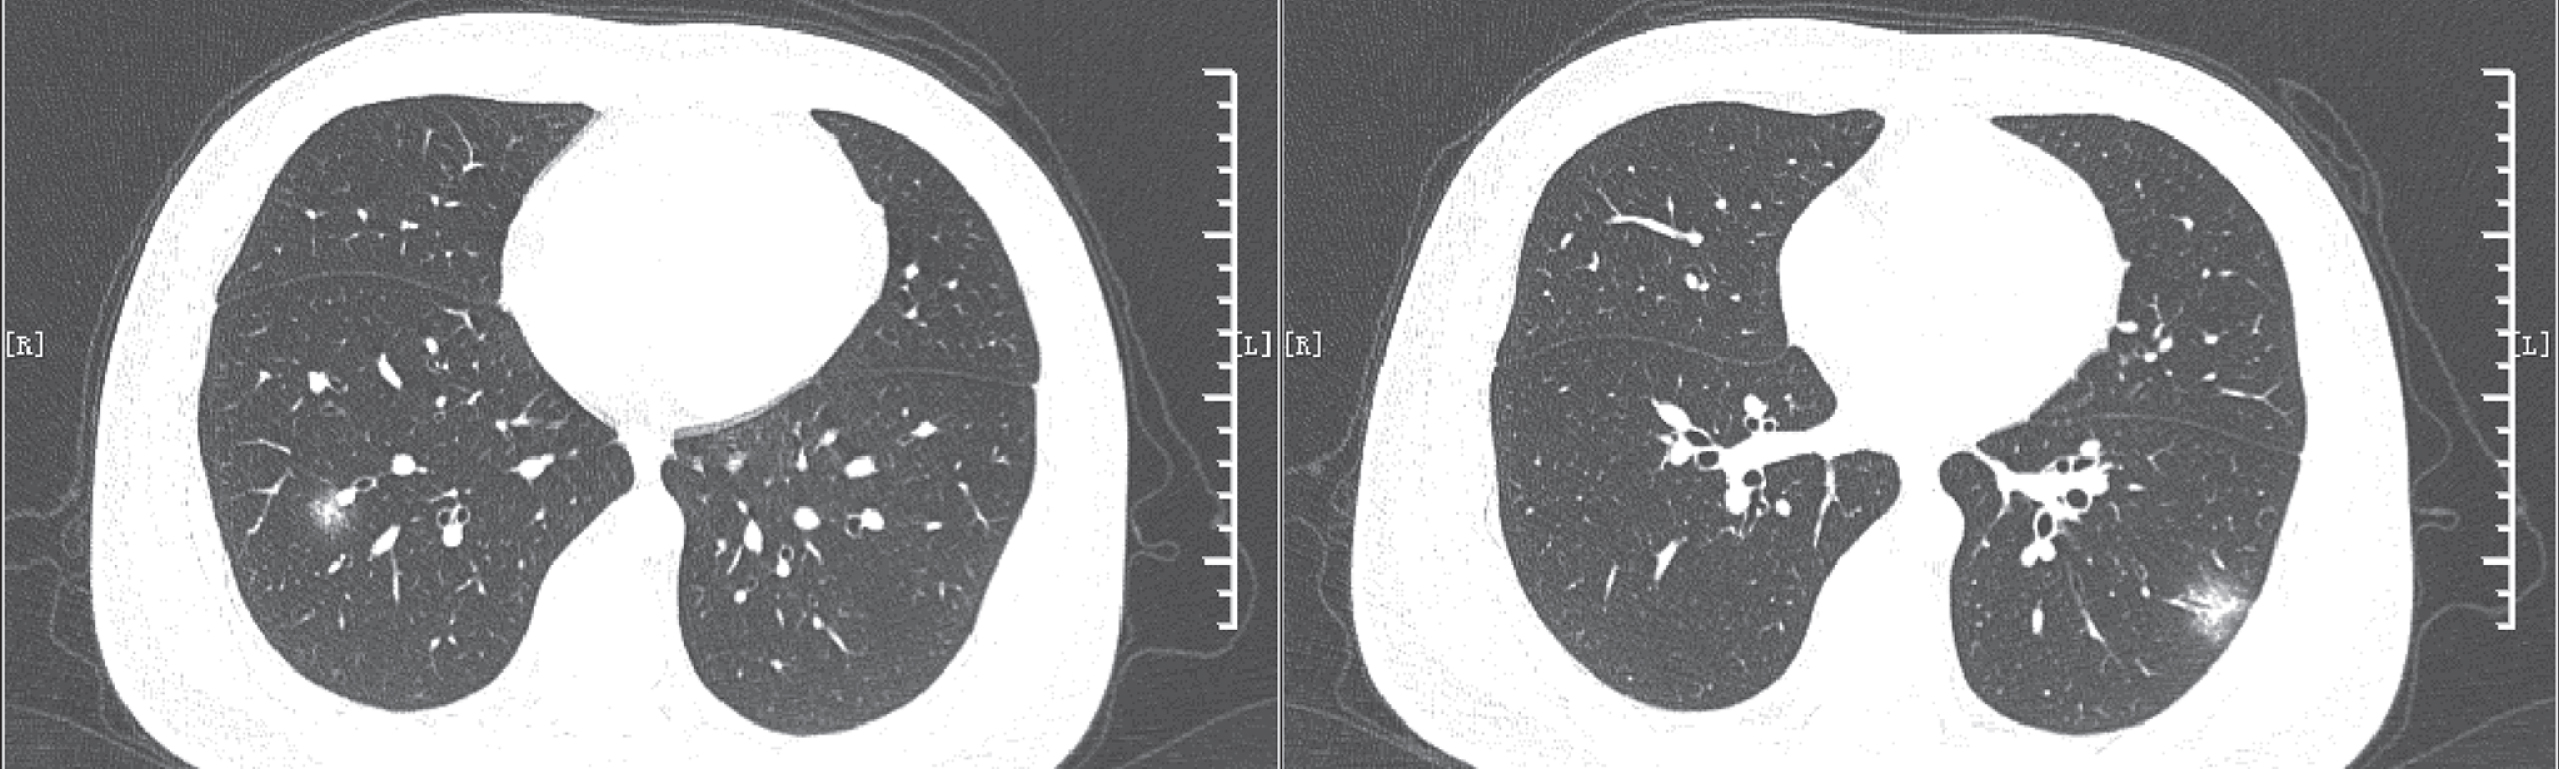
Fig. 2
The patient showed subpleural distribution, multiple large patchy ground glass opacities, lesions with the long axis parallel to the pleura, fine-mesh changes, bronchiectasis with rigid course and vessel dilations, and was scored 12 points. The patient was diagnosed with COVID-19, which was confirmed by positive PCR results. PCR – polymerase chain reaction.
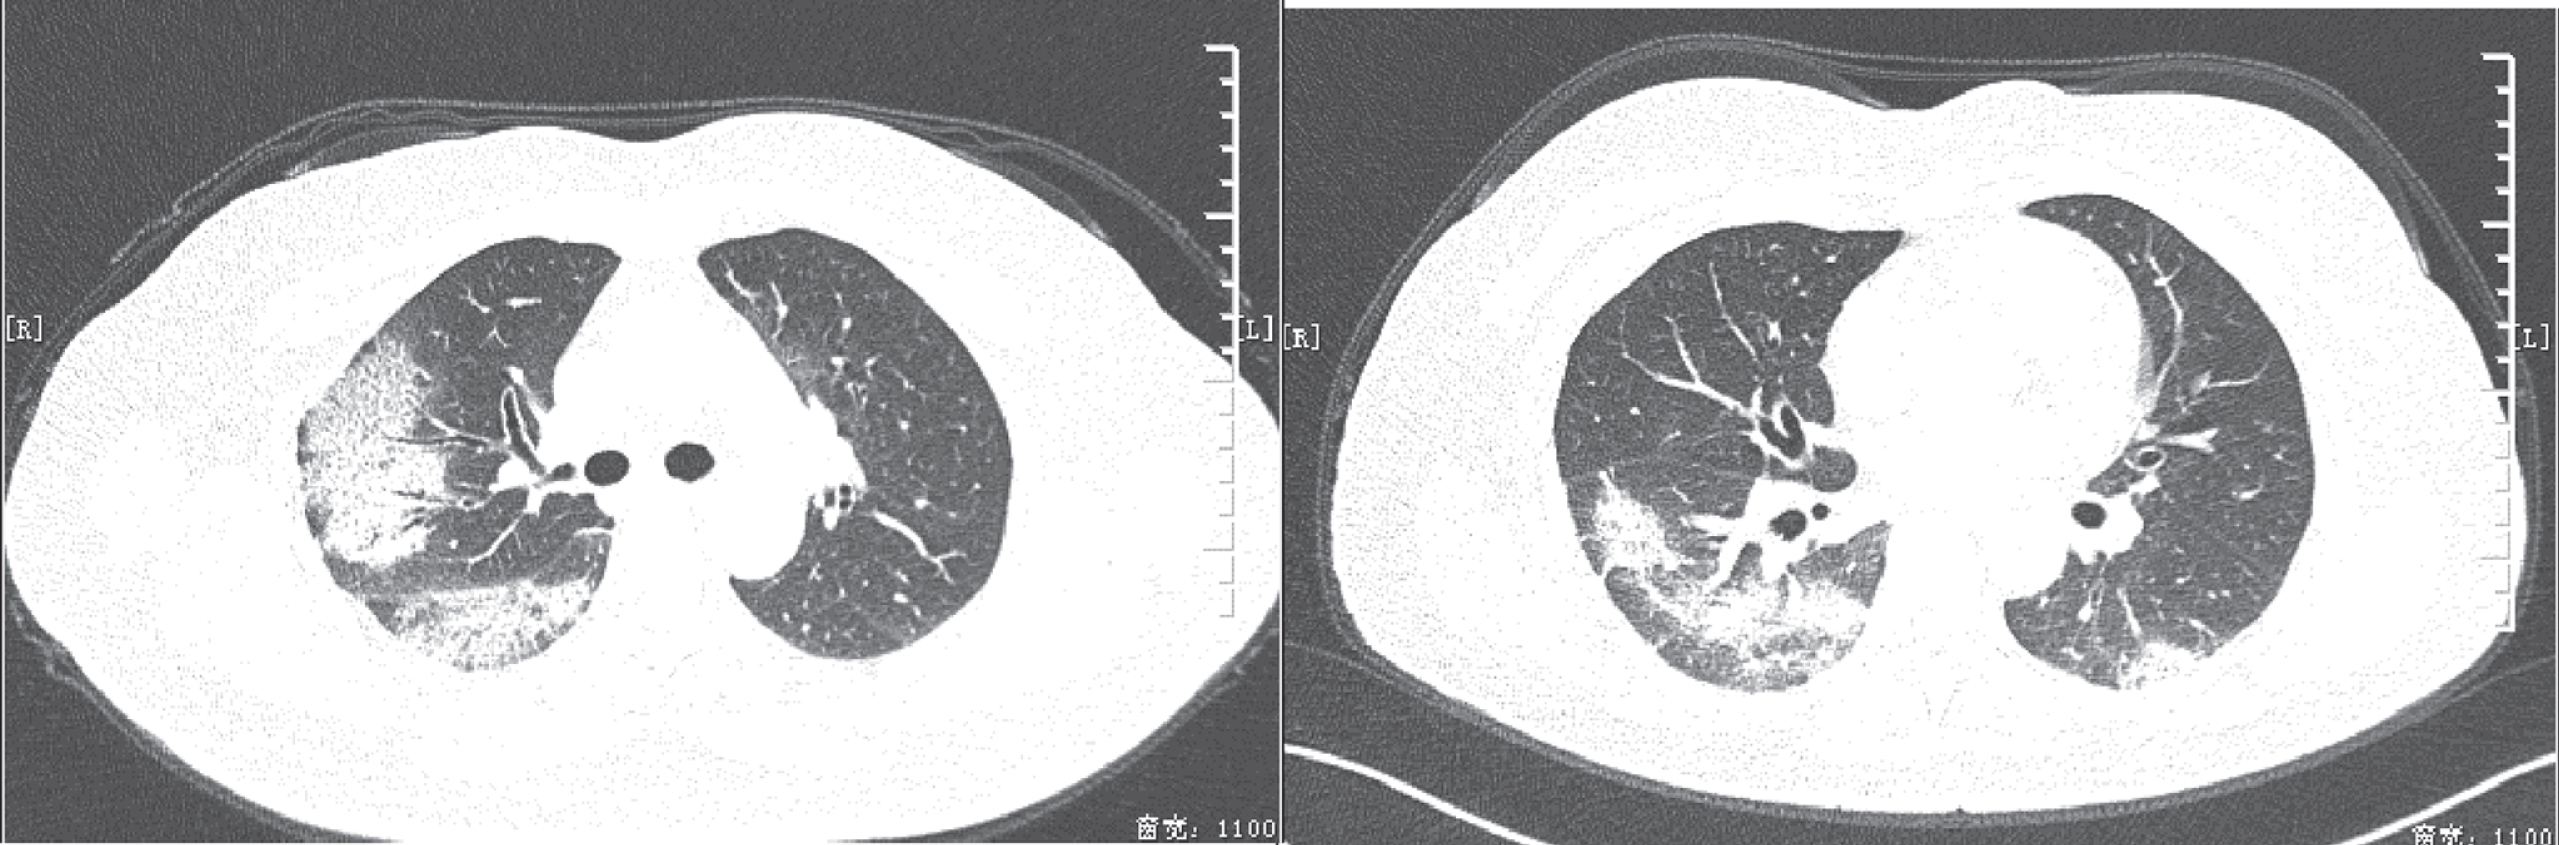
Fig. 3
The patient showed subpleural distribution, large patchy ground glass opacities, lesions with the long axis parallel to the pleura, fine-mesh changes, bronchiectasis with rigid course and thickening of passing-through vessels. The patient was scored 12 points, but with negative PCR results. PCR – polymerase chain reaction.
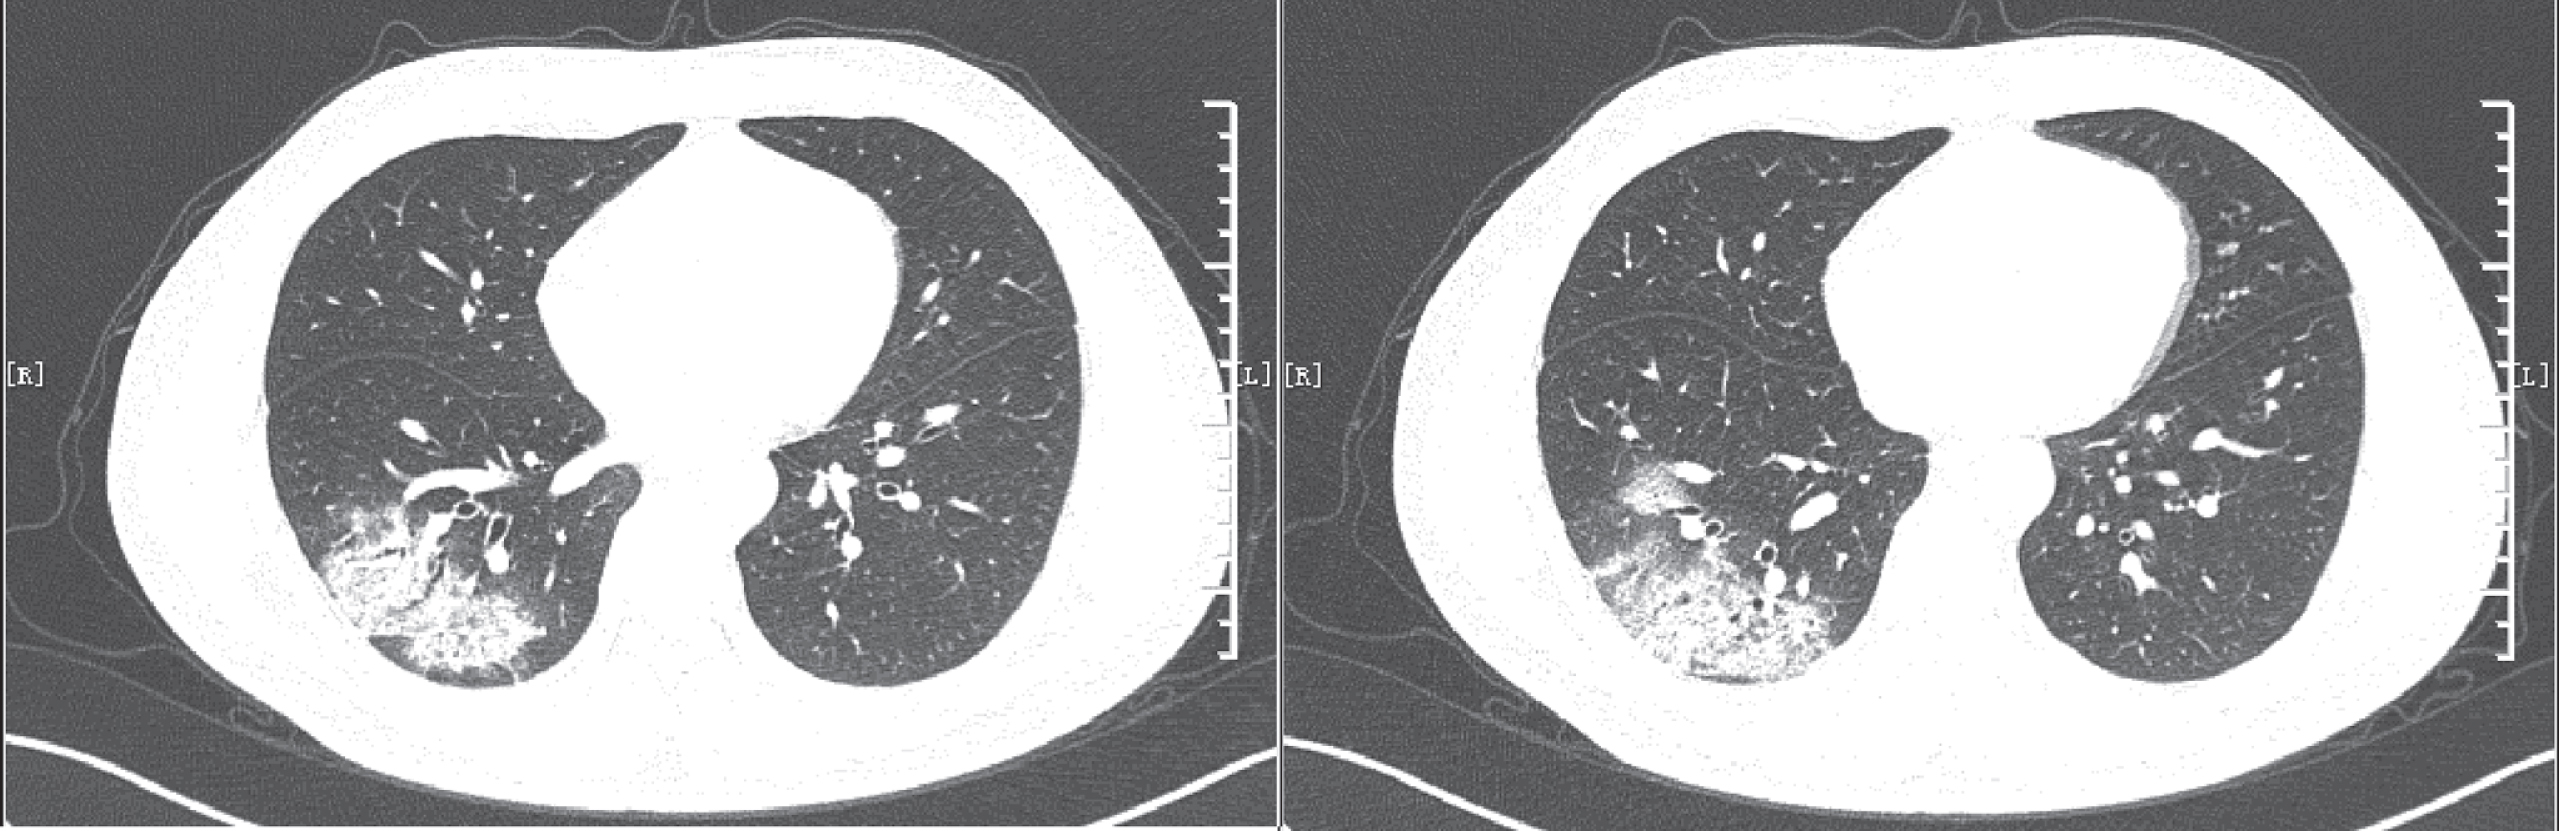
Fig. 4
The patient showed scattered distribution, small patchy ground glass opacities, consolidation shadows, miliary shadows, fine-mesh changes, bronchiectasis with rigid course and lymphadenopathy. The patient was scored 5 points, with negative PCR results. PCR – polymerase chain reaction.
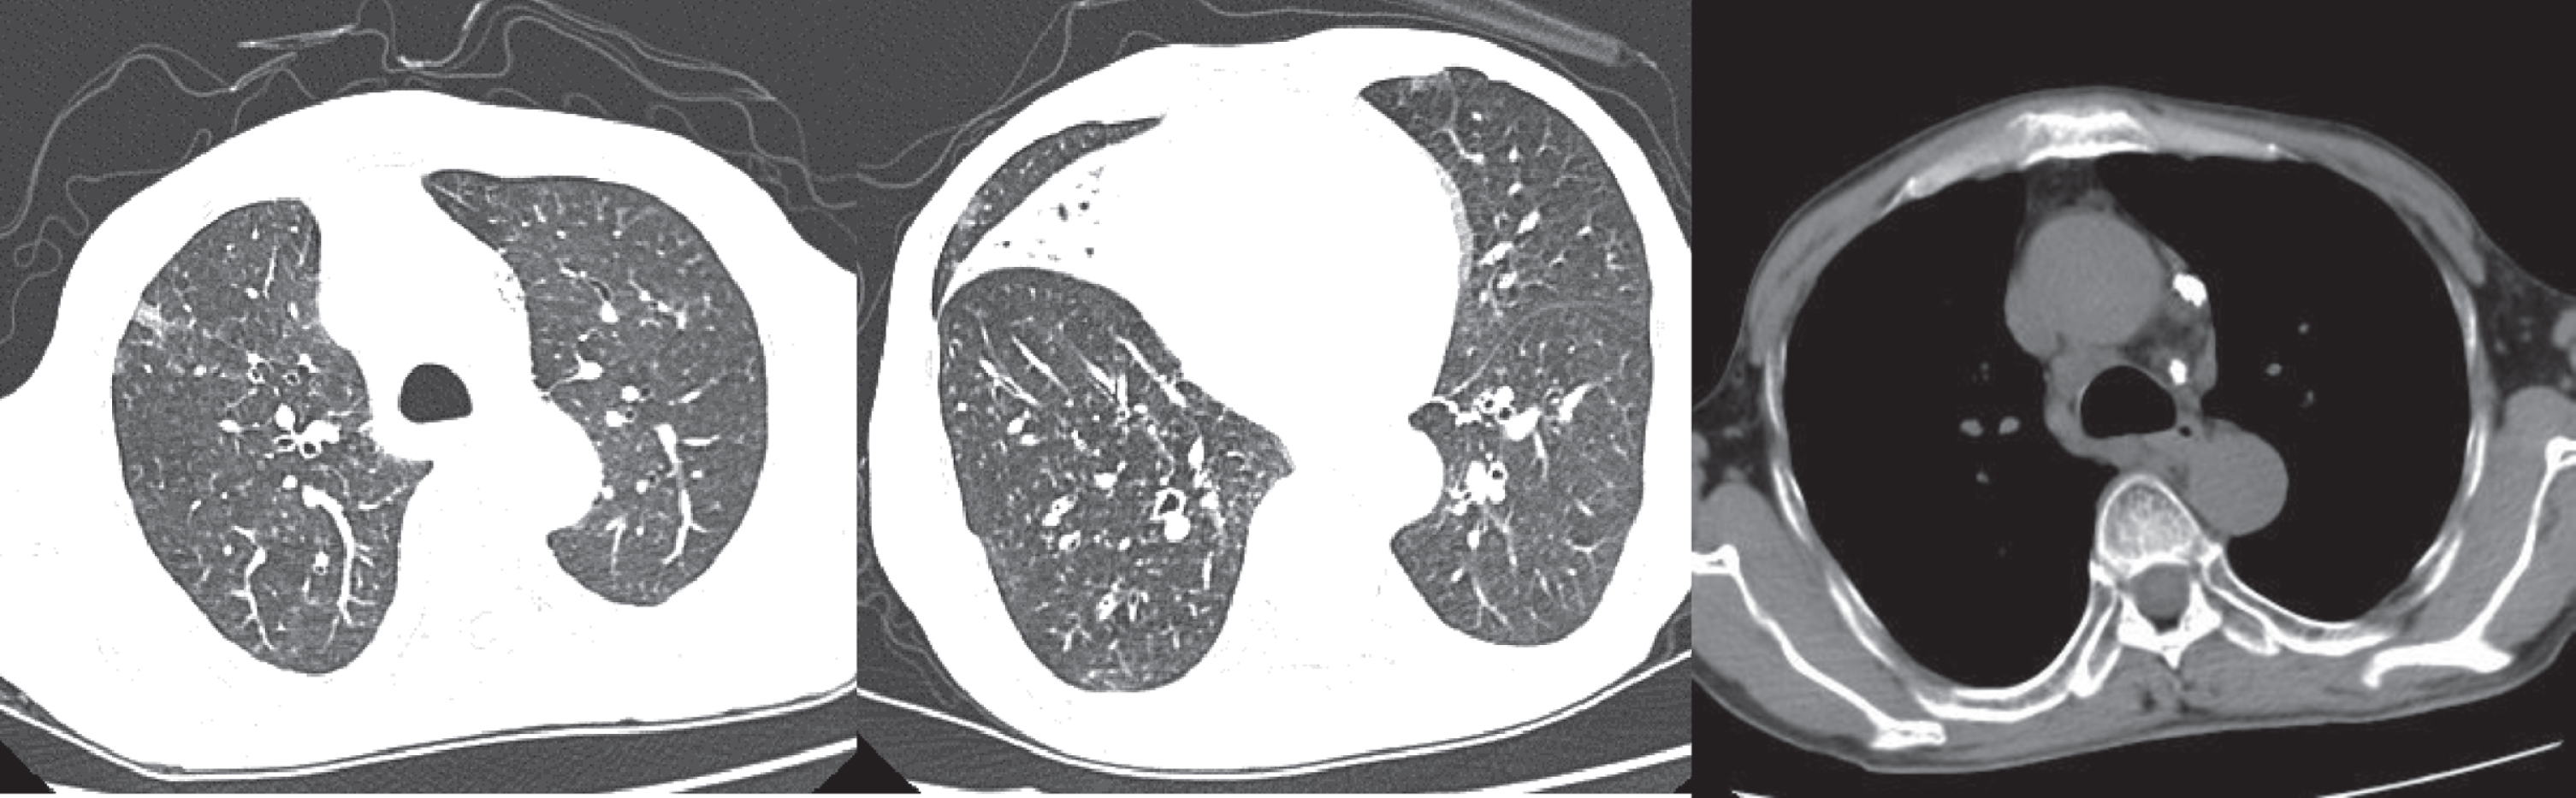
Fig. 5
The patient showed scattered distribution, patchy ground glass opacities, cord shadows, consolidation shadows, lesions that were parallel to the long axis, and bronchiectasis with rigid course. They were scored 7 points, with negative PCR results. PCR – polymerase chain reaction.
All chest CT image scans were scored blindly by two radiologists with 3 and 10 years of experience in chest imaging, respectively. The consensus was reached through consultation. In case of discrepancy, a third senior radiologist with 15 years of experience in chest imaging was asked to confirm the scoring results.
2.2Statistical analysis
Statistical analysis was performed using SPSS version 17.0. The continuous variables were expressed as mean±standard deviation, and categorical variables were expressed as counts and percentages. The sensitivity and specificity were calculated based on RT-PCR results as the gold standard. Receiver operating characteristic (ROC) curve was plotted and the area under the curve (AUC) was calculated.
3Results
3.1Analysis of sensitivity and specificity
A total of 43 patients with COVID-19 confirmed by RT-PCR were included (26 males and 17 females), with an average age of 44.6±12.6 years. In total, 49 patients were diagnosed with community-acquired pneumonia, including 25 males and 24 females, with an average age of 42.1±25.2 years. According to the proposed scoring criteria for chest CT findings, 61 patients were assigned to the high-risk group, 9 cases to the moderate-risk group, and 22 cases to the low-risk group. After combining the results from RT-PCR and those from the scoring criteria, 42 patients in the high-risk group were diagnosed with COVID-19. In the moderate-risk group, 1 patient was diagnosed. All 22 patients in the low-risk group were negative for COVID-19.
The ROC curves were shown in Figure 6. The corresponding AUC values for two radiologists are 0.96 [95% confidence interval (CI): 0.92, 0.99] and 0.94 [95% CI: 0.90, 0.98], respectively. The sensitivity to detect COVID-19 positive cases between the high-risk group and the non-high-risk group was 0.98 [0.88, 1.00], and the specificity was 0.61 [0.46, 0.75]. The detection sensitivity between the moderate-/high-risk group and the low-risk group was 1.00 [0.92, 1.00], and the specificity was 0.45 [0.31, 0.60] (as shown in Table 1).
Fig. 6
Receiver operating characteristic (ROC) curve was plotted and the area under the curve (AUC) was calculated. The corresponding AUC values for two radiologists (A and B) are 0.96 [95% confidence interval (CI): 0.92, 0.99] and 0.94 [95% CI: 0.90, 0.98], respectively.
![Receiver operating characteristic (ROC) curve was plotted and the area under the curve (AUC) was calculated. The corresponding AUC values for two radiologists (A and B) are 0.96 [95% confidence interval (CI): 0.92, 0.99] and 0.94 [95% CI: 0.90, 0.98], respectively.](https://content.iospress.com:443/media/xst/2020/28-4/xst-28-4-xst200689/xst-28-xst200689-g006.jpg)
Table 1
Analysis of sensitivity and specificity in patients with COVID-19
| Group | Result | Efficiency | ||||
| TP | FP | FN | TN | Sensitivity [95% CI] | Specificity [95% CI] | |
| High-risk vs. moderate and low-risk cases | 42 | 19 | 1 | 30 | 0.98 [0.88, 1.00] | 0.61 [0.46, 0.75] |
| Moderate- and high-risk vs. low-risk cases | 43 | 27 | 0 | 22 | 1.00 [0.92, 1.00] | 0.45 [0.31, 0.60] |
Combined with PCR results, sensitivity and specificity analysis were carried out for the moderate- and high-risk group/non-high-risk group, as well as for the moderate- and high-risk group/low-risk group. CI, confidence interval; FP, false negative; FP, false positive; PCR, polymerase chain reaction; TN, true negative; TP: true positive. All data is true and valid.
3.2CT imaging findings
According to the CT findings among 43 patients with COVID-19, the lesions of 33 patients showed only subpleural distribution, while the lesions of the other 10 cases showed scattered distribution. As for lesion morphology, there were 30 cases with only ground glass opacities, 5 cases with both patchy ground glass opacities and nodule shadows, 7 cases with both ground glass opacities and consolidation shadows, 1 case with only nodule shadows, 0 cases with patchy ground glass opacities and consolidation-/nodule- shadows, and 0 cases with only consolidation shadows. In terms of interlobular septum involvement, 42 cases had the long axis of lesions parallel to pleura, 39 had fine-mesh changes, and 29 had bronchiectasis with rigid course. With regards to inflammatory reactions, 40 cases had small vessel dilation (as shown in Table 2).
Table 2
Analysis of imaging signs in all confirmed patients
| Imaging findings | COVID-19 | Non-COVID- 19 |
| (n = 43) | (n = 49) | |
| Distribution of lesions | ||
| Subpleural distribution | 33 (77%) | 23 (47%) |
| Other distributions | 10 (23%) | 26 (53%) |
| Morphology of lesions | ||
| Only patchy ground glass opacities | 30 (69%) | 12 (24%) |
| Patchy ground glass opacities and nodular shadows | 5 (12%) | 7 (14%) |
| Patchy ground glass opacities and consolidation shadows | 7 (17%) | 8 (16%) |
| Patchy ground glass opacities and consolidation- and nodular- shadows | 0 (0%) | 2 (4%) |
| Only nodular shadows | 1 (2%) | 6 (12%) |
| Only consolidation shadows | 0 (0) | 14 (29%) |
| Involvement of lobular interstitium | ||
| The long axis of the lesion is parallel to the pleura | 42 (98%) | 11 (22%) |
| Fine-mesh changes | 39 (91%) | 5 (10%) |
| Bronchiectasis with rigid course | 29 (67%) | 18 (37%) |
| Inflammatory responses | ||
| Dilatation of small vessels | 40 (93%) | 25 (51%) |
They are described as Number of cases (percentage). Classification of lesions based on distribution did not overlap with that based on morphology. As for the involvement of lobular interstitium, several cases had multiple signs at the same time, and the decimal point was omitted for the percentage.
4Discussion
The formulation of this scoring standard was mainly based on several reported studies [4–9], which showed that patchy ground glass opacity was the most common imaging finding in patients with COVID-19. In these patients, viral infection first manifests as non-alveolar-filled inflammatory exudation, which expands to multiple alveoli and results in diffuse alveolar damage (DAD). The imaging signs in relation to interlobular involvement were fine-mesh thickening of the pulmonary interstitium, which spread along the interstitium surrounding the lung lobules, forming a sign with the lesion’s long axis parallel to the pleura. The virus is able to propagate along the interstitium in the center of the lobule leading to the formation of ground glass nodules, and as the disease develops, fibrosis is observed in the pulmonary interstitium. Furthermore, images of the bronchioles showed stretched and dilated features with rigid course. Although the virus invades the pulmonary interstitium, pulmonary small blood vessels (especially the pulmonary arterioles) are also infected and inflammatory cells in the blood vessels exudate, which results in thickened small vessels upon CT examination. Here, we formulated scoring criteria based on above characteristics, which conformed to the pathological manifestations previously reported by Xu et al. [10].
Our results showed that the sensitivity between the high-risk group and non-high-risk group was 0.98 [0.88, 1.00], with a specificity of 0.61 [0.46, 0.75]. The sensitivity between the moderate-/high-risk group and low-risk group was 1.00 [0.92, 1.00], with a specificity of 0.45 [0.31, 0.60], indicating that the scoring sensitivity was high and specificity was moderate. The results reported by Bai et al. [4] showed that the accuracy of scoring by three radiologists in the differential diagnosis of COVID-19 pneumonia was 83%, 80% and 60%, respectively, with high sensitivity and moderate specificity. However, the method adopted in their study was based on subjective empirical judgment, which cannot be quantified and generalized to a large group of patients. The scoring standard proposed in this study is characterized by objectivity and semi-quantification. Since the main task at this stage is to identify suspected patients with COVID-19 in order to facilitate more effective isolation and prevent the spread of the disease, certain false-positive results are acceptable. Although some patients with high-risk scores were eventually excluded based on RT-PCR test results, this does not negate the overall value of the scoring system.
The limitations of this study are as follows: the sample size was small, and no specific causative pathogens were identified in patients with community-acquired pneumonia. Furthermore, no distinctions were made regarding the different kinds of pneumonia, e.g., bacterial or viral subtypes. Hence, our results should be confirmed by multicenter and large-sample studies in the future.
In conclusion, this study proposed and tested a set of objective scoring criteria for the differential diagnosis of pneumonia with and without COVID-19 infection. The results demonstrated high sensitivity and moderate specificity based on or preliminary experience in a small dataset acquired from two hospitals.
Conflicts of interest and source of funding
All authors declare that they have no conflict of interest.
References
[1] | National Health Commission. Diagnosis and treatment of novel coronavirus pneumonia (Trial revision of the fifth edition) [EB/OL]. (2020-02-04) [2020-02-17]. http://www.gov.cn/zhengce/zhengceku/2020-02/05/content_5474791.html |
[2] | Huang P. , et al., Use of chest CT in combination with negative RT-PCR assay for the 2019 novel corona virus but high clinical suspicion, Radiology (2020), DOI: 10.1148/radiol.2020200330 |
[3] | Lei P. , Clinical and computed tomographic (CT) images characteristics in the patients with COVID-19 infection: what should radiologists need to know? Journal of X-ray Science and Technology (2020), DOI: 10.3233/XST-200670. |
[4] | Bai H.X. , et al., Performance of radiologists in differentiating COVID-19 fromviral pneumonia on chest CT, Radiology (2020), DOI: 10.1148/radiol.2020200823. |
[5] | Ai T. , et al., Correlation of chest CT and RT-PCR testing in corona virus disease 2019 (COVID-19) in China: a report of 1014 cases, Radiology (2020), DOI: 10.1148/radiol.2020200642. |
[6] | Chung M. , et al., CT imaging features of 2019 novel corona virus (2019-nCoV), Radiology (2020), DOI: 10.1148/radiol.2020200230. |
[7] | WeiJ., et al., Analysis of thin-section CT in patients with coronavirus disease (COVID-19) after hospital discharge. Journal of X-ray Science and Technology (2020), DOI: 10.3233/XST-200685 |
[8] | Lin X. , et al., Novel Corona virus pneumonia outbreak in: computed tomographic findings in two Cases, Korean J Radiol 21: (3) ((2020) ), 365–368. |
[9] | Lei J. , et al., CT imaging of the 2019 novel corona virus (2019-nCoV) pneumonia, Radiology (2020), DOI: 10.1148/radiol.2020200236. |
[10] | Xu X. , et al., Evolution of the novel corona virus from the ongoing Wuhan outbreak and modeling of its spike protein for risk of human transmission, Science China Life Sciences 63: (3) ((2020) ), 457–460. |


