
Discrimination of DNA and RNA distribution in a mammalian cell by scanning transmission soft X-ray microscopy
Abstract
Soft X-ray spectromicroscopy was applied to study the distribution of DNA and RNA in a mammalian cell at the spatial resolution of 400 nm. The relative distribution of DNA and RNA was examined by the SVD (singular value decomposition) method in aXis2000 program using combined full spectra of DNA and RNA at the absorption edge regions of carbon, nitrogen and oxygen. The absorption of nucleic acid was evaluated using 1s-π* transitions in the NEXAFS spectra at the nitrogen K absorption edge and distributed to DNA and RNA according to the relative level obtained above. The present results revealed the usefulness of the SVD method to discriminate closely related molecules such as DNA and RNA.
1Introduction
Characteristic nature of NEXAFS (near edge X-ray absorption fine structure) is expected to be useful for the discrimination of component molecules in biological specimens. Application of NEXAFS spectra at carbon K absorption edge to biological samples has been reported in studies for DNA distribution in a bean chromosome [1], mapping and measuring DNA and protein ratios in sperm cells [2] and quantitative analysis of molecules in microbial biofilms [3], quinoa [4] and bacterial endospores [5]. In our previous studies, we have proposed the usefulness of NEXAFS at the nitrogen K absorption edge for clear separation of DNA (nucleic acid) and protein [6], and applied it to analyze the image of a mammalian cell and a chromosome observed with scanning transmission soft X-ray microscope (STXM) [7, 8]. In the present study, we applied the SVD (singular value decomposition) method in aXis2000 program [9] with combined full NEXAFS spectra at carbon, nitrogen and oxygen K absorption edge regions for the discrimination of deoxyribonucleic acid (DNA) and ribonucleic acid (RNA), which is not possible from the NEXAFS at the absorption edge of nitrogen alone. We have found that the method was successfully applicable to differentiate the distribution of RNA from DNA.
2Materials and methods
Cultured CHO cells derived from Chinese hamster ovary were plated on a silicon nitride membrane (thickness, 100 nm; purchased from Silson Ltd, England) and grown in HAM F12 medium (purchased from Sigma-Aldrich Co.) supplemented with 10% fetal bovine serum and antibiotics at 37°C in a humidified 5% CO2 atmosphere. Cells on the silicon nitride were fixed with 2.5% glutaraldehyde, washed with increasing concentration of ethanol and dried. Calf thymus DNA, calf liver RNA and bovine serum albumin (BSA) were purchased from Sigma-Aldrich Co., dissolved in water at the concentration of 2 mg/ml, dropped on a silicon nitride membrane and dried.
The cells and molecules were observed at carbon, nitrogen and oxygen K absorption edge regions with STXM installed at BL4U, UVSOR-III, Okazaki, Japan. Data for cells were collected by horizontal on-the fly measurement at the focus size of less than 75 nm in diameter with vertical and horizontal steps of 400 nm and 400 nm.
The results were analyzed using aXis2000 program [9]. The present analysis was based on the assumption that DNA, RNA and BSA spectra are the representatives for spectra of DNA, RNA and protein, respectively. Calculation has been made following to the method reported elsewhere [8] except SVD process. Briefly: Each stack-file of cell images and spectrum file of DNA, RNA or BSA at carbon, nitrogen and oxygen K absorption edge regions was combined to form one stack-file and one absorption spectrum, respectively. Combined image stack-file was named as spect1. DNA and RNA images were extracted from the spect1 by the SVD method in aXis2000 program. The relative amounts and distribution of DNA and RNA were applied to the image of nucleic acid (DNA and RNA) obtained from the difference between the images at 399.6 eV and 398 eV (the peak height in the NEXAFS of nucleic acid, i.e., DNA and RNA) in the spect1 for the separation of it to DNA image and RNA image. DNA and RNA spectra were normalized by the peak height at 399.6 eV and used to generate DNA stack-file (named as DNAspect) with the DNA image and RNA stack file (named as RNAspect) with the RNA image, respectively. DNAspect was subtracted from spect1 resulting in a stack-file named as spect2D. In the same manner, RNAspect was subtracted from spect2D resulting in a stack-file named as spect2R. Protein image was obtained from spect2R by the difference between the images at 401.4 eV and 398 eV (the peak height in the NEXAFS of BSA). Protein spectrum was normalized by the peak height at 401.4 eV and used to generate protein stack-file (named as Pr-spect) with the protein image. Pr-spect was subtracted from spect2R resulting in a stack-file named as spect3.
3Results
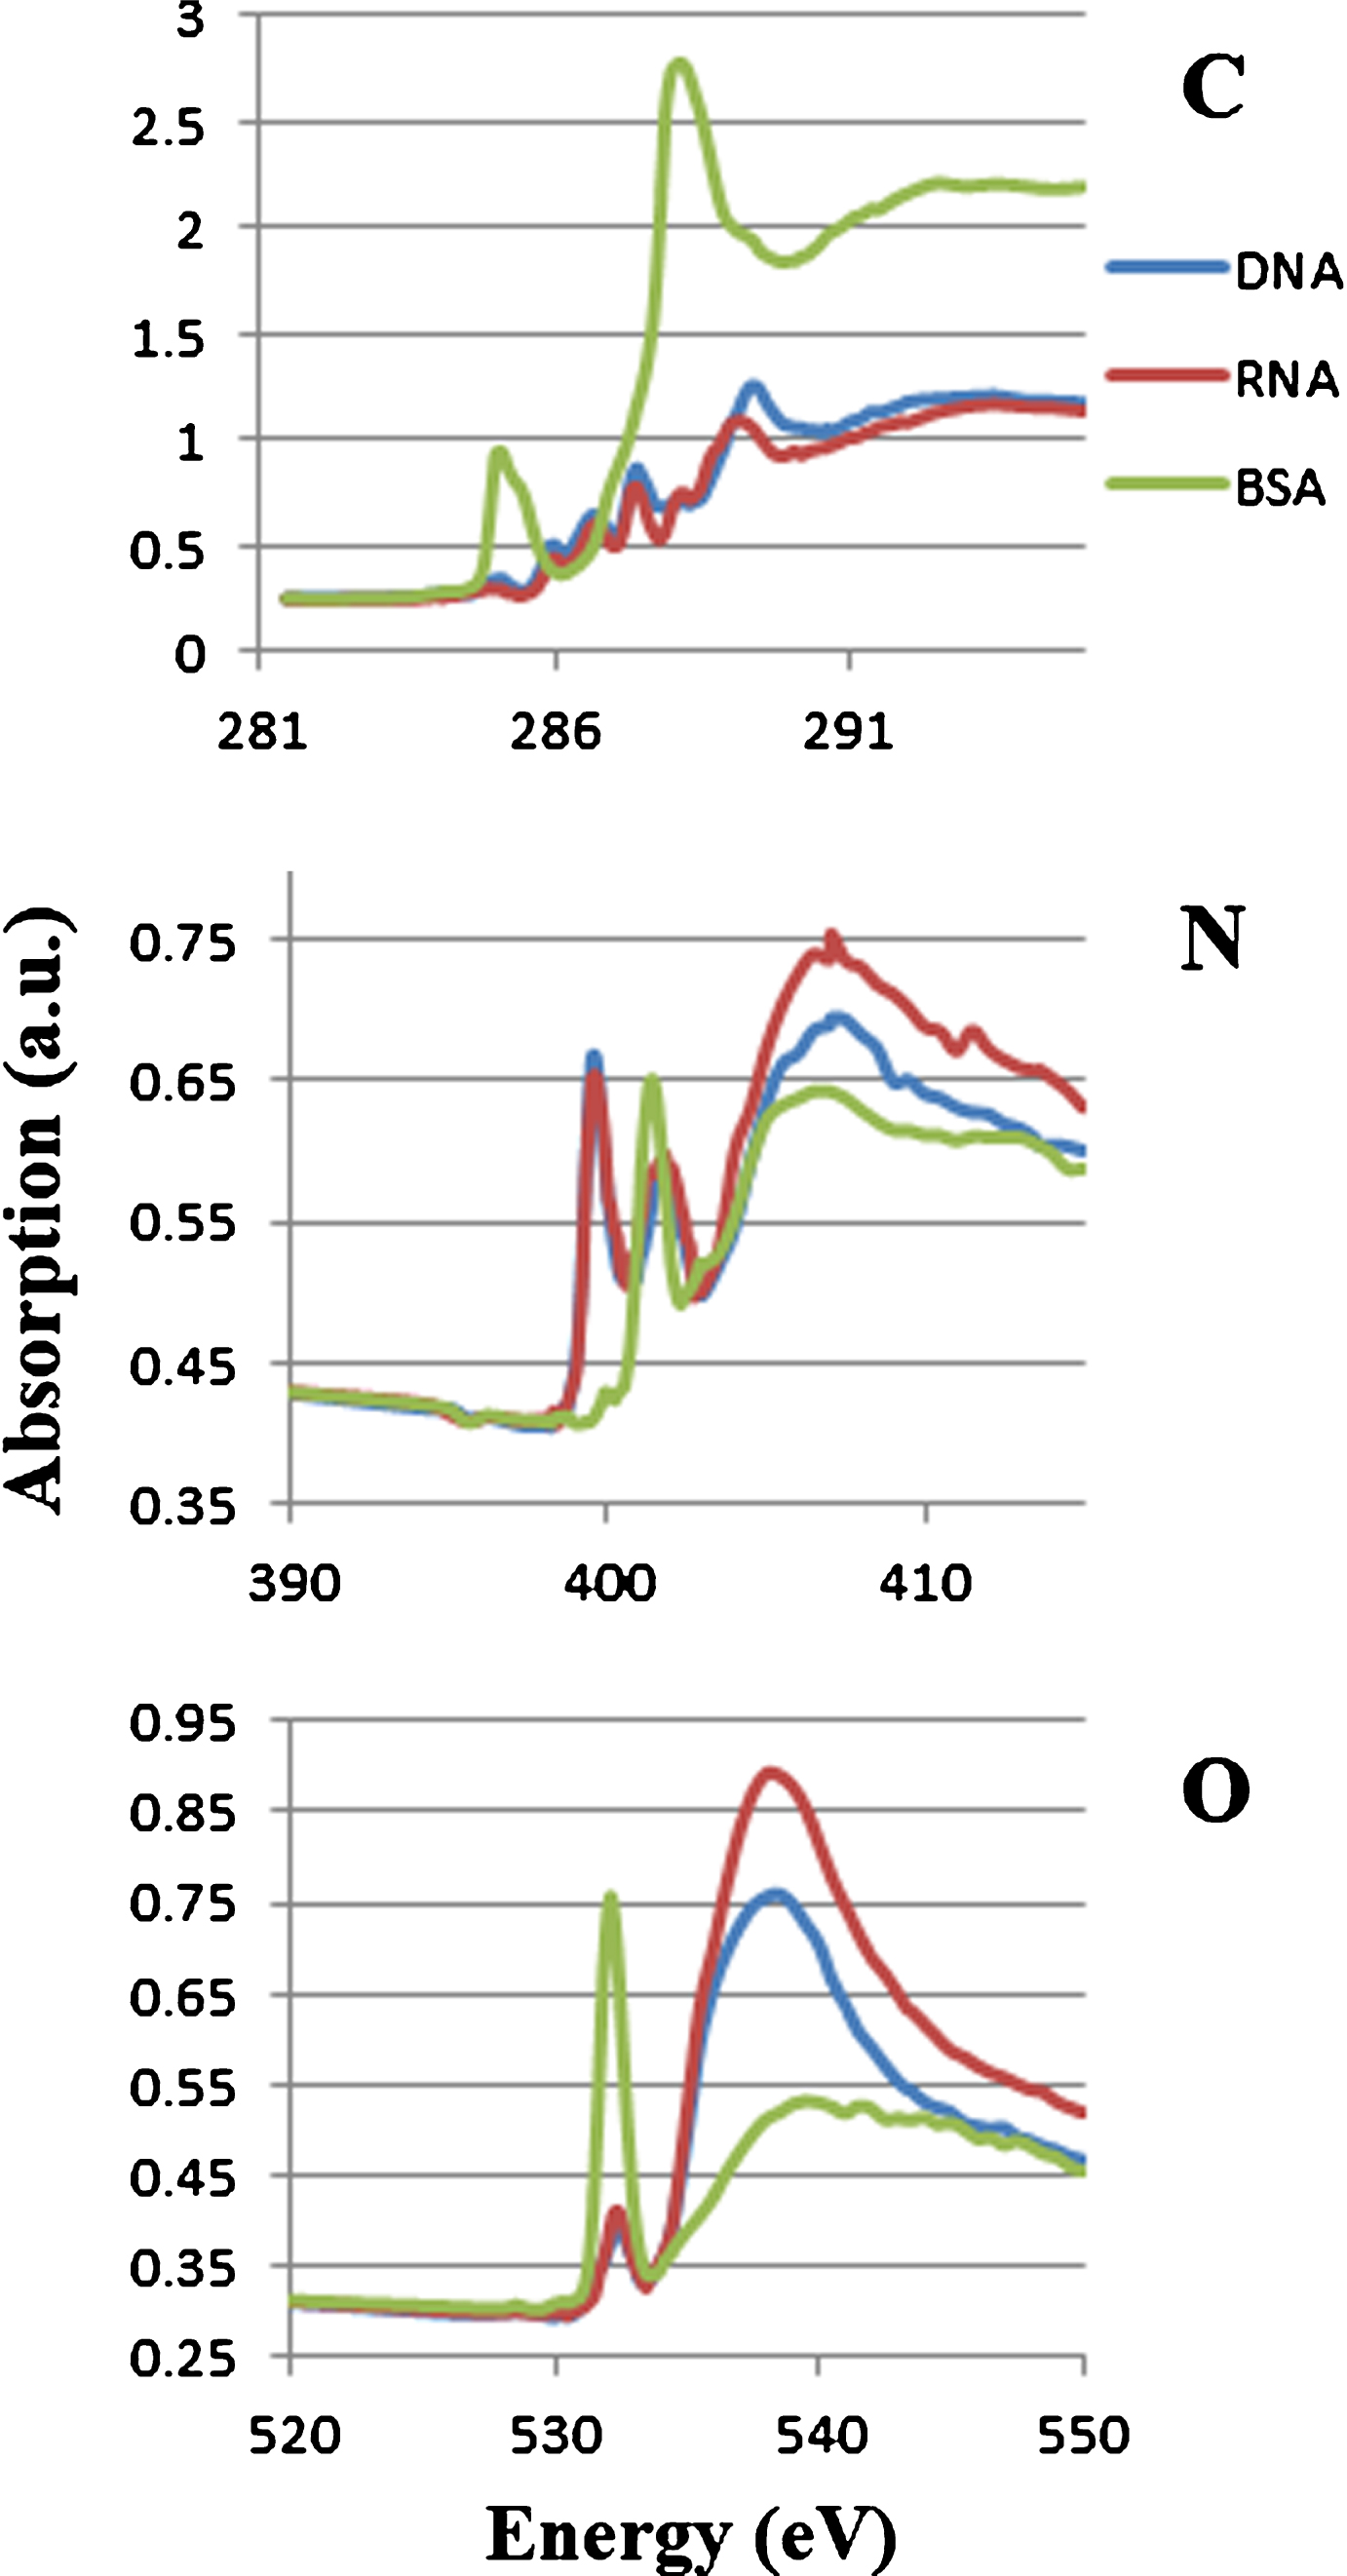
Figure 1 shows absorption spectra of DNA, RNA and BSA at the photon energy region of carbon, nitrogen and oxygen K absorption edges. Combined spectra of these molecules were used for the analysis. The peaks are clearly separated at 1s-π* transitions in their spectra between nucleic acid and protein at the photon energy region of nitrogen K absorption edge. The peaks are assigned to the absorption of N = C in nucleic acid (DNA and RNA) at 399.6 eV and amide in protein at 401.4 eV [7]. Those peaks were used to estimate the levels of nucleic acid and protein in the sample.
Fig.1
Soft X-ray absorption spectra of DNA, RNA and BSA at the photon energy regions of carbon, nitrogen and oxygen K absorption edge. Each spectrum was adjusted to be the same level at the left end of the photon energy.
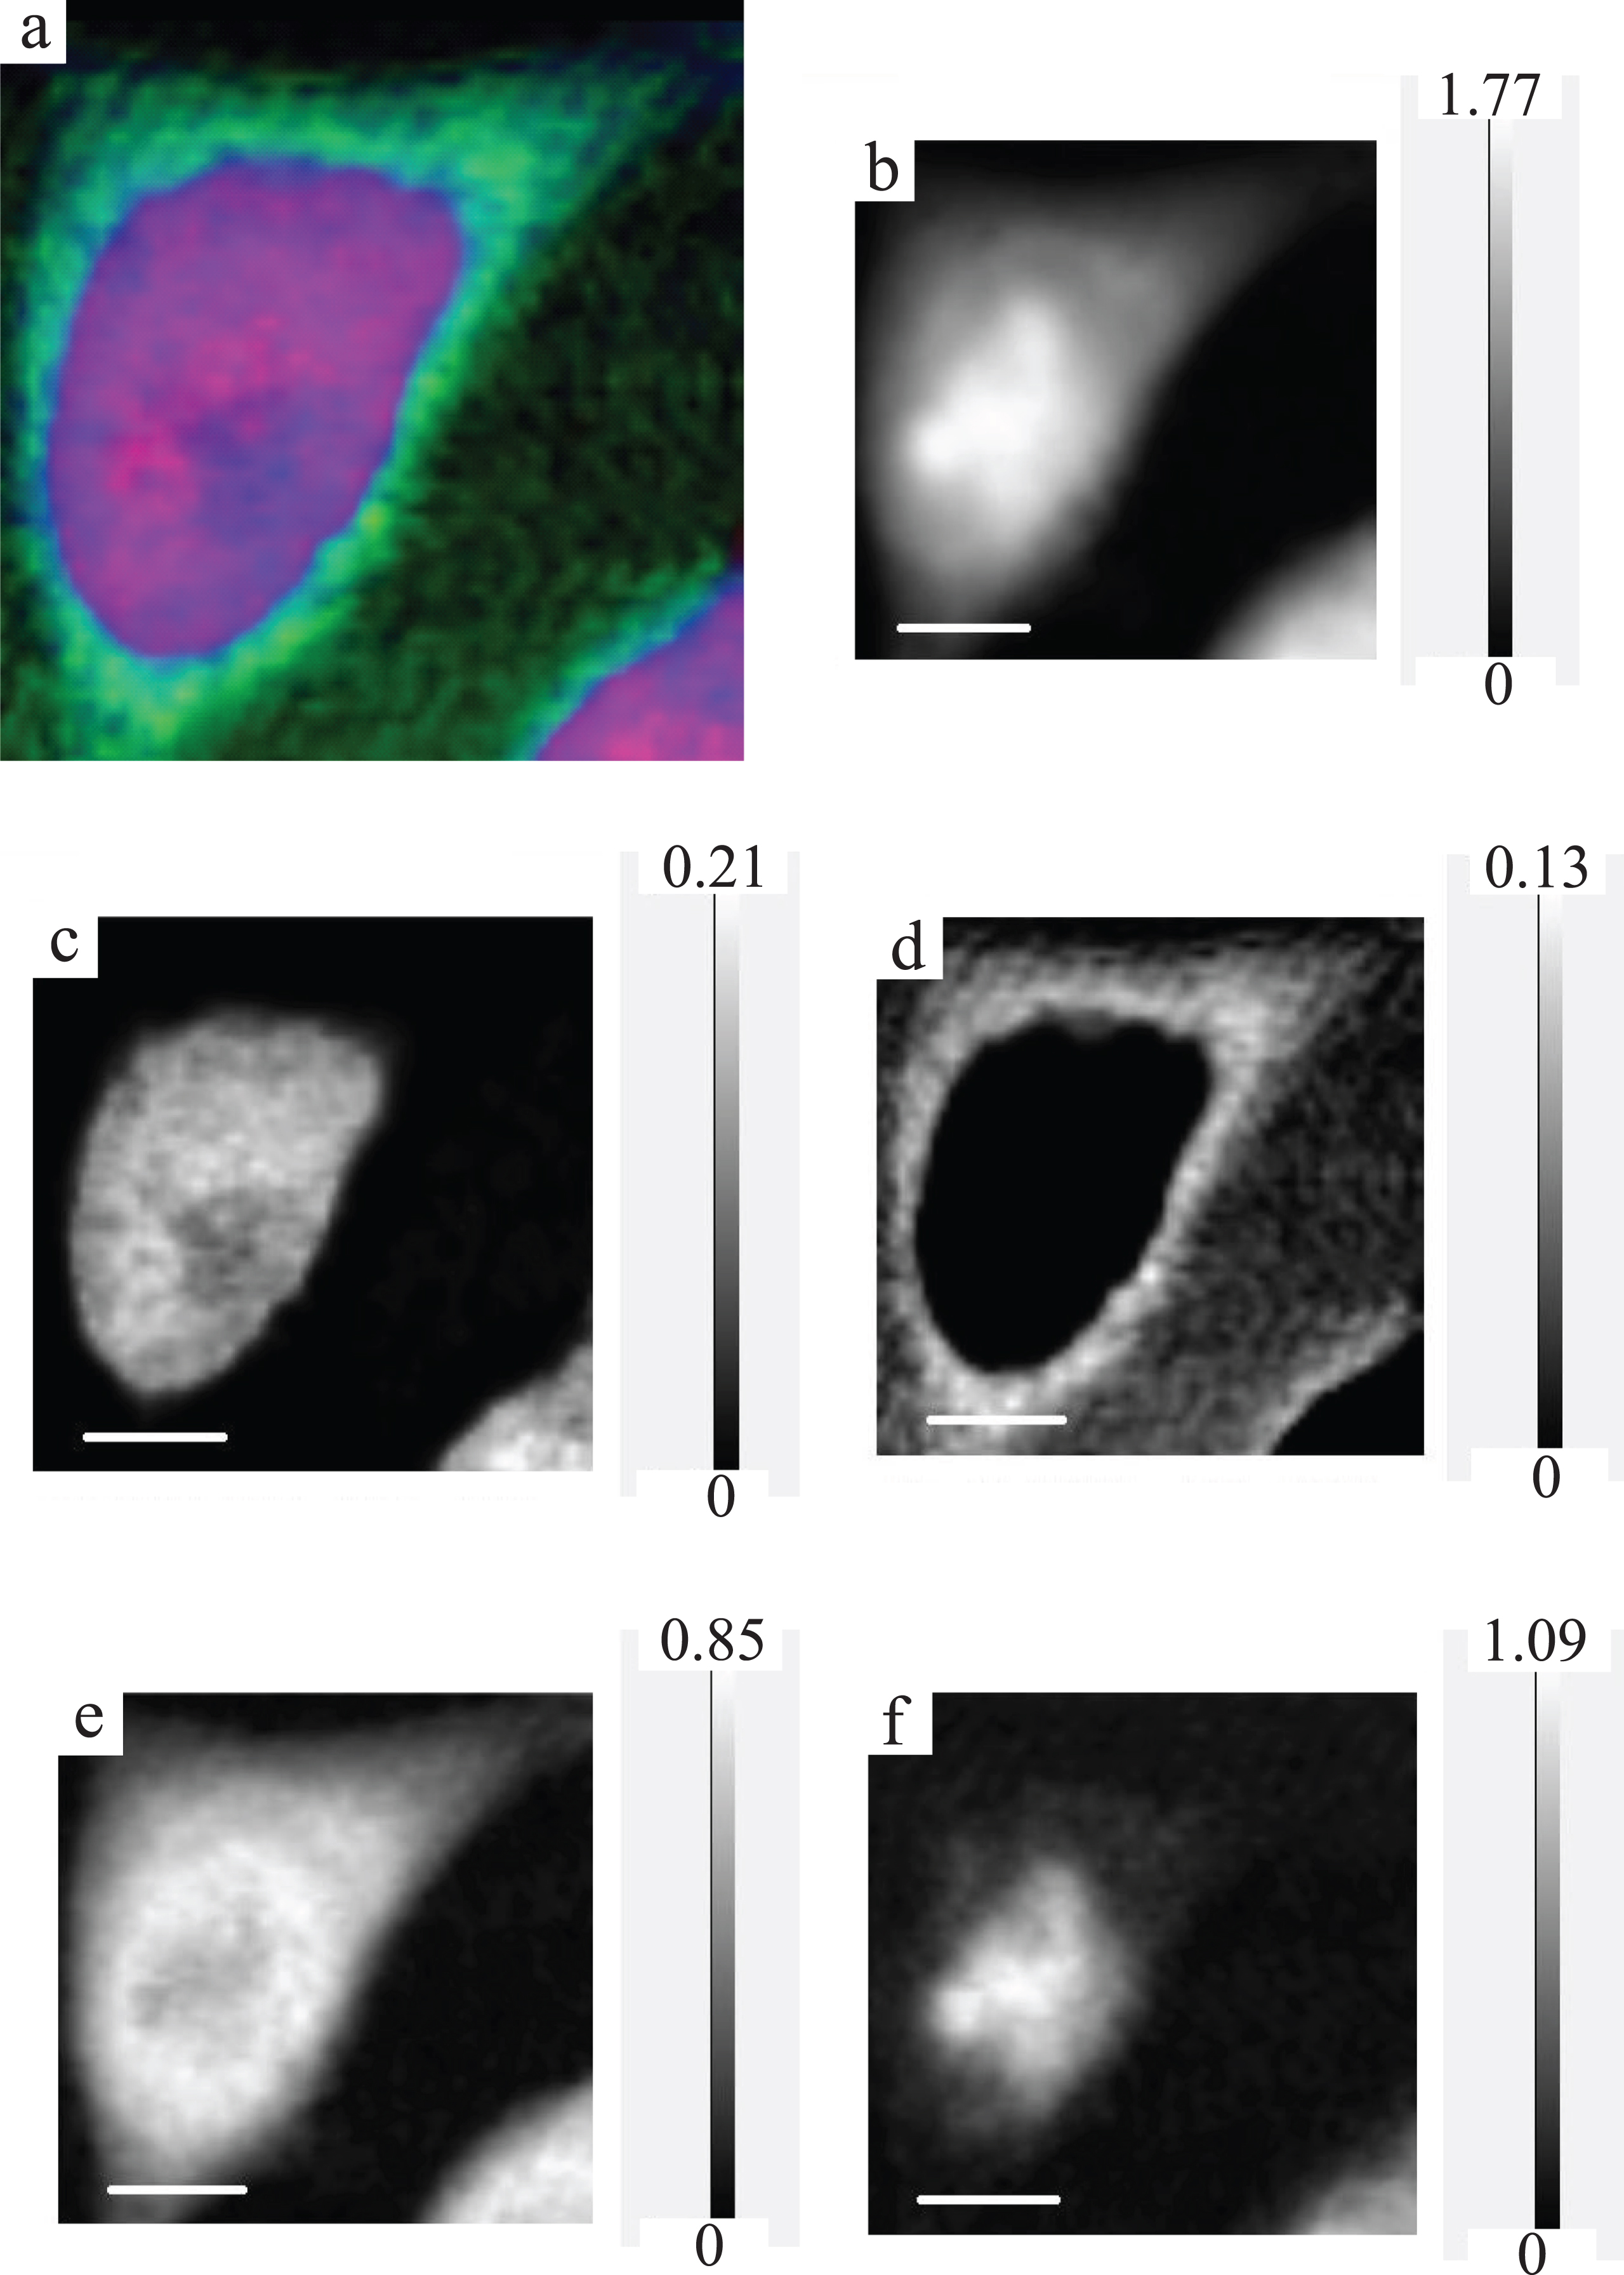
Shown in Fig. 2 is an X-ray absorption image of an interphase CHO cell at 398 eV. Absorption stack-file of the cell was analyzed with the SVD method in aXis2000 program for DNA and RNA. As shown in Fig. 3, DNA and RNA are found to be located clearly in the different regions suggested as nucleus and cytoplasm. The distribution of DNA, RNA and protein was estimated by the method shown in Materials and methods using aXis2000 program, and shown in Fig. 4. Figure 4a shows combined image of DNA, RNA and protein with the different colors of red, green and blue, respectively. In addition, there are original (spect1) absorption image (b), DNA image (c), RNA image (d), protein image (e) and residual (spect3) image (f) with the gray scale for optical density in Fig. 4 for comparison.
Fig.2
STXM image of an interphase CHO cell at 398 eV. The scale bar is 5μm.
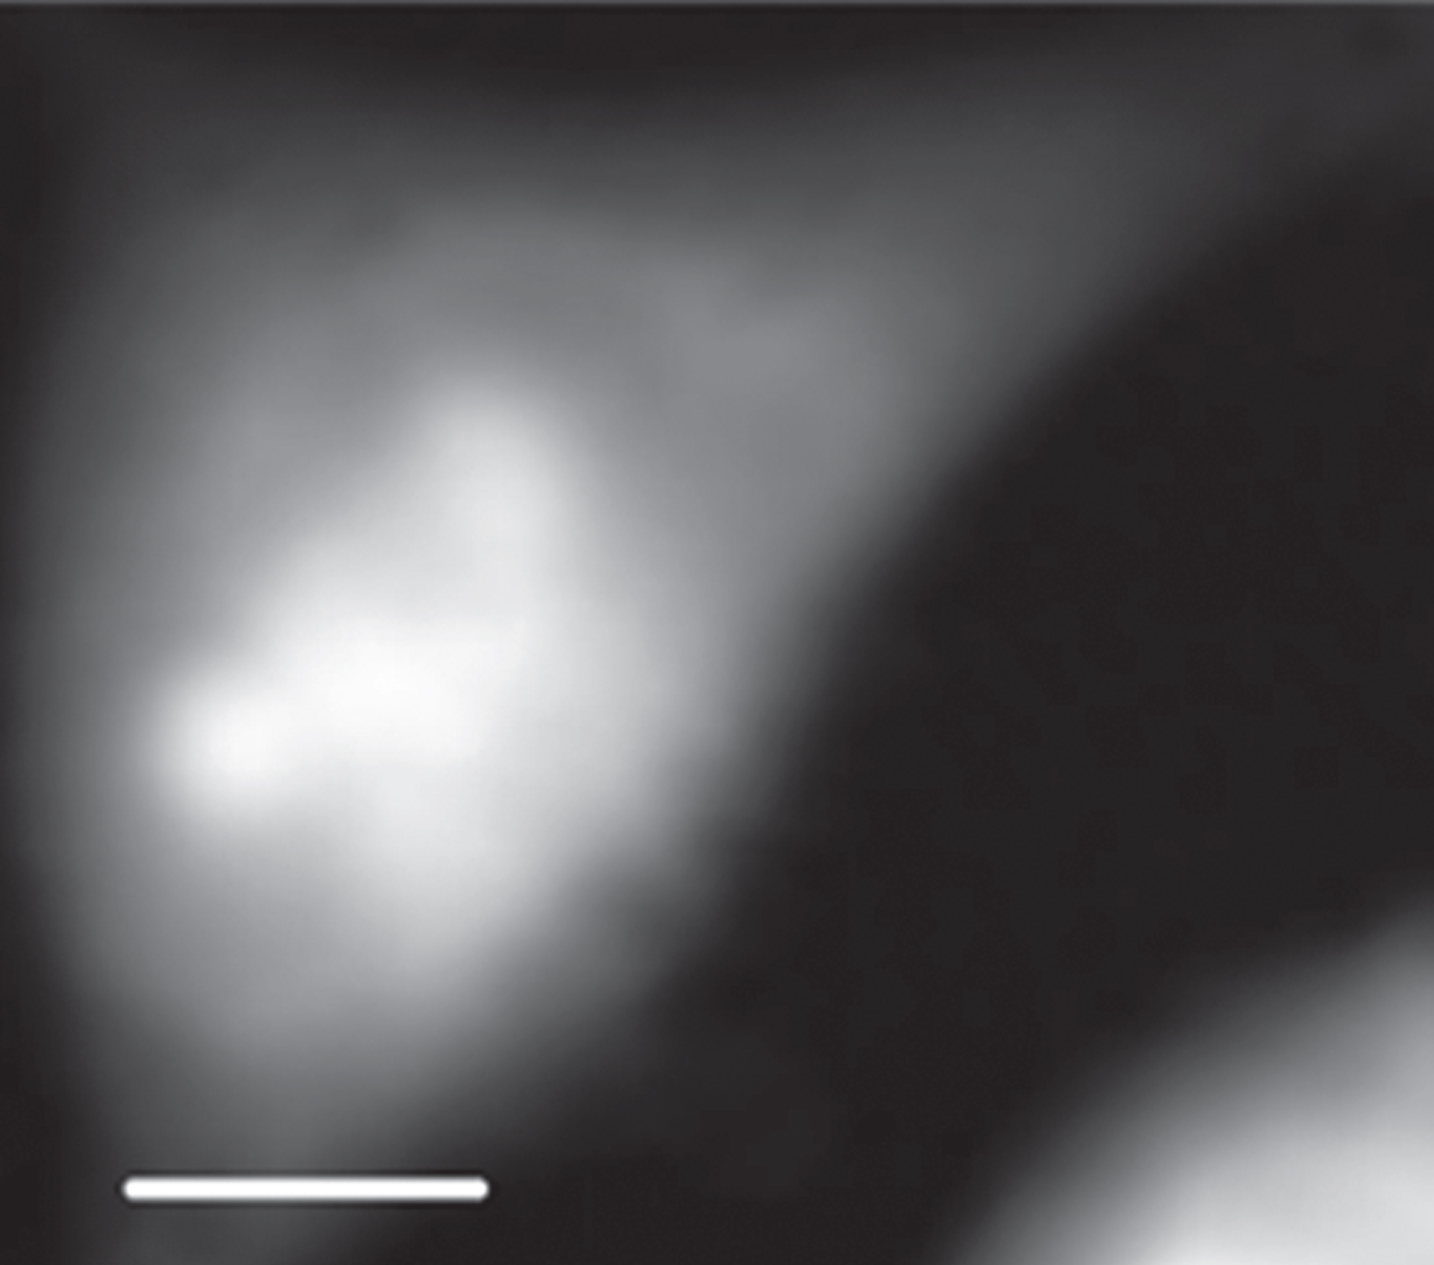
Fig.3
DNA (a) and RNA (b) images obtained by the SVD method in aXis2000 program. The scale bar is 5μm.
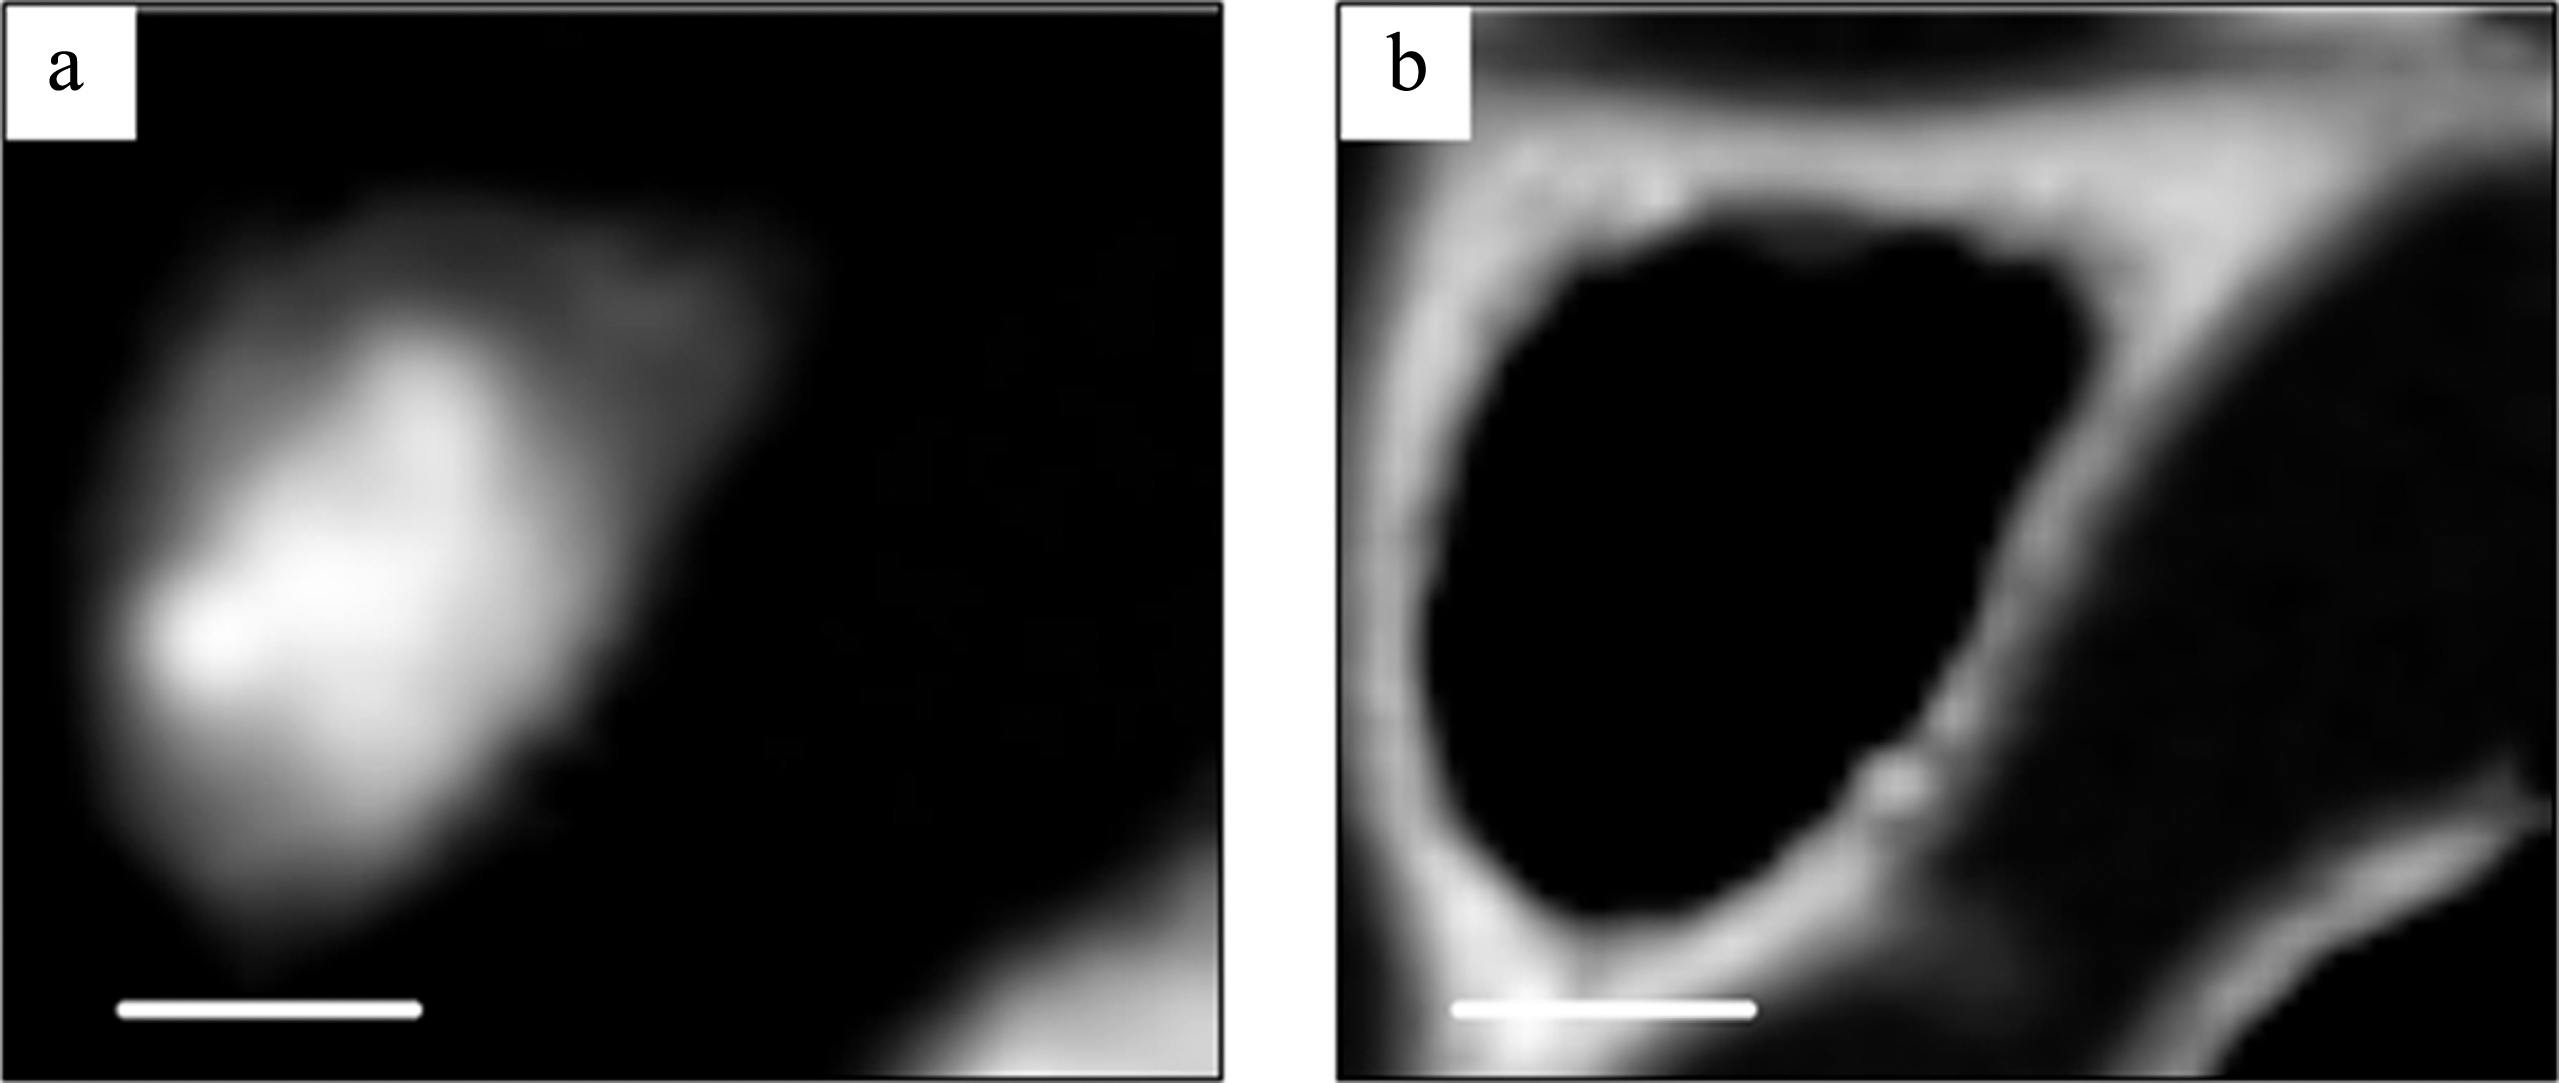
Fig.4
RGB expression and optical density expression at the photon energy of 398 eV with gray scale of the CHO image. For RGB expression (a), DNA, RNA and protein are displayed as red, green and blue, respectively. Original (spect1) absorption image (b), DNA image (c), RNA image (d), protein image (e) and residual (spect3) image (f) at the photon energy of 398 eV are displayed with the gray scale of optical density.
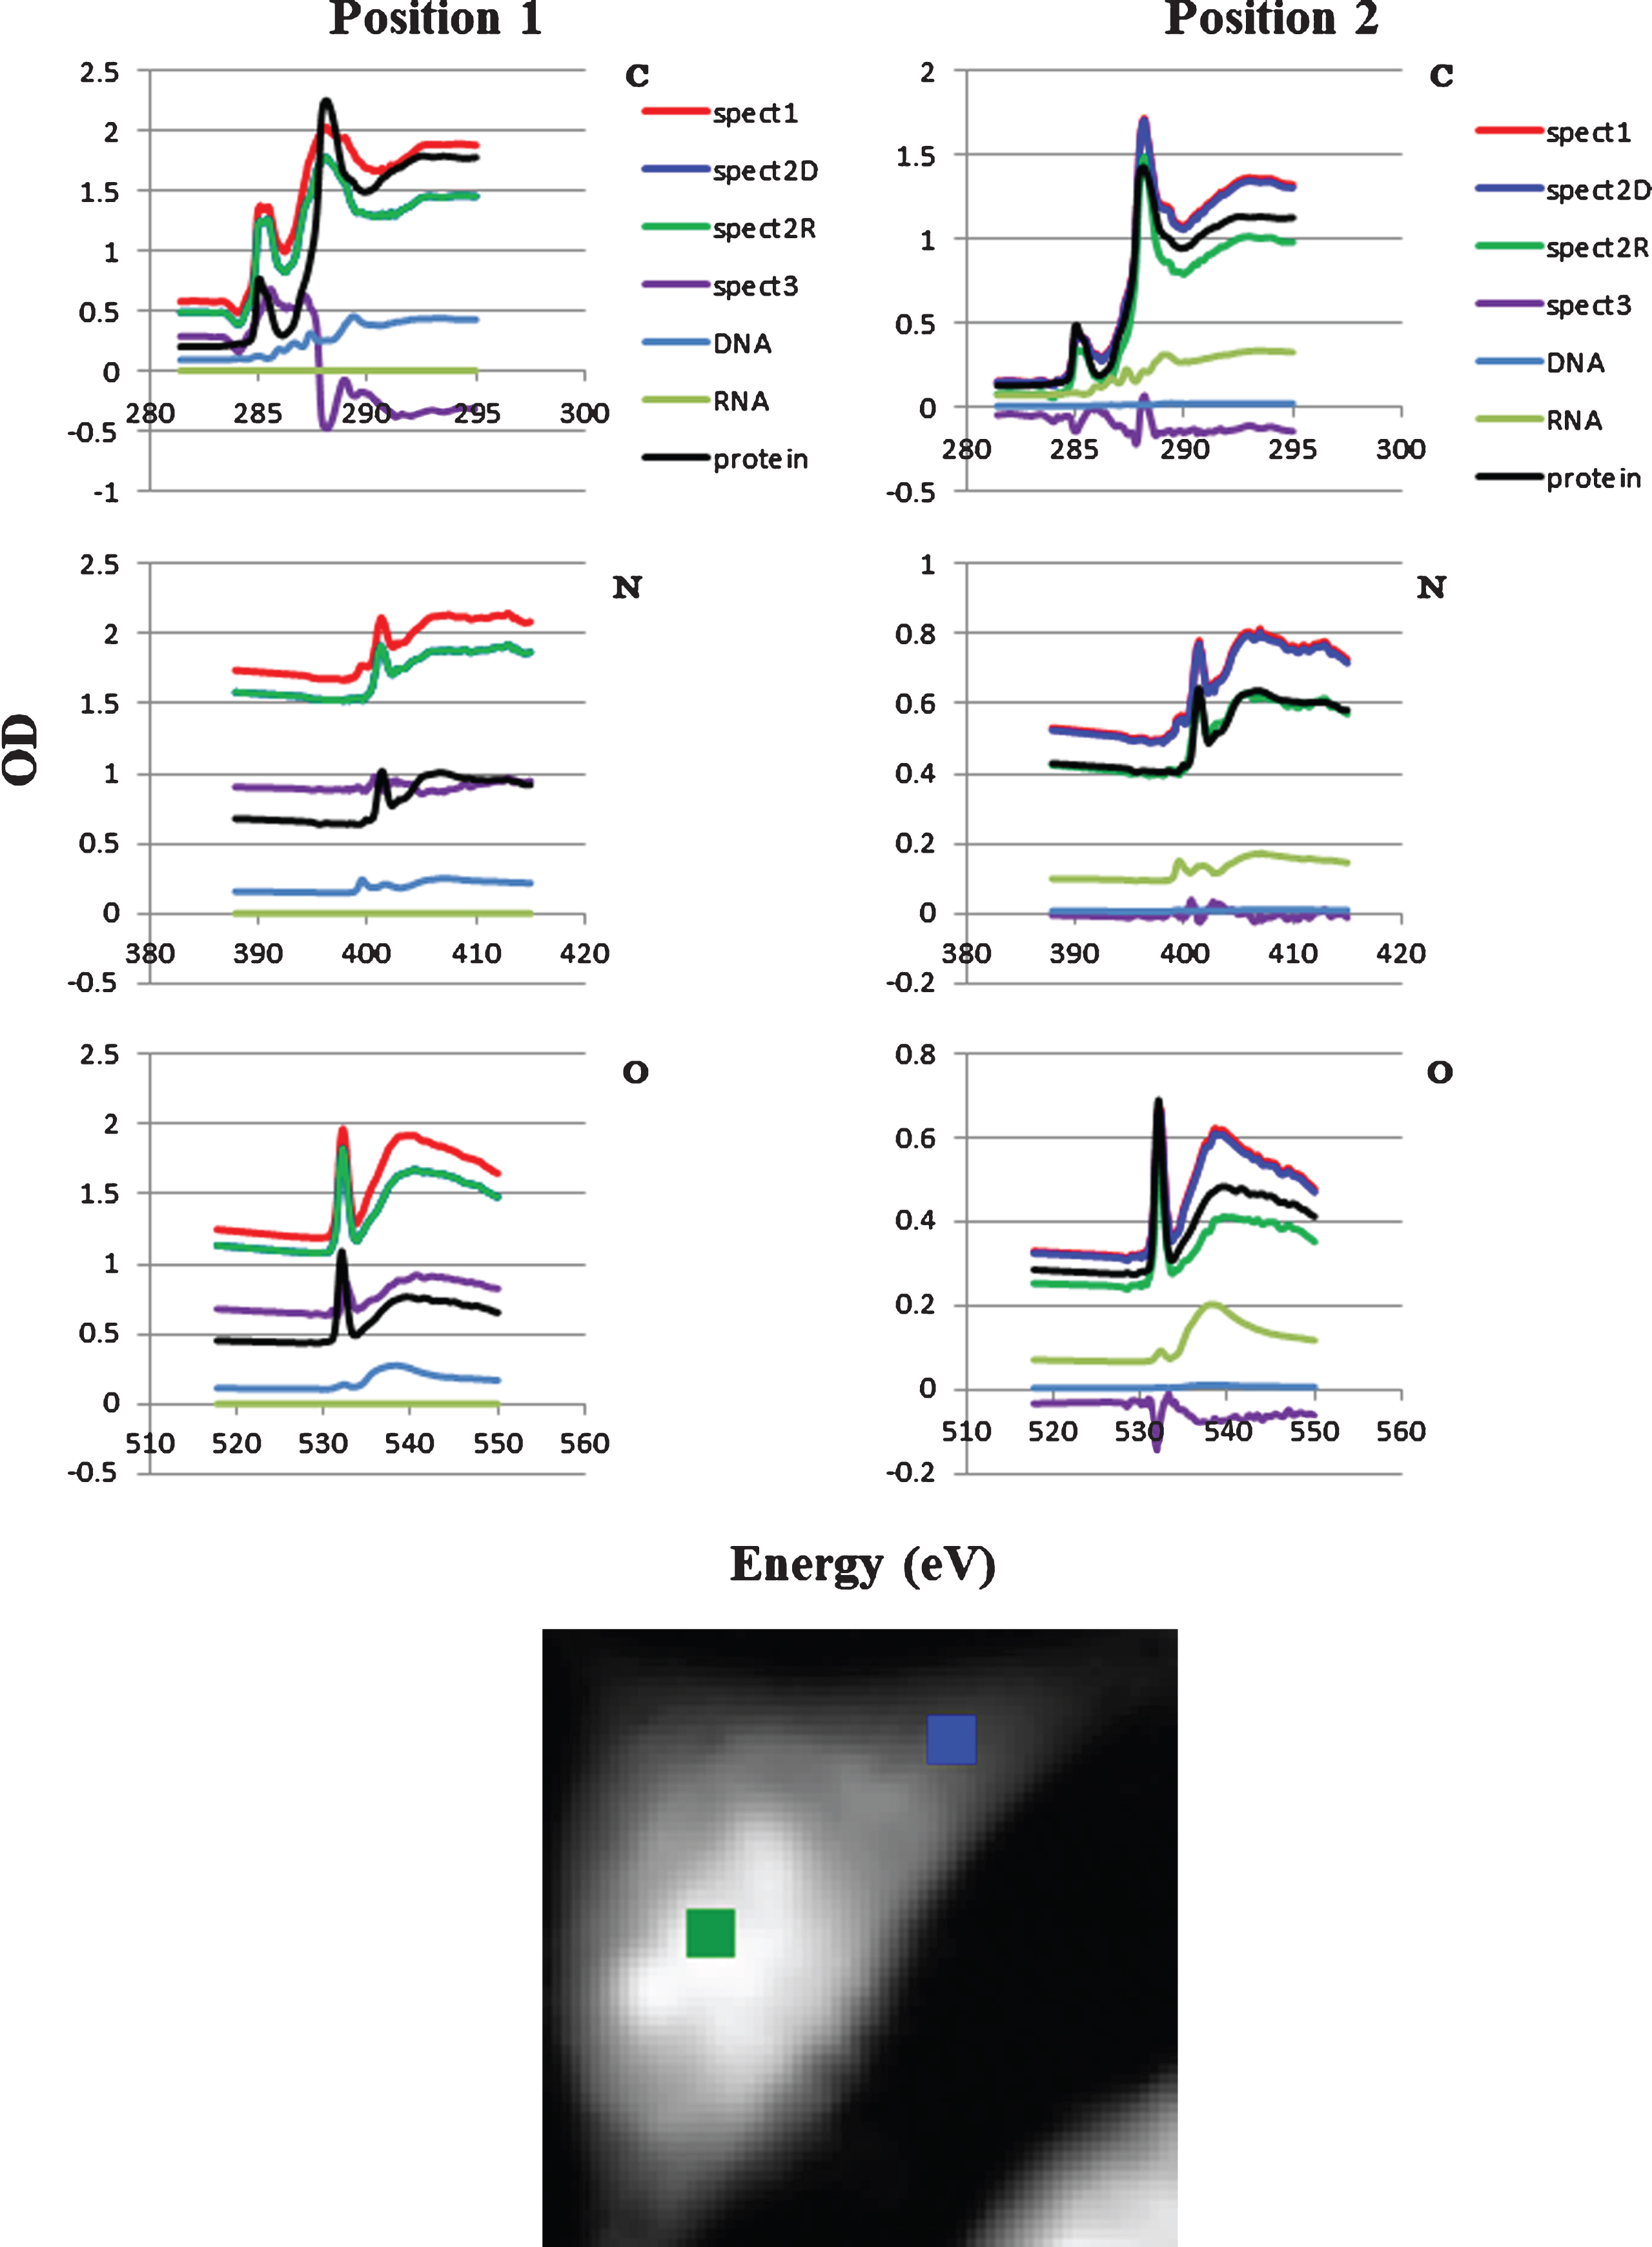
Local spectra at two positions in the cell were compared in Fig. 5 with respect to the absorption level. The positions 1 and 2 correspond to the central part and the peripheral part of the cell, respectively as shown in the lower image in Fig. 5. RNA in the position 1 was almost none so that the spectrum of spect2D was overlaid by spect2R. In contrast DNA slightly appeared in the position 2. Spect3 at the position 1 exhibits significant level of absorption, while nearly zero level at the position 2. The results suggested that there must be other molecule(s) contributing to the absorption at the position 1 and over-subtraction of protein at the position 2.
Fig.5
Subtraction of DNA, RNA and protein spectra from the spect1 for positions 1 and 2. DNA, RNA and protein stack-files were subtracted sequentially from spect1 resulting in spect2D, spect2R and spect3, respectively. C, N, and O are photon energy regions of the K absorption edges for carbon, nitrogen and oxygen. Location of the positions 1 (green) and 2 (blue) were shown in the lower figure. Spect2D in the position 1 was not appeared in the figure.
4Discussion
In the present work, the ratio of DNA and RNA in the absorption was successfully estimated by the SVD method in aXis2000 program by the use of combined spectra of DNA and RNA at the photon energy region of carbon, nitrogen and oxygen K absorption edges. DNA stack-file was constructed and subtracted from spect1. Resulting stack-file named as spect2D contains the images for RNA, protein and other molecules. In the same manner, RNA stack-file was constructed and subtracted from spect2D. Resulting stack-file named as spect2R contains the images for protein and other molecules. Then protein image was extracted and its stack-file was subtracted from spect2R. The residual stack-file (spect3) contains the images of other molecules than DNA, RNA and protein. In this process, characteristic absorption peaks of 1s-π* transitions for N = C bond in nucleic acid and amide bond in protein at the peaks of 399.6 eV and 401.4 eV, respectively, (see Fig. 1) have been successfully applied to estimate the absorption levels of those molecules quantitatively. Spect3 in Fig. 5 suggests that there may exist small level of nitrogen containing molecules in the position 1, but they should not affect the absorption levels of nucleic acid and protein, because the spectra of 1s-π* transitions at nitrogen K absorption edge region are specific to corresponding molecules containing those chemical bonds.
The results demonstrated that the distribution of DNA and RNA in a fixed and dried cell was clearly separated as displayed by color expression (Fig. 4), probably for DNA in the nucleus and RNA in the cytoplasm. No detection of RNA in the position 1 which corresponds to the position in nucleus may be attributable to the low fraction of RNA [10, 11] compared to other molecules such as DNA and proteins so that the signal from RNA was submerged in the total absorption. In contrast minor fraction of DNA is detectable in the position 2 as the slight decrease of the spectrum for spect2D from the spectrum for spect1 as was seen in Fig. 5. This minor fraction may indicate that mitochondrial DNA could be detectable.
The shape in the residual spectra (spect3 in Fig. 5) suggested the existence of significant absorption level of molecules other than nucleic acid and protein such as lipid and sugar, one of the main components in mammalian cells [12], in the position 1, but less in the position 2 (Fig. 5). The negative value in spect3 may be caused by over-subtraction of protein stack-file especially at the photon energy regions of carbon and oxygen K absorption edges, probably due to the reason that BSA was not adequate as the representative protein in the cell.
The present method, which is the SVD method in aXis2000 program in combination with the quantitative subtraction with respect to the unique absorption peaks of 1s-π* transitions at nitrogen K absorption edge region for nucleic acid and protein, revealed that soft X-ray spectromicroscopy is valuable to discriminate the distribution of closely related biomolecules such as DNA and RNA. The reason for the discrimination of DNA and RNA may be explained by the difference in the spectra at the carbon edge region. This difference in the spectra is attributable to the difference in the chemical structure of DNA and RNA. In addition, it may include the topological inequality, because sequence-sensing and self-assemble properties specific to DNA may contribute to bending and compaction of DNA [13–15]. With the same procedure, distribution of molecules in other closely related molecular groups such as protein and lipid will be identified. Accumulation of the spectral information of various biomolecules will be a strong approach to the full analysis of molecular distribution in a cell in the future.
Acknowledgments
The work was performed at the UVSOR Synchrotron in Institute for Molecular Science under the proposal number S-15-MS-2020. We would like to deeply thank Prof. Nobuhiro Kosugi for his valuable suggestion and kind support, and Mr. Yuichi Inagaki for his helpful technical support with the STXM measurements. This work was partially supported by grants from JSPS KAKENHI Grant Number JP16H03902 and Research Institute for Science and Technology of Tokyo Denki University Grant Number Q18L-02.
References
[1] | H. Ade , X. Zhang , S. Cameron , C. Costello , J. Kirz , S. Williams , Chemical contrast in X-ray microscopy and spatially resolved XANES spectroscopy of organic specimens, Science 258: ((1992) ), 972–975. |
[2] | X. Zhang , R. Balhorn , J. Mazrimas , J. Kirz , Mapping and measuring DNA to protein ratios in mammalian sperm head by XANES imaging, J Struct Biol 116: ((1996) ), 335–344. |
[3] | J.R. Lawrence , G.D.W. Swerhone , G.G. Leppard , T. Araki , X. Zhang , M.M. West , A.P. Hitchcock , Scanning transmission X-ray, laser scanning, and transmission electron microscopy mapping of the exopolymeric matrix of microbial biofilms, Applied Environmental Microbiology 69: ((2003) ), 5543–5554. |
[4] | Z. Yangquanwei , S. Neethirajan , C. Karunakaran , Cytogenetic analysis of quinoa chromosomes using nanoscale imaging and spectroscopy techniques, Nanoscale Res Lett 8: ((2013) ), 1–7. |
[5] | J. Jamroskovic , P.P. Shao , E. Suvorova , I. Barak , R. Bernier-Latmani , Combined scanning transmission X-ray and electron microscopy for the characterization of bacterial endospores, FEMS Microbiol Lett 358: ((2014) ), 188–193. |
[6] | K. Shinohara , A. Ito , K. Kobayashi , Measurement of XANES spectra of biological molecules in the soft X-ray region, in: X-Ray Microscopy and Spectromicroscopy, Springer-Verlag,Berlin/Heidelberg, (1998) , pp. III-157–III-161. |
[7] | K. Shinohara , T. Ohigashi , S. Toné , M. Kado , A. Ito , Quantitative study of mammalian cells by scanning transmission soft X-ray microscopy, Journal of Physics: Conference Series 849: ((2017) ), 012003, 1–4. |
[8] | K. Shinohara , T. Ohigashi , S. Toné , M. Kado and A. Ito , Quantitative analysis of mammalian chromosome by scanning transmission soft X-ray microscopy, Ultramicroscopy 194: ((2018) ), 1–6. DOI:10.1016/j.ultramic.2018.07.001 |
[9] | |
[10] | R. Maggio , P. Siekevitz and G.E. Palade , Studies on isolated nuclei I. Isolation and chemical characterization of a nuclear fraction from guinea pig liver, J Cell Biol 18: ((1963) ), 267–291. |
[11] | M.A.M.J. van Zandvoort , C.J. de Grauw , H.C. Gerritsen , J.L.V. Broers , M.G.A. oude Egbrink , F.C.S. Ramaekers and D.W. Slaaf , Discrimination of DNA and RNA in cells by a vital fluorescent probe: Life time imaging of SYTO13 in healthy and apoptotic cells, Cytometry 47: ((2002) ), 226–235. |
[12] | B. Alberts , D. Bray , J. Lewis , M. Raff , K. Roberts , J.D. Watson Table 3-1 Approximate chemical compositions of a typical bacterium and a typical mammalian cell, in Molecular Biology of the Cell, Third edition, Garland Publishing, Inc. New York and London, (1994) , pp. 90. |
[13] | S. Inoue , S. Sugiyama , A.A. Travers , T. Ohyama , Self-assembly of double-stranded DNA molecules at nanomolar concentrations, Biochemistry 46: ((2007) ), 164–171. |
[14] | J. Nishikawa , T. Ohyama , Selective association between nucleosomes with identical DNA sequences, Nucleic Acids Res 41: ((2013) ), 1544–1554. |
[15] | N. Sumida , J. Nishikawa , H. Kishi , M. Amano , T. Furuya , H. Sonobe , T. Ohyama , A designed curved DNA segment that is a remarkable activator of eukaryotic transcription, FEBS Journal 273: ((2006) ), 5691–5702. |


