
Decision making for basketball clutch shots: A data driven approach
Abstract
Decision making is considered one of the most important aspects for winning a basketball game. In the final minutes of the game (clutch time), these decisions become even more crucial. In particular –who shall take the final, game-winning shots? While some coaches believe it is the team’s star, others may prefer the ‘clutch’ player (who seemingly performs better in clutch time), or the ‘hot’ player who was having a great game that night. In this work we study policy making in clutch minutes. Specifically, we introduce different policies for choosing the shot-taker (for example, according to field goal percentage). Then, we compare the policies and rank them to create a policy hierarchy, which serves as a decision guide for the coach. We show that when our recommendations are implemented (i.e., the highest ranked player takes the shot) the success rate is significantly greater: 51.2%, compared to 41.3% in commonly taken clutch shots. Furthermore, our results indicate that players who excelled in past clutch shots are more likely to succeed, independently to their performance in the current game.
1Introduction
Basketball is one of the most popular sports games in the world. The National Basketball Association (NBA) is widely recognized as the world’s leading league, attracting international interest. In the league there are 30 teams that currently invest, on average, $127 million per year each on players’ salaries (Basketball Reference, 2021). The ultimate goal of each team is winning games and titles.
Decision making is considered one of the most crucial aspects for winning a game, especially in fast-paced, dynamic team sports. Particularly in basketball, coaches can take numerous actions during the game such as timeouts, play-calling and unlimited substitutions. This highlights the impact that coaches’ real-time decisions may have on the outcome of the game and the underlying challenge they are facing. In contrast, in other popular sports such as soccer, the number of real-time coaching decisions that can be taken is limited and therefore coaches’ real-time actions may be not as consequential.
The NBA refers to periods of the final five minutes of a game during which the score margin is less or equal to five points as clutch time (Martin, 2022). Shots taken during these periods are referred to as clutch shots. During clutch time, decision making becomes even more crucial. In this work, we focus on the following question: which players should take game-deciding shots during clutch time? Should it be the team’s star –who has the best skills, the ‘clutch’ player who seemingly performs better while taking decisive shots, the ‘hot’ player who was having a great game that night, or possibly a different player? Basketball coaches need to make this hard decision almost every game, where different coaches follow different philosophies. Some coaches choose the go-to player before the game (usually either the team’s star or the clutch player), while others prefer choosing the shooter during the game, based on their current performance (the hot player).
In this work, we apply data analysis tools to identify in real-time the players who should take clutch shots, based on their current properties. We consider various player-selection policies to select the clutch shooter, one of them based on a prediction model. Then, we evaluate the policies and rank them using multiple hypothesis testing. Afterwards, we rank the players in the team from the highest to lowest estimated probability to score, using the above hierarchy of policies; this process is repeated for each clutch shot. Finally, we evaluate the obtained ranking using an independent dataset of clutch shots.
In some cases, selecting the player most likely to score a clutch shot may seem somewhat trivial: in a league where the ability of superstars such as Michael Jordan, Lebron James and Kobe Bryant seems supreme, such superstars would be immediately classified as the best choice, as they demonstrate excellent shooting ability, along with solid clutch performance and may also be the current hot players in their teams. However, the choice that seems obvious may not consistently achieve better results than a more surprising choice: while players who are leading their teams in pre-game points per game (PPG) take relatively plenty of clutch shots (26.6% of total clutch shots), their clutch shots success rate is just below average (41.2%). Further, due to the dynamic nature of basketball, selecting a single player to take the shot may not always be a sufficient plan - for example, the other team may focus its defense into this single player. Our hierarchy provides a contingency plan and assists in recognizing who should take the shot - and in what order of preference.
The rest of the paper is organized as follows. In the Literature Review Section, we review articles related to clutch players, hot players, and other quantitative studies inspired by the game of basketball. In the Methods Section, we describe the methodologies that we apply in this research. In the Analysis and Results Section, we detail our experiment and present the obtained results. Finally, we present our conclusions in the Discussion Section.
2Literature review
The concept of clutch players is a very popular topic, and various studies focused on this phenomenon. Cao et al. (2011) analyzed free-throw data from the 2002/03 –2009/10 NBA seasons. They have found that most players underperform under pressure (“choke”), shooting on average 5% –10% worse from the free-throw line. Solomonov et al. (2015) challenged the clutch reputation in basketball. According to a ranking made by eight basketball experts, they picked 16 NBA players who were perceived as good clutch players and compared their performance in clutch minutes to not-clutch minutes during the 2015/16 NBA season. They concluded that clutch players improve their performance in the final, decisive minutes of the game. However, such improvement is not necessarily reflected in their shooting success rate. Zuccolotto et al. (2018) utilized both univariate and multivariate analysis techniques, including Classification and Regression Trees (CART), to model scoring probability under high-pressure conditions in basketball. Through their analysis of play-by-play data from the Italian “Serie A2” Championship 2015/2016, they identified several factors that impact scoring probability under pressure including the remaining time on shot clock, the outcome of the previous shot, and more. The authors then validated their findings using data from the Olympic Basketball Tournament “Rio 2016”. Metulini and Le Carre (2020) analyzed basketball shots under pressure using CART by utilizing data from the European Basketball Champions League (BCL) and the NBA. They developed a player shooting performance index for a selection of players and found that shot clock remainder is one of several factors affecting shots’ probabilities, along with score margin and other variables. Notably, both Zuccolotto et al. (2018) and Metulini and Le Carre (2020) identified shot clock remainder as a significant variable impacting scoring probabilities under pressure in basketball.
In addition, Christmann et al. (2018) studied different play types (i.e., isolation, pick & roll and others) during clutch time by video-analyzing 996 clutch plays. They found that dynamic and complex team plays enhance the success probability of endgame play types, and that teams who are lagging behind are more likely to score in the next possession than leading teams. Gómez et al. (2018) collected a sample of shots attempted by 92 players in the Spanish professional basketball league (ACB) and used binomial logistic regression analysis to investigate determinants of decreased free-throws shooting efficiency during close games. They found that during the final minute, playing position and score differential were significant factors affecting performance, with being in the center position decreasing the FT shooting percentage and score differential when tied or losing positively related to success. From a psychological point-of-view, Maher et al. (2020) interviewed seven elite players, questioning them on their perceptions of managing pressure in the game. They claimed that the players do believe in the concept of clutch, while different players follow different strategies to perform better during this period. Sigler (2020) found that the salaries of the highest paid NBA players are positively associated with their performance in clutch situations during close games. He concludes that NBA teams place a high value on players who are able to make shots, assist their teammates, and exhibit confidence in critical moments of the game.
In basketball, the term ‘hot player’ refers to a player performing better than on average. Our focus is not on the existence of this phenomenon, but rather on the extent to which it affects the success of clutch shots. Multiple studies have examined whether this phenomenon exists. Gilovich et al. (1985) used field goal and free throws data of two NBA teams to examine whether the probability of a player to score increases if he has scored the preceding shot. They concluded that this is a “misperception” that does not exist. Contrarily, Yaari and Eisenmann (2011) studied a much larger dataset of free throws (2005/6 –2009/10 NBA data) and presented evidence for non-random patterns. They conjecture that players’ scoring patterns may be explained by “better” and “worse” shooting periods. Bocskocsky et al. (2014) further analyzed field-goals attempts from the 2012/13 NBA season. They found that players who exceeded expectations over recent shots face tighter and tougher defense, demonstrating the defenders’ belief in the phenomenon. Nevertheless, these players are shown to have increased their shooting success rates by 1.2% –2.4%.
Quantitative tools are also used to answer additional related questions. Berger and Pope (2011) analyzed NBA and National Collegiate Athletic Association (NCAA) data. They showed that teams behind by a point at halftime surprisingly win more often than teams who lead by a point. Later, Klein Teeselink et al. (2023) challenged their conclusions and extended this analysis to Australian football, American football and rugby matches, as well as NBA matches from different sample period. They find little to no evidence of the described effect. Skinner (2012) studied shot selection in the NBA, modeling the quality of shot opportunities as a uniform distribution and suggesting that teams should compromise for lower-quality shot opportunities as the shot-clock winds down. Skinner and Guy (2015) studied the impact of teammate interaction on their offensive performance, and Moxley and Towne (2015) used growth mixture models to predict players’ success in the NBA. Arboretti et al. (2014) and Corain et al. (2017) proposed a nonparametric permutation-based methodology for ranking multivariate populations, which was further extended and applied by Corain et al. (2019) to round-robin designs for ranking data in basketball, using data from the Italian Basketball League. In their study, Corain et al. (2019) modeled game results as paired fixed linear models, used hypothesis testing to rank the teams, and validated the proposed model using a Monte Carlo simulation.
In this work we study the impact of various factors on success in clutch shots, including the clutch player and hot player phenomena, by describing each player using pre-game and in-game properties. We do not focus on whether each phenomenon exists or not; instead, we study how consequential each phenomenon (real or not) is to clutch shots’ success by comparing player-selection policies based on each phenomenon, and on other factors. Further, we translate our results into a real-time player ranking which serves as a decision-making tool.
3Methods
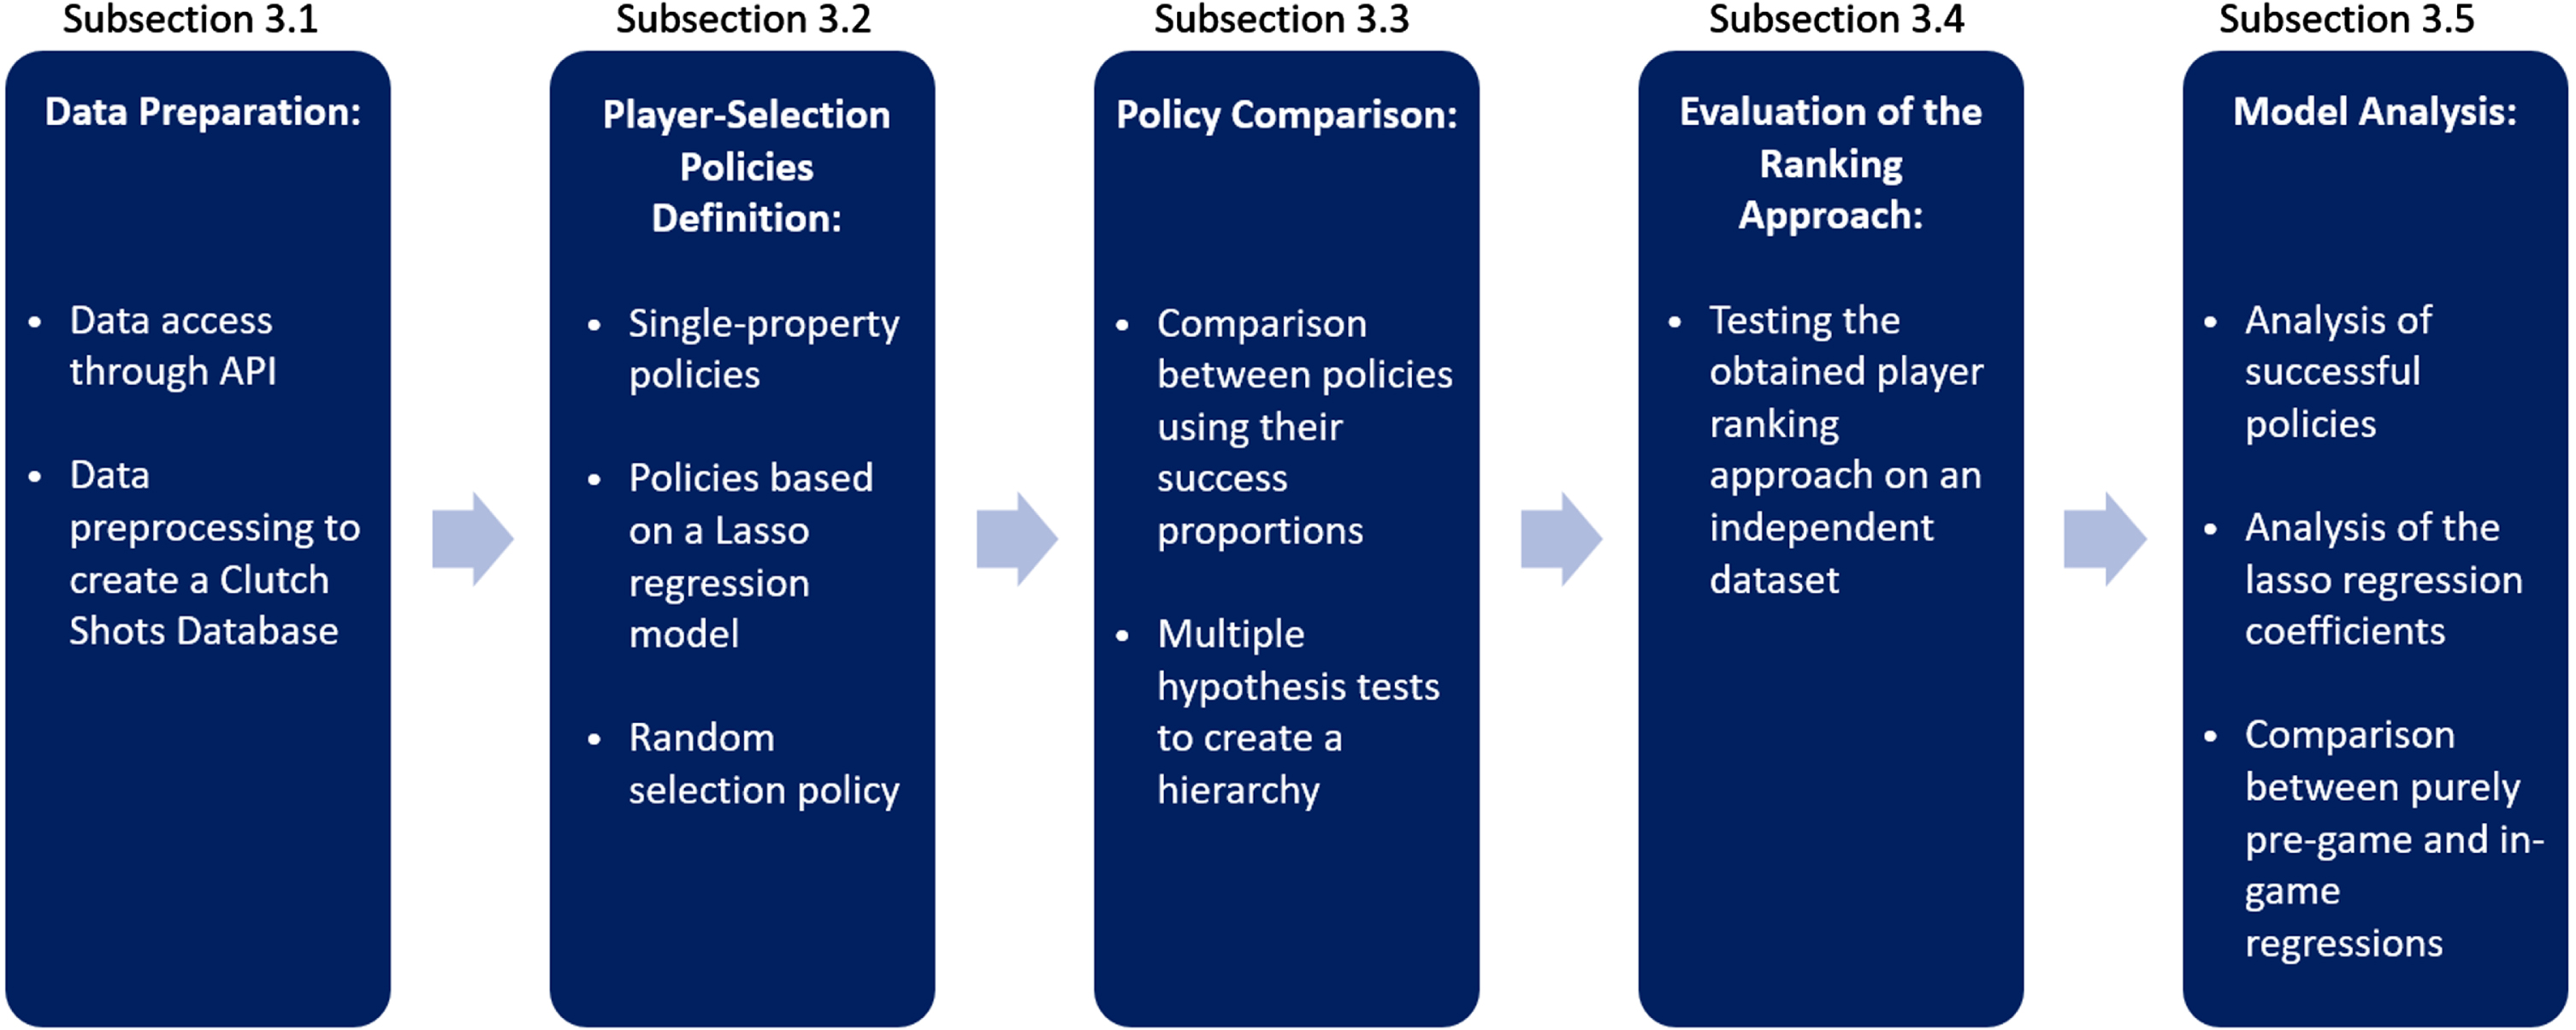
This section covers the methodologies used in this research: First, we describe the data preparation and preprocessing. Next, we define player-selection policies. In the Policy Comparison Subsection, we detail the evaluation of policies, the formation of a policy hierarchy using multiple hypothesis testing, and how the policy hierarchy is translated into a player hierarchy. Then, we illustrate the evaluation process of the policy hierarchy. Finally, we portray the model analysis techniques used to produce managerial insights. Figure 1 demonstrates the flow of the Methods Section.
Fig. 1
A flowchart of the methods section.
3.1Data preparation and preprocessing
At a given moment during clutch time, a team typically has eight to twelve available players (who are registered to the game and are not ejected or fouled out). We require a Clutch Shots Database, consisting of all the clutch shots that have been taken during the examined time period –in our case, the NBA seasons between 1996/97 and 2020/21. Specifically, each row corresponds to a clutch shot, and the columns describe its properties. In addition, each shot is labeled according to its outcome, i.e., ’successful’ or ’unsuccessful’.
The clutch shots database contains two main sets of player properties: pre-game and in-game. Pre-game properties are generated by processing all relevant plays of a player prior to the current game. These properties will assist in identifying how ’good’ a player is and particularly how he performs during clutch times. In-game properties are generated by processing the preceding plays of the game. These properties may indicate the player’s performance during the current game, focusing on his performance during the minutes preceding the shot, representing how hot the player is. To later examine player-selection policies, we also collect data for the players who did not take the clutch-shot. Each player in the team, at each clutch shot, is described using 34 player properties listed in Table 1.
Table 1
Considered player properties
| Pre-game player properties | In-game player properties |
| Pre-game 3PM per game | In-game 3PM |
| Pre-game 3PT% last 100 shots | In-game 3PT% last five shots |
| Pre-game FG% | In-game FG% |
| Pre-game FG% last 100 shots | In-game FG% last five shots |
| Pre-game FG made per game | In-game FT% |
| Pre-game points per game (PPG) | In-game FT% last five shots |
| Pre-game turnovers per game | In-game FTM |
| Pre-game assists per game | In-game Turnovers |
| Pre-game lead changing clutch shots % | In-game assists |
| Pre-game past 2 months Q4∖OT FT% | In-game blocks |
| Pre-game past 2 months PPG | In-game clutch lead changing clutch shots % |
| Pre-game past 2 months true shooting % | In-game fouls drawn |
| Pre-game playoff Q4∖OT if score margin ≤ 5 FG% | In-game points |
| Pre-game playoff Q4∖OT if score margin ≤ 5 PPG | In-game rebounds |
| Pre-game Q4∖OT if score margin ≤ 5 FG% | In-game total lead changing clutch shots made |
| Pre-game Q4∖OT true shooting % | In-game true shooting % |
| Pre-game total lead changing clutch shots made | |
| Pre-game total games played in career |
The Clutch Shots Database is created by processing play-by-play tables for each game in the observed time period. We download the play-by-play table of each game using the NBA-API (2021) by PyPI (2021), which is freely available and connects to the official NBA stats website (NBA Advanced Stats, n.d.). An example for how to find a game (by a team, for example) and download its play-by-play table, is provided by Forbes (2018) in the NBA-API documentation. Each play-by-play table contains all the plays that occurred during a game, including shots, substitutions, turnovers, assists, rebounds, fouls, and more. We merge all play-by-play tables and process them to create the Clutch Shots Database described above. Obtaining the required data by processing play-by-play tables provides the flexibility of creating complex player properties. Also, it provides the ability to create in-game player properties, representing the players’ performance in the current game until the moment the shot was taken. Such properties are normally not available on external tables, which provide more accumulative data such as seasonal averages.
We split the Clutch Shots Database into three equally sized subsets: a train-set on which we train the lasso logistic regression, an inference-set on which we perform evaluation and comparison of policies, and finally a test-set on which we test the obtained ranking of policies. We term the second set as inference-set rather than validation-set as the latter is typically used in the context of hyper-parameter tuning, which is not the case here. Our decision is based on the trade-off between having more data available for training the regression model and having more data available for comparing different player-selection policies and assessing the obtained ranking performance on new data. Our primary goal is not necessarily to train the most accurate prediction model possible, as we show that even relatively simple models achieve a high success rate; we aim to perform accurate inference between policies and test it. Therefore, we allocate an equal number of samples to each set, ensuring that we have enough data to compare different player-selection policies and effectively evaluate the performance of our player ranking approach on new data. Alternative data division options are equally valid and likely to produce similar outcomes.
3.2Defining player-selection policies
At every given moment in a game, each player is characterized by a set of pre-game and in-game properties. A player-selection policy (policy) is defined as a set of guidelines for determining the preferred player to take the shot. Specifically, a policy receives as an input the current state - all the available players in the team and their properties - and provides the selection of a single player as an output. A policy can be based purely on pre-game properties, in-game properties, or a combination of both. By suggesting various policies and later evaluating and comparing them, we create a policy hierarchy.
First, we study player-selection policies based on a single property of each player. Such policies represent selecting a player based on a single property: for example, choosing the player who averages the highest PPG in his career. Another example is choosing the player who leads the team in rebounding in the current game.
Next, we introduce a policy based on a supervised learning model, considering multiple properties. We train a lasso logistic regression (Tibshirani, 1996) model for that purpose. The model’s features are the player properties describing each shot-taker while taking the shot, and the target is each shot’s outcome (i.e., 1 for a successful shot, 0 for a missed shot). Logistic regression is an explainable model that is easy to interpret; analyzing its coefficients may provide insights into the factors impacting clutch shots’ success. We use a lasso logistic regression over an unregularized logistic regression due to the large number of features, specifically 34 player properties. As future work might involve even more features, the lasso logistic regression is a suitable choice due to its ability to effectively zero out the coefficients of the least important features using regularization, which enhances the prediction’s accuracy, explainability and scalability. We utilize a classical 5-fold cross-validation to choose an optimal regularization parameter. The regression is trained on an independent subset of the data (train-set). We define a player-selection policy based on the regression’s predicted probability for each player to score.
Finally, we define a policy of randomly selecting a player to take the shot. While the policies described above are relatively simple, several policies achieve a high success rate, significantly greater than the overall clutch shots success rate. These results are discussed in the Analysis and Results Section. We emphasize that additional policies can be simply defined and considered within our framework.
3.3Policy comparison
For each player-selection policy, we examine shots taken according to the policy’s recommendation (i.e., the player who was selected by the policy is the player who took the shot). For example, for the ‘random selection’ policy, for each shot, an available player from the team is being randomly selected; if the selected player has in fact taken the shot, this shot would be included in the policy’s sample. Therefore, each policy is now paired with a set of shots containing successful and missed shots. The measure we use for the policies’ evaluation is the success proportion in the above set of shots associated with each policy, in an independent subset of the data, the inference-set.
Naturally, a policy hierarchy may be composed by ordering the policies in descending order of the success proportion of each policy. However, such ordering does not indicate whether this ranking is statistically significant. Therefore, we apply multiple hypothesis testing and compare each possible pair of policies, to determine which policies are better in a statistically significant manner.
The outcomes of different policies may be viewed as a binomial experiment, Bin (n, p), where n is the number of shots taken in accordance with the policy’s recommendation and p is the (unknown) success rate. To determine whether the difference in the success rates of two different policies is significant, we apply a variation of a t-test, as later discussed. We define H0 as p1 = p2 and H1 as p1 ≠ p2, where pi is the success rate of the ith policy. In other words, the null hypothesis suggests that there is no difference in the success rates while the alternative claims the opposite. Notice that a standard t-test is defined for either disjoint sets or paired values. In our case, two policies may have overlapping samples in cases where both consider the same player. For example, suppose the current shot-taker is the player with the highest average PPG and the most average assists. In that case, the shot would belong to both policies - average career PPG and average career assists. Therefore, we consider the method suggested by Derrick et al. (2015), which enables computing p-values for partially overlapping samples.
In order to create a complete hierarchy of the policies, we compare all possible pairs of policies, using the inference-set. We also compare each policy to the entire set of clutch shots in the inference-set, to identity the policies that are better than the overall success rate. Since we preform multiple comparisons simultaneously, we apply a Bonferroni correction (Miller, 1981) to account for multiplicity.
Based on the obtained p-values, we form a hierarchy of player-selection policies. The hierarchy ranks the policies in descending order of the success proportion, and the p-values determine the statistical significance difference between policies.
3.4Evaluation of the ranking approach
We evaluate the ranking approach on an independent subset of the data (test-set). First, as a benchmark, we consider all the clutch shots in the test-set: the clutch shots taken in reality. Then, we re-examine the test-set and extract only the shots that our scheme recommended. These are the shots that were taken in accordance with our recommendation: shots taken by the highest-ranked policies. Finally, we compute the p-value representing the significance of the difference between the above sets of shots.
Notice that this comparison may be somewhat biased. Specifically, if our recommendation only considers the best clutch players and does not account for all the remaining shots, then we may trivially attain improved performance. Therefore, to have a valid comparison, we consider not only the highest-ranked player but the k highest-ranked players. Specifically, we consider the success rate of when one of the top three ranked available players in the team took the shot. This solution introduces a more realistic scenario, in which a shot is taken by one out of k suggested players (and not just the single best player).
3.5Model analysis
An additional goal of this research is to provide managerial insights regarding the game of basketball. We focus on the question of which factors are more impactful to clutch shots’ success: pre-game factors or in-game factors. We study the importance of player properties to clutch shots success rates using three different approaches:
First, we study the policies which achieve a significantly greater success rate than the overall clutch shots success rate. By analyzing this group of ’successful’ properties and their common characteristics, we conclude which types of player properties are more impactful to clutch shots success rate.
Second, we analyze the lasso regression coefficients that are used to determine the importance of each player-property to clutch shots success. The policy based on the regression’s predicted probability of each player to score achieves a high success rate, and therefore such analysis is valuable.
Third, we train two separate lasso logistic regressions. The first regression’s features are purely pre-game player properties, and the second regression’s features are purely in-game player properties. We define two player-selection policies, each based on a different regression model, and compare their performance. This comparison simulates comparing a decision made purely on pre-game data vs. purely on in-game data.
4Analysis and results
In this section, we present the research results. We begin by describing the data preparation process. Then we list the considered policies, evaluate them, and present the 14 policies which achieved a high success rate and the obtained policy hierarchy. We also show an example of a real-time application of our ranking approach. Afterward, we present the testing process results of the suggested policy hierarchy. Finally, we study our models and provide managerial insights.
4.1Data preparation and preprocessing
For our analysis, we examine data from 25 NBA seasons spanning from 1995/96 to 2019/20. In total, there were 31,103 regular season and playoff games played during this period. Among these games, we focused on 15,146 games that were considered clutch, where the score margin was within five points in the final five minutes of the game. We extract each game’s data using the NBA-API (2021) provided by PyPI (2021), which allows access to the official NBA stats website (NBA Advanced Stats, n.d.). This data collection process enabled us to obtain information on 227,061 clutch shots taken throughout these games. For each shot we describe the shot-taker, at the moment the shot was taken, using 34 player properties, listed in Table 1.
Each player property is categorized as either a pre-game player property or an in-game player property. Many players have a little, if any, sample of clutch shots. To have a reliable sample, several clutch properties are collected using the entire 4th quarter or overtime, as described in Table 1 (instead of only the final five minutes). The constraint of score margin within five points is kept. Appendix A lists and describes in detail all the player properties we use in this study. Recall that we collect player properties for the shot-taker and all other teammates who were available when the shot was taken.
4.2Policies definition
For each player property in Table 1, we define a respective single-property policy, i.e., selecting the player having the best value in this property. For example, the policy based on the player property in-game points is to choose the player with the highest amount of points in the current game. In cases where several players are tied for the lead, the policy randomly selects one of the tied leading players. Further, we define a policy based on a lasso logistic regression model. The regression model we use was created by Pedregosa et al. (2011).
Naturally, when ranking the players in the team, it is not obvious that only the best performing players (under any policy) should be selected to take the clutch shots. In other words, perhaps the second-best points scorer should be chosen before the best rebounder. Therefore, for each policy described above (single-property policy or regression based), we further define two more complementary policies: A policy defined by selecting the player who is the second choice of the respective policy (for example, the player with the second-most points in the current game) and a policy defined by selecting the third player.
Overall, for the lasso logistic regression and each of the 34 single property policies we define three separate policies for the first, second and thirdly ranked players, resulting with a total of 105 policies. In addition, we examine a random selection policy.
4.3Policies evaluation
We evaluate the policies using the inference-set, consisting of 75,687 shots. In this subset, the overall clutch shots success rate is 41.37%, 31, 314 successful shots out of 75, 687 in total. Table 2 exemplifies the evaluation of the policy 1st player in-game points. This policy selects the player who scored the most points in the currently analyzed game to take the clutch shot.
Table 2
Evaluation of the Policy ‘1st Player In-Game Points’
| Successful shot | Missed shot | |
| The player selected by the policy took the shot | 8,343 | 12,075 |
| Different player took the shot | 22,971 | 32,298 |
Policy’s success rate:
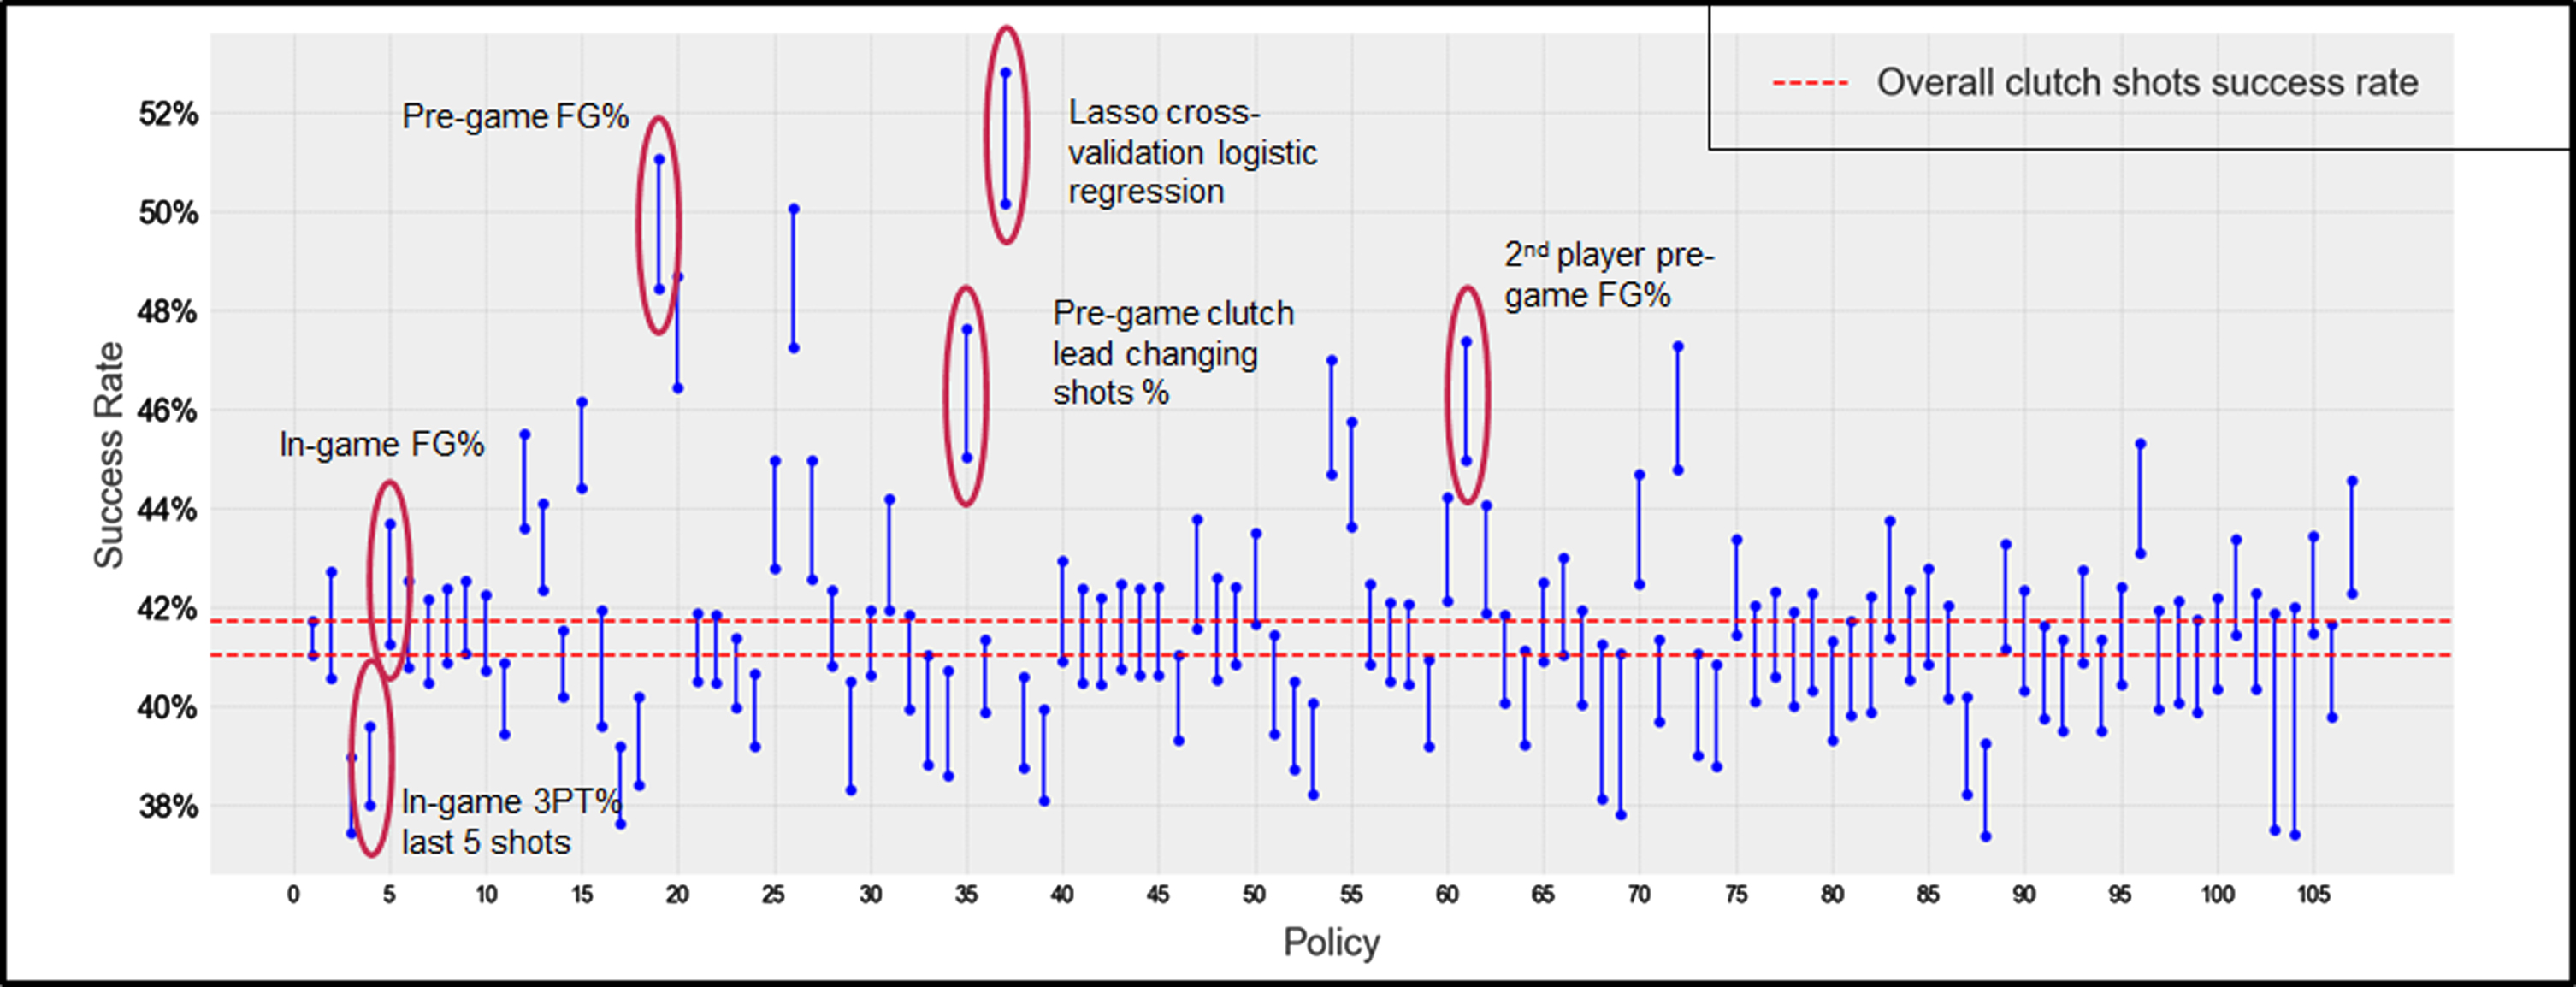
Figure 2 shows the binomial confidence intervals of success rates of different policies in the inference-set. The x-axis represents the serial number of each policy, and a Wald 95% confidence interval for each policy’s success rate is evaluated. The red dashed line represents the binomial confidence interval for the overall clutch shots success rate in the inference-set. This figure demonstrates that while most player-selection policies achieve a success rate similar to the overall clutch shots success rate, certain policies achieve a greater success rate. The success rates of all 106 policies, as well as their usage rates (percentage of total shots), are presented in Appendix B.
Fig. 2
Binomial confidence intervals of estimated success rates of the considered policies.
We apply multiple hypothesis testing and compare each possible pair of policies to rank the policies and create a policy hierarchy. Further, we compare the set of shots paired with each policy to the entire set of shots in the inference-set to determine which policies achieve better results than the overall clutch shots success rate in a statistically significant manner. We compare 107 sets of shots (one set of shots for each policy of the 106 policies and one representing the overall success rate), hence we perform a total of
Table 3
The 14 Policies with Significantly Greater Success Rate Than the Overall Clutch Shots Success Rate
| Ranking | Considered policy | Success rate | P-value when compared to set of entire clutch shots | Significantly better than | Usage rate |
| 1 | Lasso logistic regression | 54.49% | 1.11E-55 | #4 and below | 7.17% |
| 2 | Pre-game FG% | 49.76% | 2.39E-53 | #5 and below | 7.47% |
| 3 | Pre-game Q4∖OT if score margin≤5 FG% | 48.66% | 1.30E-40 | #9 and below | 6.52% |
| 4 | Pre-game FG% last 100 shots | 47.57% | 3.22E-27 | #11 and below | 10.02% |
| 5 | Pre-game lead changing clutch shots % | 46.34% | 1.27E-41 | Overall success rate | 7.38% |
| 6 | 2nd player pre-game Q4∖OT if score margin ≤5 FG% | 46.18% | 4.32E-31 | Overall success rate | 8.67% |
| 7 | 2nd player lasso Logistic Regression | 46.04% | 2.65E-15 | Overall success rate | 8.06% |
| 8 | 2nd player pre-game FG% | 45.85% | 6.99E-17 | Overall success rate | 9.50% |
| 9 | In-game rebounds | 45.29% | 5.99E-15 | Overall success rate | 16.45% |
| 10 | 2nd player pre-game FG% last 100 shots | 44.69% | 3.06E-16 | Overall success rate | 11.21% |
| 11 | In-game blocks | 44.56% | 1.46E-22 | Overall success rate | 13.78% |
| 12 | 3rd player pre-game Q4∖OT if score margin≤5 FG% | 44.22% | 2.50E-11 | Overall success rate | 10.18% |
| 13 | Pre-game Q4∖OT true shooting % | 43.89% | 5.80E-13 | Overall success rate | 10.41% |
| 14 | In-game fouls drawn | 43.23% | 4.51E-08 | Overall success rate | 16.53% |
| All clutch shots | 41.37% | – | – | 100.00% |
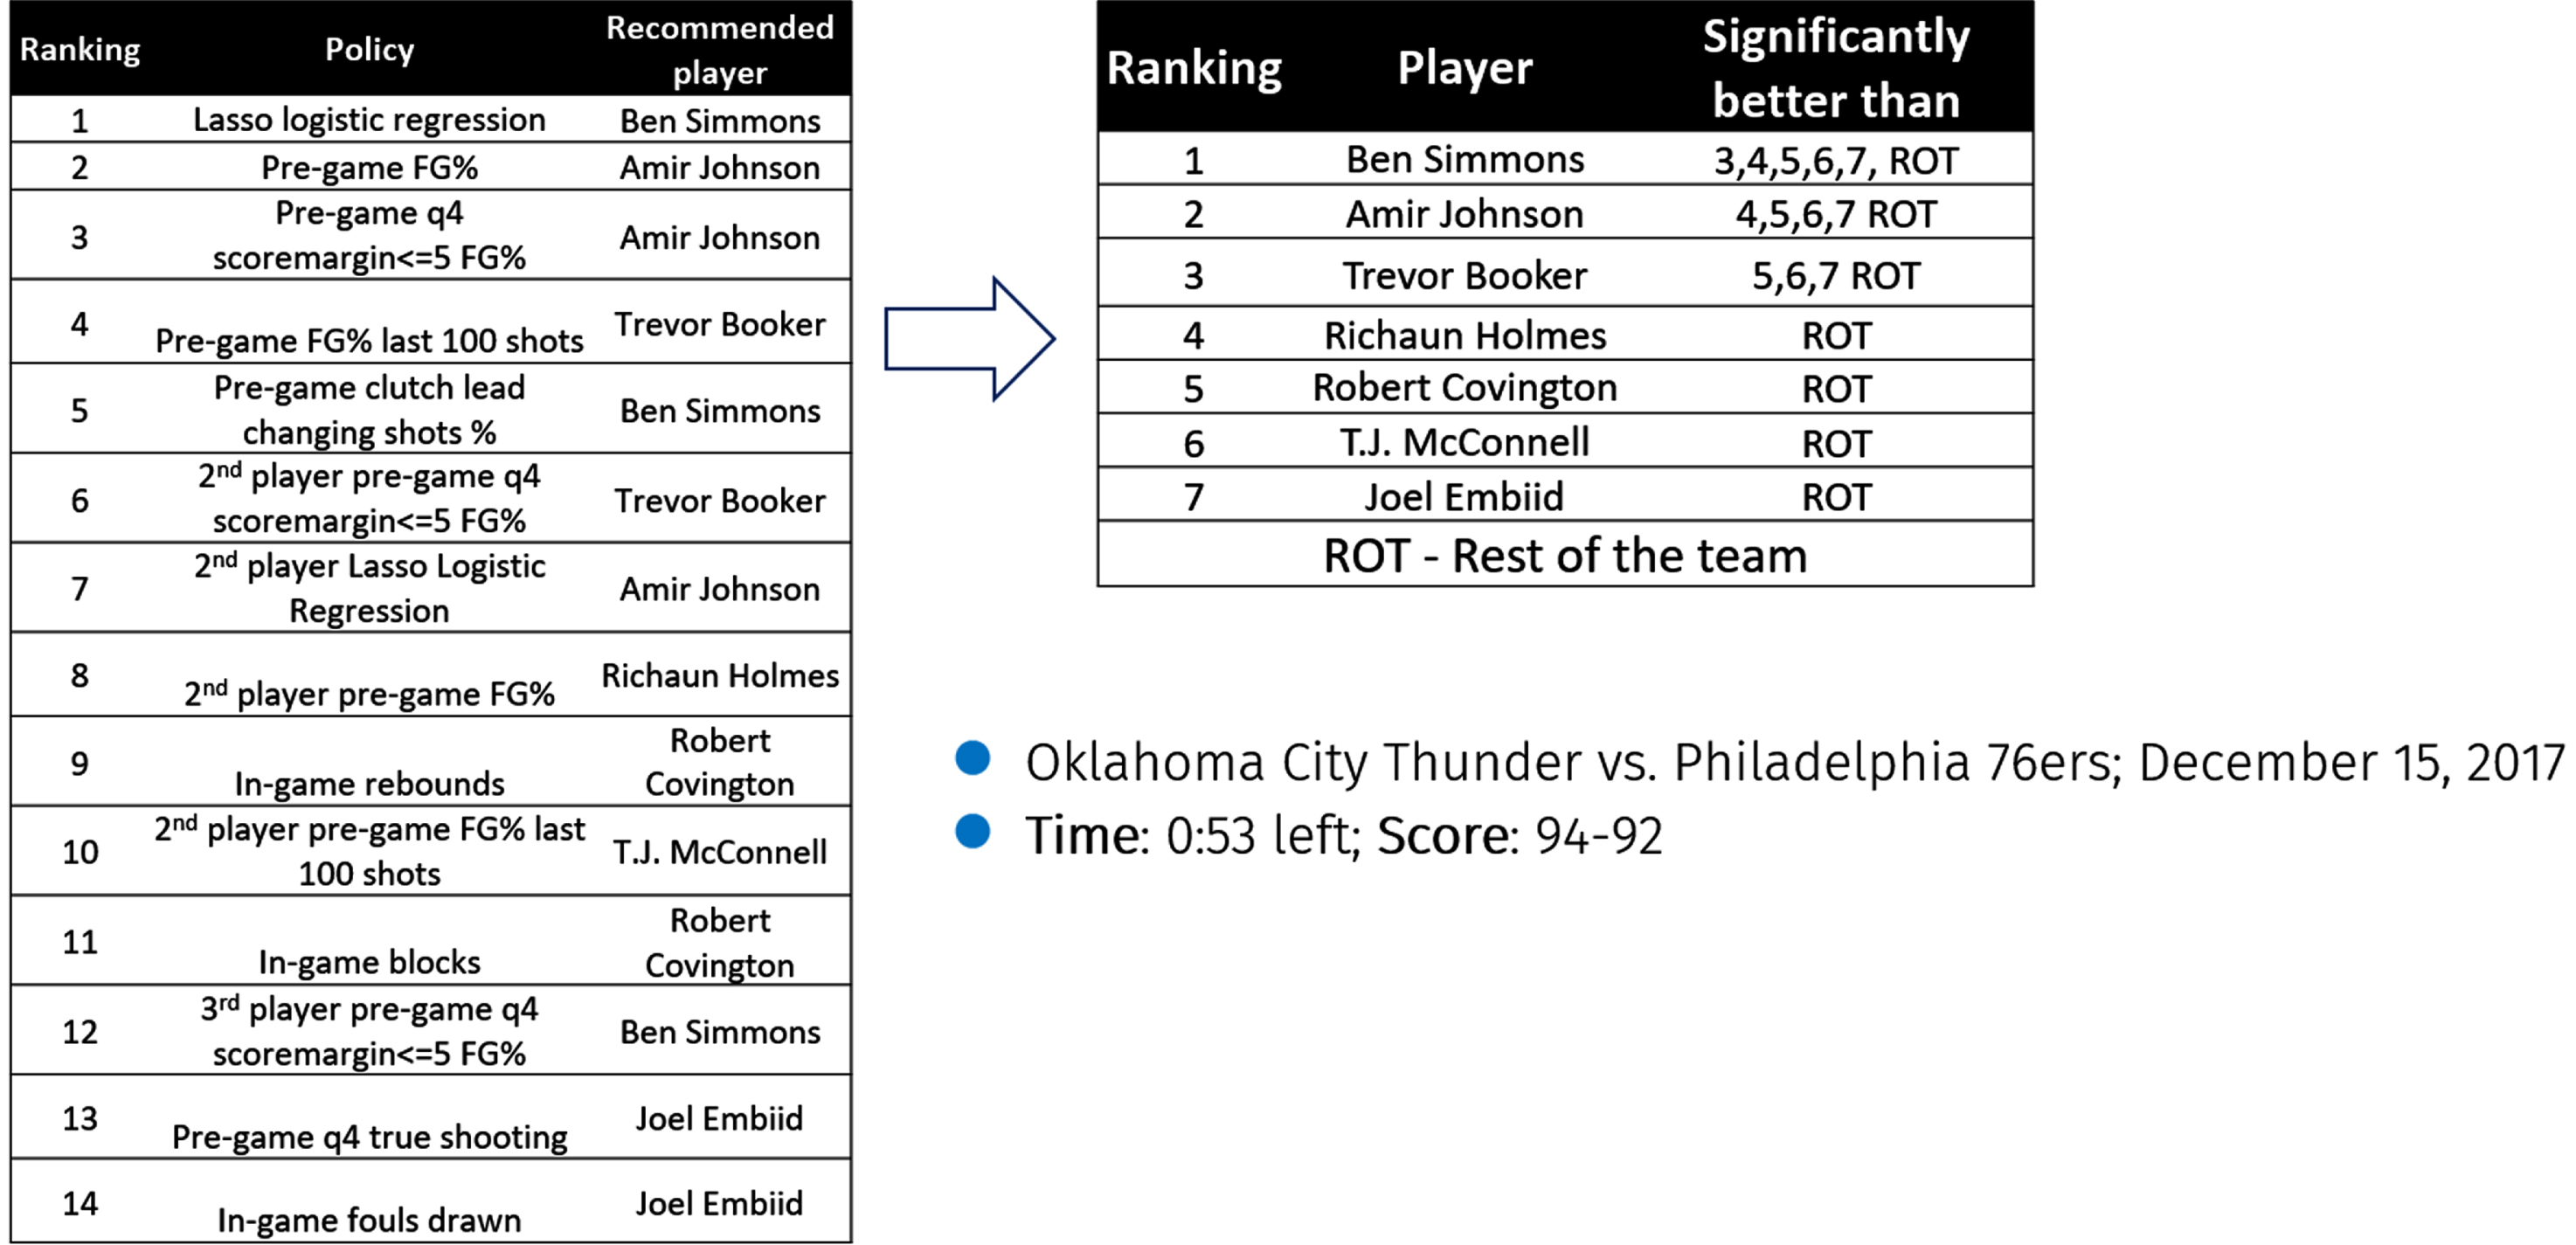
Our real-time ranking of players is composed of the players selected by each policy in Table 3, sorted by each policy’s success rate in the inference-set. Figure 3 demonstrates an example of real-time players ranking from 2017/18 regular season: The Philadelphia 76ers were playing against Oklahoma-City Thunder and were in possession of the ball with 53 seconds left to play in the game, while the opponent led 94 –92. The top ranked player by our proposed hierarchy is Ben Simmons. He was also the player who took the shot in practice, and indeed he scored.
Fig. 3
Example of real-time players ranking from 2017, Philadelphia 76ers.
4.4Evaluation of the ranking approach
We evaluate the proposed ranking approach on an independent subset of the data, i.e., the test-set, consisting of 75,687 clutch shots. The overall success rate in this dataset is 41.23%. We evaluate the success rates when one of the top k ranked players (by our obtained policy hierarchy) takes the shot, for k = 1, 2, 3. The results are presented in Table 4. All considered cases achieve a significantly greater success rate than the overall rate in the test-set.
Table 4
Results of testing of the ranking approach
| Shot-taker | Success rate | P-value compared to overall clutch shots success rate | Percentage of total shots |
| Highest ranked single player | 52.09% | 1.46E-63 | 7.15% |
| Highest ranked two players | 47.79% | 5.08E-55 | 15.39% |
| Highest ranked three players | 45.85% | 3.12E-52 | 25.83% |
| Overall clutch shots | 41.23% | – | 100.00% |
4.5Model analysis
We now study our models and provide managerial conclusions based on our findings. First, as presented in Table 3, 14 player-selection policies achieve a significantly greater success rates than the overall clutch shots rate. While two of these policies are based on the lasso logistic regression, 12 are single-property policies. Out of these 12 policies, nine are based on purely pre-game player properties, while only three are based on in-game player properties. Interestingly, the in-game player properties are in-game blocks, in-game rebounds and in-game fouls drawn, and are not based on the current game shooting performance. This analysis suggests that pre-game shooting performance is a better indicator for successful clutch shooting than in-game shooting performance. In-game aspects such as blocks, rebounds and fouls drawn may indicate a player’s level of focus and dominance in the current game or perhaps physical supremacy in the match-up against their defender.
Let us now study the logistic regression coefficients. The model is trained to predict clutch shots’ success probability, and the magnitude of coefficients assigned by the model to each feature may indicate its importance to clutch shots’ success. The model’s coefficients are presented in Table 5. This analysis further validates the conclusion that pre-game shooting performance is the best indicator for clutch shots success, as the feature with the most considerable coefficient magnitude is pre-game FG%. Other features have a relatively minor effect.
Table 5
Coefficients of the lasso logistic regression
| Player property | Coefficient value |
| Pre-game FG% | 0.44 |
| Pre-game FG% last 100 shots | 0.09 |
| Pre-game Q4 OT if score margin ≤5 FG% | 0.04 |
| Pre-game clutch lead changing clutch shots % | 0.04 |
| In-game rebounds | 0.02 |
| Pre-game previous two months true shooting % | 0.01 |
| Pre-game total games | 0.01 |
| Pre-game playoff Q4∖OT if score margin≤5 FG% | 0 |
| In-game FG% | 0 |
| In-game 3PM | 0 |
| In-game FG% last five shots | 0 |
| In-game FT% | 0 |
| In-game FTM | 0 |
| In-game turnovers | 0 |
| In-game blocks | 0 |
| In-game fouls drawn | 0 |
| In-game true shooting % | 0 |
| Pre-game 3PM per game | 0 |
| Pre-game FGM per game | 0 |
| Pre-game PPG | 0 |
| Pre-game turnovers per game | 0 |
| Pre-game assists per game | 0 |
| Pre-game Q4∖OT true shooting % | 0 |
| Pre-game playoff Q4∖OT if score margin ≤5 PPG | 0 |
| Pre-game previous two months Q4∖OT FT% | 0 |
| Pre-game previous two months PPG | 0 |
| In-game total lead changing clutch shots made | 0 |
| Pre-game total lead changing clutch shots made | 0 |
| In-game FT% last five shots | 0 |
| In-game assists | 0 |
| In-game clutch lead changing clutch shots % | –0.01 |
| In-game points | –0.01 |
| In-game 3PT% last five shots | –0.03 |
| Pre-game 3PT% last 100 shots | –0.05 |
Moreover, we train a pure pre-game and a pure in-game regression models. We define two policies: selecting the player with the highest predicted probability to score by each of the above prediction models. We evaluate each policy on the inference-set and perform a t-test to determine which policy is superior. The results are presented in Table 6, which shows that the pure pre-game lasso logistic regression achieves a significantly greater success rate than the pure in-game model.
Table 6
Comparison between a policy based on purely pre-game features vs. A policy based on purely in-game features
| Considered policy | Success rate | Percentage of total shots |
| Pure pre-game lasso logistic regression | 51.25% | 7.20% |
| Pure in-game lasso logistic regression | 48.50% | 10.29% |
| Overall success rate | 41.37% | 100.00% |
P-value of comparison between the models: 2.33E-05.
In addition to the above three analyses, we also use the described framework to perform ranking of players while distinguishing between two-point shots and three-point shots. We implement the strategy described in the Methods Section separately for the two disjoint sets of two-point shots and three-point shots in the Clutch Shots Database, resulting in a separate player ranking for each range. This may provide more detailed information for the coach to make informed decisions about player selection for different types of shots. In the analyzed sample, 71.77% of the shots are two-point shots and 28.23% are three-point shots. Our analysis shows that implementing our player selection strategy results in a significant increase in success rates for both two-point and three-point shots. Specifically, the success rate for two-point shots increases from 45.1% to 53.2%, while the success rate for three-point shots increases from 31.8% to 33.5%. Furthermore, we show that even when not the highest-ranked player shoots, but one of the top two or top three players are shooting, the difference is still significant. The results of our analysis, including the best policy for each range, are presented in Table 7. For two-point shots, the best policy is choosing the shooter according to a lasso logistic regression (trained separately on two-point shots), in which the feature with the largest coefficient is ‘Pre-game FG% ’. For three-point shots, the best policy is choosing the player with the highest Pre-game 3PT% in the previous 100 shots preceding the analyzed game.
Table 7
Results of Applying the Analysis Strategy Separately for Two-Point Shots and for Three-Point Shots
| Range | Overall success sate | Highest ranked player success rate (p-value) | Top two players success rate (p-value) | Top three players success rate (p-value) | Highest success rate policy |
| Two-point shots | 45.10% | 53.19% (1.19E-33) | 48.60% (1.39E-16) | 47.03% (1.50E-09) | Lasso logistic regression |
| Three-point shots | 31.85% | 33.51% (0.0027) | 32.87% (0.0095) | 32.65% (0.0126) | Pre-game 3PT% last 100 shots |
The lasso logistic regression for each set of shots was trained separately, using only shots from the respective range. The p-value represents the comparison between each set of shots to the overall clutch shots success rate for the respective range.
All four analyses described above indicate that while several aspects of in-game player performance are indicative of clutch shots success, the pre-game performance is favorable. Specifically, pre-game shooting performance is the most impactful factor to clutch shots success.
5Discussion
Decision-making in clutch time, specifically player-selection, is considered critical for winning a close basketball game. In this paper, we study the question of player-selection for clutch shots in basketball using NBA data. We define 106 player-selection policies, evaluate and rank them to create a policy hierarchy that serves as a player-ranking approach. We evaluate the proposed ranking approach and show that when one of the top three ranked players is selected to shoot, the success rate is significantly greater than the overall success rate. Further, we analyze the models we used to find which player properties indicate clutch shots’ success; we conclude that pre-game field-goal shooting percentage is the most indicative factor.
Numerous studies have examined whether the clutch players or hot players phenomena exist and achieved contradictory conclusions. Our research does not focus on whether each phenomenon is real or not; instead, we compare player-selection policies for clutch shots, based on the above phenomena and additional factors. We show that policies based on the clutch players achieve a high success rate, significantly greater than the overall success rate. Therefore, we conclude that pre-game clutch shots success is indicative of future success rate. Contrarily, policies based on the hot players do not achieve a significantly greater success rate than the rate. Therefore, we conclude that this phenomenon is not necessarily indicative for clutch shots success. This conclusion is in line with the observation made by Zuccolotto et al. (2018), who found a negative correlation in high-pressure game situations between success in previous field goal attempts and success in the next attempt.
Our method not only provides the selection of a single player to take the shot, but also ranks the players in the team by their estimated probabilities of scoring a clutch shot in the given moment. While out-of-scope factors (such as tiredness, tight defense, and more) may affect the coach’s decision regarding specific players, having the information on the order of the players by their estimated current probabilities allows making an informed decision.
We show that relatively simple policies, such as single property policies and policies based on regression models, introduce favorable performance. Our framework is scalable, in the sense the lasso regression is capable of handling a large number of features and effectively zeroing out coefficients associated with specific features. This opens realms of opportunities, and future work consisting of our framework, examining policies based on other models or using more features, may achieve even greater success rates. Furthermore, we implement the described strategy separately for two-point shots and for three-point shots, which results in a player ranking for each range. This analysis provides more information for the coach.
While our study examines both pre-game and in-game player properties to identify the players most likely to score clutch shots, we find that pre-game player properties have a greater impact on the success rate of clutch shots. Specifically, we show that a model based purely on pre-game player properties would still significantly improve the overall clutch shots success rate. However, our analysis shows that combining both pre-game and in-game player properties results in even greater improvement in the success rate. Therefore, we suggest using both types of player properties, resulting in a real-time ranking. We believe that as the sports world becomes more innovative, performing such analysis in real-time is feasible, for example, by an analyst or an assistant coach using a tablet. Additionally, it is important to note that we do not need to train a regression model in real-time, but only to use its coefficients to calculate an output. In cases where performing such an analysis in real-time is not applicable, a pre-game player ranking can be used and still improve the overall clutch shots success rate.
The conclusions we deliver in this research may be used by team managers in the process of player selection and roster assembly. It is important to note that our data is based on the NBA and our conclusions regarding the player properties that are impactful to clutch shots apply specifically to the NBA. However, the same framework could be easily applied to other basketball leagues, resulting in a similar analysis and different conclusions regarding the importance or different player properties. Moreover, the suggested framework may be further generalized and used in other research domains: defining policies, evaluating them using an independent subset of the data, and testing the obtained policy hierarchy using another subset of the data, may be applied in any field which involves making repeated decisions of selection between alternatives.
References
1 | Arboretti, R. , Bonnini, S. , Corain, L. , & Salmaso, L. , (2014) A permutation approach for ranking of multivariate populations. Journal of Multivariate Analysis, 132: , 39–57. |
2 | Basketball Reference. 2021. NBA contracts summary, sports reference llc basketball-reference.com - basketball statistics and history. [Accessed May 2, 2021]. https://www.basketballreference.com/contracts/ |
3 | Berger, J. and Pope, D. , (2011) Can losing lead to winning?. Management Science, 57: (5), 817–827. |
4 | Bocskocsky, A. , Ezekowitz, J. , & Stein, C. 2014. The hot hand: A new approach to an old ‘fallacy’. In 8th Annual MIT Sloan Sports Analytics Conference (pp. 1-10). |
5 | Cao, Z. , Price, J. , & Stone, D. F. , (2011) . Performance under pressure in the NBA. Journal of Sports Economics, 12: (3), 231–252. |
6 | Christmann, J. , Akamphuber, M. , Müllenbach, A. L. , & Güllich, A. , (2018) . Crunch time in the NBA-the effectiveness of different play types in the endgame of close matches in professional basketball. International Journal of Sports Science & Coaching, 13: (6), 1090–1099. |
7 | Corain, L. , Arboretti, R. , Ceccato, R. , Ronchi, F. , & Salmaso, L. , (2019) . Testing and ranking on round-robin design for data sport analytics with application to basketball. Statistical Modelling, 19: (1), 5–27. |
8 | Corain, L. , Arboretti, R. , & Bonnini, S. 2017. Ranking of multivariate populations: A permutation approach with applications. CRC Press. |
9 | Derrick, B. , Dobson-Mckittrick, A. , Toher, D. , & White, P. , (2015) . Test statistics for comparing two proportions with partially overlapping samples. Journal of Applied Quantitative Methods, 10: (3). |
10 | Forbes, R. 2018. Working With Play by Play [Accessed March 23, 2023]. Available at: https://github.com/swar/nba_api/blob/master/docs/examples/PlayByPlay.ipynb |
11 | Gilovich, T. , Vallone, R. , & Tversky, A. , (1985) . The hot hand in basketball: On the misperception of random sequences. Cognitive Psychology, 17: (3), 295–314. |
12 | Gómez, M. Á. , Avugos, S. , Oñoro, M. Á. , Lorenzo, A. , & Bar-Eli, M. , (2018) . Shaq is not alone: Free-throws in the final moments of a basketball game. Journal of Human Kinetics, 62: (1), 135–144. |
13 | Klein Teeselink, B. , van den Assem, M. J. , & van Dolder, D. , (2023) . Does losing Lead to winning? An empirical analysis for four sports. Management Science, 69: (1), 513–532. |
14 | Maher, R. , Marchant, D. , Morris, T. , & Fazel, F. , (2020) . Managing pressure at the free-throw line: Perceptions of elite basketball players. International Journal of Sport and Exercise Psychology, 18: (4), 420–436. |
15 | Martin, B. , 2022. Inside the box score: 2022 NBA finals, game 4 [Accessed August 28, 2022]. Retrieved September 12, 2007, from https://www.nba.com/news/inside-the-box-score-2022-nba-finals-game-4 |
16 | Metulini, R. , & Le Carre, M. , (2020) . Measuring sport performances under pressure by classification trees with application to basketball shooting. Journal of Applied Statistics, 47: (12), 2120–2135. |
17 | Miller, R. G. , & Miller, R. G. , 1981. Normal univariate techniques. Simultaneous Statistical Inference, pp. 37-108. |
18 | Moxley, J. H. , & Towne, T. J. , (2015) . Predicting success in the national basketball association: Stability & potential. Psychology of Sport and Exercise, 16: , 128–136. |
19 | NBA Advanced Stats. (n.d.). Stats.nba.com [Accessed August 26, 2021]. Available at: https://stats.nba.com |
20 | NBA-API. 2021. An API client package to access the APIs for nba.com [Accessed August 26, 2021]. Available at: https://pypi.org/project/nba-api/ |
21 | Pedregosa, F. , Varoquaux, G. , Gramfort, A. , Michel, V. , Thirion, B. , Grisel, O. , Blondel, M. , Prettenhofer, P. , Weiss, R. , Dubourg, V. , Vanderplas, J. , Passos, A. , Cournapeau, D. , Brucher, M. , Perrot, M. , & Duchesnay, E. , (2011) . Scikit-learn: Machine learning in Python. Journal of Machine Learning Research, 12: , 2825–2830. |
22 | Pelton, K. , 2007. Statistical analysis primer [Accessed August 24, 2022]. [Accessed September 12, 2007]. Available at: https://www.nba.com/thunder/news/stats101.html |
23 | PyPI. 2021. Python package index - pypi [Accessed August 26, 2021]. Retrieved March 28, 2021, from https://pypi.org/ |
24 | Sigler, K. , (2020) . Are NBA players paid to perform in the clutch? The Sport Journal, 23: (9). |
25 | Skinner, B. , (2012) . The problem of shot selection in basketball. PloS One, 7: (1), e30776. |
26 | Skinner, B. , & Guy, S. J. , (2015) . A method for using player tracking data in basketball to learn player skills and predict team performance. PloS One, 10: (9), e0136393. |
27 | Solomonov, Y. , Avugos, S. , & Bar-Eli, M. , (2015) . Do clutch players win the game? testing the validity of the clutch player’s reputation in basketball. Psychology of Sport and Exercise, 16: , 130–138. |
28 | Tibshirani, R. , (1996) . Regression shrinkage and selection via the lasso. Journal of the Royal Statistical Society: Series B (Methodological), 58: (1), 267–288. |
29 | Yaari, G. , & Eisenmann, S. , (2011) . The hot (invisible?) hand: Can time sequence patterns of success/failure in sports be modeled as repeated random independent trials? PloS One, 6: (10), e24532. |
30 | Zuccolotto, P. , Manisera, M. , & Sandri, M. , (2018) . Big data analytics for modeling scoring probability in basketball: The effect of shooting under high-pressure conditions. International Journal of Sports Science & Coaching, 13: (4), 569–589. |
Appendices
Appendix A –Description of the Player Properties
All pre-game properties refer to games played before and not-including the current game in which the respective shot was taken. All in-game properties refer to plays within the current game (in which the respective shot was taken), before and not-including the respective shot.
Table A1
Description of the considered player properties
| # | Player property | Description |
| 1 | Pre-game 3PM per game | Average (per game) of three-point shots made (successfully) |
| 2 | Pre-game 3PT% last 100 shots | Three-point shots success rate in the preceding 100 three-point shots taken |
| 3 | Pre-game FG% | Field-goal shots success rate |
| 4 | Pre-game FG% last 100 shots | Field-goal shots success rate in the preceding 100 field-goal shots taken |
| 5 | Pre-game FG made per game | Average (per game) of field-goal shots made (successfully) |
| 6 | Pre-game points per game (PPG) | Average (per game) points scored |
| 7 | Pre-game turnovers per game | Average (per game) turnovers |
| 8 | Pre-game assists per game | Average (per game) assists |
| 9 | Pre-game lead changing clutch shots % | Field-goal success rate in clutch (less than or equal to five minutes left, score margin within five points), when the score is tied or down one point or down two points, or down three points and shooting a three-point shot |
| 10 | Pre-game past 2 months Q4∖OT FT% | Free-throws success rate in free-throws in the fourth quarter or overtime, in the preceding two months |
| 11 | Pre-game past 2 months PPG | Average (per game) points scored per game, in the preceding two months |
| 12 | Pre-game past 2 months true shooting % | A true shooting measure (formula above) considering the previous two months |
| 13 | Pre-game playoff Q4∖OT if score margin≤5 FG% | Field-goal percentage in playoff games, in the fourth quarter or overtime, when less or equal to 5 points score margin |
| 14 | Pre-game playoff Q4∖OT if score margin< =PPG | Average (per game) points score in the playoff games, in the fourth quarter or overtime, when less or equal to 5 points score margin |
| 15 | Pre-game Q4∖OT if score margin ≤5 FG% | Field-goal percentage in the fourth quarter or overtime, when less or equal to 5 points score margin |
| 16 | Pre-game Q4∖OT true shooting % | A true shooting measure (formula above) in the fourth quarter or overtime |
| 17 | Pre-game total lead changing clutch shots made | Total successful field-goal shots in clutch (less than or equal to five minutes left, less than or equal to 5 points score margin), when the score is tied or down one point or down two points, or down three points and shooting a three-point shot |
| 18 | Pre-game total games played in career | Number of different games the player has played in |
| 19 | In-game 3PM | Total three-point shots made (successfully) in the game |
| 20 | In-game 3PT% last five shots | Three-point shots success rate in the preceding five shots |
| 21 | In-game FG% | Field-goal shots success rate |
| 22 | In-game FG% last five shots | Field-goal shots success rate in the preceding five shots |
| 23 | In-game FT% | Free-throw shots success rate |
| 24 | In-game FT% last five shots | Free-throw shots success rate in the preceding five shots |
| 25 | In-game FTM | Total Free-throw shots made (successfully) |
| 26 | In-game Turnovers | Total turnovers |
| 27 | In-game assists | Total assists |
| 28 | In-game blocks | Total shots blocked |
| 29 | In-game clutch lead changing clutch shots % | Field-goal success rate in clutch (less than or equal to five minutes left, score margin within five points), when the score is tied or down one point or down two points, or down three points and shooting a three-point shot |
| 30 | In-game fouls drawn | Total fouls drawn |
| 31 | In-game points | Total points scored |
| 32 | In-game rebounds | Total rebounds retrieved |
| 33 | In-game total lead changing clutch shots made | Total successful field-goal shots in clutch (less than or equal to five minutes left, less than or equal to 5 points score margin), when the score is tied or down one point or down two points, or down three points and shooting a three-point shot |
| 34 | In-game true shooting % | A true shooting measure (formula above) |
True shooting percentage is calculated by:
Appendices
Appendix B –Description of player properties
The first row describes the overall clutch shots success rate in the inference dataset. The columns correspond to the respective policy’s serial number, name, the absolute number of successful shots and attempts, the usage rate (percentage out of total shots) and the success rate.
Table B1
Results of all examined policies
| # | Considered policy | Successful shots | Usage rate | Success rate |
| 1 | All shots | 31,314 ∖ 75,687 | 100.00% | 41.37% |
| 2 | Random | 3,289 ∖ 7,899 | 10.44% | 41.64% |
| 3 | 1st player In-game 3PM | 5,816 ∖ 15,222 | 20.11% | 38.21% |
| 4 | 1st player In-game 3PT% last five shots | 5,726 ∖ 14,758 | 19.50% | 38.80% |
| 5 | 1st player In-game FG% | 2,670 ∖ 6,285 | 8.30% | 42.48% |
| 6 | 1st player In-game FG% last five shots | 5,067 ∖ 12,159 | 16.06% | 41.67% |
| 7 | 1st player In-game FT% | 5,424 ∖ 13,124 | 17.34% | 41.33% |
| 8 | 1st player In-game FT% last five shots | 6,944 ∖ 16,677 | 22.03% | 41.64% |
| 9 | 1st player In-game FTM | 7,276 ∖ 17,402 | 22.99% | 41.81% |
| 10 | 1st player In-game turnovers | 6,704 ∖ 16,156 | 21.35% | 41.50% |
| 11 | 1st player In-game assists | 7,089 ∖ 17,653 | 23.32% | 40.16% |
| 12 | 1st player In-game blocks | 4,649 ∖ 10,433 | 13.78% | 44.56% |
| 13 | 1st player In-game fouls drawn | 5,408 ∖ 12,511 | 16.53% | 43.23% |
| 14 | 1st player In-game points | 8,343 ∖ 20,418 | 26.98% | 40.86% |
| 15 | 1st player In-game rebounds | 5,641 ∖ 12,454 | 16.45% | 45.29% |
| 16 | 1st player In-game true shooting % | 2,751 ∖ 6,746 | 8.91% | 40.78% |
| 17 | 1st player Pre-game 3PM per game | 5,624 ∖ 14,642 | 19.35% | 38.41% |
| 18 | 1st player Pre-game 3PT% last 100 shots | 4,477 ∖ 11,393 | 15.05% | 39.30% |
| 19 | 1st player Pre-game FG% | 2,815 ∖ 5,657 | 7.47% | 49.76% |
| 20 | 1st player Pre-game FG% last 100 shots | 3,608 ∖ 7,584 | 10.02% | 47.57% |
| 21 | 1st player Pre-game FGM per game | 8,063 ∖ 19,569 | 25.86% | 41.20% |
| 22 | 1st player Pre-game PPG | 8,289 ∖ 20,139 | 26.61% | 41.16% |
| 23 | 1st player Pre-game turnovers per game | 7,505 ∖ 18,453 | 24.38% | 40.67% |
| 24 | 1st player Pre-game assists per game | 6,764 ∖ 16,942 | 22.38% | 39.92% |
| 25 | 1st player Pre-game Q4∖OT true shooting % | 3,459 ∖ 7,881 | 10.41% | 43.89% |
| 26 | 1st player Pre-game Q4∖OT if score margin ⩽5 FG% | 2,403 ∖ 4,938 | 6.52% | 48.66% |
| 27 | 1st player Pre-game playoff Q4∖OT if score margin ⩽5 FG% | 2,864 ∖ 6,542 | 8.64% | 43.78% |
| 28 | 1st player Pre-game playoff Q4∖OT if score margin < =PPG | 6,488 ∖ 15,603 | 20.62% | 41.58% |
| 29 | 1st player Pre-game previous two months Q4∖OT FT% | 3,048 ∖ 7,735 | 10.22% | 39.41% |
| 30 | 1st player Pre-game previous two months PPG | 8,880 ∖ 21,504 | 28.41% | 41.29% |
| 31 | 1st player Pre-game previous two months true shooting % | 3,136 ∖ 7,282 | 9.62% | 43.07% |
| 32 | 1st player Pre-game total games | 4,157 ∖ 10,164 | 13.43% | 40.90% |
| 33 | 1st player In-game clutch lead changing clutch shots % | 2,935 ∖ 7,351 | 9.71% | 39.93% |
| 34 | 1st player In-game total lead changing clutch shots made | 3,180 ∖ 8,017 | 10.59% | 39.67% |
| 35 | 1st player Pre-game clutch lead changing clutch shots % | 2,588 ∖ 5,585 | 7.38% | 46.34% |
| 36 | 1st player Pre-game total lead changing clutch shots made | 6,960 ∖ 17,140 | 22.65% | 40.61% |
| 37 | 1st player lasso logistic regression | 2,795 ∖ 5,428 | 7.17% | 51.49% |
| 38 | 2nd player in-game 3PM | 4,268 ∖ 10,760 | 14.22% | 39.67% |
| 39 | 2nd player in-game 3PT% last five shots | 4,192 ∖ 10,742 | 14.19% | 39.02% |
| 40 | 2nd player in-game FG% | 3,783 ∖ 9,026 | 11.93% | 41.91% |
| 41 | 2nd player in-game FG% last five shots | 4,178 ∖ 10,086 | 13.33% | 41.42% |
| 42 | 2nd player in-game FT% | 5,050 ∖ 12,225 | 16.15% | 41.31% |
| 43 | 2nd player in-game FT% last five shots | 5,297 ∖ 12,727 | 16.82% | 41.62% |
| 44 | 2nd player in-game FTM | 5,089 ∖ 12,261 | 16.20% | 41.51% |
| 45 | 2nd player in-game turnovers | 4,725 ∖ 11,380 | 15.04% | 41.52% |
| 46 | 2nd player in-game assists | 5,044 ∖ 12,554 | 16.59% | 40.18% |
| 47 | 2nd player in-game blocks | 3,273 ∖ 7,670 | 10.13% | 42.67% |
| 48 | 2nd player in-game fouls drawn | 3,631 ∖ 8,735 | 11.54% | 41.57% |
| 49 | 2nd player in-game points | 6,317 ∖ 15,170 | 20.04% | 41.64% |
| 50 | 2nd player in-game rebounds | 4,668 ∖ 10,959 | 14.48% | 42.60% |
| 51 | 2nd player in-game true shooting % | 3,783 ∖ 9,356 | 12.36% | 40.43% |
| 52 | 2nd player pre-game 3PM per game | 4,642 ∖ 11,716 | 15.48% | 39.62% |
| 53 | 2nd player pre-game 3PT% last 100 shots | 4,147 ∖ 10,597 | 14.00% | 39.13% |
| 54 | 2nd player pre-game FG% | 3,296 ∖ 7,189 | 9.50% | 45.85% |
| 55 | 2nd player pre-game FG% last 100 shots | 3,793 ∖ 8,488 | 11.21% | 44.69% |
| 56 | 2nd player pre-game FGM per game | 6,047 ∖ 14,515 | 19.18% | 41.66% |
| 57 | 2nd player pre-game PPG | 5,885 ∖ 14,248 | 18.82% | 41.30% |
| 58 | 2nd player pre-game turnovers per game | 5,770 ∖ 13,987 | 18.48% | 41.25% |
| 59 | 2nd player pre-game assists per game | 4,940 ∖ 12,329 | 16.29% | 40.07% |
| 60 | 2nd player pre-game Q4∖OT true shooting % | 3,759 ∖ 8,707 | 11.50% | 43.17% |
| 61 | 2nd player pre-game Q4∖OT if score margin ⩽5 FG% | 3,030 ∖ 6,561 | 8.67% | 46.18% |
| 62 | 2nd player pre-game playoff Q4∖OT if score margin ⩽5 FG% | 3,391 ∖ 7,889 | 10.42% | 42.98% |
| 63 | 2nd player pre-game playoff Q4∖OT if score margin < =PPG | 4,774 ∖ 11,653 | 15.40% | 40.97% |
| 64 | 2nd player pre-game previous two months Q4∖OT FT% | 4,107 ∖ 10,223 | 13.51% | 40.17% |
| 65 | 2nd player pre-game previous two months PPG | 6,323 ∖ 15,161 | 20.03% | 41.71% |
| 66 | 2nd player pre-game previous two months true shooting % | 3,965 ∖ 9,435 | 12.47% | 42.02% |
| 67 | 2nd player pre-game total games | 4,179 ∖ 10,198 | 13.47% | 40.98% |
| 68 | 2nd player in-game clutch lead changing clutch shots % | 1,495 ∖ 3,768 | 4.98% | 39.68% |
| 69 | 2nd player in-game total lead changing clutch shots made | 1,381 ∖ 3,502 | 4.63% | 39.43% |
| 70 | 2nd player pre-game clutch lead changing clutch shots % | 3,314 ∖ 7,605 | 10.05% | 43.58% |
| 71 | 2nd player pre-game total lead changing clutch shots made | 5,462 ∖ 13,479 | 17.81% | 40.52% |
| 72 | 2nd player lasso logistic regression | 2,810 ∖ 6,103 | 8.06% | 46.04% |
| 73 | 3rd player in-game 3PM | 3,401 ∖ 8,495 | 11.22% | 40.04% |
| 74 | 3rd player in-game 3PT% last five shots | 3,405 ∖ 8,554 | 11.30% | 39.81% |
| 75 | 3rd player in-game FG% | 4,233 ∖ 9,983 | 13.19% | 42.40% |
| 76 | 3rd player in-game FG% last five shots | 4,015 ∖ 9,777 | 12.92% | 41.07% |
| 77 | 3rd player in-game FT% | 5,355 ∖ 12,916 | 17.07% | 41.46% |
| 78 | 3rd player in-game FT% last five shots | 4,139 ∖ 10,106 | 13.35% | 40.96% |
| 79 | 3rd player in-game FTM | 3,987 ∖ 9,651 | 12.75% | 41.31% |
| 80 | 3rd player in-game turnovers | 3,741 ∖ 9,277 | 12.26% | 40.33% |
| 81 | 3rd player in-game assists | 4,138 ∖ 10,152 | 13.41% | 40.76% |
| 82 | 3rd player in-game blocks | 2,780 ∖ 6,773 | 8.95% | 41.05% |
| 83 | 3rd player in-game fouls drawn | 2,851 ∖ 6,699 | 8.85% | 42.56% |
| 84 | 3rd player in-game points | 4,839 ∖ 11,677 | 15.43% | 41.44% |
| 85 | 3rd player in-game rebounds | 4,178 ∖ 9,993 | 13.20% | 41.81% |
| 86 | 3rd player in-game true shooting % | 4,328 ∖ 10,532 | 13.92% | 41.09% |
| 87 | 3rd player pre-game 3PM per game | 3,704 ∖ 9,448 | 12.48% | 39.20% |
| 88 | 3rd player pre-game 3PT% last 100 shots | 3,894 ∖ 10,164 | 13.43% | 38.31% |
| 89 | 3rd player pre-game FG% | 512 ∖ 8,318 | 10.99% | 42.22% |
| 90 | 3rd player pre-game FG% last 100 shots | 3,739 ∖ 9,045 | 11.95% | 41.34% |
| 91 | 3rd player pre-game FGM per game | 4,323 ∖ 10,622 | 14.03% | 40.70% |
| 92 | 3rd player pre-game PPG | 4,388 ∖ 10,858 | 14.35% | 40.41% |
| 93 | 3rd player pre-game turnovers per game | 4,458 ∖ 10,662 | 14.09% | 41.81% |
| 94 | 3rd player pre-game assists per game | 4,325 ∖ 10,700 | 14.14% | 40.42% |
| 95 | 3rd player pre-game Q4∖OT true shooting % | 3,959 ∖ 9,559 | 12.63% | 41.42% |
| 96 | 3rd player pre-game Q4∖OT if score margin ⩽5 FG% | 3,407 ∖ 7,705 | 10.18% | 44.22% |
| 97 | 3rd player pre-game playoff Q4∖OT if score margin ⩽5 FG% | 3,820 ∖ 9,328 | 12.32% | 40.95% |
| 98 | 3rd player pre-game playoff Q4∖OT if score margin < =PPG | 3,567 ∖ 8,678 | 11.47% | 41.10% |
| 99 | 3rd player pre-game previous two months Q4∖OT FT% | 4,411 ∖ 10,806 | 14.28% | 40.82% |
| 100 | 3rd player pre-game previous two months PPG | 4,527 ∖ 10,973 | 14.50% | 41.26% |
| 101 | 3rd player pre-game previous two months true shooting % | 4,148 ∖ 9,781 | 12.92% | 42.41% |
| 102 | 3rd player pre-game total games | 4,060 ∖ 9,829 | 12.99% | 41.31% |
| 103 | 3rd player in-game clutch lead changing clutch shots % | 758 ∖ 1,910 | 2.52% | 39.69% |
| 104 | 3rd player in-game total lead changing clutch shots made | 696 ∖ 1,753 | 2.32% | 39.70% |
| 105 | 3rd player pre-game clutch lead changing clutch shots % | 4,057 ∖ 9,555 | 12.62% | 42.46% |
| 106 | 3rd player pre-game total lead changing clutch shots made | 4,291 ∖ 10,537 | 13.92% | 40.72% |
| 107 | 3rd player lasso logistic regression | 3,124 ∖ 7,192 | 9.50% | 43.44% |


