
Longitudinal trends in human accuracy: A five-decade analysis (1969–2019) of free-throw shooting in the NBA
Abstract
Describing, understanding, predicting, and controlling the improvement of athletic performance are pivotal aspects of sport sciences. Longitudinal trends of the achievements of elite performers, mainly in endurance (e.g., cycling, running, skiing, and swimming) and explosive-power (e.g., jumping, throwing, and weightlifting) sports, were examined in a series of studies. One of the observations in these studies was the significant improvement in performance in the above-mentioned sports over the 1960s, 1970s, and 1980s. In addition, several factors that can account for the observed improvements were outlined and discussed in the previous literature. The current study contributes to this line of research by examining the rate of improvement in free-throw (FT) shooting of National Basketball Association (NBA) players over a five-decade period –1969–2019. As opposed to many power and endurance sporting events, FT shooting is a fine-motor task performed in a stable and predicted environment. Based on an analysis of more than 2.6 million FT shots, we found that from 1969 to 2019 the FT shooting accuracy fluctuated at around 75%, but did not show any steady trend of improvement. We discuss this finding from a skill-acquisition perspective.
1Introduction
The extent to which human performance can evolve and be improved is a pivotal question in various scientific endeavors, including sport and exercise sciences. In sport settings, improvement in athletic performance can stem from a number of factors. Among these are: (a) a reduction in energy losses (e.g., polyurethane swimsuits, efficient running surfaces, and advanced fiber-glass poles); (b) the introduction of new techniques (e.g., the Fosbury flop); (c) growing sport participation rate among children and youth; (d) improved training regimes; (e) improved nutrition; and (f) the use of performance-enhancement drugs (see Balmer et al., 2012; Haake, 2009; Haake et al., 2015).
As an example, after the Second World War the above-mentioned factors propelled athletes’ improvement in throwing and jumping events in track and field (see Haake et al., 2015). Additionally, it was argued by Haake and colleagues (2014) that in some cases a large proportion of the variance in improvement is related to talent identification of specialized athletes, who have the unique body shapes and characteristics necessary for success in a given sport (e.g., an influx of African runners participating in middle and long-distance running events). However, an apparent plateau effect has been observed in several maximum-power and endurance sports from the late Twentieth Century to the present day. Berthelot et al. (2010) found that 64% of track and field events have not improved since 1993. This observation led researchers to conclude that in some sports (e.g., jumping and throwing athletic events) the boundaries of performance have already been artificially stretched through doping practices (Berthelot et al., 2015).
A long-term retrospective analysis of records and results of elite performers in the domain of sport is essential in order to strengthen the understanding of the athlete’s upper limits (Marck et al., 2017). Such an analysis may not only assess the synergistic process of human improvement up to its full optimization, but it can also relate to the finite body of each athlete at each spatial and temporal scale. Up to now, most studies have focused on the long-term retrospective analysis of endurance and maximum-power sports, such as cycling, skating, swimming, throwing, and weightlifting (Berthelot et al., 2008; El Helou et al., 2010; Nevill et al., 2007). In the current observational study, we aimed at analyzing longitudinal trends of human accuracy in one specific task –free-throw (FT) shooting in basketball.
2FT Shooting in Basketball
A FT shot in basketball is awarded to the player after a foul was made against him or her, or when another rule infraction has been committed by one of the players of the opposing team (International Basketball Federation, 2020). FT shooting is classified as a fine closed motor task, which is performed in a stable and predictable environment (Lidor, 2007, 2009). That is to say, the shooter performing a FT shot knows in advance how he or she is going to execute it, and under what conditions. The environmental settings are stable (e.g., the distance of the shot from the basket, the angle of the shot, and the height of the basket), and the same style of shooting is used by the player each time he or she stands at the FT line (Goldschmied et al., 2021).
The FT shooting is also considered a self-paced task, meaning the player is able to determine when to initiate the shooting act. According to the international rules of the game (International Basketball Federation, 2020), basketball players have five seconds to prepare themselves for the FT act, with the exception of the 10-second time period available for those playing in the NBA (NBA Official, 2020). When players know in advance, how much time is available to them for the FT shot, they can release the ball when they feel comfortable and ready to do so. They can decide not only what to do during this preparation interval, but also how to use the time officially allotted to them –taking into account their professional abilities and preferences.
Since 1954, the distance to the backboard, the height of the basket, and the diameter of the basket’s rim have remained unchanged in the NBA. Each FT attempt has been taken from the same distance and location, and therefore the physical difficulty of each shot has been consistent (Hung et al., 2004). When shooting the ball from the FT line, the player is not impeded by the actions of his or her opponents; that is, the observed performance is not confounded by simultaneous changes in the offensive and defensive players’ behavior. In this game situation, shooting success is solely determined by the individual abilities of the player (Cao et al., 2011; Phatak et al., 2020). Consequently, FT shooting research utilizes the observation of decades of performances under relatively invariant conditions, with an objective binary outcome suitable for quantitative analysis (Avugos et al., 2013).
If we attempt to draw some parallel between performance trends in FT shooting in basketball and the performance of jumping and throwing events in track and field, for example, then we might expect that FT shooting accuracy would benefit from contributing factors such as growing participation, increased professionalization, and improved training routines. This at least was the case with endurance and anaerobic-power sports in the period from the end of World War II to the 1990s. Consequently, while it is reasonable to assume that FT shooting accuracy will benefit from optimal selection and training, it seems that technological developments in apparatus or the use of performance enhancement drugs are less relevant factors in the case of FT shooting.
It was our aim in the current study to examine the accuracy of FT shots performed by NBA players across a five-decade period –1969–2019. We assumed that improvement in shooting accuracy would be observed during this period due to increased participation, better selection, and aspects associated with unique training programs developed for elite athletes (e.g., professional basketball players).
Training programs developed for elite athletes ideally utilize sport-related domains, such as exercise physiology, sport medicine, movement science, sport and exercise psychology, and training theory –all of which are implemented systematically over a long period of time (see Bompa et al. 2019; Bompa & Buzzichelli, 2018; Lidor et al., 2016). The greater the professional cooperation among experts in these fields, the higher the chances for the athlete to reach and sustain a high level of performance. It is our assumption that such professional cooperation among experts working with NBA players, together with other relevant factors, will result in improvement in FT shooting accuracy.
3Method
3.1Data Set
Data regarding the FT shots were collected from a public open source –the official NBA website (https://stats.nba.com). The data set consists of 50 regular seasons, from 1969-70 to 2018-19. As the 2019-20 and 2020-21 seasons were heavily affected by the COVID-19 pandemic, with most games either being canceled or played without a crowd, these two most recent seasons were excluded from the data analysis. For each season, we considered the individual player’s total number of FT attempts and FT shots made. As such, the units in the dataset are composed of each player’s statistics per season (not including playoff games).
4Results
4.1Descriptive Data
Since 1967, a consistent number of 82 games were played during each regular season, and by each team, in the NBA –with the exception of the 1998-9 and 2011-2 seasons that were shortened to 50 and 66 games, respectively, due to lockouts. The total number of FT shots in each season ranged from 32,218 to 64,700 (Table 1, row 2). This variance in the total number of FT shots between seasons could be related to the variance in the number of teams, since over time, the league expanded from just 14 teams in the 1969-70 season to 30 teams in the 2018-19 season. Therefore, in Fig. 1 we accounted for the number of teams and total number of games that took place each season, presenting the number of FT shots per game over 50 NBA seasons.
Table 1
FT Shots in the NBA: Descriptive Statistics for 50 Regular Seasons
| Minimum | Maximum | Mean | SD | Total | |
| Number of players per season | 152 | 503 | 362.44 | 96.68 | 18,122* |
| FTs attempted in each season | 32,218 | 64,700 | 53,749.28 | 8,991.28 | 2,687,464 |
| FTs made in each season | 24,470 | 48,462 | 40,554.38 | 6,785.56 | 2,027,719 |
| Percentage of FTs made from FTs attempted in each season | 72.81% | 77.18% | 75.46% | 1.02% | |
| Players’ ft% mean in each season | 70.50% | 74.57% | 72.65% | 1.03% | |
| Players’ ft% median in each season | 72.36% | 76.92% | 74.87% | 0.93% | |
| Average number of FT attempts per player in each season | 90.89 | 236.30 | 155.07 | 27.78 |
*The actual number of players is lower, since many players remained for several seasons in the league. Thus, 18,122 is the number of players’-seasons and not the number of players in our sample.
Fig. 1
Team per game FT attempts across 50 seasons in the NBA.
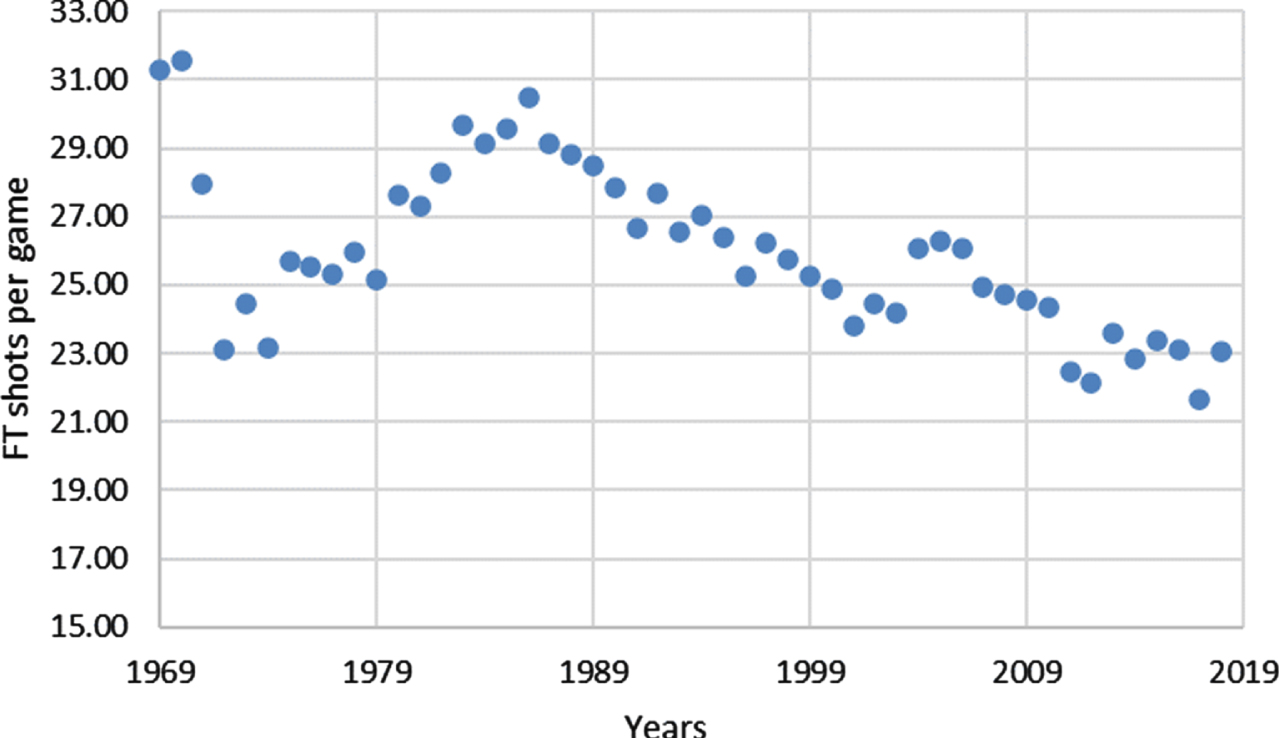
Our findings indicate that the highest number of FT shots per game was seen in the 1969-70 and 1970-71 seasons (more than 31 attempts). An additional peak can be observed in the mid-1980s, with more than 30 attempts in the 1986-7 season. From this point onwards the number of attempted FT shots in each game have gradually decreased to around 22-23 attempts. While the distance, rim diameter, and ball size have remained consistent over the five decades’ time span examined in our study, a number of rule changes were introduced with regard to the exact circumstances in which free throw is awarded (see NBA Rules History1).
For example, data for the 1969-70 to 1980-81 seasons include instances of “bonus shots", due to a team exceeding the limit of four fouls per quarter. In this case, if a player was fouled while attempting a shot that he missed, he had three opportunities to make two successful free throws. Namely, if a player missed in first or second attempt, additional (third) free throw attempt was awarded. A player who was fouled while making the shot received two free throw attempts to add one additional point, that is, if a player succeed in first attempt no second attempt was awarded.
An important rule that was eliminated prior to the 1981-2 season is the “backcourt-foul” rule. Established in 1954, this rule stated that offensive player who was fouled before he crossed the midcourt line automatically received two free throws or three to make two in case the fouling team had exceeded the four fouls limit. Starting from 1981-2 season, all backcourt fouls were subject to the same penalties as frontcourt fouls, with no bonus shots (Rogers, 1981).
Minor rule alternations regarding the personal fouls limit, fouls performed during the last two minutes of the game, and offensive, technical, and flagrant fouls were also observed over the years. While an in-depth examination of all rule changes associated with FTs is beyond the scope of the current study, it is important to note that except from the rare cases in which technical and flagrant fouls are performed, or where the fouled player is severely injured and as such is unable to make the shots, the fouled player is obliged to perform FTs. This implies that across the five decades time span covered by this current study, our point of observation remains unchanged, that is, the number of successful FT shots out of the total number of attempted FT shots by each player in each season.
One recent and particularly relevant rule change is the “Hack-a-Shaq” –a late 1990s and early 2000s defensively strategy that has been especially used in close games against opponents’ worst FT shooters (e.g., Dennis Rodman and Shaquille O’Neal), as a means for stopping the game clock and sending those players to the FT line (see Clay & Clay, 2014). Intentional fouling of poor shooters became increasingly implemented during the late 2000s and 2010s (e.g., Dwight Howard and DeAndre Jordan), with much discourse being conducted about possible rule changes for addressing this issue.2 Indeed, as of the 2016-17 season, fouls committed in the final two minutes of each quarter, and on players who were not in possession of the ball (i.e., away-from-the-play-fouls), awarded the fouled team a FT, as well as possession of the ball. This is an extension of the already-existing rule that only applied to the final two minutes of the fourth quarter and overtime.3
It should be emphasized, however, that even at the peak of the Hack-a-Shaq strategy (the mid-2010s), according to an NBA internal analysis, away-from-the-play-fouls on poor FT shooters accounted for less than a 1% of all annual fouls (e.g., 420 out of 49,854 fouls during the 2015-16 season).4 As such, this implies that the Hack-a-Shaq strategy did not significantly impact our results.
Table 1 presents descriptive data of the FT shots taken in the NBA across 50 seasons. Looking at 2,027,719 hits out of 2,687,464 attempts performed in these seasons, we ended up with a 75.45% overall hit rate corresponding to a hit rate per throw. Another way to calculate the overall FT shooting percentage (ft%) is to consider the successful FT shots out of the attempted FT shots in each season, and then to calculate the average of the 50 seasons. This overall hit rate is not weighted by the number of throws in each season. Applying this procedure resulted in a season average of 75.46% (see Table 1, Raw 4), which is slightly different from the 75.45% hit rate per throw mentioned previously. This small gap is due to the differences in the number of FT shots attempted in each season. These differences remained unaccounted for while aggregating the 50 annual FT percentages, giving equal weight for each season.
The same effect manifests itself when we calculate the general average ft% from the perspective of the shooter (see Table 1, Row 5). In each season, we looked at the ft% of each of the players, and then we calculated the annual average from all the players’ ft%. The problem with this procedure is that we treated each player’s ft% as an equal observation when calculating the annual average ft% of all the players. For example, a player who succeeded in 15 out of 20 FT shot attempts during a particular season (annual ft% = 75) will be aggregated with a player who made 120 out of 200 attempts (annual ft% = 60), which will result in a 67.5% annual average for these two players. However, when we looked at the same data from the perspective of the shot, we calculated 135 hits out of 220 attempts, which is 61.36%. In order to account for these discrepancies, we present the data from both perspectives (see Morgulev et al., 2020).
4.2Accuracy of Shooting from the Shooter’s and the Shot’s Perspectives
Figure 2 adopts the shooter’s perspective, presenting the average ft% calculations for each season based on the individual player’s annual ft%. As the annual ft% of each player was equally weighted in this analysis, it was important to ensure that players’ hit-miss ratio validly reflects their FT shooting ability in any given season. Naturally, players who had one FT attempt during a particular season, and missed it, are not considered a 0% FT shooter. Similarly, players who scored one out of one on their FTs are not considered 100% FT shooters. As such, and based on the Central Limit Theorem (CLT) (Ross, 2005), we concluded that observations with fewer than 30 annual FT attempts could not be used as a valid estimation of a player’s actual FT ability in any given season.
Fig. 2
Players’ Annual Average ft% across 50 Seasons in the NBA.
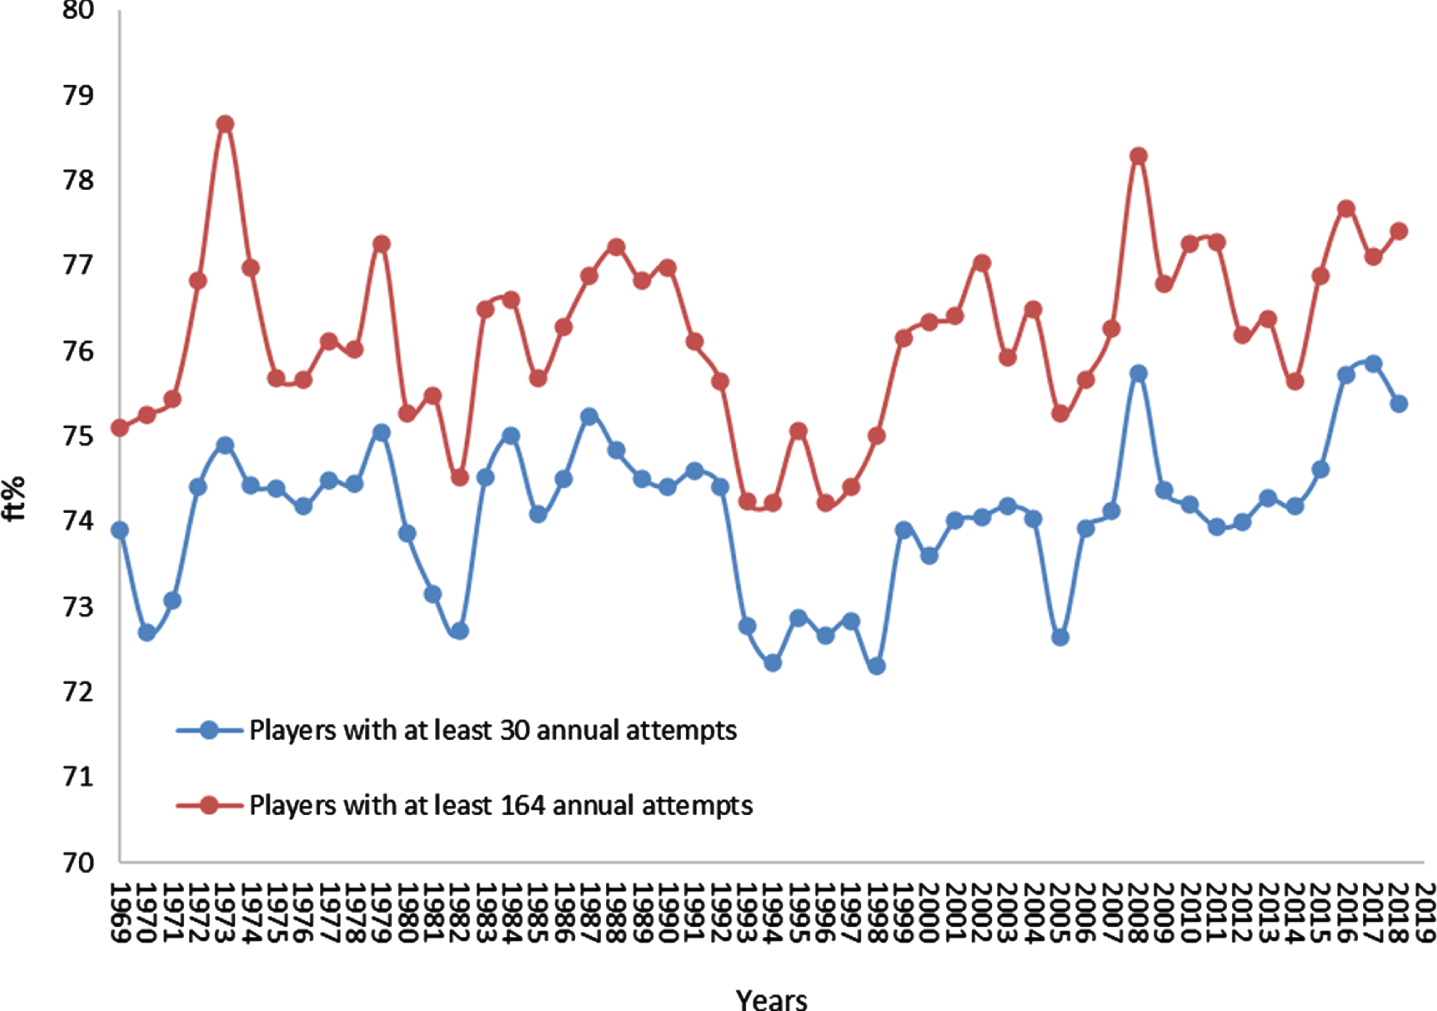
The number of observations (players-seasons) that were included in the reduced data set of this study was 14,227. We also computed the annual average ft% for a data set of players with at least 164 attempts (N = 6,272), namely, players who on average across the season had at least two FT shots per game.
Fluctuations around the 75% mark, rather than a consistent longitudinal trend in shooting accuracy, can be observed in Fig. 2. A simple linear regression with the year as the independent variable and the average annual ft% as the dependent variable indicated an r-squared value of 0.02 for players with at least 30 attempts and 0.04 for players with at least 164 attempts. The slope coefficients were found to be non-significant (p > 0.05) in both data sets. We now turn to a more elaborate analysis of the data using a control chart technique. As indicated previously, an aggregation of the players’ annual ft% can produce a bias when giving equal weight to players who attempted from dozens to hundreds of FT shots. Therefore, we henceforth adopted a shot’s perspective.
A time series is a sequence of real numbers representing the values of a variable over time. A control chart allows the detection of abnormal (non-random) patterns appearing in this variable (Kenett & Zacks, 2014; Nanopoulos et al., 2001). Figure 3 is a control chart of the entire data, compiled using the JMP version 14 software. The numbers indicate flagged tests as listed above. We applied the U chart that corresponds to the type of data used in our study.
Fig. 3
A Control Chart Time Series Analysis of the Proportion of Annual Successful FT Shots across 50 Seasons in the NBA. Detected Abnormalities Flagged According to the Western Electric Rules.
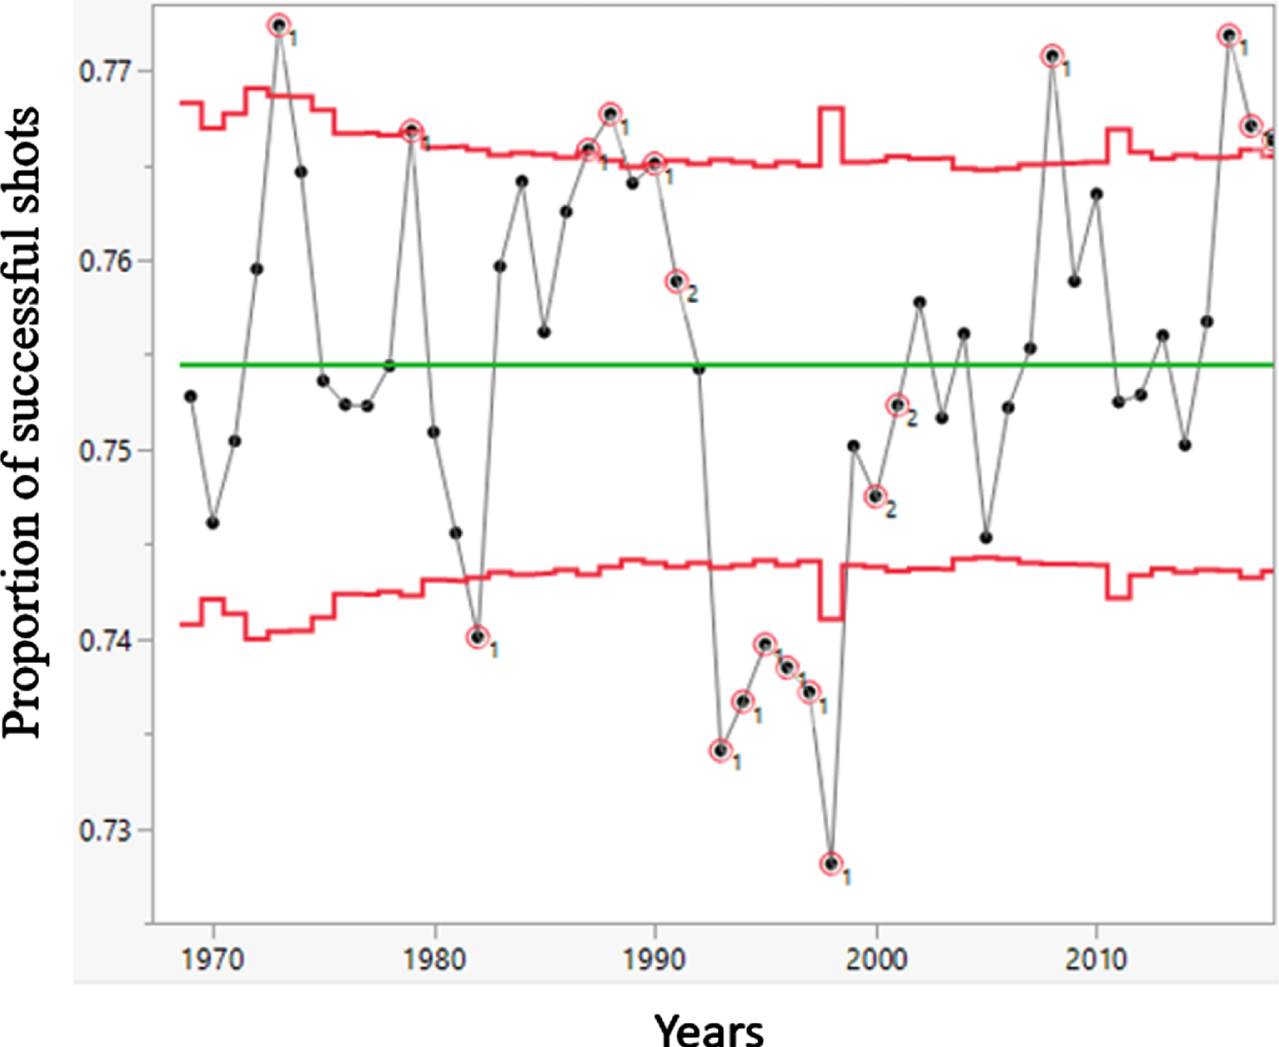
The control limits (the upper and lower lines in Fig. 3) are set at three standard deviations. The probability of the measured value falling within the upper and lower control limits is 99.73%. By the use of limits set at one and two standard deviations from the center (the central line), we identify three zones: Zone A –between two standard deviations from the center line and the three standard deviations control limit; Zone B –between one and two standard deviations from the center line; and Zone C –within one standard deviation of the center line.
Significant changes in a control chart are identified according to eight tests known as the Western Electric Rules. Each rule leads to a different diagnostic characteristic of the flagged change (see Kenett & Zacks, 2014): (a) one point beyond Zone A (upper or lower): detects a shift in the mean, an increase in the standard deviation, or a single aberration in the process; (b) nine points in a row in a single (upper or lower) side of Zone C or beyond: detects a shift in the process mean; (c) six points in a row steadily increasing or decreasing (anywhere on the chart): detects a trend or drift in the process mean; (d) 14 points in a row alternating up and down (anywhere on the chart): detects systematic effects such as two alternately used machines; (e) two out of three points in a row in or beyond Zone A with the point itself in or beyond Zone A, and the two points must be on the same side (upper or lower): detects a shift in the process average or an increase in the standard deviation; (f) four out of five points in a row in or beyond Zone B and the point itself in or beyond Zone B, and the four points must be on the same side (upper or lower): detects a shift in the process mean; (g) 15 points in a row in Zone C, above and below the center line: detects stratification of subgroups when the observations in a single subgroup come from various sources with different means; (h) eight points in a row on both sides of the center line with none in Zone C: detects stratification of subgroups when the observations in one subgroup come from a single source, but the subgroups come from different sources with different means.
A number of significant fluctuations in accuracy are evident in Fig. 3. A sharp increase in performance occurred from 1970 to 1973 with an ft% of 77.24 –the highest value in 50 seasons. A sharp decrease can be observed between 1980 and 1982. During the late 1980s until 1991, the players exhibited a high level of accuracy, but then in 1998 the performance significantly dropped to an all-time low (72.81%). For almost a decade –between 1999 and 2007, performance remained relatively stable –around 75%. Then, in 2008, accuracy peaked to 77.07%, went down the following year, and remained relatively stable for five years –between 2011 and 2015. Starting from 2016, we observe three consecutive years with significantly high accuracy values (all three outside the control zone of three standard deviations).
In Fig. 4, a similar analysis of the data set is presented after observations of fewer than 164 free throws in each season (less active and successful players) were removed.
Fig. 4
A Control Chart Time Series Analysis of the Annual Proportion of Successful FT Shots across 50 Seasons in the NBA for Players with At Least 164 Annual Attempts. Detected Abnormalities Flagged According to the Positive Test.
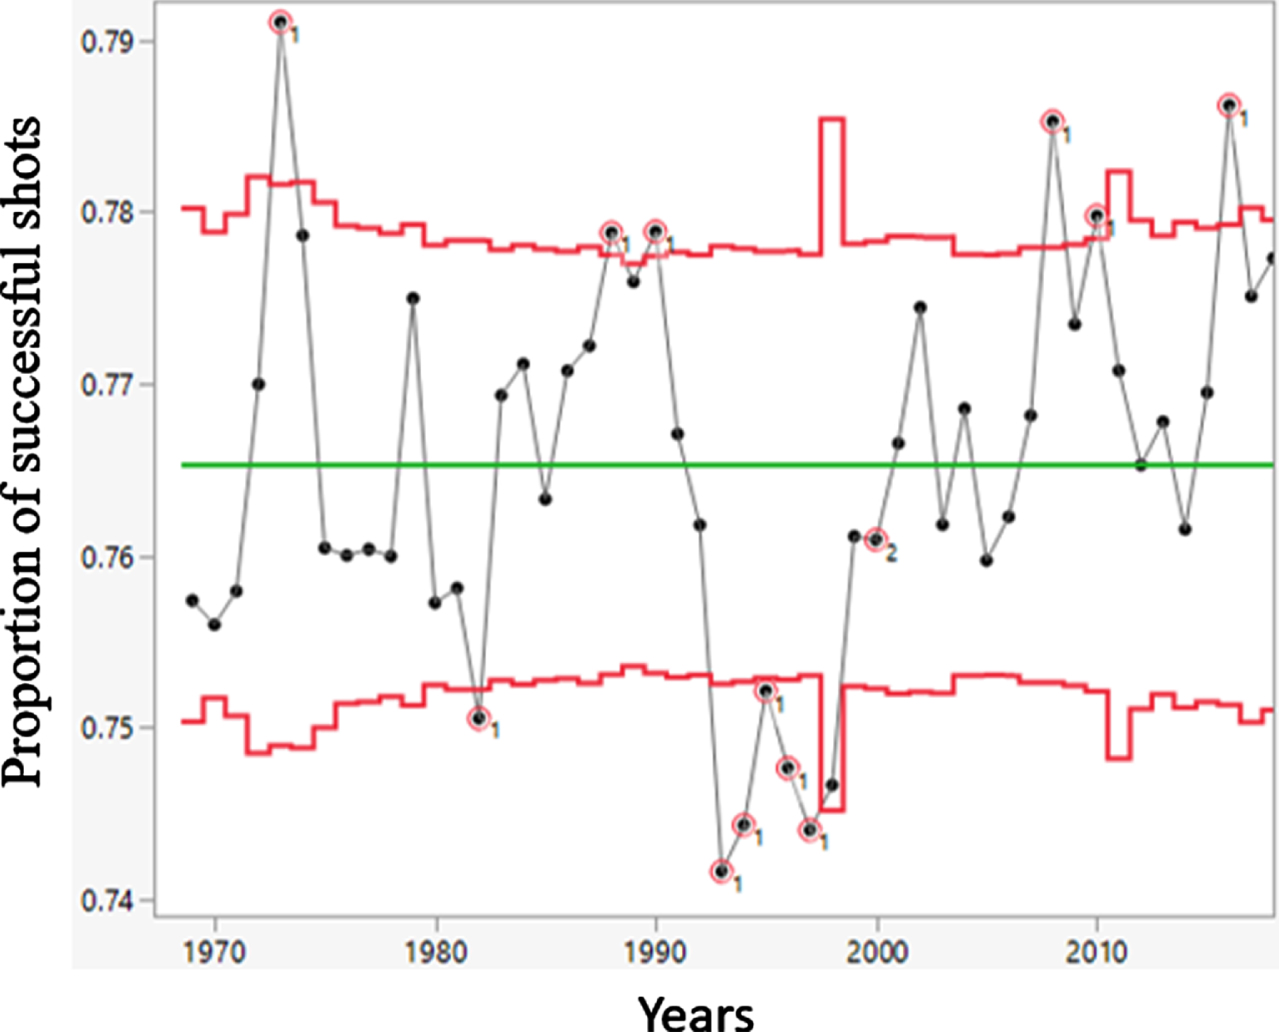
The data presented in Fig. 4 reflect accuracy trends among the more active players in the league (N = 6,272). These players made 1,479,017 hits out of 1,932,695 attempts –that is, a 76.53% success rate (the center line in Fig. 4), which is higher than the overall success rate of 75.45% calculated for the general sample. This observation implies that the players who spent most of their time on the bench were slightly less accurate than their counterparts who given a greater amount of playing time.
A similar pattern emerges when examining the fluctuations in FT performances presented in Figs. 3 and 4 namely that an all-time peak was reached in 1973 and there was significant decrease between 1980 and 1982. In addition, an increase towards the zone of average performance until 2007, with a peak in 2008 followed by a decrease, and then three relatively high values starting from 2016, can be also observed. In essence, Figs. 2, 3, and 4 describe a number of fluctuations in the shooting performances rather than a clear trend of improvement/decrement.
5Discussion
Research on longitudinal trends in human athletic performance has focused mainly on endurance and maximum-power sports. The main conclusion of this line of research is that performance was drastically enhanced throughout the 1960s, 1970s, and 1980s. In the current study, we aimed at assessing the longitudinal trends in the performance of a self-paced motor task of one ball-game activity –the FT shot in basketball.
The findings that emerged from our analysis revealed that throughout a five-decade period –from 1969 to 2019 –the shooting accuracy of the FT shots in the NBA significantly fluctuated around the average of 75.5%, rather than showing a steady trend of improvement. Interestingly, during the 1950s and 1960s, NBA players already made successful shots on an average of 72–73% (Fillipi, 2011, 2016). This implies that the lion’s share of improvement in the FT shooting task occurred even earlier, during the 1940s and even before. Presumably, such an early plateauing in sport is a unique phenomenon.
A high level of FT shooting accuracy can be achieved through a high degree of stability in performance. The problem is that stability is always impaired by the pervasiveness of mechanical sources of variability, due to the many degrees of freedom in the simultaneous movement of the shoulder, elbow, wrist, and finger joints, which need to be executed in perfect synchronization (see Turvey et al., 1982). Every time the same movement is replicated, a certain amount of change may occur in the subsequent repetitions, regardless of how good or familiar the performer is with the given task (Preatoni et al., 2013).
In this regard, Faisal and colleagues (2008) argued that movement variability is a prominent feature of performance; it occurs on the most fundamental-neuronal level (i.e., noise), and it is observed even when external conditions are kept as stable as possible. McDonnell and Ward (2011) suggested that such variability could even be evolutionarily advantageous, namely that the human body is simply not designed to replicate an identical motor pattern over and over again (Preatoni et al., 2010). In the case of shooting FT shots, since 1969 the annual success rate has stood at 75.2%, and not once in 50 seasons did it break the 80% bar. This holds true even if we only look at the sub-sample of players with more than 164 annual FT attempts. It seems that an inherent movement variability imposes a barrier on basketball players, even on the best of them who play at the very highest level of competitive basketball –the NBA. Across five decades, among thousands of NBA players, only 57 players achieved a career FT shot percentage higher than 85%, and only four exceptional players broke the 90% barrier.5
A comparison can be conducted between the FT results presented in this study and findings on penalty kicks in soccer. Similar to a FT in basketball, a penalty kick is a self-paced task that requires accuracy and is performed from a fixed distance of 11 meters towards a 7.32-by-2.44-meter goal. Results on penalty kicks’ success rate also fluctuate around 75%. For example, 74.25% kicking success was reported by Dohmen (2008), who analyzed penalty kicks from the 1963–2004 seasons in the German Bundesliga; a 73.1% success rate was described by Apesteguia and Palacios-Huerta (2010) in their analysis of penalty kicks during the 1970–2008 worldwide major elimination tournaments shootouts; and finally, a 76% success rate was shown by Jamil et al. (2020) in an analysis of the 2015–2019 seasons in major European leagues.
However, in contrast to FT shooting in basketball, the evident convergence to 75% success rate in penalties in soccer could be explained by improved goalkeeper abilities, better selection processes, increased professionalism, and enhanced training regimes. Therefore, it is possible that goalkeepers are able to neutralize even significant improvements in the kicker’s power and accuracy – a possibility that cannot account for the lack of improvement in FT shooting in the game of basketball.
As for the revealed cross-seasonal fluctuations in shooting performance, the task of shooting from the line in basketball has remained immune to performance enhancement drugs or acute improvements in apparatus. Therefore, we suggest that future research should attempt to identify specific tactical developments that were adopted throughout the years by coaches in the NBA (see Goldsberry, 2019; Shea, 2014; Zuccolotto & Manisera, 2020), and determine, if, for example, shifts in the abilities that coaches value most at the players selection phase are associated with fluctuations in FT shooting performance. Additionally, we suggest that specific interventions aimed at improving FT shooting accuracy, as well as modifications in shooting training regimes, are to be examined in longitudinal experimental studies.
Disclosure of interest
The authors declare that this research was conducted in the absence of any commercial or financial relationships that could be construed as a potential conflict of interest.
Data Statement
The authors declare that the research was based on information freely available in the public domain.
References
1 | Apesteguia. J. , Palacios-Huerta I. ((2010) ), Psychological pressure in competitive environments: Evidence from a randomized natural experiment, American Economic Review, 100: (5) 2548–2564. |
2 | Avugos S. , Bar-Eli I. , Ritov M. , Sher E. , ((2013) )The elusive reality of efficacy–performance cycles in basketball shooting: an analysis of players’ performance under invariant conditions, International Journal of Sport and Exercise Psychology 11: (2), 184–202. |
3 | Balmer. N. , Pleasence P. , Nevill A. ((2012) ) Evolution and revolution: Gauging the impact of technological and technical innovation on Olympic performance, Journal of Sports Sciences 30: (11), 1075–1083. |
4 | Berthelot. G. , Sedeaud A. , Marck A. , Antero-Jacquemin Schipman J.J. , Sauliere G. , Toussaint J.F. , ((2015) ) Has athletic performance reached its peak? Sports Medicine 45: (9), 1263–1271. |
5 | Berthelot. G. , Tafflet M. , El Helou Len S.N. Escolano S. , Guillaume M. , Hermine O. , ((1988) ), Athlete atypicity on the edge of human achievement: performances stagnate after the last peak, in, PloS One 5: (1) e8800. |
6 | Berthelot. G. , Thibault V. , Tafflet M. , Escolano S. , El Helou Jouven X.N. , Toussaint J.F. , ((2008) ) , , The citius end: world records progression announces the completion of a brief ultra-physiological quest, PLoS One 3: (2), e1552. |
7 | Bompa T. , Blumenstein Hoffmann B. , Howell J. S. , Orbach I. , Integrated periodization in sports training athletic development. Meyer Meyer Sport. |
8 | Bompa. T. , Buzzichelli C.A. Periodization- Theory and methodology of training} (6th ed.). Human Kinetics. |
9 | Cao. Z. , Price J. , Stone D.F. ((2011) ) Performance under pressure in the NBA, Journal of Sports Economics 12: (3), 231–252. |
10 | Clay D.C. , Clay E.K. . ((2014) ) Player rotation, on-court performance and game outcomes in NCAA men’s basketball, International Journal of Performance Analysis in Sport 14: (2), 606–619. |
11 | Dohmen J.T. ((2008) ) Do professionals choke under pressure? Journal of Economic Behavior Organization 65: (3-4) , 636–653. |
12 | El Helou N. , Berthelot G. , Thibault V. , Tafflet M. , Nassif H. , Campion F. , Toussaint J.F. , ((2010) ) Tour de France, Giro, Vuelta, and classic European races show a unique progression of road cycling speed in the last 20 years, Journal of Sports Sciences 28: (7), 789–796. |
13 | Faisal A.A. , Selen L.P. Wolpert D.M. ((2008) ), Noise in thenervous system, Nature Reviews Neuroscience 9: (4) 292–303. |
14 | Filippi A. , 2011, Shoot like the pros: The road to a successful shooting technique. Triumph Books. |
15 | Filippi A. 2016, Mastering the art of free throw shooting. Adam Filippi. |
16 | Goldsberry K. 2019, Sprawlball. Houghton Mifflin Harcourt. |
17 | Goldschmied. N. , Raphaeli M. , Moothart S. , Furley P. 2021, Free throw shooting performance under pressure: a social psychology critical review of research, International Journal of Sport and Exercise Psychology. |
18 | Haake J.S. ((2009) ) The impact of technology on sporting performance in Olympic sports, Journal of Sports Sciences 27: (13), 1421–1431. |
19 | Haake J.S. , Foster L.I. , James D.M. ((2014) )An improvement index to quantify the evolution of performance in running, Journal of Sports Sciences 32: (7), 610–622. |
20 | Haake J.S. , James D.M. , Foster L.I. , ((2015) ) An improvement index to quantify the evolution of performance in field events, Journal of Sports Sciences 33: (3), 255–267. |
21 | Hung K.G. , Johnson B. , Coppa A. (2004) , Aerodynamics and biomechanics of the free throw. In G. K. Hung J. M. Pallis (Eds.), Biomedical Engineering Principles in Sports (pp. 367-390). Springer. |
22 | International Basketball Federation. 2020. 2020 official basketball rules. FIBA. |
23 | Jamil. M. , Littman P. , Beato M. ((2020) ) Investigating inter-league and inter-nation variations of key determinants for penalty success across European football, International Journal of Performance Analysis in Sport 20: (5), 892–907. |
24 | Kenett S.R. , Zacks S. (2014) , Modern industrial statistics: With applications in R, Minitab and JMP (2nd ed.). Wiley. |
25 | Lidor R. (2007) , Preparatory routines in self-paced events: Do they benefit the skilled athletes? Can they help the beginners? In G. Tenenbaum R. C. Eklund (Eds.), Handbook of sport psychology (3rd ed., pp. 445–465). Wiley. |
26 | Lidor R. 2009, Free throw shots in basketball: Physical and psychological routines. In E. Tsung-Min Hung, R. Lidor, D. Hackfort (Eds.), Psychology of Sport Excellence (pp. 53–61). Fitness Information Technology. |
27 | Lidor. R. , Tenenbaum G. , Ziv G. , Issurin V. ((2016) ), Achieving expertise in sport: deliberate practice, adaptation, and periodization of training, Kinesiology Review 5: 129–141. |
28 | Marck. A. , Antero J. , Berthelot G. , Saulière G. Jancovici J.M. Masson-Delmotte V. Toussaint J.F. ((2017) ), Are we reaching the limits of homo sapiens? Frontiers in Physiology 8: 812. |
29 | McDonnell D.M. , Ward L.M. ((2011) ), The benefits of noise in neural systems: bridging theory and experiment, Nature Reviews Neuroscience 12: (7) 415–425. |
30 | Morgulev. E. , Azar O.H. , Bar-Eli M. ((2020) ), Searching for momentum in NBA triplets of free throws, Journal of Sports Sciences 38: (4) 390–398. |
31 | Nanopoulos. A. , Alcock R. , Manolopoulos Y. ((2001) ), Feature-based classification of time-series data, International Journal of Computer Research 10: (3) 49–61. |
32 | NBA Official. 2020, Rule NO. 9: Free Throws and Penalties. Retrieved from: https://official.nba.com/rule-no-9-free-throws-and-penalties. |
33 | Nevill M.A. , Whyte G.P. . , Holder R.L. , Peyrebrune M. ((2007) ), Are there limits to swimming world records? International Journal of Sports Medicine 28: (12) 1012–1017. |
34 | Phatak. A. , Mujumdar U. , Rein R. , Wunderlich F. , Garnica M. , Memmert D. 2020, Better with each throw study on calibration and warm-up decrement of real-time consecutive basketball free throws in elite NBA athletes, German Journal of Exercise and Sport Research, 1–7. |
35 | Preatoni. E. , Ferrario M. , Donà G. . Hamill J. , Rodano R. ((2010) ) Motor variability in sports: a non-linear analysis of racewalking, Journal of Sports Sciences 28: , 1327–1336. |
36 | Preatoni. E. , Hamill J. , Harrison A.J. , Hayes K. , Van Emmerik R.E. , Wilson C. , Rodano R. , ((2013) )Movement variability and skills monitoring in sports, Sports Biomechanics 12: , 69–92. |
37 | Rogers. T. , 1981, July 31. N.B.A. Eliminates bonus free throws. The New York Times. https://www.nytimes.com/1981/07/31/sports/nba-eliminates-bonus-free-throws.html. |
38 | Ross M.S. 2005, Introductory statistics. Academic Press. |
39 | Shea. S. 2014, Basketball analytics. Stephan Shea. |
40 | Turvey. M. , Fitch H. , Tuller B. 1982, The Bernstein perspective: 1. The problems of degrees of freedom and context-conditioned variability. In J. A. Scott Kelso (Ed.), Human motor behavior: An introduction (pp. 239–252). Erlbaum. |
41 | Zuccolotto. P. , Manisera M. 2020, Basketball data science. CRC Press. |


