
Additional on-court advantages gained during eastward travel in the National Basketball Association (NBA) playoffs
Abstract
During the National Basketball Association (NBA) playoffs, teams are required to frequently travel to different venues to play opponents in series of up to seven games. Despite playoff schedules allowing for some rest between games, it is still possible for teams to face circadian misalignment when playing. Thus, the current study serves as a replication and extension of previous research, which has indicated that there is an advantage for teams playing closer to their circadian peak and when they are traveling east. This study specifically investigates the effects of travel, as well as time of game on various performance indicators in professional basketball. We examined a series of box-score statistics (e.g., game outcomes, points scored, shooting percentages, rebounds, assists, steals, blocks, turnovers, and personal fouls) from a total of 499 postseason games played between the 2013–14 and 2018–19 NBA seasons. Findings from our study indicate that teams traveling eastward scored more points than teams traveling within the same time zone. We also observed that teams playing evening games had higher three-point shooting percentages than teams playing in the afternoon. Our study demonstrates an extended impact of travel and time of day on more specific performance indicators in the NBA. Future directions and implications for professional basketball and other sports are discussed.
1Introduction
Professional athletes train to perform in a variety of scenarios. However, many measures of their performance are dependent on the phase of their circadian rhythm (Reilly, 2008). For example, hormonal and muscular adaptation are two prominent measures that link to athletic performance, and both short- and long-term circadian disruptions can lead to adverse effects such as fatigue, unwellness, and lack of concentration (Teo, Newton, & McGuigan, 2011; Serin & Tek 2019). Consequently, travel becomes an important factor to consider since games are not often scheduled at times only favorable to the circadian rhythm. For example, in the National Football League (NFL), research on game times corresponding to turnovers, injury, and other performance metrics indicate that games played in different time zones influence on-field performance (Brager & Mistovich, 2017). Thus, it appears that certain conditions in travel can give rise to circadian advantages for certain teams.
Specifically, prior research on travel in the National Basketball Association’s (NBA) regular season has shown that teams journeying west relative to their home location face circadian disadvantages for evening games, while those traveling east actually gain advantages (Roy & Forest, 2018). For example, if a team from the East coast of the United States (e.g., the New York Knicks) travels to play a game starting at 7:00 pm Pacific Time against a team on the West coast (e.g., the Golden State Warriors), then this means that they would be playing at the equivalent of 10:00pm relative to their home time zone (i.e., Eastern Time). This particular study focused on the circadian disadvantages during away games on NBA, NFL, and National Hockey League (NHL) teams from 2010 to 2015. The authors found that these effects are exacerbated as a team crosses more time zones. Their study offers evidence to suggest that this travel disadvantage transcends the type of sport and underscores the need to address the circadian rhythm in sports performance practices.
Accordingly, the current study attempts to replicate and extend previous research by examining the effects of travel on performance within the NBA playoffs. Replication studies effectively expand upon the methods of an original study to provide more insight on a topic and not detract from the findings of quality data and measures (Block & Kuckertz, 2018). If previous findings hold true, then this will be a conceptual replication (Walker, James, & Brewer, 2017). The value of this replication and extension is that playoff games have a more critical effect on the fate of a team. The playoffs in any sport are a vital time in the season, in which teams compete for a chance at the title for best in the league. Regular season games, when compounded, influence the overall standing to enter the playoffs and home-court advantage, but in the playoffs, a single game can determine elimination or triumph. Based on previous literature, we hypothesized that teams would have greater circadian advantages during eastward compared to westward travel.
2Materials and methods
In 2013, the NBA Board of Governors unanimously voted for a change to their 7-game series playoff structure for the Finals (Golliver, 2013). Under the original configuration, teams played an alternating 2-3-2 home/away format. From the 2013–14 season and beyond, NBA teams would play Finals series using a 2-2-1-1-1 format, introducing additional travel concerns and considerations for such teams (Pycior, 2018). Thus, we examined all 499 postseason games played following this change during the 2013–14 to 2018–19 seasons. Data were collected from the following publicly-available databases: Basketball-Reference and NBA.com. In extension of Roy and Forest (2018), we investigated the impact of direction of travel from the home city (westward, same time zone, eastward), time of day (afternoon = 17:00 Eastern Time or earlier, evening = 17:30 Eastern Time or later), and time zones traveled on game outcomes (win, loss) and the following team box score statistics: shooting percentages, points scored, assists, rebounds, blocks, steals, turnovers, and personal fouls.
2.1Data analysis
All analyses were performed using RStudio (Version 3.6.2) and jamovi (Version 1.2.3). A series of generalized regression models with post-hoc tests using the Holm-Bonferroni correction (corresponding p-values denoted as pHB in-text) were performed using the gamlj module in jamovi (Gallucci & Love, 2018). Our initial models examined the main and interaction effects of direction of travel and time of day on game outcomes and team box score statistics. Additional models were constructed to investigate the impact of time zones traveled on the aforementioned dependent measures. For each model, we controlled for both the home and away team’s playoff seeds (ranging from 1 to 8 in each conference) due to fluctuations in team quality. A logistic model was assumed for the analysis of game outcomes given the variable’s binary nature (1 = win, 0 = loss).
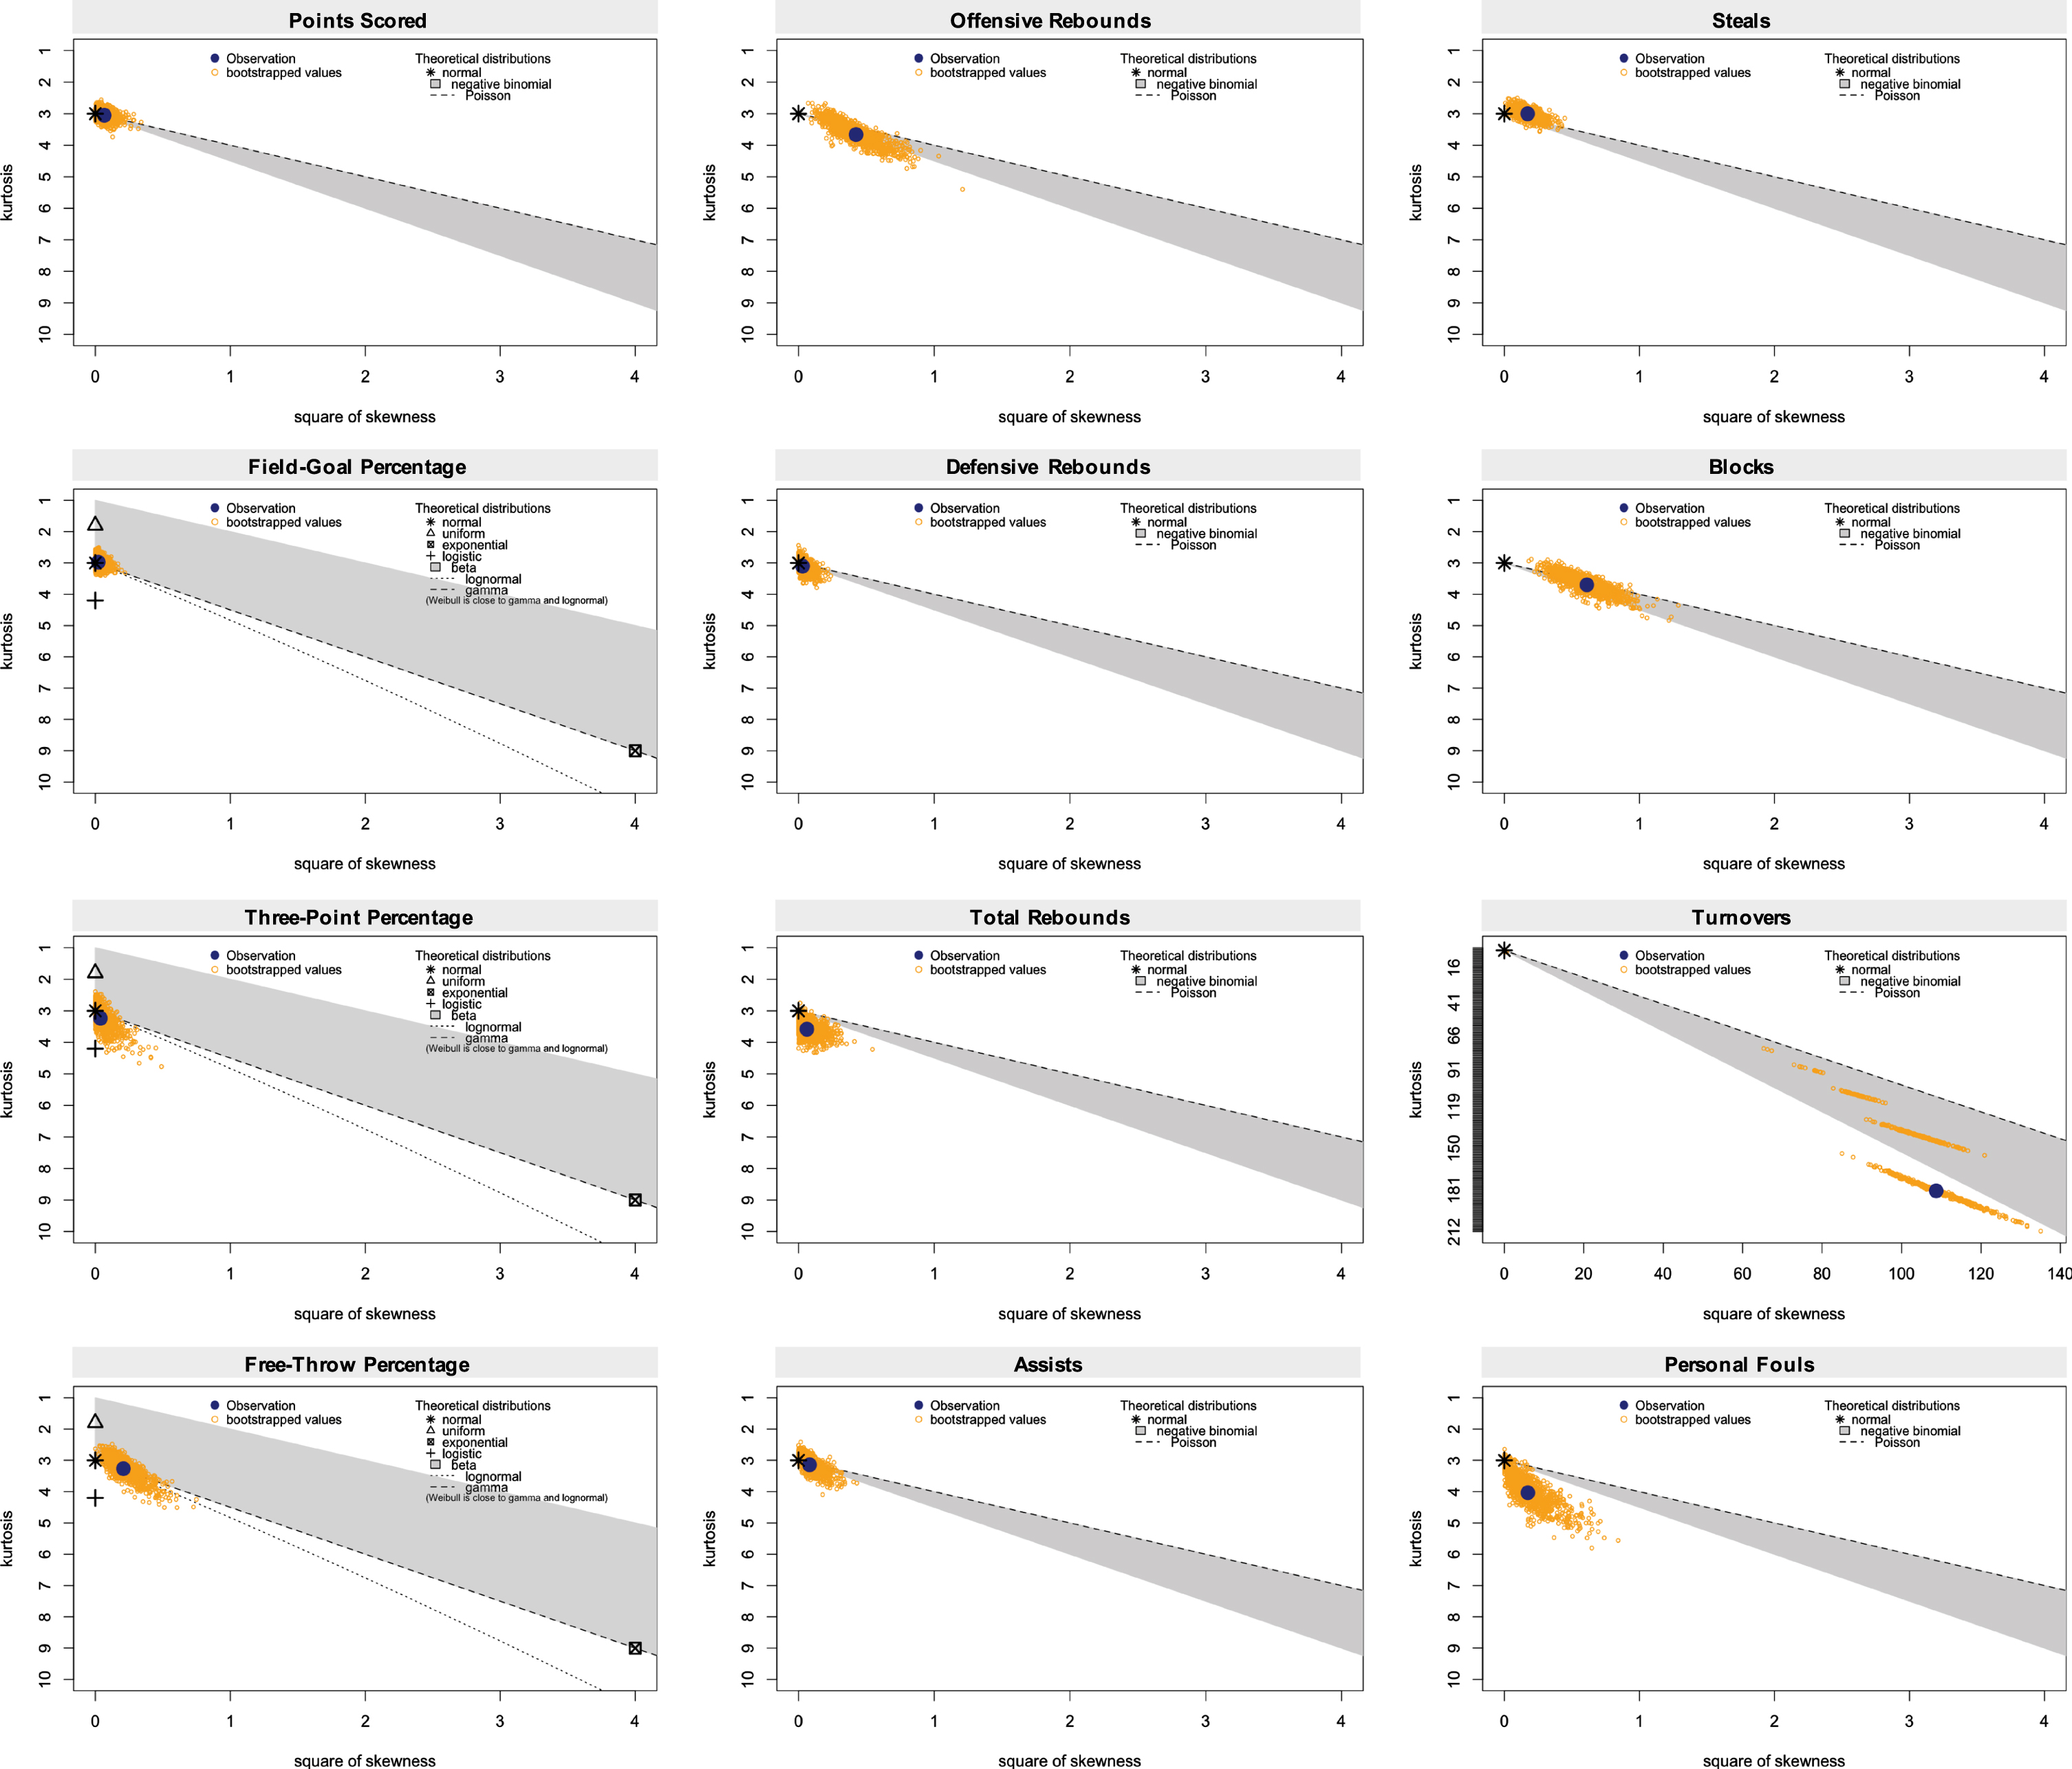
Prior to examining the box-score statistics, skewness-kurtosis graphs (Cullen & Frey, 1999) were constructed for each of the measures using the fitdistrplus package (Delignette-Muller, Dutang, Pouillot, Denis, & Siberchicot, 2020). These graphs are utilized to help select the appropriate data distribution based on the kurtosis and squared skewness of such variables prior to analysis (Kay, Dolcy, Bies, & Shah, 2019). In the manner of Delignette et al. (2014), we used the descdist function with a non-parametric bootstrapping procedure based on 1,000 samples to fit the distributions. Following visual inspection of these plots (see Fig. 1), we assumed a negative binomial distribution for all frequency-based discrete statistics (i.e., points scored, assists, rebounds, blocks, steals, turnovers, and personal fouls) and a normal distribution for shooting percentages (i.e., overall field-goal, free-throw, and three-point).
3Results
The loglikelihood ratio tests from the regression models revealed that overall direction of travel was meaningfully related to team assists (χ2[2] = 8.66, p = .01), personal fouls (χ2[2] = 8.06, p = .02), and field-goal percentage (χ2[2] = 6.48, p = .04). Inspection of the Holm-Bonferroni post-hoc tests indicated that teams traveling eastward had significantly more assists (EMM = 22.57, SE = 0.81, 95% CI [21.04, 24.21]) than those traveling westward (EMM = 19.91, SE = 0.69, 95% CI [18.61, 21.30]; z = 2.51, pHB = .02) and within the same time zone (EMM = 20.10, SE = 0.38, 95% CI [19.36, 20.86]; z = 2.86, pHB = .01). In addition, teams traveling eastward (EMM = 23.99, SE = 0.80, 95% CI [22.48, 25.61]) committed significantly more personal fouls (z = 2.87, pHB = .01) than those traveling within the same time zone (EMM = 21.53, SE = 0.39, 95% CI [20.79, 22.30]), and marginally more fouls (z = 2.08, pHB = .08) than teams traveling westward (EMM = 21.81, SE = 0.69, 95% CI [20.51, 23.20]).
Eastward traveling teams (EMM = 46.16%, SE = 0.86%, 95% CI [44.46%, 47.85%]) also had significantly higher field-goal percentages (z = 2.47, pHB= .04) than those traveling westward (EMM =43.29%, SE = 0.77%, 95% CI [41.79%, 44.80%]), and marginally higher percentages (z = 2.12, pHB = .07) than teams traveling in the same time zone (EMM = 44.11%, SE = 0.43%, 95% CI [43.27%, 44.96%]). There was also compelling evidence for the impact of time of day on three-point percentage, χ2[1] = 4.29, p = .04, such that teams playing evening games had higher three-point shooting percentages (EMM = 35.10%, SE = 0.49%, 95% CI [29.35%, 34.76%]) than those playing afternoon games (EMM = 32.06%, SE = 1.38%, 95% CI [34.15%, 36.06%]). Generally, teams playing afternoon games (EMM = 8.04, SE = 0.45, 95% CI [7.20, 8.98]) tended to have marginally more steals, χ2[1] = 3.22, p = .07, than those playing evening games (EMM = 7.21, SE = 0.15, 95% CI [6.91, 7.51]).
Although there was no significant omnibus interaction between direction of travel and time of day, the Holm-Bonferroni-corrected post-hoc tests revealed significant differences in team assists and field-goal percentage. Teams traveling eastward for evening games had significantly more assists than those traveling in the same time zone for such games (z = 2.94, pHB = .05), and higher field-goal percentages than teams traveling westward for evening games (z = 3.01, pHB = .04). In addition, there were several marginal differences within the interaction between direction of travel and time of day for points scored and rebounds. Specifically, teams traveling eastward for evening games scored generally more points than those traveling within the same time zone for such games (z = 2.85, pHB = .07). Finally, teams traveling westward for evening games tended to have fewer rebounds than teams playing evening games in the same time zone (z = 2.87, pHB = .06). Table 1 provides descriptive statistics for these analyses.
Table 1
Outcome Estimated Marginal Means Based on Direction of Travel and Time of Day
| Direction of Travel | Westward | Same time zone | Eastward | |||||||||
| Time of Day | Afternoon | Evening | Afternoon | Evening | Afternoon | Evening | ||||||
| Outcome | EMM (SE) | 95% CI | EMM (SE) | 95% CI | EMM (SE) | 95% CI | EMM (SE) | 95% CI | EMM (SE) | 95% CI | EMM (SE) | 95% CI |
| Winning Percentage | .357 (.145) | [.139,.656] | .385 (.052) | [.290,.490] | .533 (.081) | [.376,.684] | .329 (.032) | [.269,.395] | .324 (.15) | [.111,.647] | .427 (.053) | [.327,.533] |
| Points Scored | 97.49 (3.20) | [91.42, 103.96] | 100.43 (1.19) | [98.13, 102.79] | 100.01 (1.77) | [96.59, 103.55] | 99.80 (0.76) | [98.33, 101.3] | 104.98 (3.80) | [97.79, 112.71] | 103.92 (1.23) | [101.53, 106.37] |
| Field-Goal Percentage | 43.58 (1.44) | [40.75, 46.40] | 43.01 (0.53) | [41.98, 44.04] | 43.97 (0.79) | [42.42, 45.51] | 44.26 (0.34) | [43.59, 44.92] | 47.05 (1.64) | [43.83, 50.27] | 45.26 (0.54) | [44.21, 46.31] |
| Three-Point Percentage | 31.43 (2.57) | [26.39, 36.46] | 34.52 (0.94) | [32.68, 36.36] | 34.21 (1.40) | [31.46, 36.97] | 34.75 (0.60) | [33.57, 35.93] | 30.53 (2.93) | [24.79, 36.28] | 36.03 (0.96) | [34.16, 37.91] |
| Free-Throw Percentage | 75.09 (3.09) | [69.04, 81.14] | 76.53 (1.13) | [74.31, 78.74] | 77.40 (1.69) | [74.09, 80.71] | 75.72 (0.72) | [74.30, 77.14] | 74.78 (3.52) | [67.88, 81.69] | 75.21 (1.15) | [72.96, 77.47] |
| Offensive Rebounds | 8.90 (0.96) | [7.20, 11.00] | 10.55 (0.39) | [9.81, 11.35] | 10.02 (0.57) | [8.97, 11.19] | 9.78 (0.24) | [9.32, 10.26] | 9.79 (1.16) | [7.75, 12.36] | 9.80 (0.38) | [9.08, 10.58] |
| Defensive Rebounds | 33.06 (1.61) | [30.06, 36.36] | 33.50 (0.59) | [32.37, 34.68] | 32.32 (0.86) | [30.67, 34.05] | 31.91 (0.37) | [31.20, 32.64] | 34.59 (1.86) | [31.13, 38.42] | 32.60 (0.59) | [31.46, 33.78] |
| Total Rebounds | 41.96 (1.81) | [38.57, 45.66] | 43.96 (0.68) | [42.66, 45.31] | 42.12 (0.98) | [40.24, 44.10] | 41.69 (0.42) | [40.87, 42.52] | 44.36 (2.10) | [40.42, 48.67] | 42.42 (0.67) | [41.12, 43.76] |
| Assists | 19.56 (1.27) | [17.23, 22.21] | 20.26 (0.47) | [19.36, 21.21] | 19.85 (0.70) | [18.53, 21.26] | 20.35 (0.30) | [19.77, 20.95] | 23.10 (1.57) | [20.22, 26.39] | 22.04 (0.50) | [21.09, 23.04] |
| Steals | 9.07 (0.91) | [7.45, 11.05] | 7.47 (0.30) | [6.90, 8.07] | 7.36 (0.44) | [6.54, 8.28] | 7.09 (0.19) | [6.73, 7.46] | 7.79 (0.95) | [6.13, 9.89] | 7.07 (0.29) | [6.52, 7.67] |
| Blocks | 4.86 (0.71) | [3.65, 6.47] | 4.42 (0.24) | [3.97, 4.92] | 4.10 (0.34) | [3.47, 4.83] | 4.49 (0.16) | [4.19, 4.81] | 4.64 (0.77) | [3.35, 6.41] | 4.85 (0.26) | [4.37, 5.39] |
| Turnovers | 14.86 (1.39) | [12.37, 17.86] | 13.36 (0.47) | [12.47, 14.32] | 13.79 (0.73) | [12.43, 15.29] | 14.05 (0.32) | [13.45, 14.68] | 14.00 (1.54) | [11.29, 17.37] | 13.66 (0.49) | [12.73, 14.65] |
| Personal Fouls | 22.38 (1.32) | [19.95, 25.11] | 21.26 (0.47) | [20.36, 22.20] | 21.39 (0.70) | [20.06, 22.81] | 21.67 (0.30) | [21.09, 22.28] | 25.53 (1.60) | [22.57, 28.86] | 22.55 (0.49) | [21.61, 23.54] |
Note. EMM = Estimated Marginal Means. SE = Standard Error. CI = Confidence Interval.
According to the loglikelihood ratio tests, the models for time zones traveled illustrated meaningful overall associations with points scored (χ2[6] = 13.18, p = .04), assists (χ2[6] = 21.47, p = .002), and field-goal percentage (χ2[6] = 15.19, p = .02). The Holm-Bonferroni-corrected contrasts showed that teams traveling three time zones eastward had significantly more assists than those traveling westward one time zone (z = 3.65, pHB = .006) and within the same time zone (z = 3.58, pHB = .01; see Table 2). There were general differences whereby teams traveling eastward two (z = 2.82, pHB = .09) and three time zones (z = 2.98, pHB = .06) had marginally more assists than those traveling westward three time zones. Ultimately, teams traveling eastward one time zone had higher field-goal percentages than those traveling westward one time zone (z = 3.46, pHB = .01).
Table 2
Outcome Estimated Marginal Means Based on Time Zones Traveled
| Direction | Westward | Same time zone | Eastward | |||||||||||
| Time Zones Traveled | Three time zones traveled | Two time zones traveled | One time zone traveled | One time zone traveled | Two time zones traveled | Three time zones traveled | ||||||||
| Outcome | EMM (SE) | 95% CI | EMM (SE) | 95% CI | EMM (SE) | 95% CI | EMM (SE) | 95% CI | EMM (SE) | 95% CI | EMM (SE) | 95% CI | EMM (SE) | 95% CI |
| Winning Percentage | .444 (.136) | [.210,.699] | .312 (.071) | [.191,.464] | .440 (.077) | [.299,.591] | 0.359 (.030) | [.302,.421] | .449 (.078) | [.306,.602] | .354 (.070) | [.231,.501] | .575 (.146) | [.297,.813] |
| Points Scored | 102.61 (3.19) | [96.55, 109.05] | 101.56 (1.67) | [98.34, 104.89 | 97.82 (1.69) | [94.56, 101.19] | 99.80 (0.70) | [98.44, 101.18] | 103.65 (1.77) | [100.23, 107.19] | 104.30 (1.74) | [100.94, 107.77] | 104.42 (3.43) | [97.91, 111.35] |
| Field-Goal Percentage | 42.45 (1.39) | [39.71, 45.18] | 43.64 (0.73) | [42.20, 45.07] | 42.65 (0.76) | [41.16, 44.15] | 44.23 (0.31) | [43.62, 44.84] | 46.41 (0.77) | [44.89, 47.92] | 44.84 (0.76) | [43.35, 46.32] | 43.96 (1.49) | [41.04, 46.87] |
| Three-Point Percentage | 33.22 (2.50) | [28.32, 38.13] | 34.09 (1.32) | [31.51, 36.68] | 34.51 (1.37) | [31.82, 37.19] | 34.68 (0.56) | [33.58, 35.78] | 35.56 (1.38) | [32.85, 38.27] | 34.79 (1.36) | [32.13, 37.45] | 37.90 (2.67) | [32.66, 43.13] |
| Free-Throw Percentage | 78.18 (2.99) | [72.33, 84.04] | 74.80 (1.57) | [71.71, 77.88] | 77.58 (1.63) | [74.37, 80.78] | 75.93 (0.67) | [74.63, 77.24] | 73.91 (1.65) | [70.67, 77.15] | 75.50 (1.62) | [72.32, 78.68] | 79.08 (3.19) | [72.83, 85.33] |
| Offensive Rebounds | 12.35 (1.18) | [10.24, 14.90] | 10.95 (0.56) | [9.90, 12.10] | 9.19 (0.52) | [8.23, 10.26 | 9.79 (0.22) | [9.37, 10.23] | 9.53 (0.54) | [8.54, 10.64] | 10.01 (0.54) | [9.00, 11.14] | 10.11 (1.10) | [8.16, 12.51] |
| Defensive Rebounds | 32.78 (1.55) | [29.88, 35.97] | 32.94 (0.82) | [31.37, 34.58] | 34.16 (0.86) | [32.51, 35.89] | 32.00 (0.34) | [31.34, 32.67] | 33.49 (0.86) | [31.84, 35.23] | 32.68 (0.83) | [31.08, 34.35] | 30.57 (1.59) | [27.62, 33.85] |
| Total Rebounds | 45.13 (1.84) | [41.67, 48.88] | 43.90 (0.95) | [42.09, 45.80] | 43.13 (0.97) | [41.27, 45.07] | 41.75 (0.39) | [41.00, 42.52] | 43.02 (0.98) | [41.14, 44.98] | 42.70 (0.95) | [40.87, 44.61] | 40.71 (1.85) | [37.25, 44.50] |
| Assists | 19.75 (1.22) | [17.50, 22.28] | 20.88 (0.66) | [19.62, 22.22] | 19.65 (0.67) | [18.39, 21.00] | 20.25 (0.28) | [19.72, 20.80] | 22.15 (0.72) | [20.79, 23.60] | 21.33 (0.69) | [20.02, 22.72] | 25.18 (1.48) | [22.45, 28.26] |
| Steals | 8.97 (0.88) | [7.40, 10.87] | 7.80 (0.43) | [7.01, 8.69] | 7.10 (0.42) | [6.33, 7.97] | 7.12 (0.17) | [6.79, 7.46] | 7.03 (0.42) | [6.25, 7.91] | 7.49 (0.43) | [6.70, 8.38] | 6.31 (0.76) | [4.99, 7.99] |
| Blocks | 4.83 (0.69) | [3.65, 6.39] | 4.38 (0.34) | [3.76, 5.10] | 4.48 (0.35) | [3.84, 5.22] | 4.42 (0.14) | [4.15, 4.71] | 4.54 (0.36) | [3.89, 5.31] | 4.95 (0.37) | [4.27, 5.73] | 5.49 (0.79) | [4.14, 7.28] |
| Turnovers | 13.39 (1.24) | [11.17, 16.05] | 14.29 (0.69) | [13.01, 15.71] | 12.74 (0.66) | [11.50, 14.11] | 14.01 (0.29) | [13.45, 14.59] | 13.19 (0.69) | [11.91, 14.61] | 14.44 (0.72) | [13.09, 15.92] | 12.73 (1.28) | [10.45, 15.50] |
| Personal Fouls | 20.9 (1.24) | [18.60, 23.49] | 22.17 (0.67) | [20.89, 23.52] | 20.75 (0.67) | [19.48, 22.11] | 21.60 (0.28) | [21.06, 22.16] | 21.95 (0.70) | [20.62, 23.36] | 23.19 (0.71) | [21.85, 24.62] | 24.88 (1.46) | [22.18, 27.90] |
Note. EMM = Estimated Marginal Means. SE = Standard Error. CI = Confidence Interval.
3.1Specificity analyses of evening games
Similar regression analyses controlling for home and away team playoff seeds with Holm-Bonferroni post-hoc tests were performed to examine the impact of playing games in the afternoon or evening only. Results for evening games were generally consistent with the overall analyses. Specifically, teams traveling eastward scored more points (EMM = 103.93, SE = 1.25, 95% CI [101.51, 106.41]) than those traveling in the same time zone (EMM = 99.84, SE = 0.78, 95% CI [98.33, 101.37]; z = 2.78, pHB = .02); had more assists (EMM = 22.07, SE = 0.50, 95% CI [21.10, 23.08]) than teams traveling westward (EMM = 20.27, SE = 0.47, 95% CI [19.36, 21.22]; z = 2.60, pHB = .02) and in the same zone (EMM = 20.37, SE = 0.31, 95% CI [19.77, 20.98]; z = 2.91, pHB = .01); and higher field-goal percentages (EMM = 45.28%, SE = 0.54%, 95% CI [44.23%, 46.34%]) than westward bound teams (EMM = 43.05%, SE = 0.53%, 95% CI [42.01%, 44.09%]; z = 2.95, pHB = .01).
In terms of time zones traveled, eastward bound teams traveling three time zones had significantly more assists (EMM = 25.20, SE = 1.49, 95% CI [22.43, 28.30]) than those traveling westward one time zone (EMM = 19.61, SE = 0.71, 95% CI [18.27, 21.05]; z = 3.59, pHB = .007) and within the same time zone (EMM = 20.35, SE = 0.30, 95% CI [19.76, 20.95]; z = 3.46, pHB = .01). In addition, teams traveling eastward three time zones had marginally more assists than those traveling westward three time zones (EMM = 19.74, SE = 1.22, 95% CI [17.48, 22.29]; z = 2.97, pHB = .06) and eastward two time zones (EMM = 20.85, SE = 0.73, 95% CI [19.47, 22.33]; z = 2.79, pHB = .09). Lastly, teams traveling eastward one time zone for evening games had higher field-goal percentages (EMM = 46.41%, SE = 0.82%, 95% CI [44.81%, 48.01%]) than those traveling westward one time zone (EMM = 42.37%, SE = 0.82%, 95% CI [40.78%, 43.97%]; z = 3.50, pHB = .01).
3.2Specificity analyses of afternoon games
For afternoon games, a single significant difference in direction of travel was detected in the Holm-Bonferroni-corrected post-hoc tests, whereby teams traveling eastward (EMM = 25.73, SE = 1.63, 95% CI [22.73, 29.13]) committed more personal fouls (z = 2.59, pHB = .03) than those playing in the same time zone (EMM = 21.39, SE = 0.70, 95% CI [20.06, 22.80]). A marginal difference in steals (z = 2.15, pHB = .09) surfaced such that teams traveling westward had generally more steals (EMM = 9.25, SE = 0.88, 95% CI [7.68, 11.14]) than those traveling in the same time zone (EMM = 7.28, SE = 0.41, 95% CI [6.52, 8.13]). Among time zones traveled, there was a sole significant difference (z = 3.30, pHB = .01) in steals such that teams traveling westward two time zones (EMM = 11.26, SE = 1.33, 95% CI [8.94, 14.20]) had more steals than those traveling in the same zone for afternoon games (EMM = 7.26, SE = 0.41, 95% CI [6.50, 8.10]).
4Discussion
Adjustment to travel and time changes appear to influence in-game performances during the NBA playoffs. Teams traveling eastward had more assists, committed more personal fouls, and achieved higher field-goal percentages than teams traveling westward. Among evening games, teams traveling eastward scored more points than those who traveled within the same time zone. These findings are relatively consistent with the results from previous studies indicating that there is an advantage for teams traveling eastward and a disadvantage for teams traveling westward. Our study also supports findings by Roy and Forest (2018) such that the number of time zones in addition to eastward or westward travel affects the strength of the advantage or disadvantage for teams. In our study, traveling eastward three time zones yielded more assists than traveling eastward two time zones. However, we also found that personal fouls increased with eastward travel, which can be viewed as a negative outcome for teams. Nevertheless, fouls are often strategically used during the end of close games to grant trailing teams more possessions. The goal of such intentional fouls is to commit these against opposing players who are poor free-throw shooters in the hopes of mounting a comeback late in a game (Caudill, Mixon, & Wallace, 2014). Thus, the complexities of personal fouls require further study. We suggest future research parse out intentional or strategic-type fouls from pure defensive errors in order to better evaluate their relationship to travel.
Circadian rhythm misalignment clearly affects the overall performance of professional athletes. Findings by Song, Severini, and Allada (2017) concluded that the impact of circadian misalignment in Major League Baseball (MLB) players due to jet lag can be detected in home runs allowed. Naturally, there is also variation among individual performance when isolating circadian rhythm effects, which indicates that circadian disruption can produce different performance results (Kline, 2006). Our study judges the effects of circadian misalignment mainly through jet lag and schedule demands in seven-game series in the NBA. It differs from previous research in that we are measuring performance outcomes that the team is active in producing such as scoring, assists, steals, and the like. Our study supports findings that teams playing closer to their circadian peak had an advantage when heading into a playoff game (Smith, 2013, Thun, 2015). However, we acknowledge that our results are limited by the lack of actual sleep data. Previous research by Mah, Mah, Kezirian, and Dement (2011) on collegiate basketball players showed that sleep extension can produce positive effects in reducing their reaction and sprint times, while raising their shooting percentages. If available, it would be useful to consider sleep duration as a factor when examining not only team performance, but also individual player performance.
Future directions for this research may involve observing the circadian influence in only championship rounds of the NBA and other sports league’s playoffs to better address how extended rest could play a role in travel and time of play. In our study though, we were limited by two teams being overrepresented in the Finals during the period examined (i.e., the Cleveland Cavaliers and Golden State Warriors). We encourage prospective research to perform more comprehensive investigations that both account for varying playoff formats over time and capture a greater proportion of teams in a particular sports league. In addition, other variables like injury, illness, and other absenteeism should be addressed in determining the role that the circadian rhythm plays in not only wins, but also in-game performance metrics. Furthermore, it would be beneficial to note which players experienced injury or reported symptoms after travel between time zones. Another direction to take this work would be to analyze which travel conditions create the fewest advantages or disadvantages to provide a solution for greater parity in game scheduling. Future work could also compound this with other factors like data on fan attendance during certain days of the week and times in the day. Reworking the league schedule is a difficult task due to many factors, but changes could rectify and mitigate issues in travel and fatigue risks.
Overall, the circadian rhythm can be shifted, and there are countermeasures (e.g., changing practice schedules, enhanced lighting, caffeine, etc.) to prevent or at least reduce the negative effects associated with circadian misalignment. Some individual teams and players in the NBA have acknowledged the effect of sleep and circadian disruption. For example, players like LeBron James, Tobias Harris, Andre Iguodala, CJ McCollum, and Kent Bazemore have publicly recognized the influence of sleep (Holmes, 2019). Thus, it may be useful for teams to proactively begin pre-adapting their biological clocks in order to better prepare for travel. As the research continues to link sports performance and sleep, teams must consider the influence of circadian misalignment, as their seasons could be made or broken by these elements.
Acknowledgments
The authors would like to thank Dr. Erin Flynn-Evans and Kevin “KG” Gregory for their thoughtful insights on this manuscript.
References
1 | Block, J. and Kuckertz, A. , (2018) , Seven principles of effective replication studies: strengthening the evidence base of management research, Management Review Quarterly, 68: , pp. 355–359. |
2 | Brager, A.J. and Mistovich, R.J. , (2017) , Game times and higher winning percentages of west coast teams of the National Football League correspond with reduced prevalence of regular season injury, The Journal of Strength & Conditioning Research, 31: (2), pp. 462–467. |
3 | Caudill, S.B. , Mixon, F.G. and Wallace, S. , (2014) , Life on the red carpet: star players and referee bias in the national basketball association, International Journal of the Economics of Business, 21: (2), pp. 245–253. |
4 | Cullen, A.C. and Frey, C.H. , 1999, Probabilistic techniques in exposure assessment: A handbook for dealing with variability and uncertainty in models and inputs, Springer Science & Business Media. |
5 | Delignette-Muller, M.L. , Dutang, C. , Pouillot, R. and Denis, J.B. , (2014) , fitdistrplus: An R package for fitting distributions, Journal of Statistical Software, 64: (4), pp. 1–34. |
6 | Gallucci, M. and Love, J. , 2018, Introducing GAMLj: GLM, LME and GZLMs in jamovi, [Computer software]. Retrieved from https://blog.jamovi.org/2018/11/13/introducing-gamlj.html |
7 | Golliver, B. , 2013, NBA Board of Governors unanimously adopts 2-2-1-1-1 Finals format change, Sports Illustrated, Retrieved from https://www.si.com/nba/2013/10/23/nba-finals-formatdavid-stern-adam-silver-board-of-governors |
8 | Holmes, B. , 2019, NBA exec: ‘It’s the dirty little secret that everybody knows about’. ESPN. Retrieved from https://www.espn.com/nba/story//id/27767289/dirty-little-secret-everybody-knows-about |
9 | Kay, K. , Dolcy, K. , Bies, R. and Shah, D.K. , (2019) , Estimation of solid tumor doubling times from progression-free survival plots using a novel statistical approach, The AAPS Journal, 21: (2), pp. 1–12. |
10 | Kline, C.E. , Durstine, J.L. , Davis, J.M. , Moore, T.A. , Devlin, T.M. , Zielinski, M.R. and Youngstedt, S.D. , (2006) , Circadian variation in swim performance, Journal of Applied Physiology, 102: (2), pp. 641–649. |
11 | Mah, C.D. , Mah, K.E. , Kezirian, E.J. and Dement, W.C. , (2011) , The effects of sleep extension on the athletic performance of collegiate basketball players, Sleep, 34: (7), pp. 943–950. |
12 | Pycior, S. , 2018, Nylon Calculus: A 2-3-2 format reduces travel concerns with playoff reseeding, Fansided, Retrieved from https://fansided.com/2018/07/16/nylon-calculus-travel-playoff-format-reseeding/amp/%7B%7B%20url/ |
13 | Reilly, T. , (2009) , The body clock and athletic performance, Biological Rhythm Research, 40: (1), pp. 37–44. |
14 | Roy, J. and Forest, G. , (2018) , Greater circadian disadvantage during evening games for the National Basketball Association (NBA), National Hockey League (NHL) and National Football League (NFL) teams traveling westward, Journal of Sleep Research, 27: (1), pp. 86–89. |
15 | RStudio Team, (2020) , RStudio: Integrated Development for R. [Computer Software]. RStudio, PBC, Boston, MA. Retrieved from http://www.rstudio.com/ |
16 | Serin, Y. and Acar Tek, N. , (2019) , Effect of circadian rhythm on metabolic processes and the regulation of energy balance, Annals of Nutrition and Metabolism,, 74: (4), pp. 322–330. |
17 | Smith, R.S. , Efron, B. , Mah, C.D. and Malhotra, A. , (2013) , The impact of circadian misalignment on athletic performance in professional football players, Sleep, 36: (12), pp. 1999–2001. |
18 | Song, A. , Severini, T. and Allada, R. , (2017) , How jet lag impairs Major League Baseball performance, Proceedings of the National Academy of Sciences of the United States of America, 114: (6), pp. 1407–1412. |
19 | Teo, W. , Newton, M.J. and McGuigan, M.R. , (2011) , Circadian rhythms in exercise performance: Implications for hormonal and muscular adaptation, Journal of Sports Science & Medicine, 10: (4), pp. 600–606. |
20 | The jamovi project, 2020, jamovi (Version 1.2.3) [Computer Soft- 457 ware]. Retrieved from https://www.jamovi.org |
21 | Thun, E. , Bjorvatn, B. , Flo, E. , Harris, A. and Pallesen, S. , (2015) , Sleep, circadian rhythms, and athletic performance, Sleep Medicine Reviews, 23: , pp. 1–9. |
22 | Walker, R.M. , James, O. and Brewer, G.A. , (2017) , Replication, experiments and knowledge in public management research, Public Management Review, 19: (9), pp. 1221–1234. |


