
Cricket mix optimization using heuristic framework after ensuring Markovian equilibrium
Abstract
International Cricket Council, in consultation with its member boards, prepares the Future Tours and Programme (FTP) which is an eight year long itinerary covering world championships in three formats of cricket, bilateral series and other tournaments. However, the FTP (2015–2023) had been criticized for its asymmetric itinerary and the point system for World Test championship and the FTP (2023–2031) is being criticized for including eight championships in limited formats and enhanced workload for players. Cricket mix standardization like marketing and product mix can work in homogeneous markets. This study derives three homogeneous markets of four teams each using hierarchical cluster analysis. For each market, it finds out the Markovian equilibrium analyzing cricket mix transition over past years. While the same can be used to derive the number of games per format per country, the study proposes a heuristic approach for fine tuning the same taking care of major stakeholders’ (e.g. Administrators, Players and Spectators) aspirations. Despite scores of criticisms and articles on the issue, there is hardly any scholastic contribution on game scheduling in the extant literature. This study thus is a pioneering effort in helping the policy makers to create a balance between cricket formats within each homogeneous market.
1Background
The game of cricket has over five hundred years of legacy with International Cricket Council (ICC) being the apex body regulating it since 1909. Currently there are three ICC recognized international formats namely, Test, ODI and T20I and 104 ICC affiliated member countries (International Cricket Council, n.d.). Out of these only twelve elite countries play all the three formats whereas rest can play limited over cricket i.e. ODI and T20I.
The underlying rules of all these 3 formats are same and have some similarities with the game of baseball. The game is played between two teams consisting of 11 players each where the batting team attempts to score as much runs as possible against a fielding team until the innings terminates. There is a role reversal between the batting and bowling teams in the next innings. A bowler on the fielding team “bowls” in groups of six deliveries referred to as overs. Overs are bowled alternatively from two ends of the pitch. At any point, two batsmen of the batting team occupy the two ends of the pitch, called the crease. The striker batsman tries to score runs by hitting the bowled ball with a bat. Runs are scored by running between the two stumps located at opposite ends of the pitch. Runs are counted by the number of times the striker and non-striker interchanges their ends and they can run anything between 0,.., 3. If the batsman can hit the ball out of the boundary, he gets a 4 and scores 6 runs for clearing the boundary without a bounce inside. A loss of a wicket, also called out can occur in various ways with the three most common being a) the ball is caught in midair after being hit by the batsman, b) the ball hits the stump located behind the batsman as he fails to hit it and c) a batsman is run-out if the fielding team breaks the stump before the any of the two batsmen reaches the corresponding crease. When a wicket is lost, a new batsman is introduced in the batting order. An innings terminates when all 10 wickets are lost (one batsman remains ‘not out’ as there is no one at the other end of the pitch). A test match is played over 5 consecutive days, each day permitting 90 overs to be bowled where each team bats for 2 innings alternatively. At the end, the team wins which scores more runs than the other team after successfully terminating their both the innings. However, there is a possibility of a draw if the other teams’ both innings are not terminated. On the contrary, the limited over versions e.g. ODI and T20I are played over one inning per side consisting of 50 overs and 20 overs respectively. Here also the team wins which scores more runs than the other side in the stipulated overs before being all out and by design, these formats ensure a ‘result’. This is a very brief introduction to the rules of the game; more detail on the rules (laws) of cricket can be found in http://www.lords.org or http://www.wisden.com.
Test matches provide the ultimate test for skill, resolve, patience, tenacity and endurance over five days and at times it provides a larger than life portrayal of struggle, agony, enjoyment, strategy and above all, skill (Holding, 22 September 2017; Brearley, 17 December 2017). However, test matches seem to lose its charm in this era of break neck speed to limited overs cricket, especially T20I. With decrease in number of overs, the shortened game has created a more level playing field thus is becoming more competitive and unpredictable in nature. This, in turn, has provided lot of entertainment and excitement to its viewers seeking much less amount of their time commitment. More viewership had led to lucrative media rights and sponsorships which led to salary explosion of players and a flourishing industry around the game. The lure of big money made cricketers including the budding ones embrace this shortened format. Even established cricketers are retiring from Tests to lengthen their T20 career. Mass acceptance of T20 was epitomized by the success of the franchise based Indian Premier League (IPL) started by BCCI in India in 2008 (Kohli, 2011). Reaching a brand value of US $6.3 billion (Gupta, 2018), the success of IPL has almost changed the cricket ecosystem. Buoyed by IPL‘s success, other countries are mimicking the franchise based format. Cricket has transitioned from winter sports to an all season sport barring rainy and snowy conditions. However, cricket pundits are of the opinion that T20 will have value only if Test Cricket survives (Ganguly, 22 September 2016).
Stakeholder analysis (Ray, 2021) revealed that players, fans and administrators are the key stakeholders in the game; others like sponsor, media, accessory manufacturers etc. are mere consequences. While the players long for a lengthy and worthy career, the fans crave for excitement especially out of closeness of competition and uncertainty of outcome. The administrators look for spreading cricket worldwide, vie for making this an Olympic sport and are responsible for creating a sustainable ecosystem. IPL or similar franchise based leagues or simply the T20 foot the bill for all the stakeholders and hence are immensely popular.
As per ICC’s first ever market survey (Media Release, 2018), the fan count has exceeded the billion mark and 70, 88, 92 per cent fans globally are interested in Test, ODI and T20I cricket respectively. This only ensures that there are ‘markets’ for all three ‘products’ of ICC. Since ICC prepares the itinerary in consultation with country boards (e.g. BCCI, CA, ECB etc.), it decides which country plays how much of each format; discussed in the next section.
2The issues
Over the past 5–6 years, it is seen that the top test playing countries (barring Zimbabwe and newest elite entrants Afghanistan and Ireland) on an average plays 60 days to 100 days of cricket per year combining all three formats. This is to accommodate various factors like fairly lengthy domestic cricket, franchise based cricket (e.g. IPL, BBL etc.) and also recuperation for players in a year apart from market demand and weather condition. The years which host world cups for ODI or T20I, see a spike in those formats at the cost of others. To streamline the roster, ICC has started preparing the Future Tours and Programme (FTP) which is an eight-year planning on itinerary especially involving the twelve test playing countries. ICC started World Test Championship (WTC) since July 2019 (thus making cricket the only game having three world championships for three formats) in its FTP (2015–2023) to boost the sagging interest in test cricket. However, the itinerary and the point system had raised many questions as they are asymmetric. Neither all the teams play against each other nor there is any balance between number of home and away matches nor does each test match carry the same weight. Rather a two test match series carry the same 120 points as a five test match series making each game carry a maximum of 60 points to a minimum of 24 points. A close look at the itinerary reveals that England plays 22 matches whereas New Zealand plays 14 as part of WTC during 2019–23. There are just two series of five matches (both involving England versus Australia and India). There are two series of four matches and eight series of three matches and fifteen series of two matches (Atherton, 21 November 2019).
Eminent cricket personality Mike Atherton had attributed the same to retrofitting of WTC within the existing FTP as the decision for WTC was taken much later. However, this arrangement allowed each country choosing a total of six series (3 at home and 3 away) for consideration for WTC and the same triggered proliferation of 2 match series that weakens test cricket rather than promoting and popularizing it, according to Atherton (21 November 2019). New Zealand captain Kane Williamson (The Telegraph, 21 February 2020) termed the point system to be unfair even though he considered WTC to be a step in the right direction. Indian cricket captain Virat Kohli (The Telegraph, 10 October 2019) recommended double the points for an away test win. While appreciating WTC for bringing in lot of context to test cricket, Kohli cautioned that public entertainment shouldn’t be the sole objective of test cricket (Banerjee, 23 November 2019). Legendary West Indian fast bowler Michael Holding (Banerjee, 23 November 2019) agreed to Kohli’s view that test cricket is the most important format and it should be played for sheer joy of playing cricket and executing skills. Ex-Indian captain Mohammad Azharuddin (The Telegraph, 24 November 2019) and former Indian opener Arun Lal (Gupta, 6 December 2019) lamented the huge gap between first four and rest of the test teams yielding skewed results. Cricket Journalist Sudipto Gupta (6 December 2019) concluded that percentage of innings defeats had gone up from 19 percent in 2017 to 33 percent in 2019. According to him, any sport blooms with close contests rather than one-sided and predictable affairs. Former Indian captain Dilip Vengsarkar (Gupta, 23 November 2019) is critical about the WTC as 2/3 match series does not provide enough challenge to face or opportunity to beat Australia in Australia or England in England. Modern day great Sachin Tendulkar (The telegraph, 15 November 2019) opined that test cricket thrives in rivalries like Don Bradman vs Harold Larwood, Brian Lara or Steve Waugh vs Curtly Ambrose and Sachin Tendulkar vs Shane Warne or Glenn McGrath. He suggested linking teams’ performances with number of tests in a series; a better team should play more tests than an ordinary team in his opinion.
ICC recently drafted an FTP for 2023–2031 (Majumdar & Mitra, 10 January 2020) provisioning eight global limited over tournaments (T20 Champion’s Cup (2024, 28), ODI Champion’s Cup (2025, 29), T20 World Cup (2026, 30) and ODI World Cup (2027, 31)) instead of six during FTP for 2015-23. This had been tabled for discussion during the ICC’s board meeting in Dubai from Mar 27 to 29, 2020. ECB (The Telegraph, 10 November 2019) joined BCCI and CA in protesting the same citing three reasons viz. a) the bilateral engagements will be compromised, b) workload will adversely affect health and life of the players and c) additional limited over tournament may take the shine out of WTC which is to run twice with 4 years span during 2023-31. Questions are also being raised for lack of window for hosting franchise leagues like IPL and Big Bash (Majumdar & Mitra, 10 January 2020). Former ICC chairman Ehsan Mani (2009) commented that with more than 100 members, ICC’s aim should be to enhance ‘quality and playing standards’ rather than bringing in new countries under ICC ambit.
The present paper addresses the research question - how the cricket administrators can strike a balance between 3 formats of cricket keeping in view of cricketers’ aspiration and viewers’ expectation? In doing so one should also try to standardize the roster such that annually every team plays each format certain number of days and each game has a ‘context’. For example, Grand Slams in Tennis, European Soccer Leagues, Major Leagues in Baseball or Soccer in USA follow a standard annual calendar. For the context part, one has to focus on close encounters that can promote ‘uncertainty of outcome’ and the overall value generated by each game; discussed in next section.
3Methods
The study does a volumetric analysis (Section 4) to see how cricket mix (defined as what proportion of cricket is played for each format per year) had changed over time and with IPL starting in 2008. Section 5 does an analysis on how teams fared in three formats and establishes the fact that the skill requirements for all the formats are not the same. In absence of any related literature in cricket or sports, the present study is grounded on the theory of marketing which suggests standardization of marketing mix can be applied in homogeneous markets (Schuh, 2000) and the same is elaborated in Section 6. Most research in marketing mix standardization has concentrated on two aspects namely, products and advertising. In cricket parlance, this translates to how these three formats (i.e. products) can reach the masses (including quantity, quality and advertisements) within each homogeneous market. In order to find out homogeneous markets, Hierarchical cluster analysis (HCA) has been applied. In HCA, each subject is characterized by certain attributes (in this case each test playing country is a subject and they have ability related attributes like ranking in Test, ODI and T20I as of 2018–19 and overall popularity of cricket). It then uses the distance measure to build clusters in such a manner that subjects within a cluster are as close as possible and subjects across clusters are as far as possible. HCA results in clusters of teams such that within a cluster the teams are close to each other with respect to their cricketing ability and popularity of the game.
In order to find out the cricket mix for each homogeneous cluster, the idea of Markov Chain (MC) principles has been borrowed and elaborated in Section 7. Assuming limited number of days of cricket played per year per cluster, two consecutive past 4 years’ average cricket mix (2015–19 and 2016–20 for smoothening the spikes due to T20 and ODI world cups in between) is first calculated. Next the transition matrix is simulated from these two cricket mix vectors assuming reduction of any format leads to the gain in other format and vice versa. The study then finds out the equilibrium condition when the share of each format freezes, called the steady state (i.e. gain and loss for each format eventually nullifies each other). For each cluster, the same leads to the derivation of cricket mix at the steady state. The result suggests the top tier to concentrate more on tests and carry the mantle of test matches whereas the other two tiers focus more on ODI and T20I respectively. This mix is going to help bringing in standardization in the roster.
However, a) whether this mix is rich in context and b) a platform for fine tuning the same, if required have been discussed in Section 8. This is done by calculating total ‘value’ generated by such a cricket mix using heuristic approach. Considering the major stakeholders’ aspirations e.g. Players (acquiring skill, balance in work life, longevity, income), Spectators (thrill, skill, time and / or money spent), and Administrators (spreading the game, maintain the whole ecosystem, developing the infrastructure), the concept of value has been coined, not necessarily measured in monetary terms. For every cluster, for every format of the game, how much value each game is going to generate with respect to the Players, Spectators and Administrators is collected through an expert survey. By tuning the cricket mix and / or total number of days of cricket one can attempt to fulfill a target set for each stakeholder.
The study ends with the conclusion and discussion in Section 9. Since country maturity is an important factor for planning the cricket mix, classifying the countries with respect to ability and relative popularity of the game is innovative. Similarly, for each cluster of homogeneous countries, finding out the steady state cricket mix using the concept of MCA has its novelty. Finally, application of heuristics to fine tune the theoretical cricket mix suiting various business targets is an innovative application of what if analysis that adds to the extant body of knowledge.
4Volumetric analysis of cricket mix
Data Visualization technique was employed to understand the change in cricketing mix of all countries, in general and India, in particular. Data was collected on the total volume of test, ODI and T20I cricket (counting 5 days for each test and 1 day for each ODI and T20I) played by all countries (referred to as ‘overall’ statistics) from secondary source (http://www.espncricinfo.com) during the period 1.1.1998 to 31.12.2017. Similar data was gathered exclusively for India to see the effect of franchise based IPL, many consider a major disruption. Figures 1–2 represent 100 percent stacked area charts for all countries and India alone respectively where the X-axis represents Year and the Y-axis represents percentage of test, ODI and T20I in terms of number of days played in a year.
Fig. 1
100 percent Stacked Area Chart of overall Test, ODI and T20I participation.
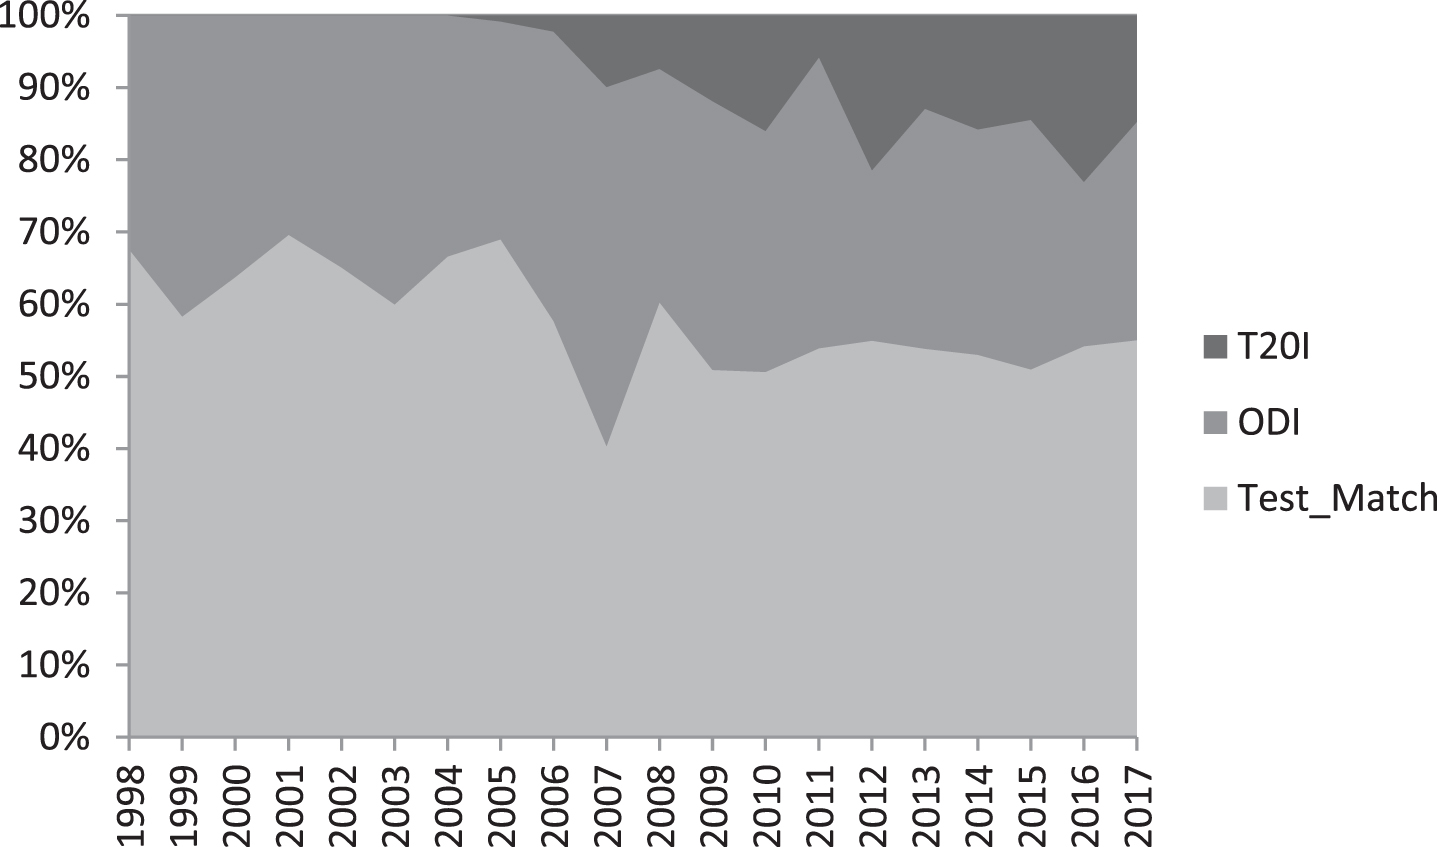
Fig. 2
100 percent Stacked Area Chart of India’s Test, ODI and T20I participation.
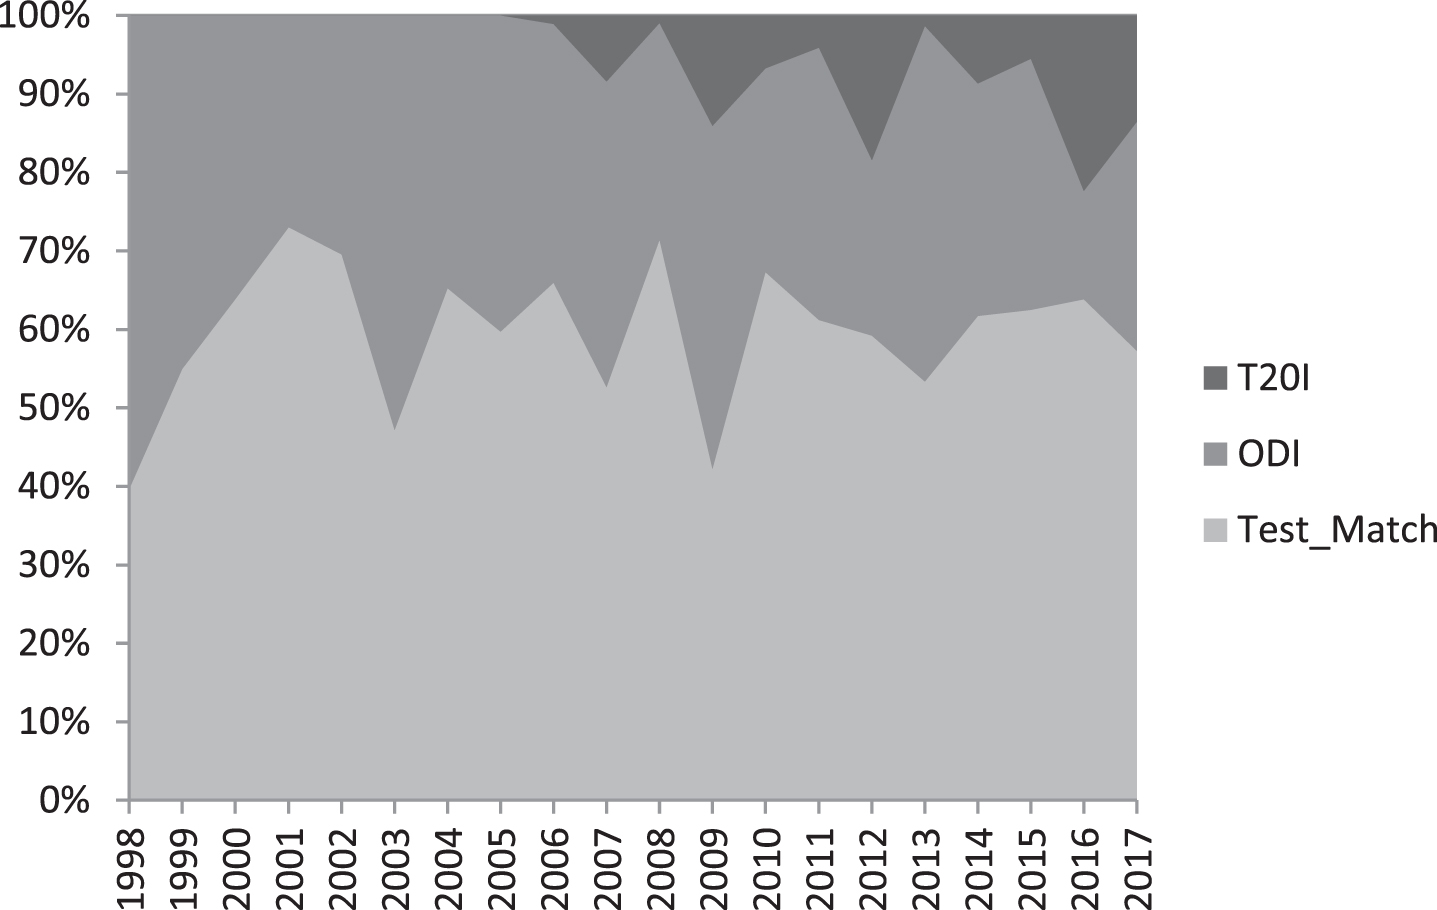
It is observed that overall the “volume of test cricket” has gone down from an average of 61.68 percent between 1998 and 2007 (the pre-IPL era) to 53.7 percent between 2008 and 2017 (the post-IPL era). The same for India reflects no major change i.e. 60.4 percent to 60.78 percent. Point to note here is whereas only 1 test country was added (to make it 10), as many as 12 new entities started playing ODI (to make it 26) and all these 26 countries started playing T20I during this period of data analysis.
Overall total amount of International cricket played has increased from 3761 days to 4041 days from pre-IPL to post-IPL era; for established Test playing country like India, the figure changed from 803 to 872 days. However, induction of lot of associate countries into shorter format had made the overall percentage of test cricket decline substantially. From all the charts, it is apparent that T20I had “eaten up” share of ODI –while T20I is increasing, volume of ODI is decreasing. Comparing pre-IPL to post-IPL, the ODI percentage has gone down from 36.98 to 31.8 for overall and from 38.48 to 29.82 for India.
5Team progression across formats
It is pertinent to see how the countries have progressed in 3 formats of cricket. Table 1 presents a consolidation of ICC rankings in three formats and champion countries in ODI and T20I during Aug, 2006 and Sep, 2019. T20 World Cup started in 2007; however ranking data for T20 is available only since Sep 2011.
Table 1
ICC rankings in three formats and World cup champions in ODI and T20I
| Time Reference | Top ranked nation | World Cup Champion | |||
| Test | ODI | T20I | ODI | T20I | |
| August 2006 | Australia | Australia | NA | ||
| August 2007 | Australia | Australia | NA | Australia | India |
| August 2008 | Australia | Australia | NA | ||
| August 2009 | Australia | South Africa | NA | Pakistan | |
| November 2010 | India | Australia | NA | England | |
| September 2011 | England | Australia | England | India | |
| September 2012 | South Africa | England | South Africa | West Indies | |
| January 2014 | South Africa | Australia | Sri Lanka | ||
| September 2014 | South Africa | India | Sri Lanka | Sri Lanka | |
| September 2015 | South Africa | Australia | Sri Lanka | Australia | |
| September 2016 | Pakistan | Australia | New Zealand | West Indies | |
| September 2017 | India | South Africa | New Zealand | ||
| September 2018 | India | England | Pakistan | ||
| September 2019 | India | England | Pakistan | England | |
(Source: https://www.icc-cricket.com/rankings/mens/team-rankings for test, odi and t20i).
A close look at Table 1 reveals that Australia, India and South Africa had kept the top positions in test for 12 out of 14 years of ranking. In ODI, Australia remained on top on 8 occasions and England accounted for 3 years. In T20I, 5 countries shared the honors over 9 years. While there were only 5 swaps in topmost position among 5 countries in test, as many as 9 swaps happened among 4 countries in ODI over 14 years. For T20I, in 9 years there were 4 swaps among 5 countries. It can be concluded that test is less “fickle” than the limited overs cricket as far as ranking is concerned. The same is seconded by the championship record as no team could defend championship in both T20I and ODI. Also no country held the pinnacle position simultaneously in all three formats and no country remained champion in the two limited over formats concurrently. This highlights separate skill requirements for three formats.
6Identifying homogeneous cricket regions
Analyses in Sections 4 and 5 demonstrate that the cricket mix is changing with induction of new formats and new countries and skill requirement is different for different formats with minnows stand a better chance of doing well in the shortest version (e.g. T20I world cup winners West Indies, Sri Lanka, Pakistan). This leads to the question whether all 12 elite test playing countries should be subjected to similar cricket mix? In absence of any related literature in cricket or sports, the present study is grounded on the theory of marketing mix –a mix of marketing policies and procedures to produce a profitable enterprise (Borden, 1964). He had mentioned twelve determinants of marketing mix, namely Product Planning, Pricing, Branding, Channels of Distribution, Personal Selling, Advertising, Promotions, Packaging, Display, Servicing, Physical Handling and Fact Finding and Analysis. While elaborating on Product Planning, he took into account a) consumers’ buying behavior (buying power, buying habit, living habit etc.), b) the trade’s behavior (mainly wholesalers’ and retailers’ behavior), c) competitors’ position and behavior (e.g. size, number and strength of competitors) and d) governmental behavior (especially regulations over products, pricing etc.) as market forces that have bearing on the marketing mix.
Drawing a parallel with cricket –the game is followed by a billion viewers across the globe with high concentration in the Asian countries (Media Release, 2018). With ever increasing digital footprint, economically the game earns a lot by selling the TV, internet and media rights (Kalra, 5 September 2017). The game is regulated by ICC and its country counterparts like BCCI, CA, ECB etc. and in each territory the competition to get a mindshare is between three formats of cricket and the other sports, popular in that region.
While standardizing the marketing mix, one can expect delivery of potentially higher profits; Samiee & Roth (1992) challenged this contention to be generically true. However, Schuh (2000) found that firms can achieve higher profits by implementing standardization strategies in homogeneous markets. Program and process are the two fundamental components for marketing mix standardization (Jain, 1989, Sorenson & Wiechmann, 1975). While program refers to the creation and development of the marketing mix components (Griffith, Hu & Ryans, 2000), Jain (1989) concluded that process, should focus on how the program is supported, appraised and realized. Since marketing mix standardization is concentrated on products and advertising, the cricket equivalent will be to find out how the three formats (i.e. products) can reach the masses (dealing with quantity, quality and advertisements)?
Solberg (2000) identified three moves for marketing mix standardization by the Headquarters (HQ) namely, a) HQ intends to improve the operating margins by standardizing marketing components, b) HQ tries to develop a strong knowledge base of local market conditions directly rather than relying on subsidiaries and c) HQ aspires to develop an esprit de corps throughout the entire organization to effectively implement a marketing standardization program across borders (Hannerz, 1990, Baldauf, Cravens & Grant, 2002). Kustin (2004) showed marketing mix standardization is more likely to happen when consumer perceptions are more similar and program standardization is possible within culturally similar countries.
In the realm of cricket, ICC, the HQ of cricket had constantly endeavored for standardization of cricketing mix across top countries through FTP by ensuring each play bi-lateral series and global tournaments. However, two questions arise - are the players and spectators ready for it? As former India opener Arun Lal (Gupta, 6 December 2019) lamented the lack of competition and commented that cricket desperately need the Pakistan, West Indies, South Africa and Sri Lanka of old. Wakefield & Blodgett (1999) found out that closeness of competition is very important as that provides excitement, the end goal of a consumer for watching a sporting event. An empty gallery during test in a sharp contrast to full house during T20 engagements reflects preference of spectators.
In order to investigate homogeneous markets, two parameters hold paramount importance –ability of a nation and popularity of the game in that nation. These often translate into interest and participation by players, media and spectators. To classify twelve test playing nations on the basis of ability, their latest ranking (2018-19) in Test, ODI and T20I were collected from the official ICC site (www.icc-cricket.com). The popularity of cricket with respect to other games was noted in these countries primarily using secondary sources (via Google search).
6.1Hierarchical cluster analysis (HCA)
Later HCA was applied to decipher patterns of each nation. The HCA resulted as follows:
1 Cluster I: India, Australia, England and New Zealand
2 Cluster II: South Africa, Pakistan, Sri Lanka and Bangladesh
3 Cluster III: West Indies, Afghanistan, Ireland and Zimbabwe
The cluster centroids are given in Table 2.
Table 2
Cluster centroids as per HCA
| Test Ranking | ODI Ranking | T20 Ranking | Popularity of Cricket | |
| Cluster I | 2.5 | 2.5 | 4 | 1.75 |
| Cluster II | 6.75 | 6.5 | 5.25 | 1.25 |
| Cluster III | 10.25 | 10.5 | 10.75 | 4.5 |
Cluster I can be characterized by countries with rankings in the top half for all three formats; however apart from India and Australia, cricket is not the most popular game. Soccer for England and Rugby and Netball for New Zealand hold the highest position in games’ popularity chart. Cluster II comprises of countries where cricket is the most popular sport (barring South Africa) and they consume the middle space in all three formats’ ranking; the difference in T20 is miniscule compared to Cluster I. Cluster III comprises of lower ranked countries in all 3 formats and cricket is not even in top 3 popular list for West Indies and Ireland. This is in concurrence with Ray’s suggestion (The Telegraph, 28 December 2018) of creating 3 tiers (gold, silver and bowl plate) of test cricket each consisting of 4 teams according to their combined ranks in tests and ODI. At the end of each championship, there can be promotion and relegation across tiers based on performance.
7Cricket mix analysis using markov chain analysis
The study contemplates cricket having three states namely, Test, ODI and T20I. As seen in Section 4, percentage share of each state is changing over time depending on the itineraries set during the FTP by the ICC. Each format may lose out to other format or gain from them or may remain stable. The approach for cricket mix analysis is to ascertain how percentage of 3 formats had changed over time and then apply Markov Chain (MC) to reach the steady state for all the formats.
Existing literature revealed the use of MC principles in predicting brand switch (where a person stays with a brand or switches to any other brand), hospital administration (where a patient either recovers fully or stays at hospital or dies), stock market (where the shares can increase, decrease or remain stable) (Budnick, Mcleavey & Mojena, 1988) etc. In this case, the cricket mix changes from one period to the next period depending on the itinerary prepared by ICC. The considerations include but not limited to allowing space for domestic cricket, franchise based cricket (e.g. IPL, BBL etc.) and also recuperation for players in a year apart from market demand, weather condition and special events like championship tournaments. Markovian property demands that the conditional probability of the next state given the present state is independent of all states prior to the present state i.e.
where Xt is the cricket mix vector at time t.
This practically holds good as there is little consideration of the cricket mix that was prevalent in say, 2007 (the inaugural year for T20 World Cup) while preparing the present fixtures. However, it is observed that the world cup events generally happen once in 4 years (with few exceptions for T20I) and in those years there is a spurt in that format reducing the share of other two formats. Moving average is a common practice that provides base figures when there is seasonality in the data (Budnick, Mcleavey & Mojena, 1988). In order to smoothen the cricket mix, 4-yearly averages were considered.
Table 3 shows average cricketing mix for each cluster of 4 countries over 4 seasons e.g. 2015–16, 2016–17, 2017–18 and 2018–19. Assuming 5 days per test and 1 day per ODI and T20I, total number of cricket days was calculated. For example, in case of Cluster I, average total number of cricket days = 5x11.5625 + 20 + 10.875 = 88.6875. And the share of test cricket for Cluster I is calculated as (5x11.5625)/88.6875 = 0.6519.
Table 3
Cricket matches played and total days of cricket during 2015–19
| Average number of Tests played | Average number of ODIs played | Average number of T20Is played | Average total number of cricket days | |
| Cluster I | 11.5625 | 20 | 10.875 | 88.6875 |
| Cluster II | 10.3125 | 18.4375 | 11.375 | 81.375 |
| Cluster III | 2.5 | 15 | 9.9375 | 37.4375 |
Table 4 shows average cricketing mix for each cluster of 4 countries over 4 seasons e.g. 2016–17, 2017–18, 2018–19 and 2019–20.
Table 4
Cricket matches played and total days of cricket during 2016–20
| Average number of Tests played | Average number of ODIs played | Average number of T20Is played | Average total number of cricket days | |
| Cluster I | 12 | 19.75 | 14 | 93.75 |
| Cluster II | 6.25 | 18.5 | 11.25 | 61 |
| Cluster III | 3.75 | 14.75 | 7 | 40.5 |
Summarizing Tables 3 and 4, the average cricket composition vector U15 - 19 had transitioned into U16–20 for the 3 formats and as given in Table 5.
Table 5
Cricket mix during 2015–19 and 2016–20
| Share of | Tests | ODIs | T20Is | Transitioned to | Tests | ODIs | T20Is |
| Cluster I | 0.6519 | 0.2255 | 0.1226 | 0.6400 | 0.2107 | 0.1493 | |
| Cluster II | 0.6336 | 0.2266 | 0.1398 | 0.5123 | 0.3033 | 0.1844 | |
| Cluster III | 0.3339 | 0.4007 | 0.2654 | 0.4630 | 0.3642 | 0.1728 |
Hence the transition matrix can be modeled using
Where Uk = (U1k U2k U3k) is the row vector of unconditional probabilities (or shares) for all 3 states (or formats) at time period k (= 15–19, 16–20) and P is the one step transition matrix with ((pij)) as the conditional probability of reaching state j from i for i, j = 1, 2, 3.
For each cluster, the system of equations for solving ((pij))3x3 are represented as
and the identity constraints are
This makes the system of equations under-identified (6 equations in 9 unknowns, where infinite number of possible solutions exists). While Moore (1920) and Penrose (1955) derived pseudo inverse of a general non-full rank matrix using singular value decomposition, use of reduced row echelon form for under-identified system is an accepted practice (Khan, n.d.). To solve
[A|b] is reduced to a lower triangular matrix, which helps in identifying free and pivot variables. Later pivot variables are solved under assumed values of free variables. The solutions for 9 pij’s and hence the transition matrix P thus obtained are listed in Table 6.
Table 6
Transition Matrix for Clusters I, II and III
| Cluster I | Cluster II | Cluster III | |||||||
| Test | ODI | T20I | Test | ODI | T20I | Test | ODI | T20I | |
| Test | 0.90 | 0.05 | 0.05 | 0.70 | 0.18 | 0.12 | 0.90 | 0.05 | 0.05 |
| ODI | 0.15 | 0.78 | 0.07 | 0.25 | 0.70 | 0.05 | 0.27 | 0.70 | 0.03 |
| T20I | 0.16 | 0.02 | 0.82 | 0.10 | 0.20 | 0.70 | 0.20 | 0.25 | 0.55 |
7.1Steady state equilibrium
The study then investigates possible existence of equilibrium condition when the share of each format freezes (under the assumption that the transition matrix remains the same). Here only the transition matrix enters into determining the equilibrium and not the initial or intermittent shares of all formats. For ergodic markov chain, where each state is reachable from each state in one or more transitions, steady state probabilities can be achieved by solving
For each cluster, the steady state probabilities (or shares for 3 formats) U = (U1 U2 U3) are calculated by solving the system of equations:
where P is the transition matrix as obtained in Table 6.
As a numerical example the study assumes 100, 80 and 60 days of cricket being allotted to Clusters I, II and III respectively. This is based upon a) observed values 90, 80 and 40 days over last few years, b) Tendulkar’s assertion that matured countries get to play more test (Tendulkar, 22 November 2019) and c) popularity of the game in each cluster. However, the same should be treated as a tuning parameter along with other parameters as discussed in next section. The share percentages were converted to number of games for each format (assuming 5 days per test and 1 day per ODI and T20I). The result is shown in Table 7.
Table 7
Steady state share of formats
| The U vector for each cluster | Number of cricket days | Number of Tests | Number of ODIs | Number of T20Is | |||
| Share of Tests | Share of ODIs | Share of T20Is | |||||
| Cluster I | 0.609 | 0.159 | 0.232 | 100 | 12 | 16 | 24 |
| Cluster II | 0.394 | 0.384 | 0.222 | 80 | 6 | 30 | 20 |
| Cluster III | 0.24 | 0.26 | 0.50 | 60 | 3 | 15 | 30 |
Interpreting results in Table 7, each team in Cluster I should play 12 tests, 16 ODIs and 24 T20Is; each team in Cluster II should play 6 tests, 30 ODIs and 20 T20Is; each team in Cluster III should play 3 tests, 16 ODIs and 29 T20Is annually. The result suggests Cluster I to focus more on test matches keeping the most difficult format thrive; Cluster II to play more ODIs that can help them graduate to Cluster I and Cluster III to focus more on T20Is to hone cricketing skills and attract new generation of fans to cricket. Steady state predictions are criticized in practice because a) error in estimating P and b) changes in P over time and c) changes in nature of dependence relationships among states. However, the use of steady state values is an important diagnostic tool for the decision maker and can work well as cricket formats and playing countries are continuously evolving (Levin et al., 1989).
8Heuristic approach for fine tuning the cricket mix
Ray (2021) identified three key stakeholders for the game of cricket - the administrators (target - spread the game in a sustainable way, promote innovation), the players (target –enhance skill, earn money, remain relevant for long) and the spectators (target –get thrill and excitement, enjoy display of skill and ensure value for money and time spent). Media interest can be treated as an endogenous variable which can be the resultant from stakeholders’ combined interests, the exogenous set of variables. Enderwick & Nagar (2010) observed big shift post IPL where performance at international level leads to rewarding selection at the franchise level. This is unlike other games like soccer or basketball, where the success at the club level may turn into a national call up. With more corporate participation, the economics of cricket had changed from a stadium sport to televised entertainment. According to Mani (2009), establishing cricket infrastructure is expensive but this is still a relatively cheap content provider on electronic media. With the advent of internet and digital media the same might have a bearing on the current FTP schedule. While commenting on co-existence of multiple formats of cricket, Davies (2007) remarked that interaction effect across formats may turn savior for test cricket citing example of Aussie run rate (above 4 an over) in the 2005 ashes series. Subhani, Hasan & Osman (2012) commented that T20I is the best bet for fulfilling ICC’s goal of cricket’s re-entry in Olympics after 1900 and the same will increase global appeal for cricket.
The current environment is inundated with too many parameters –Players (Skill, Workload, Longevity, Income), Spectator (Thrill, Skill, Time and Money spent), Sponsor & Media (Fan following, Promotion, Revenue). These manifest in ICC’s investment (for spreading the game, player development, infrastructure development etc.) and scheduling (considering all stakeholders’ aspirations) which in turn optimizes the revenue collection and global spread. The present study simplifies at a conceptual level by defining a value creation matrix ((V ijk)) across 3 dimensions (viz. cluster, format and criteria) where the parameters V ijk are defined below:
Vijk = Value created in ith cluster (i = 1, 2, 3 for three clusters) by jth format (j = 1, 2, 3 for Test, ODI and T20I) due to kth criteria (k = 1, 2, 3 for Regulator, Spectator and Player)
Value is a conceptual measure of aggregated benefits reaped by the Regulators, Spectators and Players since each of their aspirations cannot be measured in absolute monetary terms or in any other common unit (e.g. spreading the game for the Regulators; getting thrills and excitement for the Spectators; skill enhancement for the Players) by playing a particular format in any cluster. This value creation matrix is generated by collecting, averaging and rounding to nearest tens based on rating by an expert panel, described below.
If aij is the number of matches planned for ith cluster for jth format that forms the cricket mix matrix with following constraints:
Cluster I: 5a 11 + a 12 + a 13 < = 100
Cluster II: 5a 21 + a 22 + a 23 < = 80
Cluster III: 5a 31 + a 32 + a 33 < = 60
Total value generated by ith cluster (Vi . . ) =
Total value generated by jth format (V . j . ) =
Total value generated by kth criteria (V . . k) =
The problem turns into finding out ((aij))3x3 that can maximize Vi . . , V . j . and V . . k for i, j, k = 1, 2, 3 under constraints on ((aij))3x3 as above. However, a close look at the objective functions reveals that criteria wise maximization won’t do justice to cluster and format performances and likewise for each dimension. This essentially turns into an optimization problem that can keep each dimension at an acceptable level.
The theory of constraints (TOC) is a popular approach for dealing with the product mix planning (Forgarty, Hoffmann & Stonebraker,1989). Based on the TOC, one needs to identify a bottleneck resource in the system that can critically impact the overall productivity. Due to the mutual dependence of various manufacturing events, the output of the system is maximized by fully utilizing the bottleneck resource (Goldratt & Cox, 1992). There is couple of problems associated with TOC e.g. adding new product alternatives to an existing production line (Lee & Plenert, 1993) and handling more than one bottleneck in which the algorithm may not reach the optimum solution. When there is more than one bottleneck in the system, the product mix problem resembles to a multiple objective decision-making (MODM) problem. Aryanezhad & Komijan (2004) devised an algorithm that let every bottleneck contribute to the decision-making process considering the priority sequence of bottlenecks. TOC is seen as a heuristic method in the literature and often lead to the same solutions as integer linear programming (ILP) even though the implementation procedures are different (Little, 1961; Luebbe & Finch, 1992). Chung, Lee & Pearn (2005) used analytic hierarchy process (AHP) and analytic network process (ANP) to analyze process inputs and outputs at multiple layers after incorporating their importance factor to obtain optimal product mixes for semiconductor production. The present problem differs from these cases as the basic constraints on ((aij)) are adjustable; however, abundance of one format can create alienation in followers. Secondly, there can be addition to the existing formats and dimensions of the value creation matrix. As Borden (1964) observed that a problem seemingly lying in one segment of the mix must be coupled with consideration regarding the effect of any change in that sector on the other dimensions, a what-if analysis was deemed the best approach. It can work as a profiler that presents optimization opportunities with respect to the configuration parameters (Herodotou & Babu, 2011).
The value creation matrix is achieved through an expert survey where each expert was asked to provide the value (between 0 and 100). The questions were of the pattern - how much value ICC, Spectator and Player (each having their own aspirations as described earlier) can associate with each test, ODI and T20I match for Cluster I, II and III? The average value rounded to nearest tens is depicted in Table 8.
Table 8
Value creation matrix
| ICC/Regulator | Spectator | Player | |
| Cluster I | |||
| Test | 100 (V111) | 20 (V112) | 50 (V113) |
| ODI | 60 (V121) | 30 (V122) | 60 (V123) |
| T20I | 10 (V131) | 50 (V132) | 80 (V133) |
| Cluster 2 | |||
| Test | 80 (V211) | 30 (V212) | 40 (V213) |
| ODI | 50 (V221) | 40 (V222) | 50 (V223) |
| T20I | 30 (V231) | 60 (V232) | 90 (V233) |
| Cluster 3 | |||
| Test | 20 (V311) | 20 (V312) | 20 (V313) |
| ODI | 40 (V321) | 40 (V322) | 40 (V323) |
| T20I | 20 (V331) | 100 (V332) | 100 (V333) |
Continuing with the same numerical example in Section 5, the initial seed for cricket mix matrix was taken as the steady state cricket mix achieved theoretically as shown in Table 9.
Table 9
Steady state cricket mix matrix
| Number of Tests | Number of ODIs | Number of T20Is | |
| Cluster 1 | 12 (a11) | 16 (a12) | 24 (a13) |
| Cluster 2 | 6 (a21) | 30 (a22) | 20 (a23) |
| Cluster 3 | 3 (a31) | 15 (a32) | 30 (a33) |
Value appreciation matrix containing Vi . . , V . j . and V . . k for i, j, k = 1, 2, 3 was calculated based on Tables 8 & 9 and represented in Table 10.
Table 10
Value appreciation matrix
| Cluster | Value Generated | Format | Value Generated | Criteria | Value Generated |
| 1 | 7800 | Test | 3120 | ICC/Regulator | 6240 |
| 2 | 8700 | ODI | 8400 | Spectator | 8160 |
| 3 | 8580 | T20I | 13560 | Player | 10680 |
| Total | 25080 | Total | 25080 | Total | 25080 |
The Value appreciation matrix clearly depicts how a total value of 25,080 had been divided across dimensions. Now this provides a platform for what-if analysis where one can update the cricket mix matrix in order to boost any laggard dimension in the Value appreciation matrix.
9Conclusions and discussions
The study started off with the listing of criticisms on WTC (starting in 2019) format and associated FTP (2015-23) schedule raised by many cricket pundits notwithstanding the retrofitting effect of WTC. Since the next FTP (2023-31) is currently being planned by ICC, the authors sensed an opportunity to address the scheduling problem for FTP (2023-31). The study had shown that with introduction of new formats, new countries and new franchise based competitions, the cricket mix is changing. It also revealed that one single country never stood on top for all three formats emphasizing the need for different skill set in each format. Since any sport thrives in competition, cricket pundits were claiming WTC may do more harm than reviving it, in view of increased number of one sided affairs and 2/3 match series. A homogeneity analysis amongst test playing countries was conducted with respect to their ability in three formats and popularity compared to other sports in these countries. The HCA indicated 3 different clusters / tiers which are homogeneous within and heterogeneous between. Borrowing concepts from marketing mix, the study established that separate cricket mix should be created for different clusters. Analyzing the cricket mix separately over two consecutive four year time periods, the transition matrix for change in cricket mix was derived for each format. Later using these transition matrices, the steady state cricket mix was predicted. The mandate was clear that Cluster I (the most matured teams), II and III should focus on test, ODI and T20I respectively and slowly graduate to the upper clusters. The steady state which is supposed to reach after n (= 1,2,. . . .) time periods assuming the transition matrix remain stationary, the policy makers can adopt the equilibrium condition as a good starting point rather than waiting for n time periods. However, to add flexibility in an environment involving many stakeholders with many aspirations, the authors created a what-if analysis framework based on couple of heuristics –a) Cluster I, II and III gets to play a total n1, n2 and n3 (100, 80 and 60 taken for example) days of cricket combining all formats and b) there exists a value creation matrix ((V ijk)) across 3 dimensions (viz. cluster, format and criteria) where Vijk = Value created in ith cluster (i = 1, 2, 3) by jth format (j = 1, 2, 3 for Test, ODI and T20I) due to kth criteria (k = 1, 2, 3 for Regulator, Spectator and Player). Each heuristic can change adopted values and also can change its dimensionality. However, what-if analysis framework can still produce a profiler on value appreciation allowing policymakers to tinker for better return. The whole approach can treated as a pioneering effort towards achieving tier-wise scheduling in sports and cricket, in particular with a strong theoretical and practical perspective.
As a future study, the HCA can be made more robust using other parameters like population, TRP, average in-stadium occupancy, first class structure etc. Creating 2 or 3 tiers versus continuing with one for WTC is a subject of debate. Present Indian coach and ex-cricketer Ravi Shastri (The Telegraph, 10 January 2020) opined in a similar line that top six countries should play test with each other in order to preserve test and the shorter formats should be used to popularize cricket. The present study only considered 3 stakeholders for the value creation matrix where each value is an accumulation of all aspiration parameters per stakeholder. While this considerably simplified the derivation of the matrix, one can consider more stakeholders and individual aspiration values using more sophisticated mechanism than a localized expert survey. Ascertainment of each (aij) for the cricket mix matrix can also be simulated for fine tuning. Finally, this study poses a Multi-dimension multi-objective decision making problem which demands a more generic solution than TOC or ILP.
Glossary
BBL: Big Bash League. It is an Australian professional franchise Twenty20 cricket league, which was established in 2011 by Cricket Australia.
BCCI: Board of Control for Cricket in India. This is the governing body for cricket in India and is under the jurisdiction of Ministry of Youth Affairs and Sports, Government of India. The board was formed in December 1928 as a society, registered under the Tamil Nadu Societies Registration Act.
CA: Cricket Australia. This is the national governing body for cricket in Australia.
ECB: England and Wales Cricket Board. It is the governing body of cricket in England and Wales. It was formed on 1 January 1997 as a single governing body to combine the roles formerly fulfilled by the Test and County Cricket Board, the National Cricket Association and the Cricket Council.
FTP: Future Tours Programme This is a schedule of international cricket tours which structure the programme of cricket for ICC full members, with an objective of each team playing each other at least once at home and once away over a period of 10 years.
HCA: Hierarchical cluster analysis is a tool in data mining and statistics that uses an algorithm to group similar objects into same clusters. Objects in different clusters are more dissimilar.
ICC: International Cricket Council. This is the world governing body of cricket. It was founded as the Imperial Cricket Conference in 1909 by representatives from Australia, England and South Africa. It was renamed as the International Cricket Conference in 1965, and took up its current name in 1987.
ILP: Integer linear programming. It expresses the optimization of a linear function subject to a set of linear constraints over integer type variables.
IPL: Indian Premier League. This is a professional Twenty20 cricket league, contested by teams based out of different Indian cities. The league was founded by BCCI in India in 2007 and the first edition was played in 2008.
Matrix: A (m x n) matrix is an array of numbers having m (≥1) rows and n (≥1) columns in two dimension. The concept can be generalized to any dimension.
MCA: Markov Chain Analysis. A Markov chain is a stochastic model describing a sequence of possible events in which the probability of each event depends only on the state attained in the previous event. It is named after the Russian mathematician Andrey Markov
ODI: One Day International. It is a form of limited overs cricket, played between two international teams, in which each team faces a fixed number of overs, currently 50, with the game lasting for around 8 hours.
T20I: Twenty20 International. This is a form of limited overs cricket, played between two international teams, in which each team faces a maximum of twenty overs, with the game lasting for around 3.5 hours.
TOC: Theory of constraints. This is a methodology for identifying the most important limiting factor (i.e. constraint) that stands in the way of achieving a goal and then systematically improving that constraint until it is no longer the limiting factor.
TRP: Television Rating Point. It is a tool which indicates the popularity of a television program. It is used to judge which television program is viewed the most. This is an index that shows the popularity of the particular program among people.
Vector: A vector is a list of numbers (can be in a row (m x 1) or a column (1 x n)).
WTC: World Test championship. This is a league competition for Test cricket run by the ICC, which started on 1 August 2019 and the first ever final is scheduled to be held in Jun 2021 between India and New Zealand. It is intended to be the premier championship for Test cricket.
References
1 | Aryanezhad, M. B. & Komijan, A. R. (2004) , An improved algorithm for optimizing product mix under the theory of constraints, International Journal of Production Research, 42: (20), 4221–4233, Available from: doi: 10.1080/00207540410001695961 |
2 | Atherton, M. (21 November 2019)World Test Championship was supposed to boost the format –it does the opposite. The Telegraph. pp. 16. |
3 | Azharuddin, M. (24 November 2019) This gap in quality isn’t a good feeling. The Telegraph. Interview with Indranil Majumdar, pp. 17. |
4 | Baldauf, A. , Cs, D. W. & Grant, K. , (2002) , Consequences of Sales management control in field sales organizations: a crossnational perspective, International Business Review, 11: (5), 577–609. |
5 | Banerjee, S. (23 November 2019) Holding sees red over pink. The Telegraph. pp. 15. |
6 | Borden, N. H. , (1964) , The Concept of the Marketing Mix. Schwartz, G. (Ed.). Science in Marketing. New York, John Wiley. |
7 | Budnick, F. S. , Mcleavey, D. & Mojena, R. , 1988, Principles of Operations Research for Management. Delhi, Richard d Irwin. |
8 | Brearley, M. (2017, December 17). Brearley on cricket then and now, challenges & the integrity issue / Interviewer: L. P. Sahi. The Telegraph, pp. 19. |
9 | Chung, S. H. , Lee, A. H. I. & Pearn, W. L. , (2005) , Product Mix Optimization for Semiconductor Manufacturing Based on AHP and ANP Analysis, International Journal of Advanced Manufacturing Technologies, 25: , 1144–1156. |
10 | Davies, C. 2007, Twenty20: Is it the right vision for the future of cricket? [online], Sporting Traditions, 24: (1-2), 43–55. Available from: https://search.informit.com.au/documentSummary;dn=793794599111638;res=IELHSS>ISSN:0813-2577. [Accessed on 24th September 2019] |
11 | Enderwick, P. & Nagar, S. ((2010) ), The Indian Premier League and Indian Cricket: Innovation in the face of tradition, Journal of Sponsorship, 3: (2), 130–143. |
12 | Forgarty, D. W. , Hoffmann, T. R. & Stonebraker, P. W. , (1989) , Production and Operations Management. Cincinnati, South-Western Publishing. |
13 | Ganguly, S. (2016, September 22). T20 only have value only if Test cricket survives / Interviewer: L. P. Sahi. The Telepraph, pp. 18. |
14 | Goldratt, E. M. & Cox, J. (1992) , The Goal-A Process of Ongoing Improvement. MA, North River Press. |
15 | Griffith, D. A. , Hu, M. Y. & Ryans J. K. Jr, , (2000) , Process standardization across intra- and inter-cultural relationships, Journal of International Business Studies, 31: (2), 303–324. |
16 | Gupta, G. (2018, August 8). Brand IPL now soars to $6.3 billion, The Times of India. Retrieved from https://timesofindia.indiatimes.com/sports/cricket/ipl/top-stories/brand-ipl-nowsoars-to-6-3-billion/articleshow/65321837.cms [Accessed on 30th March 2019] |
17 | Gupta, S. (6 December 2019) Big margin of victories, but cricket is shrinking. The Telegraph. pp. 18. |
18 | Gupta, S. (23 November 2019) Pink ball fine, but World Test Championship is not: Dilip. The Telegraph. pp. 15. |
19 | Hannerz, U. , (1990) , Cosmopolitans and locals in world culture. Featherstone, M. (Ed.), Global culture: nationalism, globalization and modernity. CA, Sage Publications. |
20 | Herodotou, H. & Babu S. , (2011) , Profiling, What-if Analysis, and Cost based Optimization of MapReduce Programs. In: Proceedings of the 37th International Conference on Very Large Data Bases. 29 August –3 September 2011, Seattle, Washington. 4(11). |
21 | Holding, M. (2017, September 22). Test cricket being strangled by Twenty20 weed. The Telegraph, pp. 20. |
22 | International Cricket Council (ICC). (n.d.) About our members. Available from: https://www.icc-cricket.com/about/members/about-our-members [Accessed on 30th March 2020] |
23 | Jain, S. C. , (1989) , Standardization of international marketing strategy: some research hypotheses, Journal of Marketing Review, 53: , 70–79. |
24 | Kalra, G. , (5 September 2017) What the IPL rights bids tell us. Espncricinfo.com. Available from: http://www.espncricinfo.com/magazine/content/story/1119448.html [Accessed 10th September 2017] |
25 | Khan, S. , (n.d.) Solving a system of 3 equations and 4 variables using matrix row-echelon form. Available from: https://www.khanacademy.org/math/linear-algebra/vectors-and-spaces/matrices-elimination/v/matrices-reduced-row-echelon-form-1 [Accessed on 30th March 2019] |
26 | Kohli, R. , The Launch of the Indian Premier League, Columbia Case Works. Retrieved from: http://www.columbia.edu/ rk35/IPL.pdf [Accessed on 30th March 2019] |
27 | Kustin, R. A. , (2004) , Marketing mix standardization: a cross cultural study of four countries, International Business Review, 13: (5), 637–649. |
28 | Lee, T. N. & Plenert, G. , (1993) , Optimizing theory of constraints when new product alternatives exist, Production and Inventory Management Journal, 34: (3), 51–57. |
29 | Levin, R. I. , Rubin, D. S. , Stinson, J. P. & Gardner, E. S. 1989, Quantitative Approaches to Management. Singapore, Mcgraw-Hill College |
30 | Little, J. D. C. , (1961) , A proof for the queueing formula L =λW, Operations Research, 9: , 383–387. |
31 | Luebbe, R. & Finch, B. (1992) , Theory of constraints and linear programming: a comparison, International Journal of Production Research, 30: (6), 1471–1478. |
32 | Majumdar, I. & Mitra, D. (10 January 2020) Lessons in cricket history for roadmap of its future. The Telegraph. pp. 15. |
33 | Mani, E. (2009) , A strong sport growing stronger: a perspective on the growth, development and future of international cricket, Sport in Society, 12: (4-5), 681–693, Available from: doi: 10.1080/17430430802702970 |
34 | Media Release. 2018, “First global market research project unveils more than one billion cricket fans”, available at https://www.icc-cricket.com/media-releases/759733 [accessed on 12 December 2019] |
35 | Moore, E. H. , (1920) , On the Reciprocal of the General Algebraic Matrix, Bulletin of the American Mathematical Society, 26: , 394–395. |
36 | Penrose, R. , (1955) , A Generalized Inverse for Matrices, Proceedings of the Cambridge Philosophical Society, 51: , 406–413. |
37 | Ray, S. , (2021) , Identification of Research Paradigms for Managing the Cricketing Ecosystem Using Stakeholder Analysis and Text Mining, Management and Labour Studies, 46: (3), 1–24. |
38 | Ray, S. , (28 December 2018) Save the real test. The Telegraph. pp. 14. |
39 | Samiee, S. , & Roth, K. , (1992) , The influence of global marketing standardization on performance, Journal of Marketing, 56: (2), 1–17. |
40 | Schuh, A. , (2000) , Global standardization as a success formula for marketing in Central Eastern Europe? Journal of World Business, 35: (2), 133–149. |
41 | Solberg, C. A. , (2000) , Standardization of adaptation of the international marketing mix: the role of the local subsidiary/representative, Journal of International Marketing, 8: (1), 78–98. |
42 | Sorenson, R. Z. , & Wiechmann, U. W. , (1975) , How multinationals view marketing standardization, Harvard Business Review, 53: (May–June), 38–54. |
43 | Subhani, M. I. , Hasan, S. A. , & Osman, M. A. , Will T20 clean sweep other formats of Cricket in future? European Journal of Scientific Research, 86: (1), 98–102. |
44 | Tendulkar, S. (22 November 2019) Sachin: Focus on quality, not just colour of ball / Interviewer: Indranil Majumdar. The Telegraph. pp. 20. |
45 | The Telegraph. (21 February 2020) Points system in World Test Championship unfair: Kane Williamson. pp. 16. |
46 | The Telegraph. (10 January 2020) MS Dhoni may soon end ODI career: Ravi Shastri. pp. 15. |
47 | The Telegraph. (15 November 2019) Take a break, return and take fresh guard: Sachin. pp. 17. |
48 | The Telegraph. (10 November 2019) Big 3 against ICC. pp. 15. |
49 | The Telegraph. (10 October 2019) Virat Kohli bats for ‘away’ points. pp. 15. |
50 | Wakefield, K. L. & Blodgett, J. G. , (1999) , Customer response to intangible and tangible service factors, Psychology and Marketing, 16: (1), 51–68. |


