
Reducing starting position bias in the Speedway Grand Prix
Abstract
The Speedway Grand Prix (SGP) is the pinnacle of individual speedway competition. In each SGP meeting, riders are allocated a ‘starting position’ from 1 to 16 that dictates the order in which they ride and their coloured ‘gate’ for each race. Data from 152 SGP meetings from 2005 to 2018 have been analysed to calculate the average score for each starting position. Starting position 13 has the highest average score of 8.37 points with a success rate (top eight finish) of 57%, while starting position 4 has the lowest average score of 6.57 points with a 38% success rate. This starting position bias is attributed to the colours of a starting position’s gates, their timing during a meeting, and the proximity of rides to a track preparation session. To correct this bias, a new SGP heat format has been created that minimises the spread of starting position average scores. The ‘Proposal B’ heat format has been shown to reduce the spread of starting position average scores down to 0.55 points compared with 1.80 points under the current heat format. This new heat format has the potential to make SGP meetings fairer, while enhancing spectator excitement by producing tighter and more competitive meetings. The Proposal B heat format is therefore recommended for use in future SGP series.
1Introduction
Speedway is a motorsport raced on 500cc motorbikes, with no gears and no brakes, around an oval loose-dirt track. A speedway meeting comprises a number of races, known as heats, consisting of four riders completing four anti-clockwise laps of the track (May, 1978; Norman, 2002).
The pinnacle of individual speedway competition is the annual Speedway World Championship, run by the FIM (Fédération Internationale de Motocyclisme, or International Motorcycling Federation). First contested in 1936 (Chaplin, 1979), this competition evolved in 1995 into the Speedway Grand Prix (SGP) (Bamford and Shailes, 2002). The SGP consists of a series of SGP meetings across the year, with rider points added together to determine the overall SGP World Champion.
The format of an SGP meeting has remained the same since 2005 (see Table 1), with 16 riders each taking five rides across a 20-heat format (FIM, 2019a). Riders are allocated a ‘starting position’ from 1 to 16 that dictates the order in which they ride and their ‘gate’ for each race. This colour-coded gate indicates the location across the track width from which the rider starts (see Fig. 1). All speedway races have a stationary start in the middle of one of the straights, behind a set of ‘tapes’ that are raised to begin the heat. The rider starting on the ‘inside’ gate (closest to the inner part of the oval) wears a red helmet, followed by blue, then white, then yellow for the rider on the ‘outside’ gate (closest to the outer part of the oval). The precise combination of heats, starting positions, and gates used in the SGP is identical to that first used in the 1952 World Speedway Championship (Speedway Control Board, 1952).
Table 1
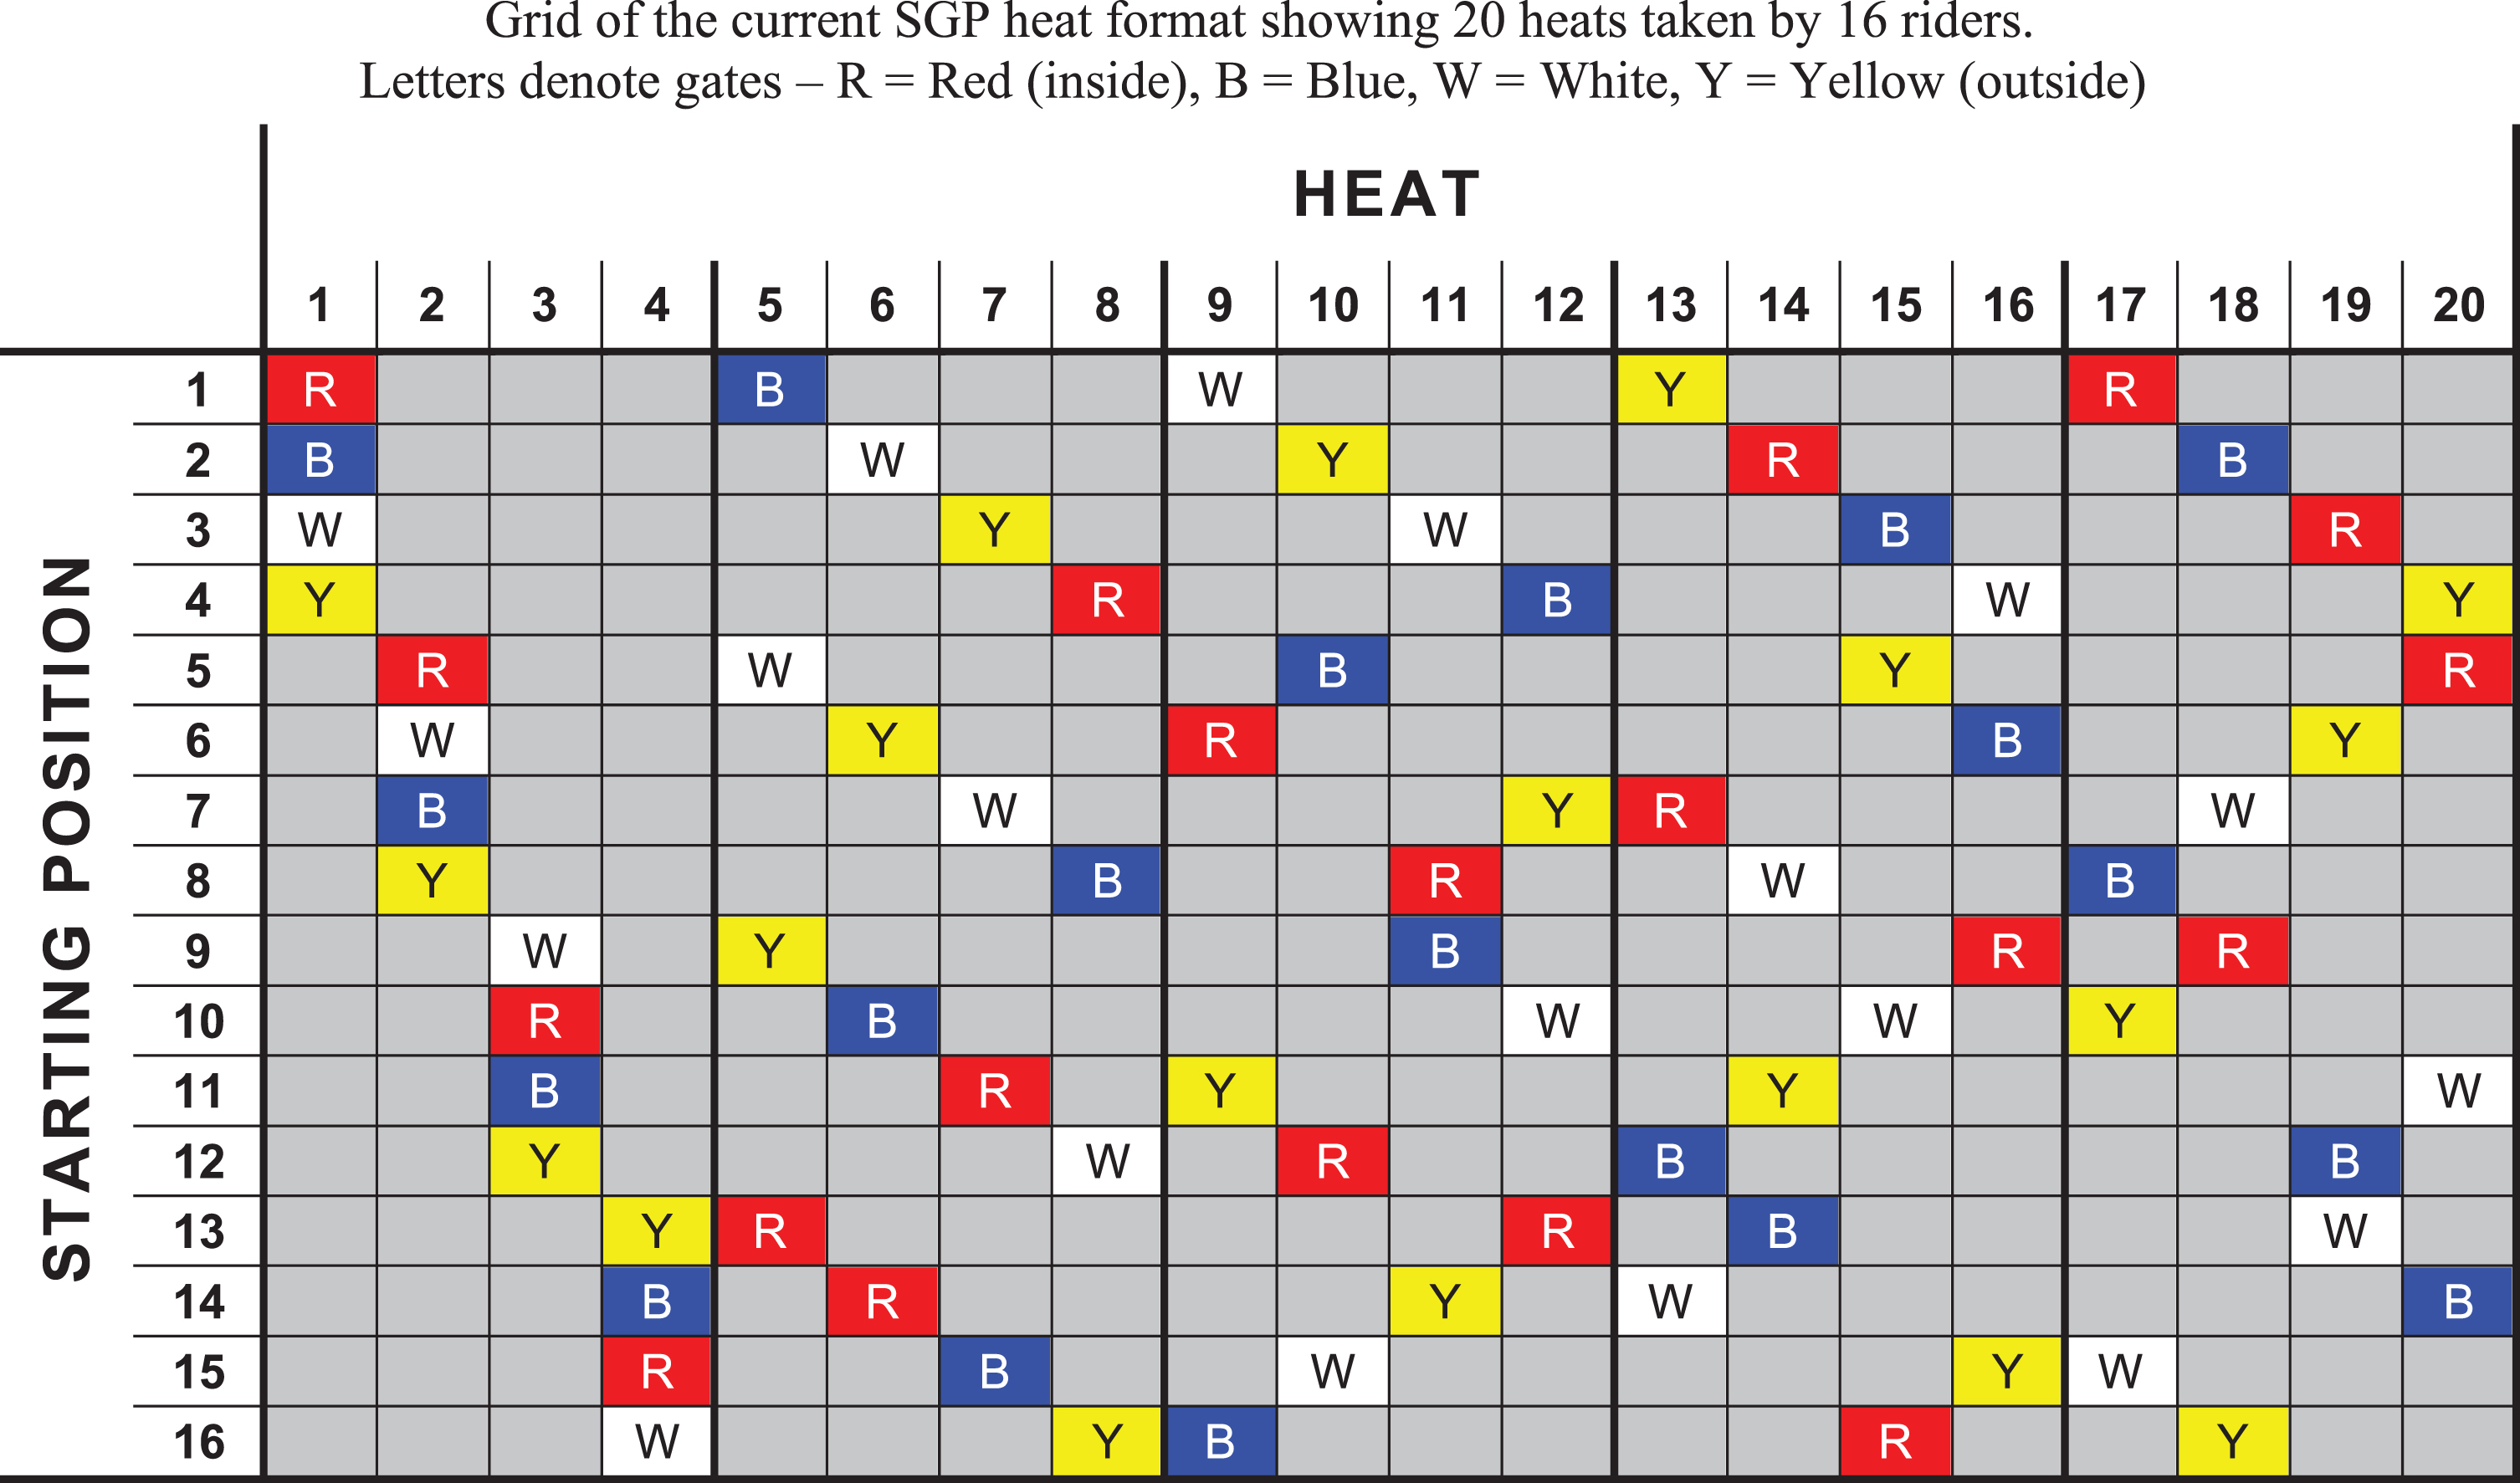
Fig. 1
Layout of a speedway track showing the location of each of the coloured ‘gates’ – red (R, inside), blue (B), white (W), yellow (Y, outside).

Gates can have a significant impact on the final outcome of a speedway race. Upon starting a race, riders accelerate towards the first bend where they can move freely across the width of the track. Arriving at the first bend in the lead gives an increased chance of winning the race (Martin, 2014). However, the speed of a rider’s start can be dictated by the track surface of their gate, as well as the precise shape, size and camber of the track which are each unique. Different gates tend to be more favourable or unfavourable at different times during a meeting as a track’s characteristics evolve. This may be due to a natural changing of the track surface due to the racing, or manual preparation in between races. Such preparation can consist of tractor and handheld raking of the surface, as well as watering. SGP meetings are paused after every four heats for such track preparation.
This variation in gate performance leads to bias based on starting position in the SGP heat format. A rider’s starting position dictates which gate is ridden at which time during the meeting. Riding specific gates at specific times, or riding the most favourable gate more often, can lead to an advantage and an increased average score. Similarly, riding other gates at specific times, or riding the least favourable gate more often, can lead to a disadvantage and a reduced average score.
The present study looks at this starting position bias in the SGP via a statistical analysis of results from previous SGP meetings. It seeks to understand how a rider’s starting position can affect their chances of success in an SGP meeting. Furthermore, the study then performs an optimisation of the SGP heat format to arrive at proposals for a new system that minimises the statistical bias of starting positions.
2Dataset
Data from 152 SGP meetings have been used for this study, with results collated and cross-verified from a variety of sources (Bamford and Shailes, 2002; FIM, 2019b; Author, 2019; The Speedway Researcher, 2019; UK Wikipedia, 2019; Poland Wikipedia, 2019; Speedway Archive, 2019; Speedway Updates, 2019; Speedway riders, history and results, 2019).
Between 2005 and 2018 there were 155 SGP meetings under the current heat format (Table 1), raced at 26 different tracks across 14 different countries. Three meetings did not complete 20 heats during that period due to weather or track conditions. These meetings have therefore been ignored in this study, leaving a total of 152 SGPs for consideration.
Prior to each SGP meeting, the riders were randomly allocated to one of the 16 starting positions. Data from the 2019 SGP season have not been included, as a qualifying system was introduced whereby riders chose their own starting position based on a fastest-lap qualifying competition (fastest chooses first, slowest chooses last). This introduced bias in the allocation of riders to starting positions, and hence the 2019 data was not used in this analysis.
Rider points in the SGP are allocated as three for a heat win, two for second place, one for third, and zero for last. This means that, for each gate in each heat, there are 152 scores in the dataset from which to derive an average score. Riders are occasionally replaced in a heat due to exclusion or injury, and in these cases the heat score of their replacement has been used. Summing the average score for each of a starting position’s heat/gate combinations allows the calculation of an average score for each starting position across these 152 SGP meetings.
3Starting position bias
A detailed breakdown of average scores for each heat/gate combination is shown in Tables 2, 3 and Fig. 2. Key trends revealed by these data are:
• the red gate gives the highest score across almost the entire meeting (17 out of 20 heats), taking the top five highest scoring heat/gate combinations including the overall maximum of 1.993 points for heat 1;
• the white gate gives the lowest score across almost all the first half of the meeting (9 out of 10 heats), taking the top five lowest scoring heat/gate combinations including the overall minimum of 1.099 points for heat 2;
• the track preparation after every four heats generally improves the performance of both the inside gates (red and blue), giving them an average boost of around 0.1 points for the next heat;
• this same track preparation generally degrades the performance of the outside yellow gate, giving it an average drop of around 0.2 points for the next heat;
• the spread of score differences between gates generally reduces as the meeting progresses, with the biggest points spread across a single heat being the 0.796 points difference in heat 1, while the lowest spread is the 0.349 points difference in heat 20.
Table 2
Average points scored for each gate in each heat
| Heat | Red | Blue | White | Yellow |
| 1 | 1.993 | 1.599 | 1.197 | 1.204 |
| 2 | 1.763 | 1.586 | 1.099 | 1.553 |
| 3 | 1.829 | 1.461 | 1.118 | 1.592 |
| 4 | 1.645 | 1.375 | 1.237 | 1.737 |
| 5 | 1.842 | 1.507 | 1.309 | 1.342 |
| 6 | 1.776 | 1.487 | 1.158 | 1.579 |
| 7 | 1.855 | 1.467 | 1.382 | 1.296 |
| 8 | 1.500 | 1.533 | 1.467 | 1.500 |
| 9 | 1.757 | 1.559 | 1.178 | 1.500 |
| 10 | 1.849 | 1.382 | 1.309 | 1.441 |
| 11 | 1.868 | 1.355 | 1.270 | 1.507 |
| 12 | 1.691 | 1.316 | 1.368 | 1.612 |
| 13 | 1.750 | 1.546 | 1.474 | 1.230 |
| 14 | 1.625 | 1.671 | 1.401 | 1.296 |
| 15 | 1.520 | 1.461 | 1.500 | 1.493 |
| 16 | 1.750 | 1.632 | 1.257 | 1.349 |
| 17 | 1.684 | 1.572 | 1.467 | 1.263 |
| 18 | 1.711 | 1.329 | 1.546 | 1.414 |
| 19 | 1.717 | 1.632 | 1.428 | 1.204 |
| 20 | 1.645 | 1.612 | 1.441 | 1.296 |
Table 3
Top five highest and lowest scoring heat/gate combinations
| Score | Heat | Gate |
| 1.993 | 1 | Red |
| 1.868 | 11 | Red |
| 1.855 | 7 | Red |
| 1.849 | 10 | Red |
| 1.842 | 5 | Red |
| ... | ... | ... |
| 1.197 | 1 | White |
| 1.178 | 9 | White |
| 1.158 | 6 | White |
| 1.118 | 3 | White |
| 1.099 | 2 | White |
Fig. 2
Average points scored for each gate in each heat. Thick grey vertical bars show where track preparation sessions take place after each block of four heats.

Table 4 shows the average points scored per heat from each gate. Each of the four values is calculated from 3,040 scores per gate (152 meetings×20 heats). With a total of 6 points available in each heat (3 + 2 + 1 + 0), each of the four gates would average 1.5 points per heat (6 points/4 gates) without any bias. The red gate performs 0.24 points above this average at 1.74 points per heat, while the white gate performs 0.17 points below this average at 1.33 points per heat. Yellow is slightly below average (1.42), while blue is exactly on average (1.50).
Table 4
Average points scored for each gate
| Gate | Average points |
| Red | 1.74 |
| Blue | 1.50 |
| White | 1.33 |
| Yellow | 1.42 |
Table 5 summarises the average score for each starting position across the 152 SGPs. This is compiled by summing the appropriate average score for each heat/gate combination for each starting position from Table 2, with reference to the heat format of Table 1. There is a 1.80 points difference between the best and worst performing starting positions: starting position 13 has the highest average score of 8.37 points, while starting position 4 has the lowest average score of 6.57 points.
Table 5
Average score and double gate for each starting position for the current SGP heat format, ordered by average score
| Starting position | Average score | Double gate |
| 13 | 8.37 | Red |
| 12 | 8.09 | Blue |
| 8 | 7.93 | Blue |
| 7 | 7.88 | White |
| 14 | 7.74 | Blue |
| 1 | 7.59 | Red |
| 5 | 7.59 | Red |
| 11 | 7.55 | Yellow |
| 10 | 7.45 | White |
| 9 | 7.28 | Red |
| 6 | 7.27 | Yellow |
| 15 | 7.24 | White |
| 16 | 7.23 | Yellow |
| 2 | 7.15 | Blue |
| 3 | 6.94 | White |
| 4 | 6.57 | Yellow |
Each starting position takes a ride from each gate at least once, but with five rides and four different gates that means one gate is taken twice across the meeting – subsequently referred to as the ‘double gate’. Referencing the heat layout of Table 1, each gate is the double gate for four riders. Based on the average score for each gate in Table 4, it may therefore be expected that starting positions with red as their double gate will outperform those with white as their double gate.
Referring again to Table 5, the top scoring starting position, 13, does indeed have red as its double gate. However, the four red double gates are not all at the top of the list, and the four white double gates are not all at the bottom. This highlights that there is more subtlety to the starting position bias than a simple preference for a particular gate.
Applying the analysis of this section, the reasons behind the 1.80 points average difference between the best and worst starting positions can now be explained. Starting position 13, averaging 8.37 points, has:
• the highest average scoring gate (red) as its double gate;
• one of its red gates immediately after a track preparation session with an associated boost in average score;
• the yellow gate in heat 4 which is yellow’s highest average scoring heat;
• the blue gate in heat 14 which is blue’s highest average scoring heat;
• the worst gate, white, towards the end of the meeting (heat 19) when gate differences are at their lowest.
In comparison, starting position 4, averaging 6.57 points, has:
• the second lowest scoring gate (yellow) as its double gate;
• the yellow gate in heat 1 which is yellow’s joint lowest average scoring heat;
• the red gate in heat 8 which is red’s lowest average scoring heat;
• the blue gate in heat 12 which is blue’s lowest average scoring heat;
• the white gate in heat 16 where it scores below its overall average.
To understand the impact of these differences on chances of success, data on rider success from the 152 SGPs has been analysed. In an SGP meeting, the eight top-scoring riders after 20 heats go forward to a pair of semi-finals. The top two finishers from each semi-final then race in a final heat to determine the finishing order for the meeting. ‘Success’ after the first 20 heats is therefore defined as finishing in the top eight scorers and qualifying for the semi-finals.
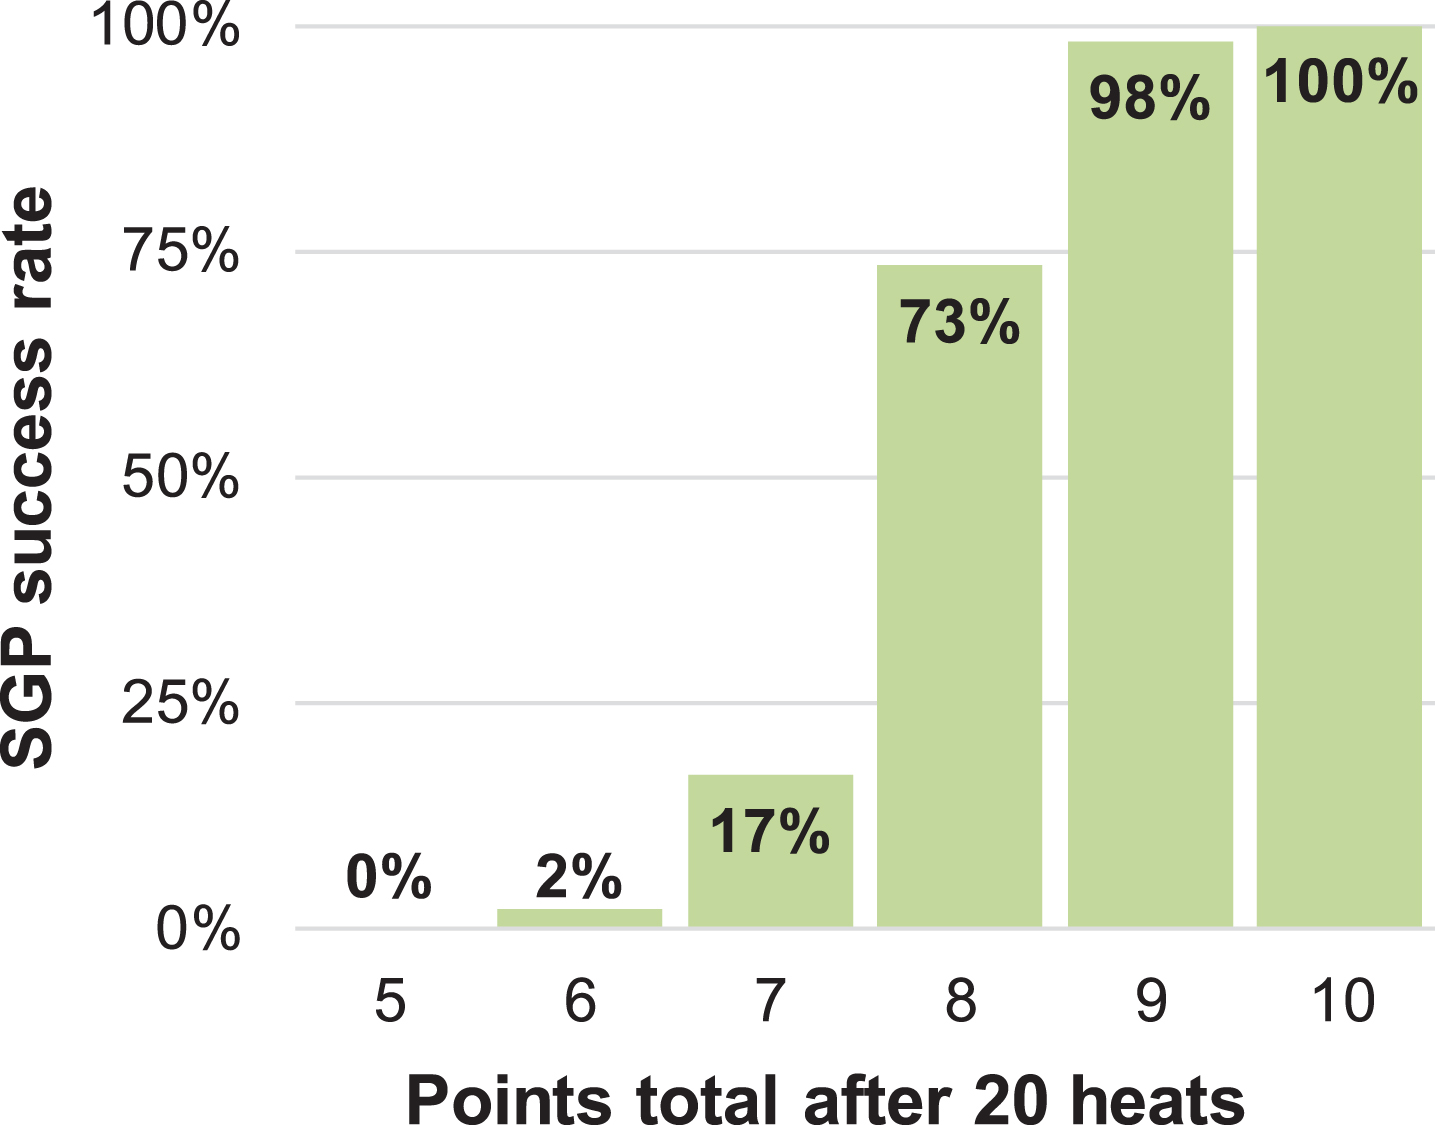
Figure 3 illustrates the success rate (qualifying for the semi-finals) for different points totals after 20 heats across the 152 SGPs in the dataset. The chances of reaching a semi-final are 73% per cent after scoring eight points and 17% after scoring seven points. The actual success rate of starting position 13 (top average score of 8.37 points) across the 152 SGPs was 57%, compared with 38% for starting position 4 (bottom average score of 6.57 points).
Fig. 3
SGP success rate against points total after 20 heats.
This evaluation confirms that there is indeed a starting position bias in the SGP, and it can affect a rider’s chances of success in an SGP meeting. Contributing factors include the colour of a starting position’s double gate, the time during a meeting at which specific gates are taken, and the proximity of rides to a track preparation session. A favourable combination of these influences can lead to a score with a high probability of success, while an unfavourable combination can lead to a score with a low probability of success. All of these factors are dictated by the specific 20-heat format used by the SGP.
4Initial proposal for a new SGP heat format
Starting position bias in the SGP has been proven to be a product of its heat format, and so the creation of an updated heat format has been explored as a potential solution. The problem of creating speedway heat formats was investigated in the 1970s as a mathematical curiosity (Fletcher, 1976; Budden, 1977), and subsequently explained through the mathematical concepts of block design and Steiner systems (Anderson and Denniston, 1977).
The present study takes advantage of modern computing power to test all possible re-arrangements of the current SGP heat format to determine the one with the lowest standard deviation of average scores across the 16 starting positions. The re-arrangements must comply with the three fundamental rules of the current SGP heat format:
• each rider races once in each group of four heats (1–4, 5–8 etc.);
• each rider races each of the other 15 competitors once;
• each rider starts from each gate at least once.
Table 6 illustrates the framework for re-arranging the heats without violating these three fundamental rules. 20 heats can be divided into five blocks of four heats (A, B, C, D and E), with each block’s heats denoted as A-1, A-2 etc. A new format that obeys the three fundamental principles can be derived by simply re-arranging the five groups: for example, an ‘E, B, C, D, A’ format can be created by swapping the first and last four-heat blocks. Furthermore, the heats within each block can be re-arranged while still upholding the three fundamental principles: for example, the heats in block E can be re-arranged to be ‘E-3, E-4, E-1, E-2’.
Table 6
Referencing of the 20 heats before optimisation
| Group | Ref | Heat |
| A | A-1 | 1 |
| A-2 | 2 | |
| A-3 | 3 | |
| A-4 | 4 | |
| B | B-1 | 5 |
| B-2 | 6 | |
| B-3 | 7 | |
| B-4 | 8 | |
| C | C-1 | 9 |
| C-2 | 10 | |
| C-3 | 11 | |
| C-4 | 12 | |
| D | D-1 | 13 |
| D-2 | 14 | |
| D-3 | 15 | |
| D-4 | 16 | |
| E | E-1 | 17 |
| E-2 | 18 | |
| E-3 | 19 | |
| E-4 | 20 |
The five blocks (A, B, C, D, E) can be arranged in 5!=120 different permutations. Furthermore, each of the five blocks can have their four heats (e.g. A-1, A-2, A-3, A-4) arranged in 4! = 24 different permutations. Therefore, the total number of potential new heat formats that uphold the three fundamental principles is 5!×(4!)5 = 955,514,880 permutations.
The central assumption of this work is that the average points scored by each heat/gate combination (as shown in Table 2) remains fixed, regardless of any re-arrangement of the order in which different riders take those heats. For example, if the current heat 20 (E-4) ends up as the new heat 1, then the rider in red from the current heat 20 now adopts the average score of red in heat 1 (1.993 points) instead of its original average in heat 20 (1.645 points). This allows the average score for each starting position to be calculated for each permutation of heats, thus allowing the minimum standard deviation of average scores to be identified.
A computer model was implemented in the Python programming language to calculate the average score for each starting position for each permutation of the SGP heat format. Running on a single core of an Intel Core i7-7500U processor, this routine took approximately 150 hours of processing time to complete.
Tables 7 and 8 show the resulting heat format with the minimum standard deviation of average scores. Further to this re-arrangement of the heats, the order of starting positions was also re-arranged to the layout shown in Table 9, which is subsequently referred to as Proposal A. This layout orders starting positions by their first heat and gate position, which is more logical and commensurate with other speedway heat formats.
Table 7
The heat format with the minimum standard deviation of average scores
| Group | Ref | Heat |
| E | E-2 | 1 |
| E-1 | 2 | |
| E-3 | 3 | |
| E-4 | 4 | |
| D | D-3 | 5 |
| D-4 | 6 | |
| D-1 | 7 | |
| D-2 | 8 | |
| C | C-1 | 9 |
| C-4 | 10 | |
| C-3 | 11 | |
| C-2 | 12 | |
| A | A-4 | 13 |
| A-2 | 14 | |
| A-1 | 15 | |
| A-3 | 16 | |
| B | B-2 | 17 |
| B-4 | 18 | |
| B-1 | 19 | |
| b-3 | 20 |
Table 8
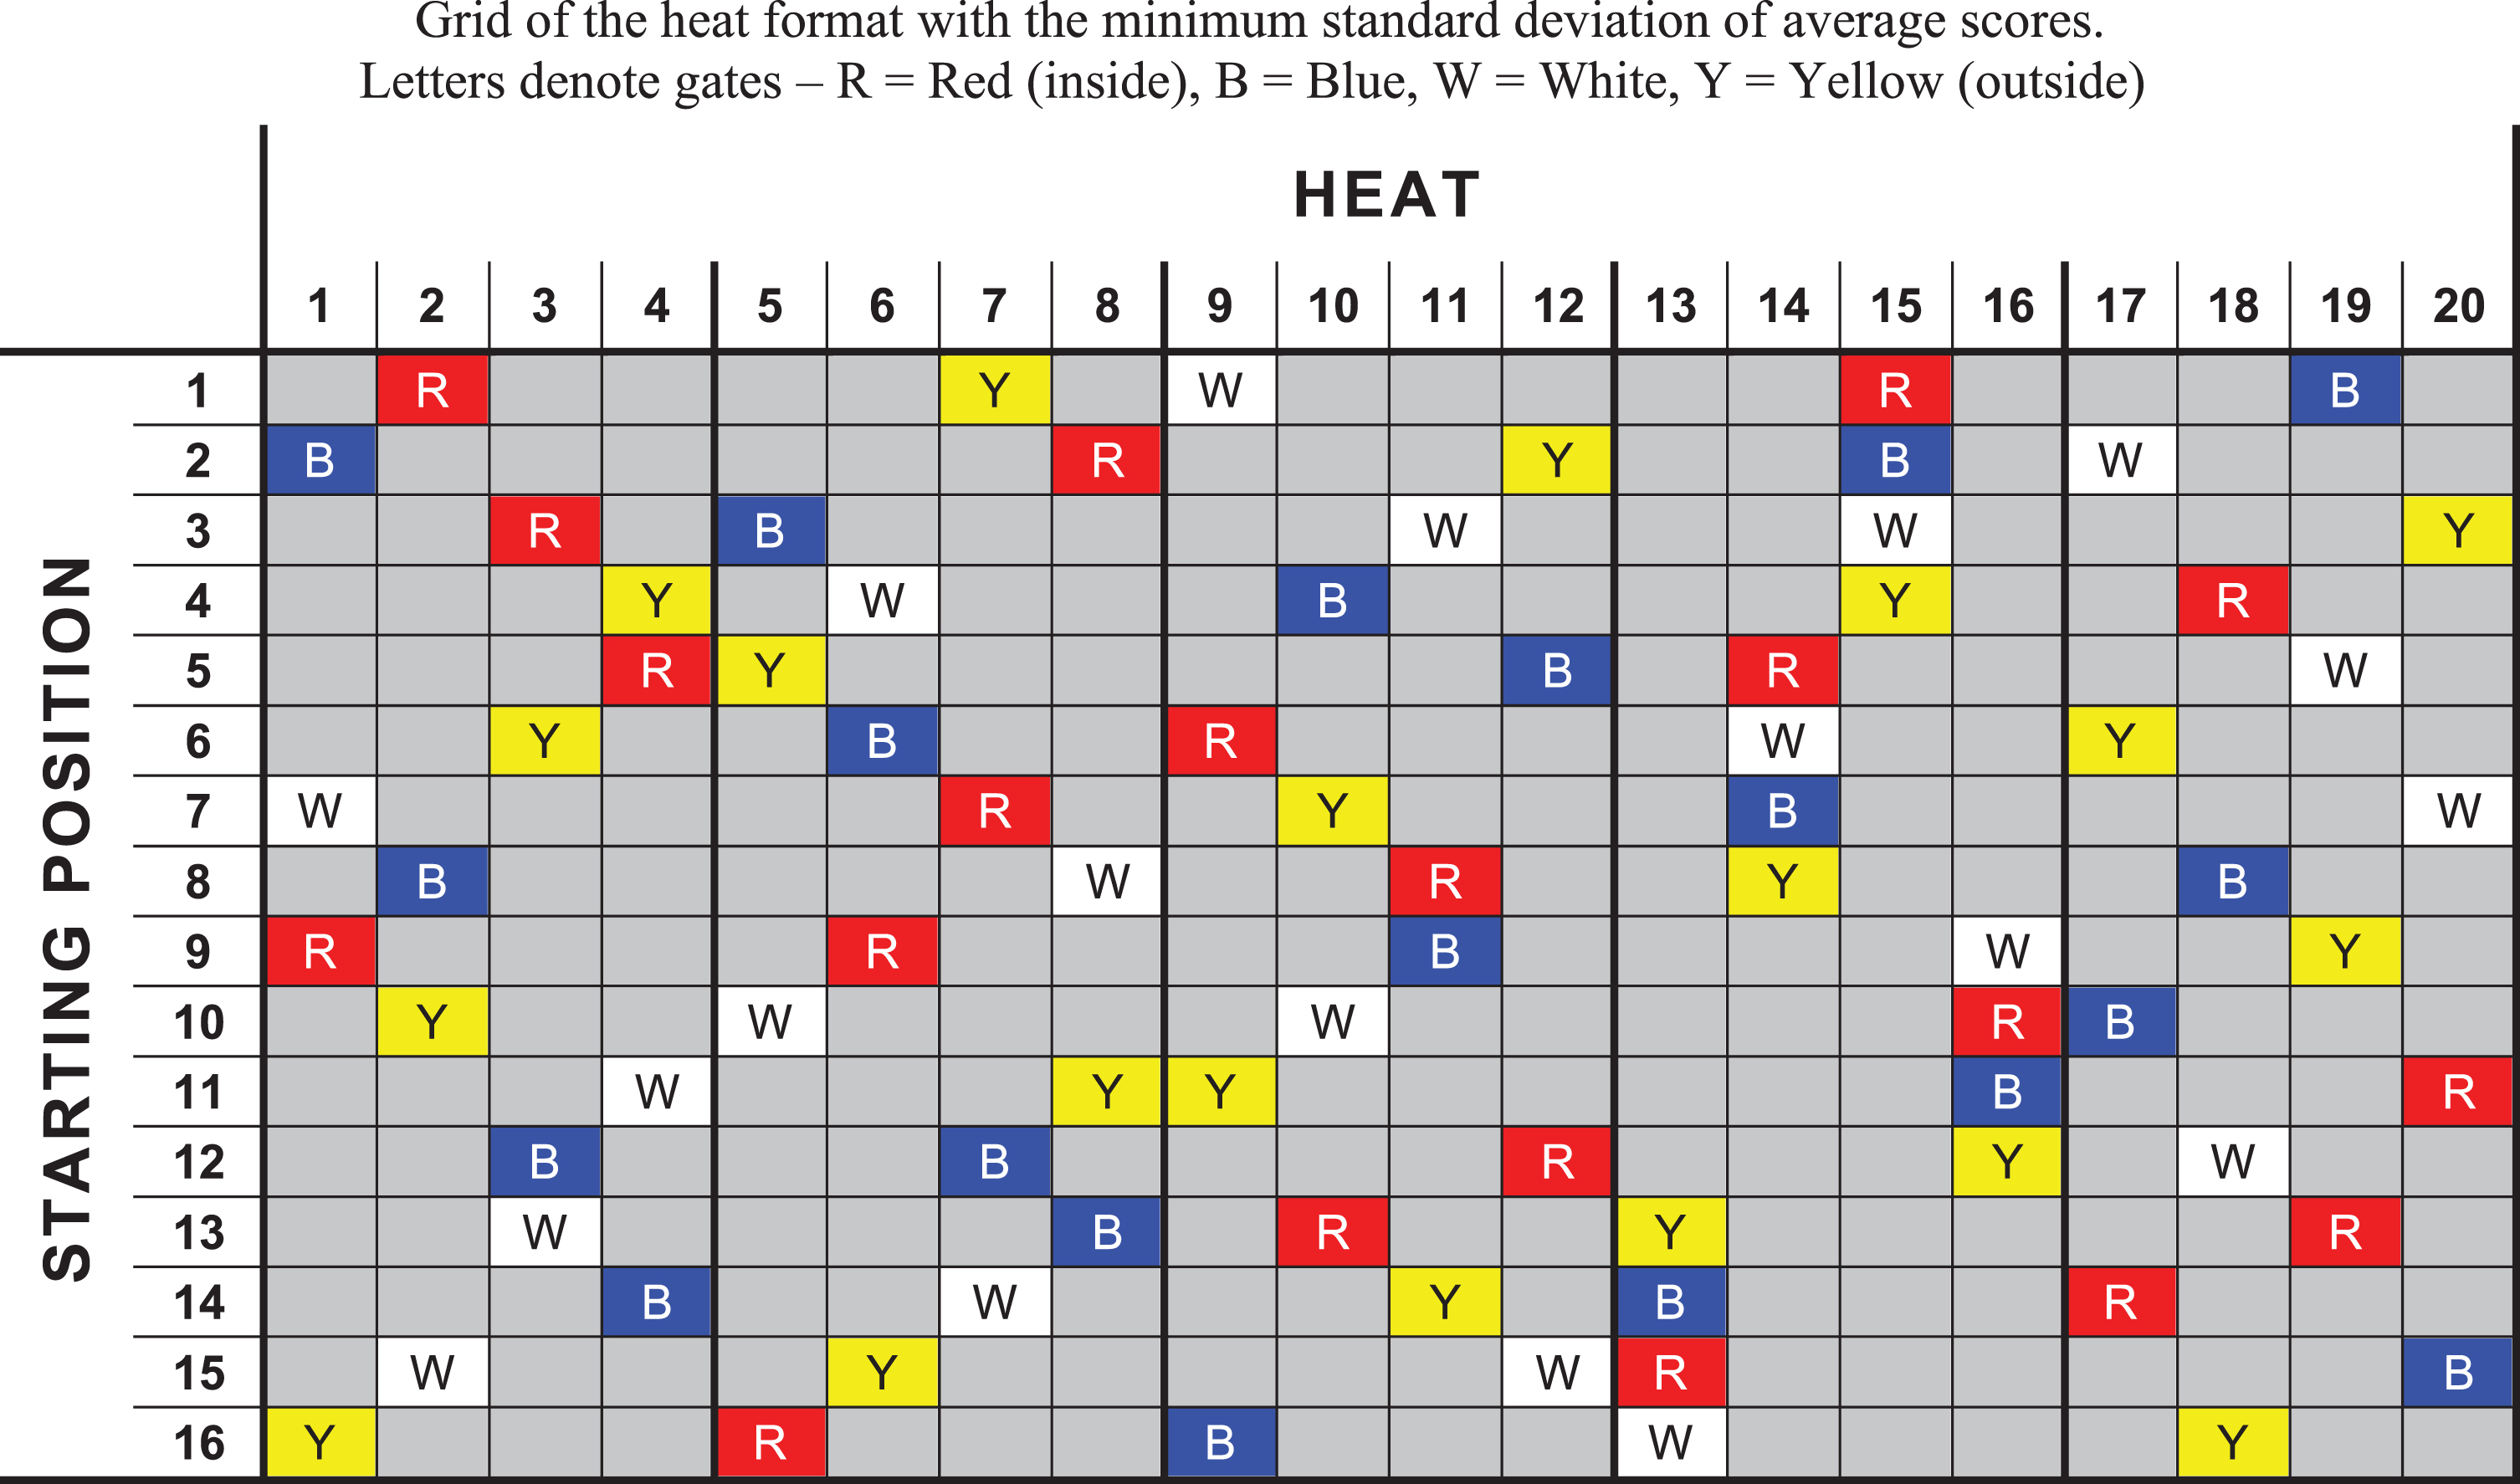
Table 9
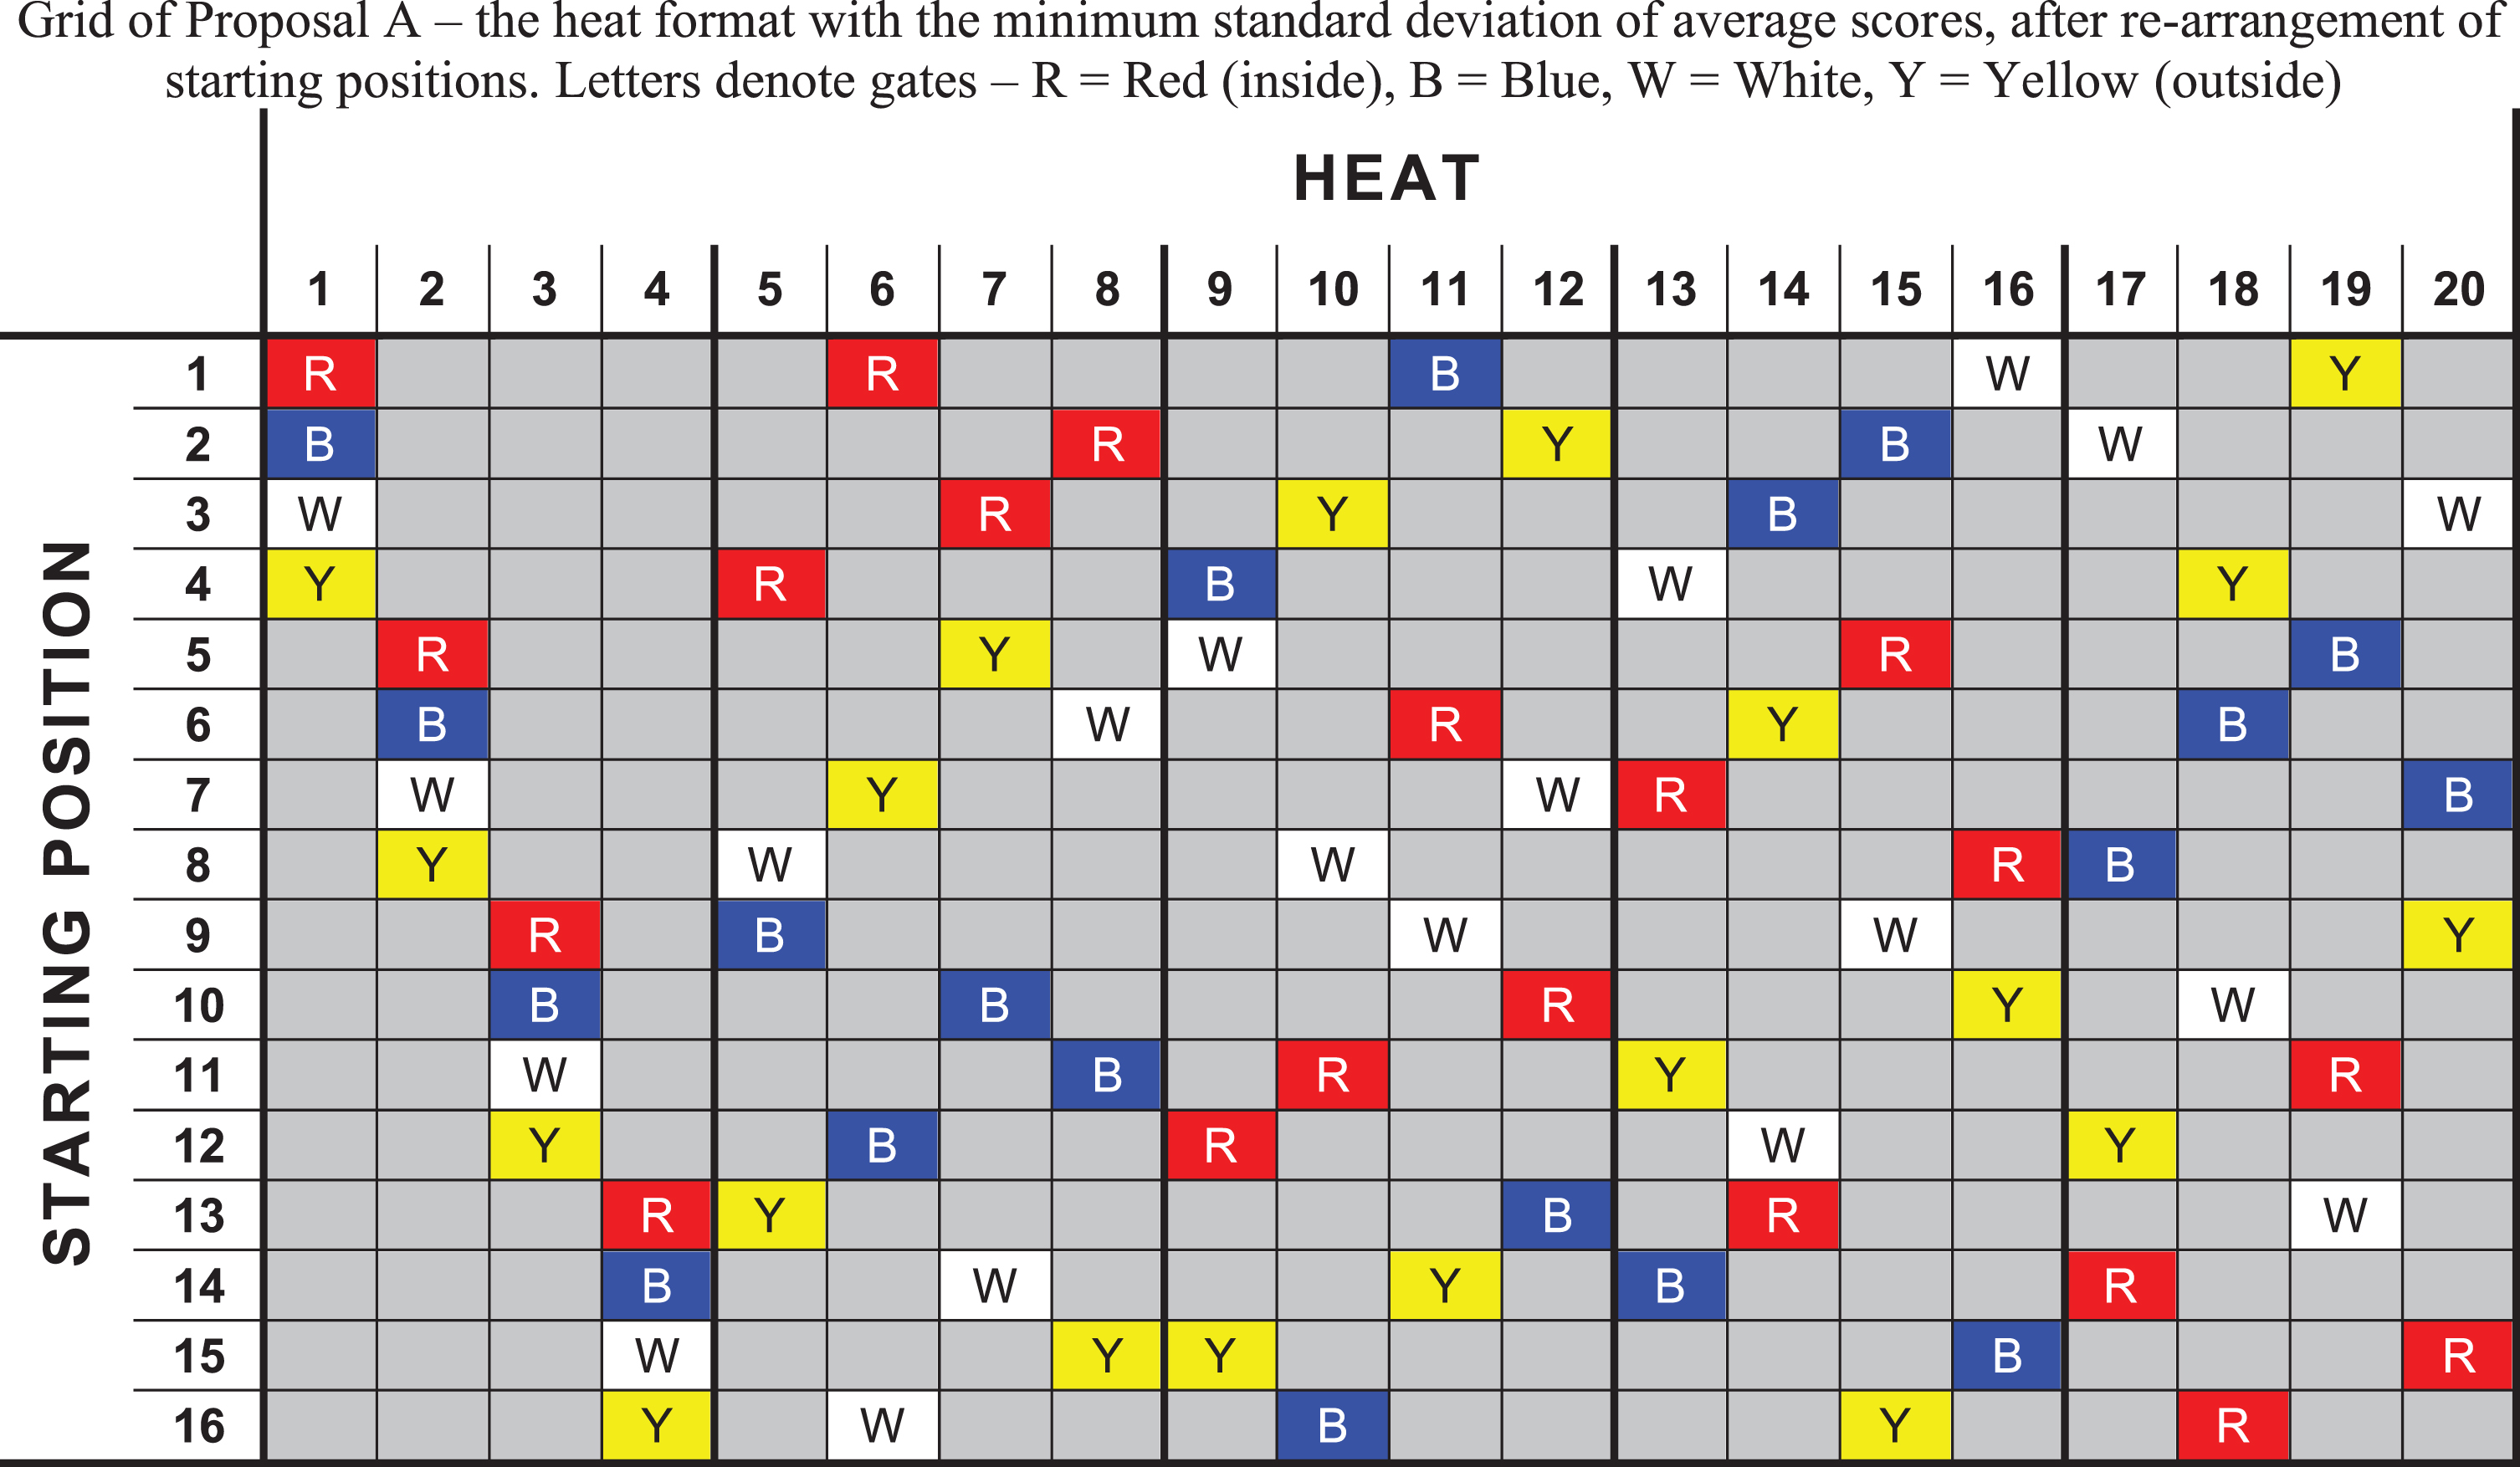
Table 10 shows the total five-ride scores for each starting position under Proposal A. The standard deviation of starting position average scores is 0.077 points, compared with 0.436 points for the current SGP heat format. There is a 0.28 points difference between the best and worst performing starting positions with Proposal A, compared to 1.80 points with the current SGP heat format. Under Proposal A, starting position 2 has the highest average score of 7.64 points, while starting position 13 has the lowest average score of 7.36 points. These compare to a maximum of 8.37 points and a minimum of 6.57 points under the current SGP heat format.
Table 10
Average score for each starting position for the Proposal A heat format
| Starting position | Average score |
| 1 | 7.59 |
| 2 | 7.64 |
| 3 | 7.61 |
| 4 | 7.49 |
| 5 | 7.39 |
| 6 | 7.55 |
| 7 | 7.41 |
| 8 | 7.49 |
| 9 | 7.40 |
| 10 | 7.51 |
| 11 | 7.45 |
| 12 | 7.50 |
| 13 | 7.36 |
| 14 | 7.49 |
| 15 | 7.51 |
| 16 | 7.48 |
As this analysis is averaged over 152 SGP meetings at 26 different tracks, it is important to assess how Proposal A would affect starting position bias at specific tracks. There are five tracks to have hosted over 10 SGP meetings each across the 2005 to 2018 time period: Prague, Czech Republic (14 SGPs), Cardiff, Great Britain (14 SGPs), Malilla, Sweden (13 SGPs), Copenhagen, Denmark (10 SGPs) and Krsko, Slovenia (10 SGPs). These tracks have been chosen for the subsequent analysis as they provide the most robust statistics of the tracks to have hosted an SGP meeting.
Table 11 shows the maximum and minimum starting position average scores across these five tracks for the two different heat formats, together with the maximum–minimum difference. Average heat/gate scores were calculated for each of the five tracks across their respective number of SGP meetings. These scores were then summed to give average scores for each starting position, for both the current SGP heat format as well as Proposal A. In all cases, Proposal A tightens the spread of starting position average scores compared with the current SGP heat format. The most significant improvement is for Prague, where the maximum-minimum difference is 4.36 points for the current SGP format but only 2.07 points for Proposal A. The maximum-minimum difference reduces from 4.10 to 2.30 points for Copenhagen, 4.70 to 3.20 points for Krsko, 2.64 to 2.00 points for Cardiff, and 2.38 to 2.31 for Malilla. These improvements illustrate how a new SGP heat format could make the scoring tighter in SGP meetings, thus enhancing the excitement for watching fans.
Table 11
Maximum and minimum starting position average scores across the five tracks with 10 or more SGP meetings, for each of the heat formats investigated by this study
| Track (SGPs) | Heat format | Starting pos. av. score | ||
| Max. | Min. | Diff. | ||
| All (152) | Current | 8.37 | 6.57 | 1.80 |
| Prop. A | 7.64 | 7.36 | 0.28 | |
| Prop. B | 7.79 | 7.24 | 0.55 | |
| Prague (14) | Current | 9.50 | 5.14 | 4.36 |
| Prop. A | 8.64 | 6.57 | 2.07 | |
| Prop. B | 8.93 | 6.21 | 2.72 | |
| Cardiff (14) | Current | 8.64 | 6.00 | 2.64 |
| Prop. A | 8.50 | 6.50 | 2.00 | |
| Prop. B | 8.21 | 6.71 | 1.50 | |
| Malilla (13) | Current | 8.38 | 6.00 | 2.38 |
| Prop. A | 8.46 | 6.15 | 2.31 | |
| Prop. B | 8.46 | 6.77 | 1.69 | |
| Copenhagen (10) | Current | 9.80 | 5.70 | 4.10 |
| Prop. A | 9.00 | 6.70 | 2.30 | |
| Prop. B | 8.40 | 6.70 | 1.70 | |
| Krsko (10) | Current | 9.20 | 4.50 | 4.70 |
| Prop. A | 8.70 | 5.50 | 3.20 | |
| Prop. B | 9.40 | 6.10 | 3.30 | |
5Refined proposal for a new SGP heat format
A second new SGP heat format, known as Proposal B, has been created following feedback on Proposal A. Discussions with Phil Morris (FIM Race Director of the SGP since 2015 and an ex-professional speedway rider) highlighted that Proposal A contains three starting positions that have three outside (white or yellow) gates for their first three rides. The current heat format has just one starting position with this characteristic, with anecdotal evidence that riders strongly dislike this arrangement of heats as they believe it gives them a slow start to the meeting that is difficult to recover from. This view was somewhat proven during the 2019 season, when this starting position (number 3) was either the 15th choice (out of 16) or not selected by any rider at all (due to less than 16 riders taking part in qualifying) in 7 out of 8 qualifying sessions (Author, 2019).
To eradicate this weakness of Proposal A, a rule was applied to the heat permutations algorithm that removed any combination resulting in three outside gates for the first three rides of any starting position. Furthermore, an additional rule was applied to ensure the four starting positions with white as their double gate did not have those two white gates back-to-back. White is statistically the worst gate (see Table 4), so it was felt that having two adjacent white gates was also an undesirable characteristic.
Recognising that each starting position’s gate order is only dictated by the order of the four-heat blocks (A, B, C, D, E), this optimisation only required the 120 combinations of these blocks to be analysed. Only two combinations obeyed both of the new rules – ‘C, B, D, A, E’ and ‘C, B, D, E, A’. The permutations of heat orders within these constraints were then analysed to find the resulting heat format with the minimum standard deviation of average scores.
Tables 12 and 13 show the resulting optimised heat format. Table 14 shows the final format, referred to as Proposal B, after re-arranging the starting positions in heat and gate order for the reasons described previously.
Table 12
The heat format with the minimum standard deviation of average scores, after applying rules regarding outside gates
| Group | Ref | Heat |
| C | C-1 | 1 |
| C-2 | 2 | |
| C-3 | 3 | |
| C-4 | 4 | |
| B | B-4 | 5 |
| B-3 | 6 | |
| B-1 | 7 | |
| B-2 | 8 | |
| D | D-1 | 9 |
| D-3 | 10 | |
| D-4 | 11 | |
| D-2 | 12 | |
| A | A-4 | 13 |
| A-2 | 14 | |
| A-1 | 15 | |
| A-3 | 16 | |
| E | E-2 | 17 |
| E-1 | 18 | |
| E-3 | 19 | |
| E-4 | 20 |
Table 13
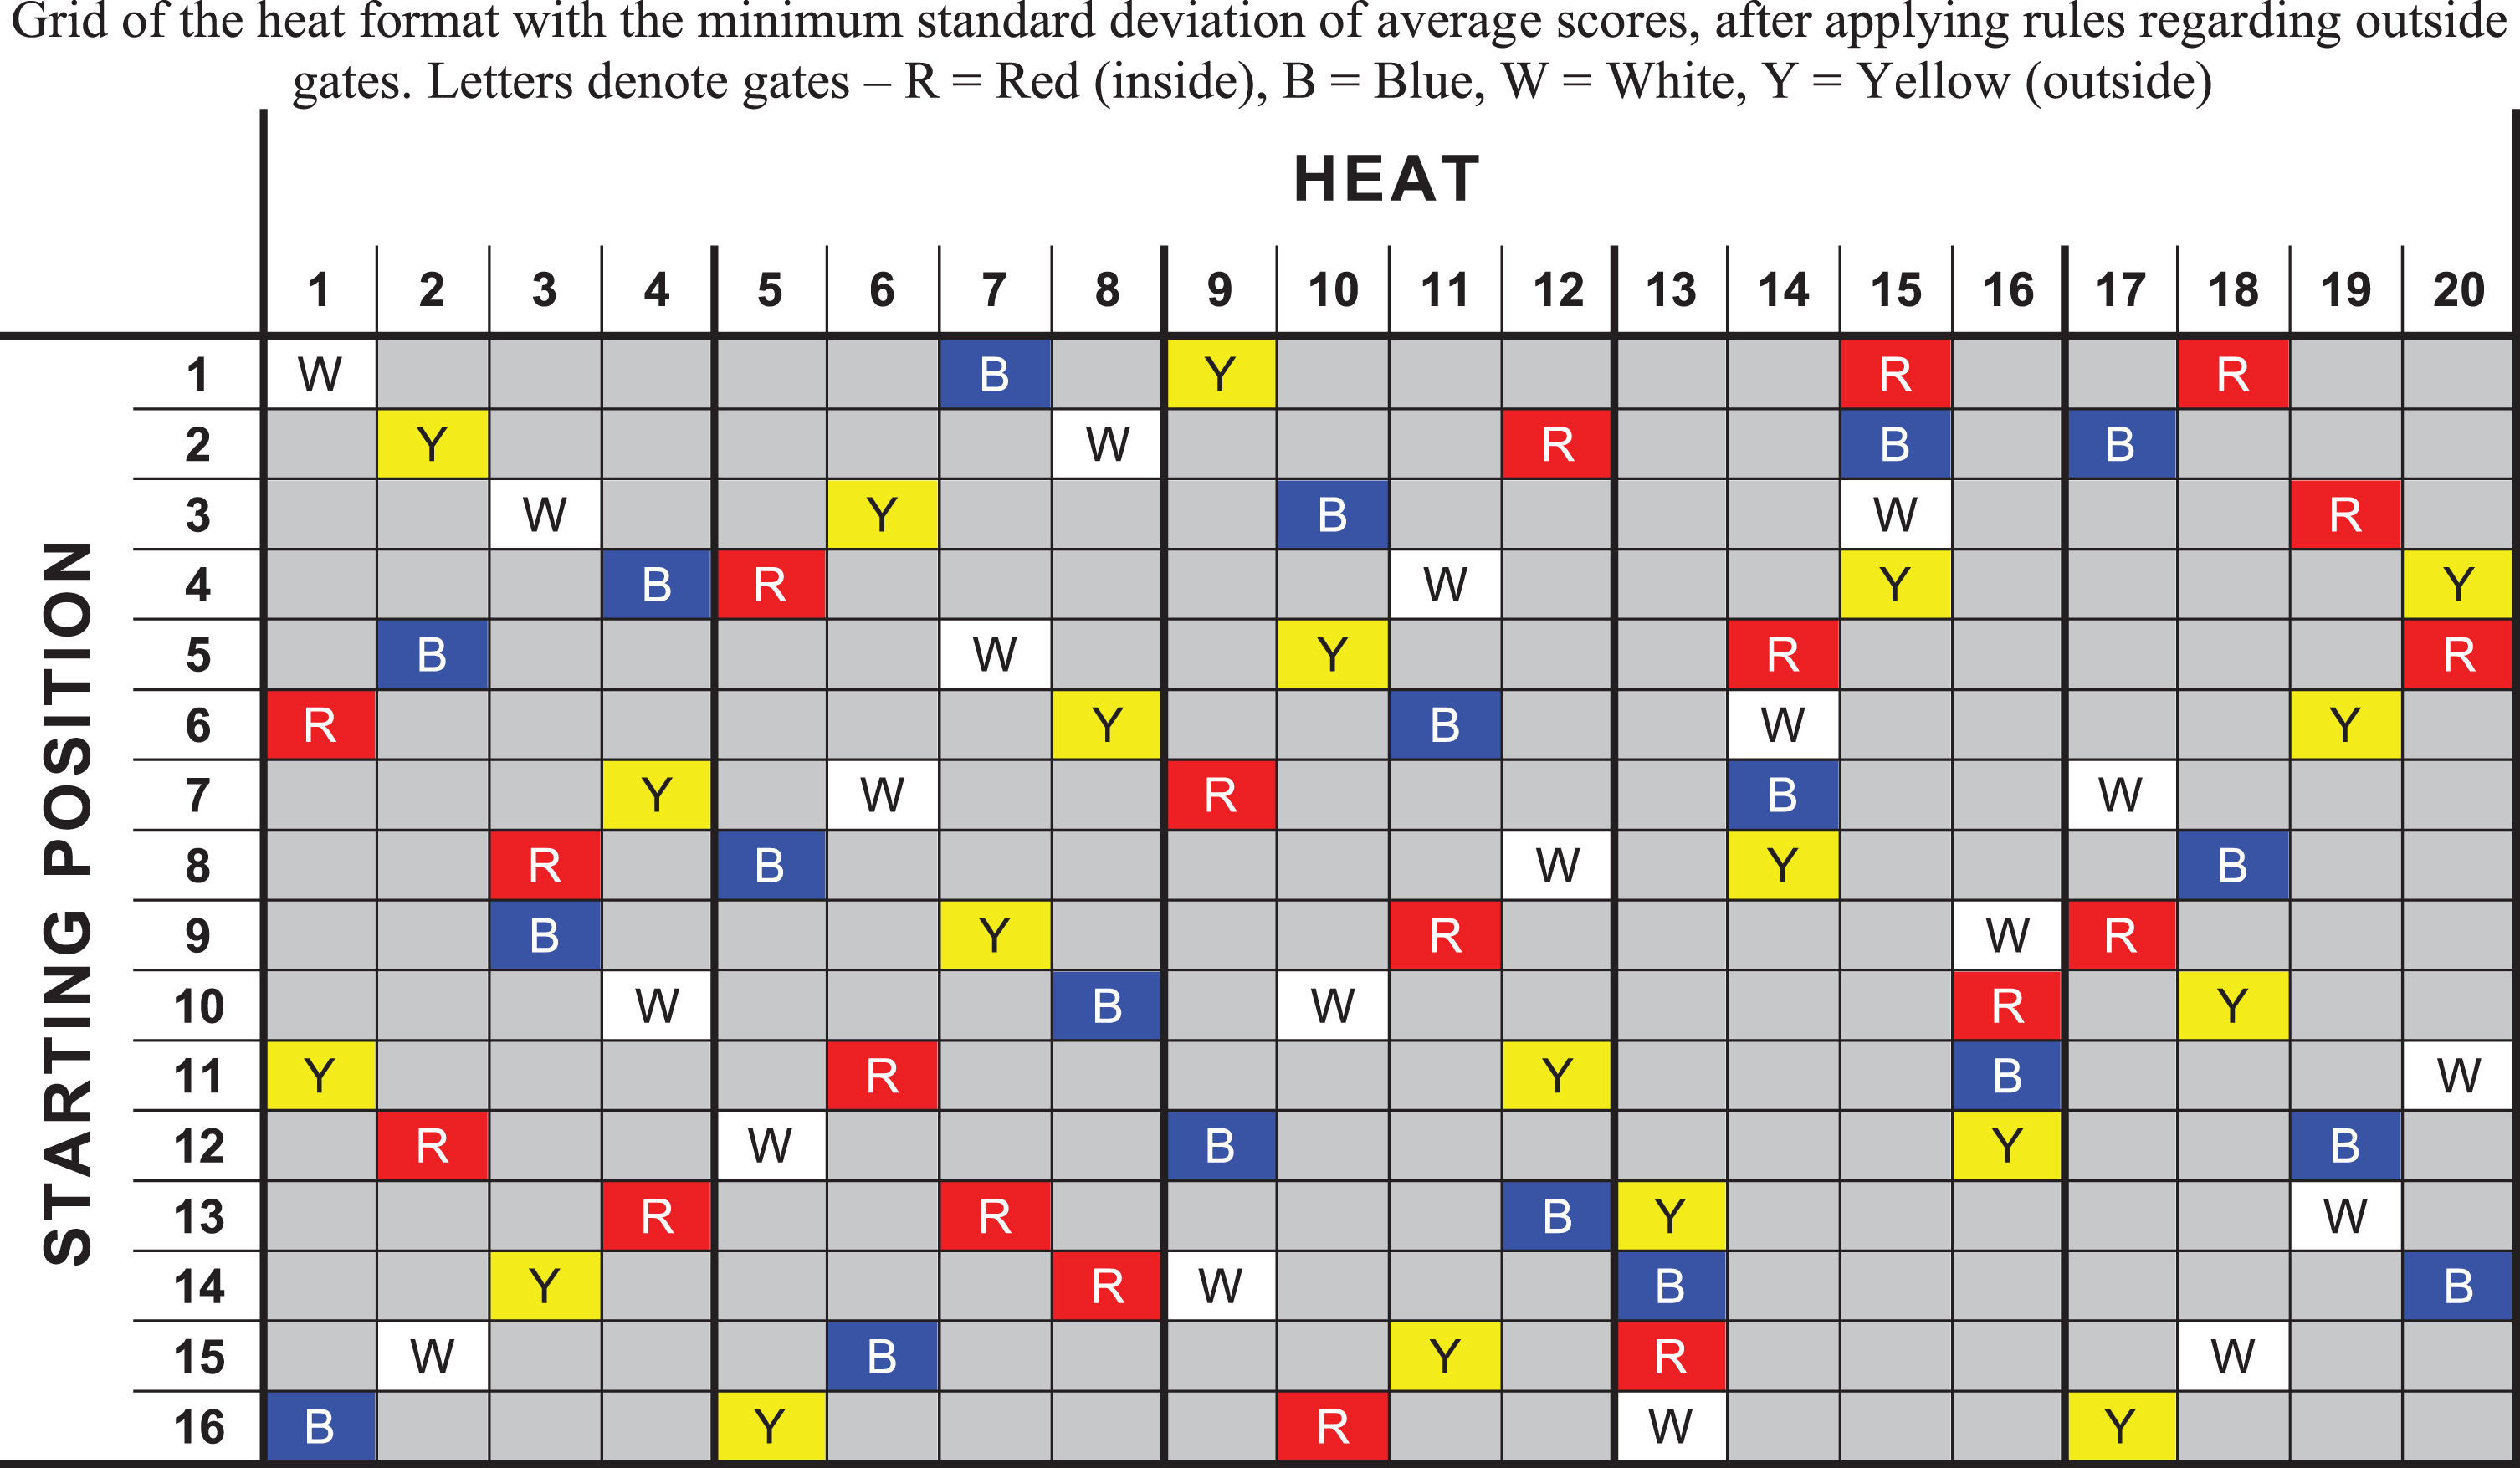
Table 14
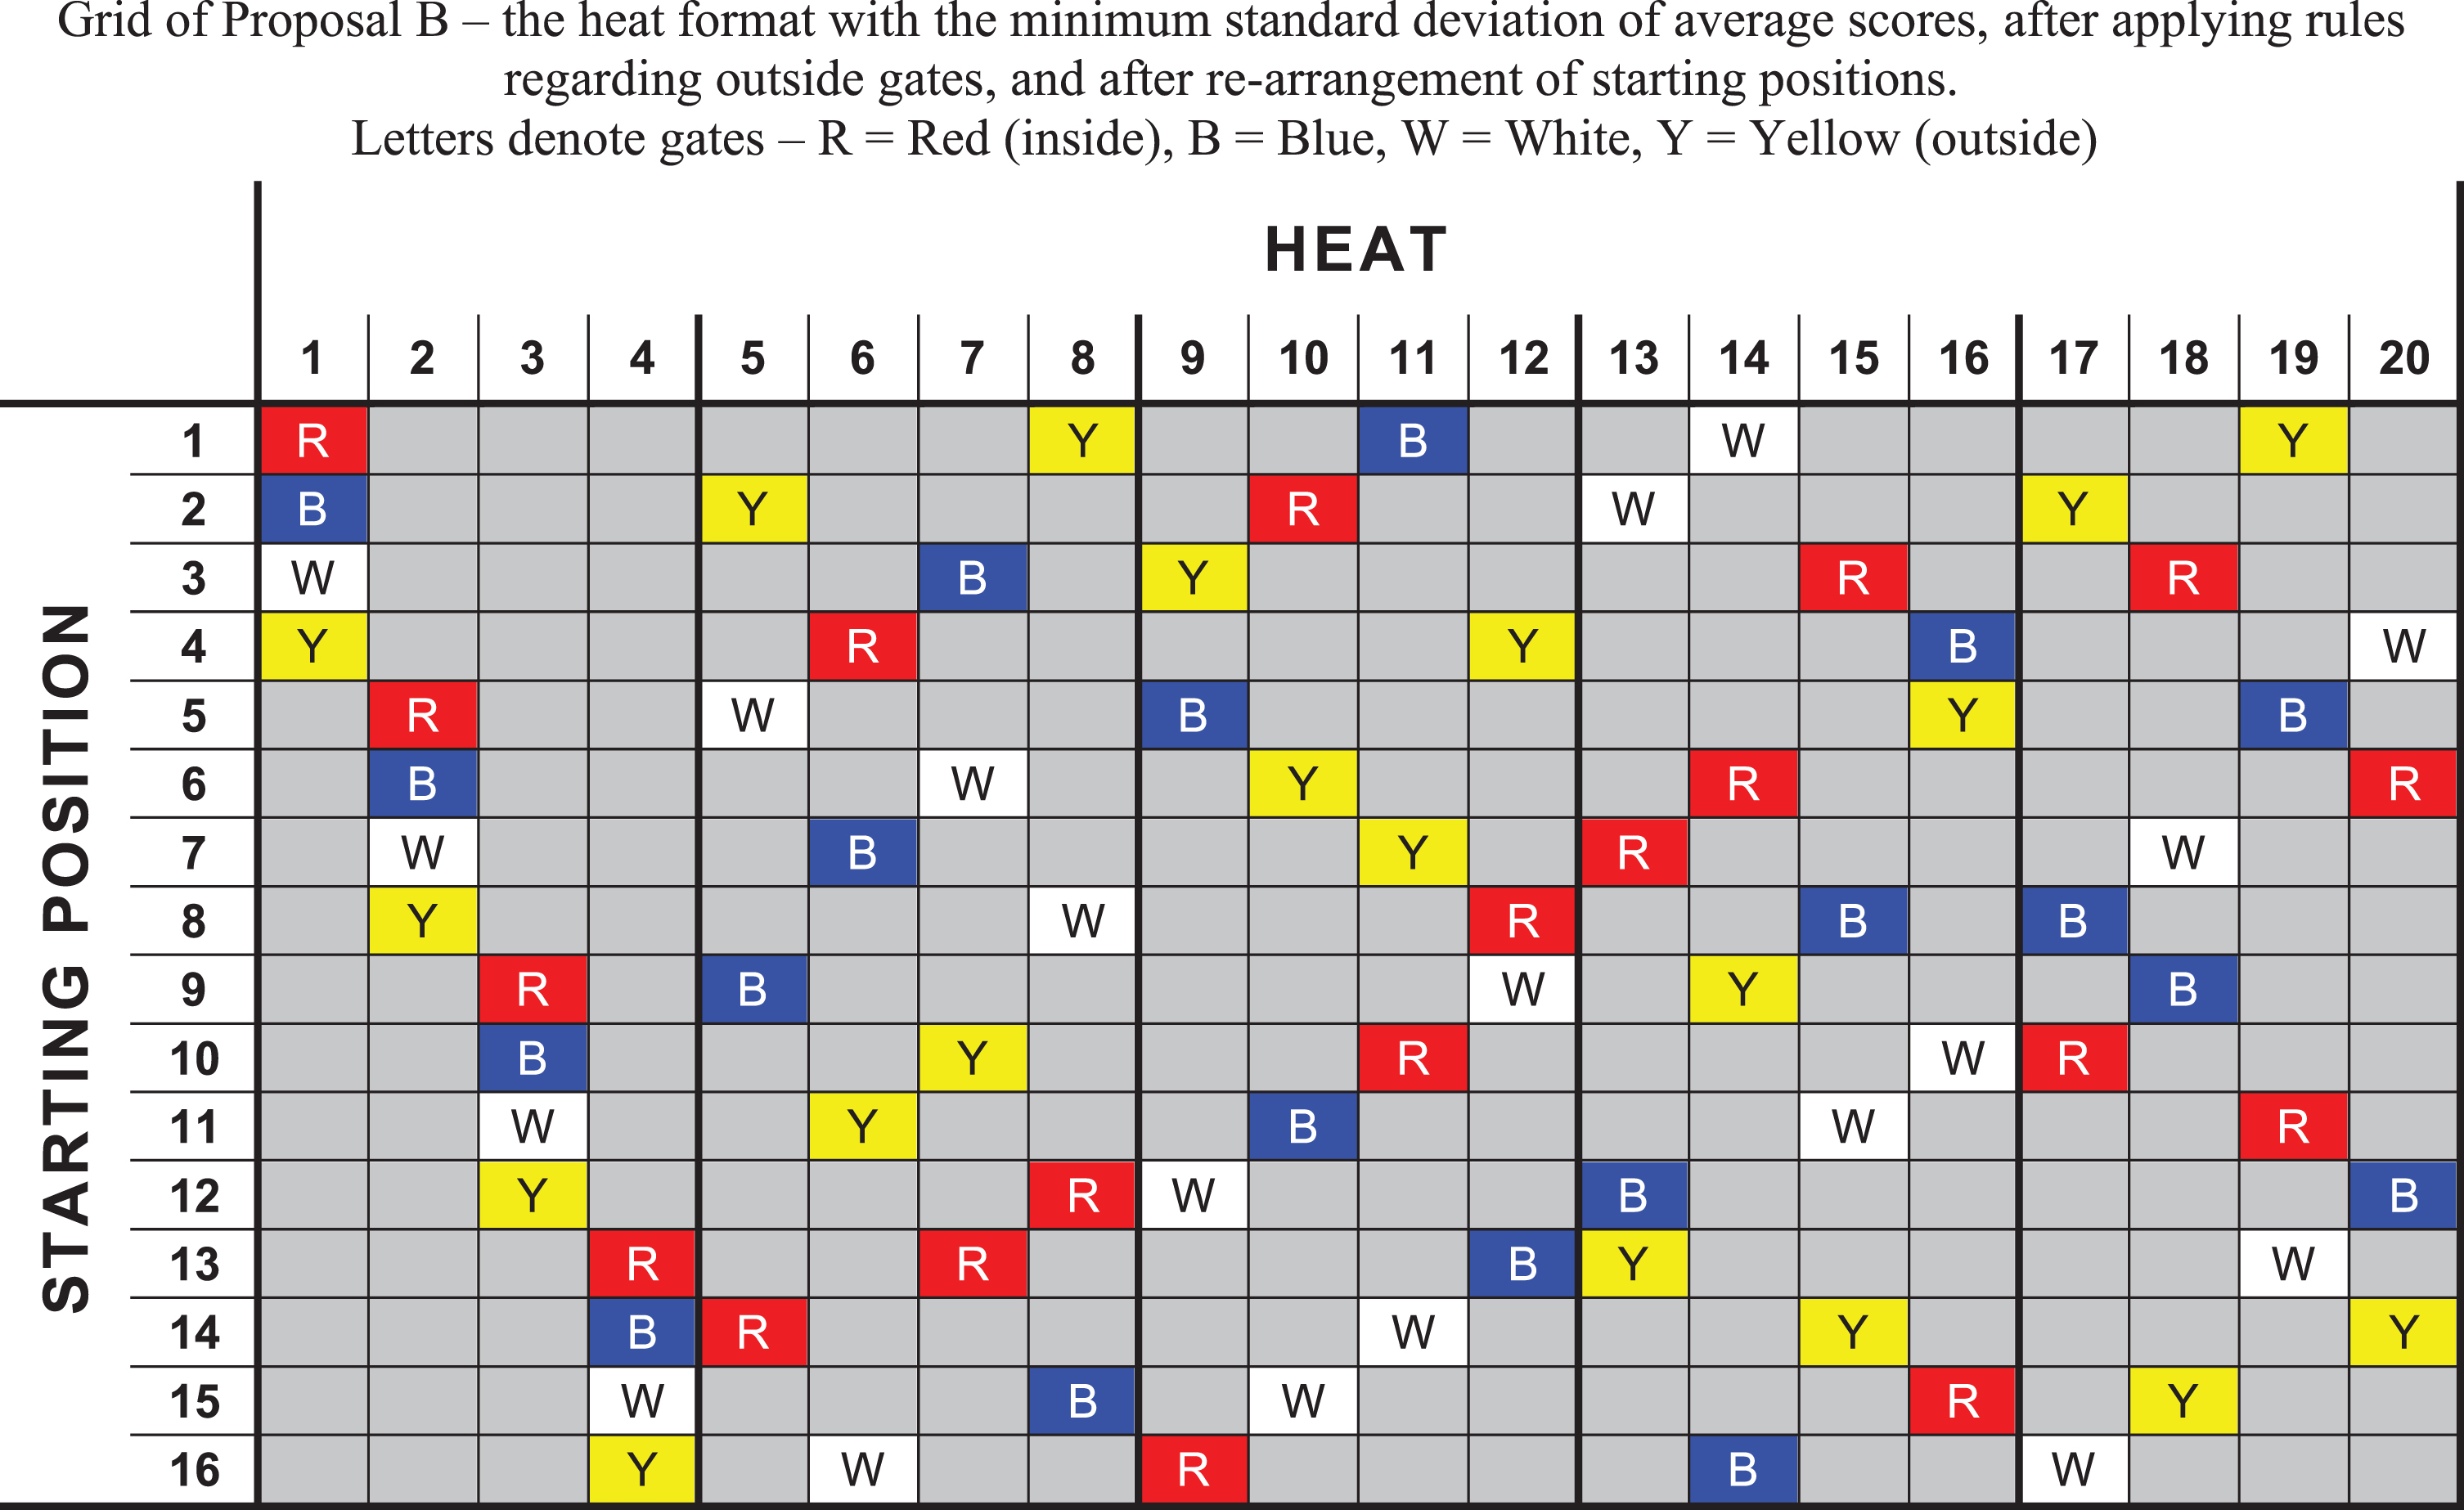
Table 15 shows the total five-ride scores for each starting position under Proposal B. The standard deviation of starting position average scores is 0.165 points, compared with 0.077 points for Proposal A and 0.436 points for the current SGP heat format. There is a 0.55 points difference between the best (7.79 points) and worst (7.24 points) starting positions, compared to a 0.28 points difference for Proposal A and 1.80 points with the current SGP heat format. This demonstrates that Proposal B still gives a significantly tighter spread of starting position average scores compared to the current format, although not quite as tight as Proposal A.
Table 15
Average score for each starting position for the Proposal B heat format
| Starting position | Average score |
| 1 | 7.45 |
| 2 | 7.53 |
| 3 | 7.39 |
| 4 | 7.66 |
| 5 | 7.61 |
| 6 | 7.68 |
| 7 | 7.39 |
| 8 | 7.74 |
| 9 | 7.33 |
| 10 | 7.57 |
| 11 | 7.30 |
| 12 | 7.43 |
| 13 | 7.47 |
| 14 | 7.28 |
| 15 | 7.24 |
| 16 | 7.79 |
Table 11 shows the maximum and minimum starting position average scores for Proposal B across the five tracks with 10 or more SGP meetings. Proposal B gives a tighter spread of starting position average scores than the current SGP heat format at all five tracks. Furthermore, Proposal B performs better than Proposal A at three of the five tracks: Cardiff (1.50 points difference versus 2.00 points for Proposal A); Malilla (1.69 points versus 2.31); and Copenhagen (1.70 points versus 2.30). Proposal A is still superior for Prague (2.07 points difference versus 2.72 points for Proposal B) and Krsko (3.20 points versus 3.30 points). However, in both cases there is still a considerable improvement for Proposal B against the current SGP heat format.
Proposal B is therefore recommended as the preferred heat format for future SGP seasons. It has been shown to significantly reduce the starting position bias of the current SGP heat format, while avoiding undesirable combinations of outside gates for any of the starting positions.
6Conclusions
This study has shown a clear starting position bias in the SGP. The best starting position has an average score of 8.37 points with a success rate of 57%, while the worst has an average score of 6.57 points with a success rate of 38%. A detailed examination of each heat and gate combination has illustrated the primary contributing factors to this starting position bias: the colour of a starting position’s double gate; the time during a meeting at which specific gates are taken; and the proximity of rides to a track preparation session.
Proposals have been made for new SGP heat formats with reduced starting position bias. A computer model has been created to test all possible re-arrangements of the current SGP heat format to find the lowest standard deviation of average scores. Proposal A has been shown to reduce the points difference between the best and worst performing starting positions down to 0.28 points, compared with 1.80 points for the current SGP heat format. Proposal B reduces this points difference down to 0.55 points, while improving the gate profile of starting positions compared with Proposal A.
The Proposal B heat format is recommended for use in future SGP series. It has the potential to make SGP meetings fairer, while enhancing spectator excitement by producing tighter and more competitive meetings. It should be noted that Proposal B is being recommended as the new heat format purely for the SGP and not for any other speedway competition. It is the product of 14 years of SGP history across a unique and diverse array of tracks, involving the very best riders in the world. It is therefore finely tuned to the unique characteristics of the SGP competition. It would be inappropriate to apply the findings to other competitions across alternative collections of tracks with riders of different abilities. Nevertheless, the method used to arrive at this proposal could be applied to other speedway competitions where sufficient historical data exists for robust statistics.
The Proposal B heat format was considered by the FIM in autumn 2019, but it will not be implemented for the 2020 season. The situation may be reconsidered for future seasons.
Acknowledgments
The author is grateful to Phil Morris, FIM Race Director of the SGP, for feedback on the proposed heat formats. The author is also grateful to Jim Henry, of The Speedway Researcher, for assistance with identifying the earliest use of the current SGP heat format. This study is not affiliated with, or endorsed by, the FIM.
References
1 | Anderson, I. , and Denniston, R.H.F. , (1977) , Designing speedway tournaments, The Mathematical Gazette, it 61(417) 223–224. |
2 | Author, 2019. Personal data archive. |
3 | Bamford, R. and Shailes, G. , (2002) , A history of theWorld Speedway Championship. Stroud, Tempus Publishing. |
4 | Budden, F. , (1977) , Speedway tournaments in the classroom, The Mathematical Gazette 61: (418), 266–272. |
5 | Chaplin, J. , (1979) , Speedway – the story of the World Championship. Ipswich, Studio Publications. |
6 | FIM. (2019) a, Rulebook – FIM Speedway Grand Prix World Championship. FIM. Retrieved from http://www.fim-live.com/en/library/download/74568 |
7 | FIM. (2019) b, FIM Official Results – Speedway Grand Prix. FIM. Available at: http://www.fim-live.com/en/sport/ranking/speedway-grand-prix/ and https://www.speedwaygp.com/season-results |
8 | Fletcher, T. J. , (1976) , Speedway tournaments, The Mathematical Gazette, 60: (414), 256–262. |
9 | May, C. , (1978) , Ride it! The complete book of speedway. Yeovil, Haynes Publishing. |
10 | Martin, S. , Starbuck, C. and Coyle M. , (2014) , The relationship between heart rate and positioning in professional speedway riders, Journal of Sports Sciences 32: (s2), s44–s50. |
11 | Norman, T. , (2002) , Speedway. Stevenage, Badger Publishing. |
12 | Poland Wikipedia, (2019) . Grand Prix IMŚ na żużlu, Poland Wikipedia. Retrieved from: https://pl.wikipedia.org/wiki/Grand_Prix_IMŚ_na_żużlu |
13 | Speedway Archive, (2019) . Speedway Grand Prix, Speedway Archive. Retrieved from: http://edinburghspeedway.blogspot.com/2014/02/speedway-grand-prix.html |
14 | Speedway Control Board, (1952) , Official programme – Speedway Championship of the World – Final. London, Wembley Stadium. |
15 | Speedway riders, history and results, (2019) , Individual World Championships and GPs, Speedway riders, history and results. Retrieved from: http://wwosbackup.proboards.com/thread/2932 |
16 | Speedway Updates, (2019) . Archive section, Speedway Updates. Retrieved from: http://speedwayupdates.proboards.com/#category-3 |
17 | The Speedway Researcher. (2019) , Speedway results, The Speedway Researcher. Retrieved from: http://www.speedwayresearcher.org.uk/ |
18 | UK Wikipedia, (2019) . Speedway Grand Prix, UK Wikipedia. Retrieved from: https://en.wikipedia.org/wiki/Speedway_Grand Prix |


