
A team recommendation system and outcome prediction for the game of cricket
Abstract
Predicting the outcome of a game using players strength and weakness against the players of the opponent team by considering the statistics of a set of matches played by players helps captain and coaches to select the team and order the players. In this paper, we propose a supervised learning method using SVM model with linear, and nonlinear poly and RBF kernals to predict the outcome of the game against particular side by grouping the players at different levels in the order of play for both the teams. The comparison among different groups of players at same level gives the order of groups which contributes to winning probability. we also propose to develop a system which recommends a player for a specific role in a team by considering the past performances. we achieve this by finding the similar players by clustering all the players using k-means clustering and finding the five nearest players using k nearest neighbor (KNN) classifier. We calculate the ranking index for players using the game and players statistics extracted from a particular tournament. Experimental results demonstrate that, the n-dimensional data considered for modeling is not linearly separable. Hence the nonlinear SVM with RBF kernel outperforms from the linear and poly kernel. SVM with RFB kernel yields the accuracy of 75, precision of 83.5 and recall rate of 62.5. So we recommend the use of SVM with RBF kernel for game outcome prediction.
1Introduction
Cricket is the most popular game in Asian countries, a lot of series are played across the set of different countries during a year and World Cup is played once in four years across all the cricket playing nations. Cricket is played in different formats like one day international (ODI), T20 and Test matches. Apart from this many league matches at club level and national level are played within the country. For any such tournaments, series or World Cup a suitable team of playing 11 and 4 extra players needs to be selected to form a team. Cricket team consists of a set of batsmen and bowlers with one wicket keeper who can also bat or bowl. The selectors and team captain has to select batsman and bowlers in the team with a wicket keeper. Each batsman in the team will be specialized to bat at a different position in the playing eleven and there are varieties of bowlers like spin, fast and medium fast in the team. Team members need to be selected from a pool of players depending on the opponent team against which the team is playing. The team selected may also be analyzed on their strength to chase or target setting against the team which they play. So selecting such a team by coaches and captain is biased and error prone, this decision depends on the experience and analytic skills of the individual by using the performance measures and statistics of the players. So automating the selection process by considering the performance measures and forecasting the match outcome helps coaches and captains to select the most efficient team which have higher chances of winning the game. The other challenge which might occur during selection is the lack of or few number statistics of the new player who have not played many international series. In this scenario, it becomes very important to correlate the new player with the existing player database with the statistics of club level and few international level games he had played. To automate such process, we propose a team selection and predicting the outcome of a game with player profiling facility to assign the performance measure to the new player.
Many people have worked on team selection, optimal ordering of the team and win prediction of the cricket game. A genetic algorithm is used to automate the cricket team selection of 15 members (11 playing and 4 extra players). This algorithm represents the team as a string by considering each player as a bit in a sting. Later these strings are evaluated using objective function and is converted into fitness. This is genetically evolved using the cross over, mutation and replacement techniques to select the Indian squad for the World Cup. To bid players for a league match IPL (Indian Premier League) played in India with a budget constraint, franchises considered both budget constrains and the player performance while selecting the team. With these multiple constraints an optimal team was selected with the best bowling and batsman using a nondominant sorting genetic algorithm (NSGA II) by solving the multi-objective optimization problem Ahmed et al. (2011); Omkar and Verma, (2003). A team selection is done using a short cricket series by using linear integer programming. Various measures used in the literature are discussed in detail and the measure is proposed which is derived by comparing the individual performance with the team performance in the series. Lemmer (2013). After or while the team is selected, optimal ordering of the batsmen and predicting the match outcomes are performed to forecast the success of the team selected. An optimal team line up is found from the huge combinatorial space using simulated annealing algorithm by considering the batting and bowling characteristics of the selected players. Parameters like Batting average (BA), Batting strike rate (SR), Bowling average (BA), Bowling economy rate (ER) is used Perera et al. (2016); Swartz et al. (2006). The combination of a supervised and unsupervised algorithm is used to predict the outcome of the one-day international match by using linear regression and nearest neighbor clustering methods. Using these methods, a total number of runs to be scored in the match is forecasted which is one of the important components in predicting the outcome of the match. Historic features extracted from the previous matches is combined with the ongoing match features like a number of wickets and runs scored are used in prediction Sankaranarayanan et al. (2014). The logistic regression model is used to extract features from the one-day cricket as the match is in progress, which reduces the parameters dramatically. Cross-validation method is used to decide the parameters which need to be used for the model Asif and McHale (2016). A software tool crickAI is developed using the machine learning technique bayesian classifier to predict the outcome of the one-day match. Factors like scoring, both the team strengths, toss, day-night match effect, home ground advantage are factors used for analysis Kaluarachchi and Aparna (2010). The score made by each team and difference between the scores of both the teams are approximated to the normal distribution, which facilitates the use of multiple linear regression to predict a score of the team batting first and victory margin in ODI Bailey and Clarke (2006). Multinomial logistic regression is used to predict the outcome of the test match as a multinominal response (win, draw, loss) using the match position at the session start and pre-match team strength and other features of test cricket Akhtar and Scarf (2012).
In this research, we propose a framework which predicts the outcome of the matches and performs team analysis and recommends the player role by extracting the statistics about the cricket game and players from various websites. The contributions of the proposed frame work are as follows:
1 Extract the unstructured data about match and players from the sports website and are stored in the database.
2 From the database, statistics are used to quantify the player performance measures to rank the players.
3 Develop a model to predict the outcome of the match, based on the players playing in both the teams using the historical data of the matches.
4 Provides the team structure analysis of the selected team which contributes to win.
5 Recommends a preferred role for a given player by finding the set of similar players in the database.
The following sections explain the proposed framework.
2Proposed framework
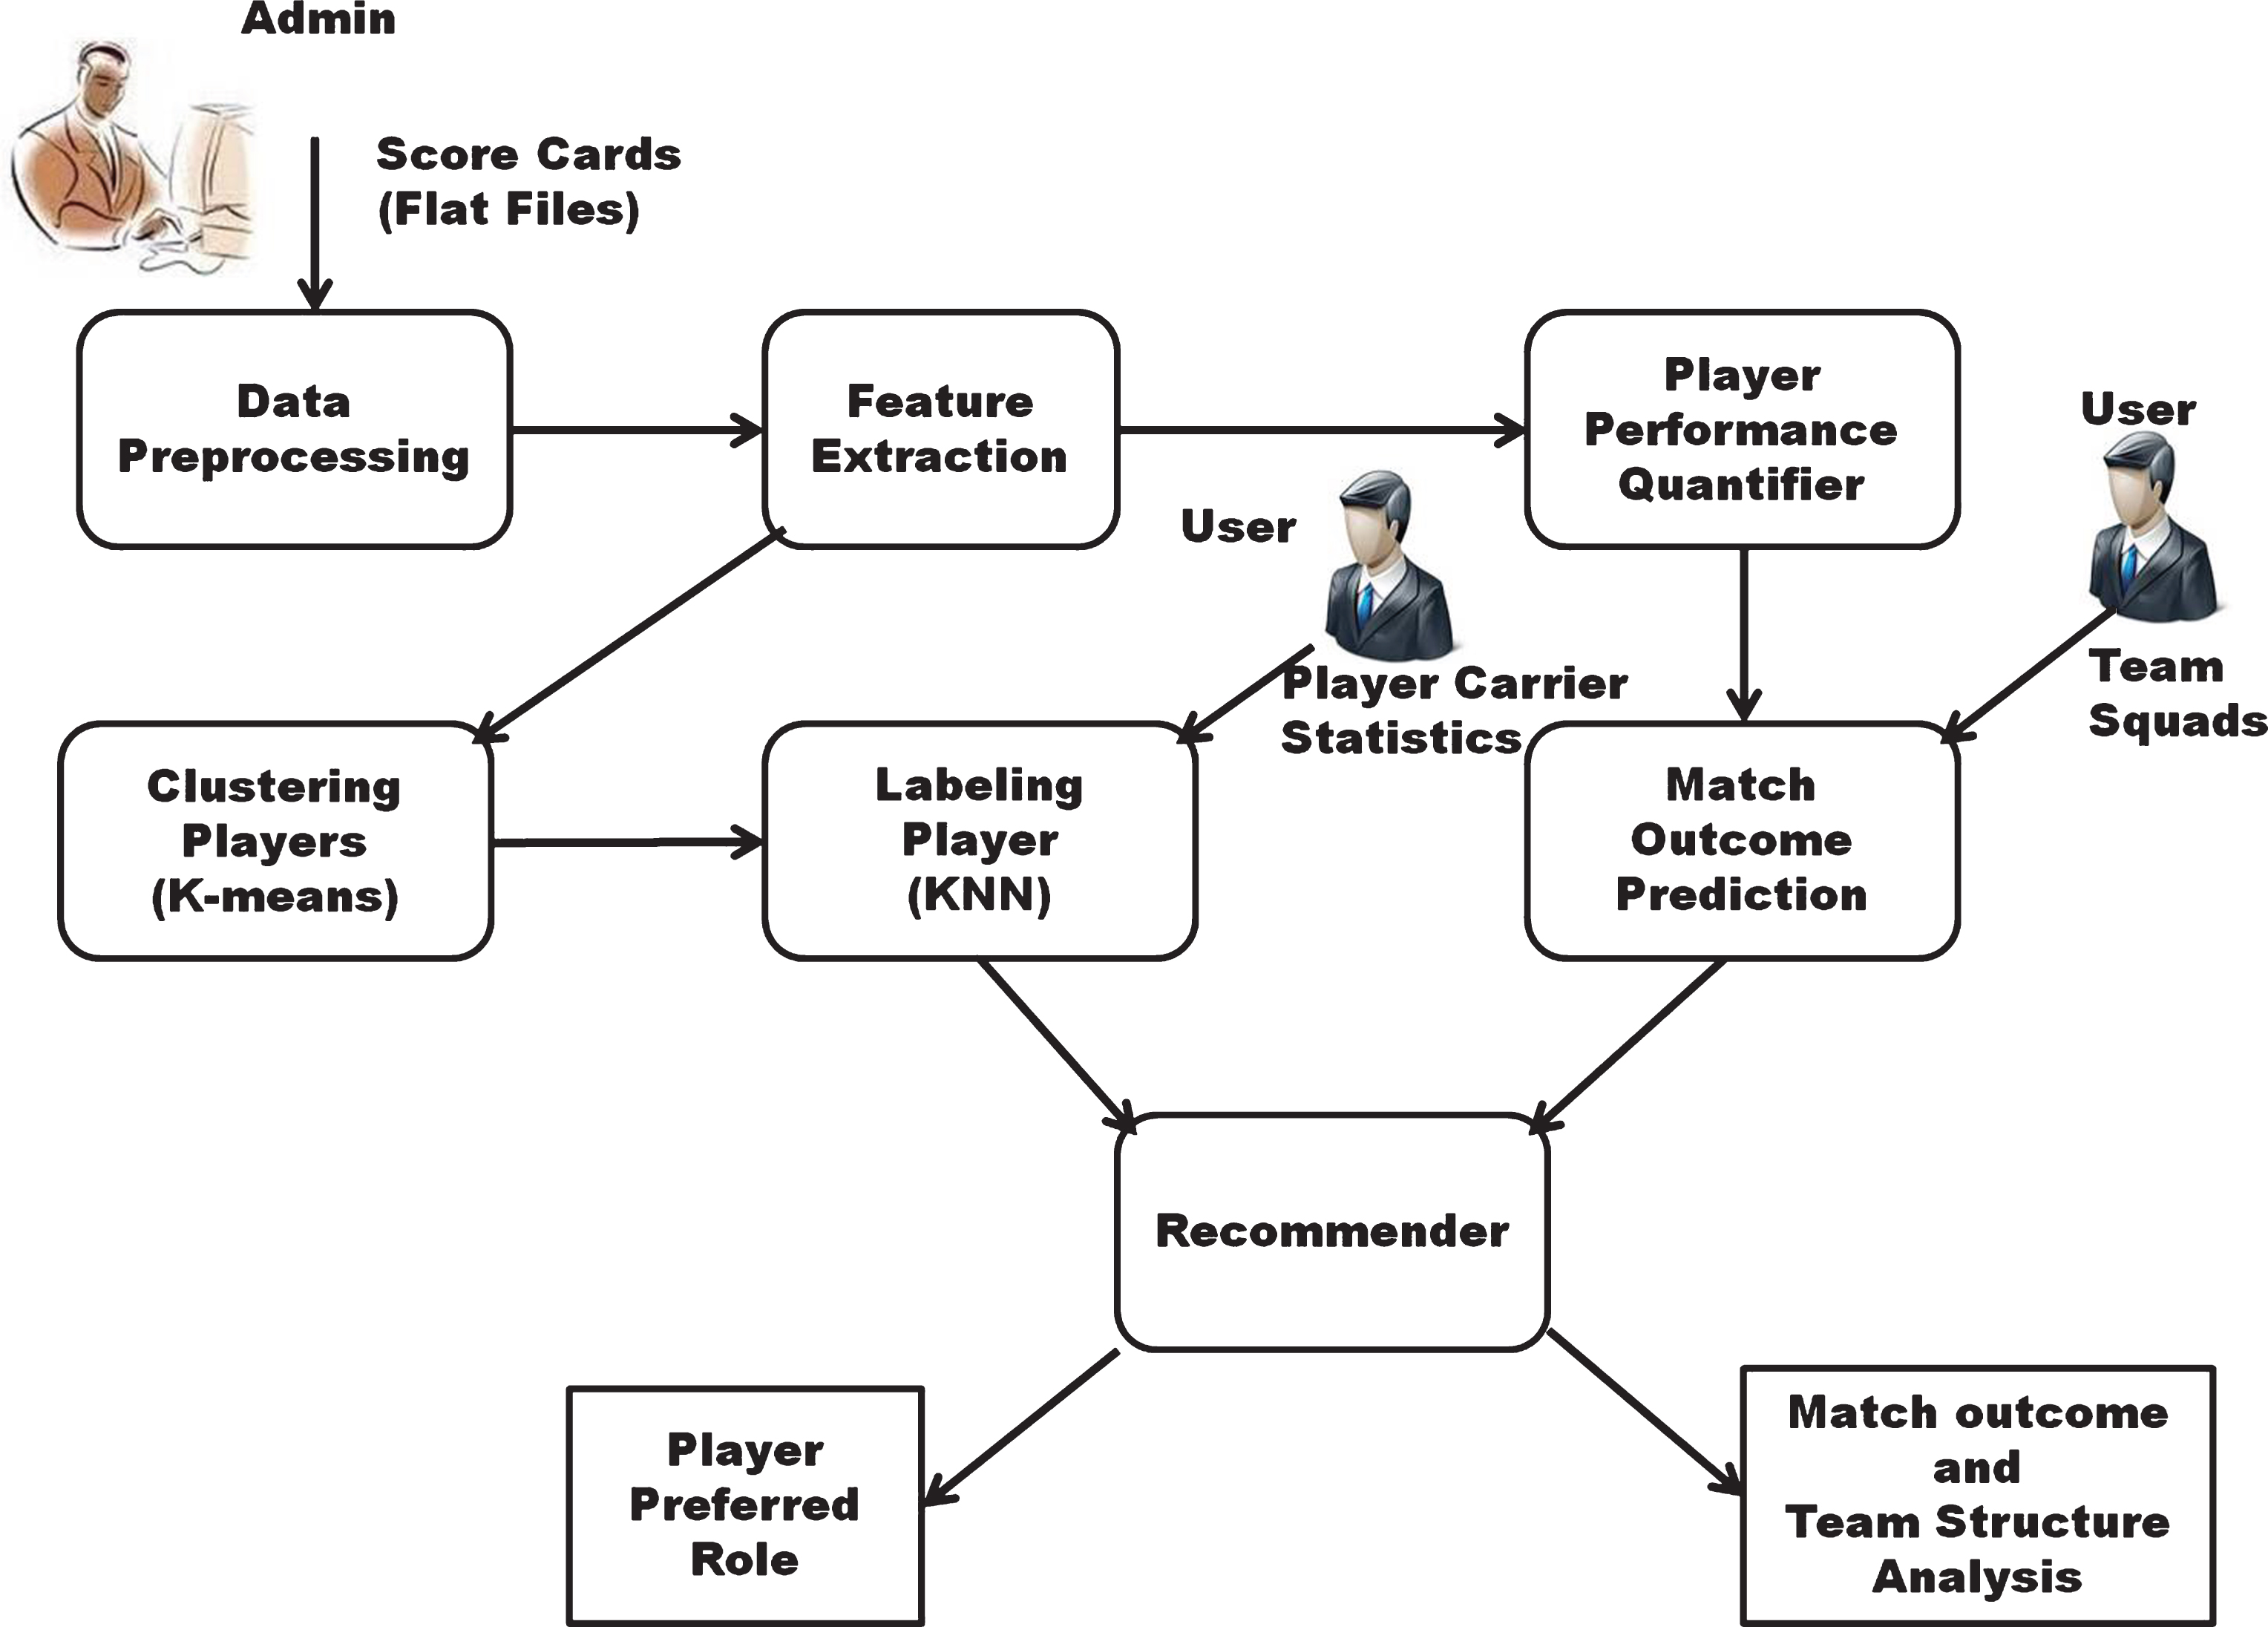
The proposed framework for match win prediction, team analysis and player recommendation comprised of four phases: Player specific data collection, player performance quantification, model for win prediction and team structure analysis and player preferred role recommendation system as shown in the Fig. 1. In the first phase, the unstructured match data is pre-processed and stored in the data store. This data is input to next phase viz. player performance quantification, this phase uses the statistics of the players stored in the database to quantify and rank the players. This player statistics and player quantification details are used in later two phases. In win prediction and team structure analysis phase, the player quantification and historic match win or lose data is used to train the SVM for predicting the win or loss percentage. In the final phase, the clustering and k-nearest neighbor methods are used to recommend the preferred role for given player.
Fig.1
Proposed framework.
2.1Player specific data collection
To collect the statistics of the match we have considered 2011 cricket World Cup (CWC) and the scorecards provided in the Howstat.com. These score cards are retrieved and the contents are stored into the database. MySql files are created using the score card data which contains the tables batting card, bowling card, match card and player card. Batting card contains batting statistics per innings wise for all players, bowling card contains bowling statistics per innings wise for all players, match card contains data about each match.i.e., venue, toss, win margin etc. The player card contains the records of complete professional details about each player in the squad announced by each team. From this database, an aggregate data about the performance statistics for both batting and bowling roles for the whole tournament is extracted and stored. From this aggregated values different performance measures are evaluated about the batsmen, bowlers, and overall tournament averages. The details of the same are explained in the next section.
2.2Player performance quantification
Performance measures derived for players and tournament using the players and match statistics helps coaches and captains in team selection, win prediction, team analysis and decide the role for a given player. To create the performance measures and to rank the players, we have used the statistics derived and stored in the database in the previous section. People have worked on different types of game data to derive the performance measures about the players and specific games. In cricket, the ranking of the players is done using the batting average, a strike rate of the batsman, average number of wickets taken and the runs conceded by the bowlers. Measuring the performance of the players with only these measures may not be sufficient. Along with these measures, consistency of the batsman and weights is associated with the strength of opponents to measure the player performance Lemmer (2004, 2007). Similarly, methods are proposed to find one measure for bowling performance and use the type of wickets taken by the bowler (top order batsmen or tail end batsmen) to rank the players Lemmer (2005). To select the player for international cricket matches, performance measures are evaluated for the player with records of the local performances, which could be correlated to international level measures Lemmer (2009). So to find the outcome of the match specific measures of player needs to be used, which could be compared with the opponent team player measures. so we have used the statistics of batsman and bowlers available on the net to create players ranking for batsman and bowlers. The details of performance measure evaluations for both batsmen and bowlers are given in the following sections.
2.2.1Batting measures and ranking index for batsman
To rank the batsman, we have collected the information about particular batsman like total runs scored by the batsman, number of innings played, number of times the batsman is out, number of balls faced, total number of 4’s and 6’s hit by the batsman, number of 100’s and 50’s and highest score of the batsman in the whole tournament. This data is further used to compute the features which aid in quantifying the players.
(1)
(2)
(3)
(4)
(5)
The Batting Average (BA) given in Equation 1 gives the average runs scored by the batsman in the tournament which considers only the innings played by the batsman and it subtracts it with the number of times batsman was not out during the innings in the tournament (NOI). This is considered because of the assumption that the batsman would have scored more number of runs in case he had a chance of batting. The Batting strike rate (BS) given in Equation 2 provides the information about an average number of runs scored per 100 balls faced by the batsman. To incorporate the consistency of the batsman, we found that Milestone reaching ability (MRA) using the formula given in the Equation 3, which uses the total number of 100’s and 50’s made by the batsman, which contributes to the total score of the team. The aggressiveness of the batsman is measured by the capability of the batsman to hit more number of fours and sixes. To calculate the boundary runs per innings (BRPI) the Equation 5 is used which considers the total number of four’s and six’s hit by the batsman in the tournament.
As we are quantifying the players and rank them in the order for particular series, We have devised a method in which the overall performance of the tournament is considered. Three measures general batting average (Bat_gen_avg), general batting out rate (Bat_gen_outrate) and batting general strike rate (Bat_gen_sr) is calculated by using the aggregated measures of the tournament like total number of runs scored (Tr), total number of wickets taken (TW) and total number of balls bowled (Tb)in the entire tournament. These measures are given by the following equations.
(6)
(7)
(8)
Using the generic performance of the overall tournament and the player specific information in the tournament, we find the AGR (above generic average runs) for each player and is given by the Equation 9.
(9)
Using AGR and team generic batting average the ranking index (RI) for the batsmen is calculate using the Equation 10.
(10)
2.2.2Bowling measures and bowler ranking index system
Similar to batsman ranking index, the bowler ranking index is calculated. The parameters for the bowler is calculated using the number of runs conceded, a number of wickets taken and the number of overs bowled by the bowler and it is given by the following equations. where Bowl_avg gives the ratio of runs conceded per wicket taken, Bowl_sr is the average number of balls bowled per wicket taken and Bowl_er provides the information about the average number of runs conceded per over for each batsman:
(11)
(12)
(13)
(14)
The generic tournament parameters with respect to bowlers are given by bowler general average(Bowl_gen_avg), bowler general outrate (Bowl_gen_outrate) and bowler general strike rate (Bowl_gen_sr) by considering the runs conceded (tc), total wickets (tw) and total balls bowled (tb) in the whole tournament. These measures are given in the following equations.
(15)
(16)
(17)
The AGR and Ranking index is given by
(18)
(19)
3Match outcome prediction and team structure analysis
To predict the match outcome, we use a support vector machine (SVM). SVM is a supervised classification technique which creates a separation plane between the positive and negative samples. We have used the SVM with linear and nonlinear techniques to predict the outcome of the match as a binary class problem. The prediction classes are the win (W) and loss (L) by a team in a match. The SVM does this by creating the feature vector with finite-dimension where each dimension represents the feature extracted from the historic match. This feature vector of known objects is used by SVM to train a model which assigns the class to a match as either win (W) or loss (L).
We train the SVM using a ranking index of batsman and bowlers, which is calculated using the measures evaluated in Section 2.2. The feature vector is generated by dividing the whole team into six divisions four for batting and two for bowling. These divisions are opening, top middle order, low middle order, tail-enders, pacers (both medium fast and fast bowlers) and spin. This is done for both the teams and for each division a feature is calculated by subtracting the average ranking of players in each division with the opponent team. Our system allows captain or the coach of the team to select the players in the order of their batting and bowling from both the teams and the prediction is made whether they win or lose with the specific opponent. This also helps them to see the strength and weakness of the team at particular division against particular team. So we also project the strength and weakness of the team at different levels of the team. so the feature vector X = {xop, xtm, xlm, xte, xfb, xsb} which represents the value calculated for each division and the outcome of the prediction y = {W, L} where W represents win and L represents the loss. These feature vector X is used to train the classifier with linear and nonlinear SVM.
3.1Linear SVM
Linear SVM is best suited for the linearly separable classes and the hyperplane representing the decision boundary is given by W . x + b = 0, where w and x are parameters of the model. Considering our outcomes of the game we can write the equations as:
W. X + b ≥ 0 for y=W, W. X + b ≤ 0 for y=L.
Using the input vector of the training samples, parameters w and b of the decision boundary is estimated. Parameters are chosen such that the following conditions are met: W. Xi + b ≥ 1 if yi =1, W. Xi + b ≤ 1 if yi =-1.
This impose the training samples with y=1 are placed above the hyperplane W. X + b=1 and for y=-1 are located below the hyperplane W. X + b = -1. These inequalities are summarized as yi(W. Xi + b) ≥ 1, i=1,2....,N.
In linear classifier, margin of the decision boundary must be maximal. This could be maximized by minimizing the objective function: f(w)=
the learning task in SVM is formalized by following constrained optimization problem:
3.2Nonlinear SVM
Nonlinear SVM is applied on the data sets that have nonlinear decision boundary. This uses a trick which transforms the data from the original coordinate space in X into a new feature space φ (X) and uses the linear decision boundary to separate the instances in transformed space. The learning task for nonlinear SVM can be given as the following optimization problem.
subject to yi(w. φ(Xi) + b ≥ 1, i=1,2,....,N, the difference between linear and nonlinear kernel is that instead of using original attributes of X, the learning task is performed on the transformed attributes φ (X). SVM with poly kernel is a nonlinear kernel which deals with all non-linearly separable data set. This represents the values of the feature vector X of our training samples into polynomials in the feature space. This is represented by the equation K (X, Y) = (XTY + c) p for the polynomial of degree p. where X and Y represent the feature vector in the input space and c represents the parameter which makes a trade-off between higher order and lower order term.
SVM with RBF kernal: This also deals with non-linearly separable dataset. It uses a Gaussian function to establish separating hyperplane in support vector. It works basically on the density of points in support vector. Which will build as many as virtual clusters dependent on the density of points this makes classifier produce very accurate results. Equation that decides decision boundary is as follows:
The Application for match outcome prediction and players contribution at different levels for the win is performed using the graphical user interface (GUI) shown in the Fig. 2a. It provides an option to the user to select the players for both the teams in the order of batting. This input is taken and the feature vectors X for the test data is generated using the player ranking average in each section and subtracting the corresponding section player average of the opposite team. This feature vector is fed as input to the model which is trained using SVM. The outcome of the match is predicted and displayed as shown in the Fig. 2b. Evaluated values of feature vector at each section is used to find the slot contributing to win and withholding the win and are displayed as shown in the Fig. 3. Match outcome prediction using SVM is further explained in Appendix 1.
Fig.2
Application showing match prediction and results

Fig.3
Contribution of different sections made in the team.

4Player preferred role recommendation system
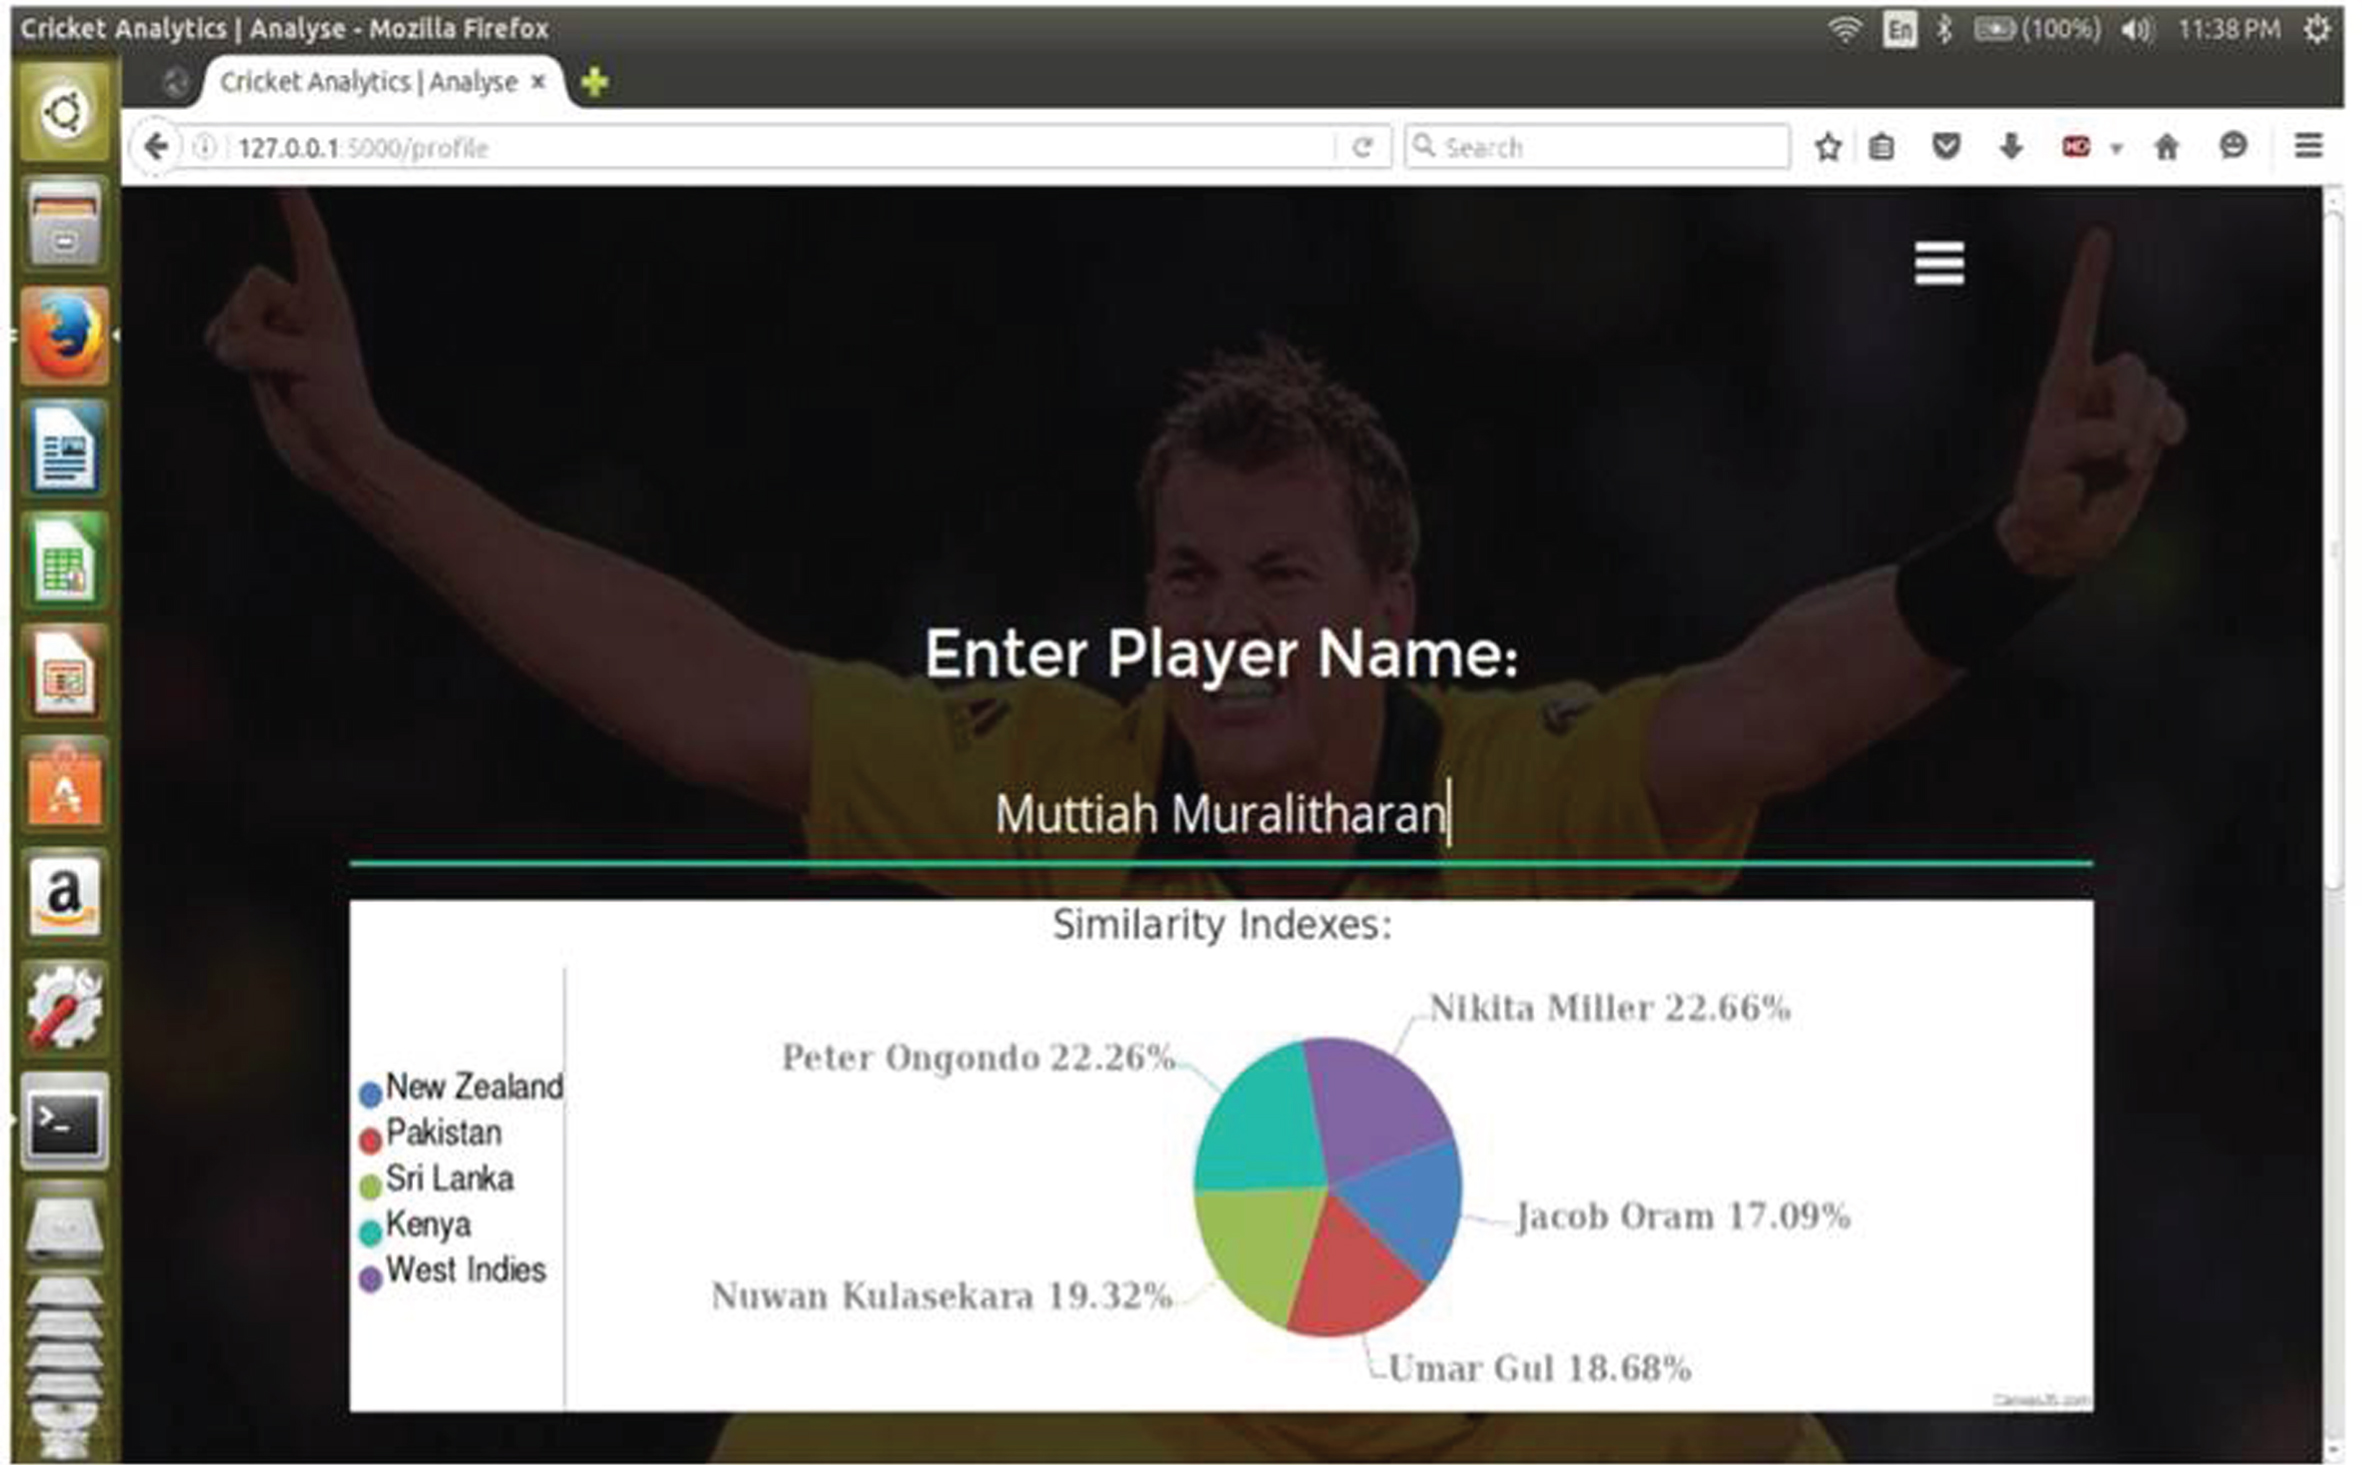
To suggest the player and position which he is suitable to play, we have proposed the player preferred role recommendation system. This system is capable of suggesting the player to the team, who had not played in the tournament or he had only played in club level matches. To achieve the same, we find five players similar to the given player and suggest the position in which he needs to play. For this purpose, we have used the statistics and performance measures found in the Section 2.2. These data set of all the players are clustered using k-means clustering by applying cosine similarity measure between the data points. After the clustering, k-nearest neighbor method is used to find five players similar to the given player. Using the information about these players, the new player is recommended for the team and his role in the team is specified. Five players and the percentage of player similarities are shown in Fig. 4. Player recommendation system is explained further in Appendix 2.
Fig.4
Player profiling showing five similar players for the given player.
5Experimental results
To validate the prediction of cricket game outcome using SVM, we have used the 2011 World Cup matches excluding the matches abounded due to rain and draw. We have collected data of 48 matches and by considering both target setting and chasing innings of a match, our data set contains historical data of 96 matches. From this data set, a player ranking is used and feature vectors set X and Y for all the matches are created as mentioned in the Section 3. This feature set is used to train and test the SVM model with linear, poly and RBF kernels. The experiments are conducted by training the SVM by selecting random 48 matches and the model is tested using remaining 48 matches, to find accuracy, precision, and recall. The formulas for all the three measures are given in the following equations and the results are shown in the Table 1.
Table 1
Accuracy, precision and recall for prediction of game outcome using SVM with linear, poly and RBF kernals.
| Kernel | accuracy(%) | precision(%) | recall(%) |
| Linear | 70.83 | 77.78 | 58.33 |
| Poly | 68.75 | 90.90 | 41.83 |
| RBF | 75 | 83.33 | 62.5 |
(20)
(21)
(22)
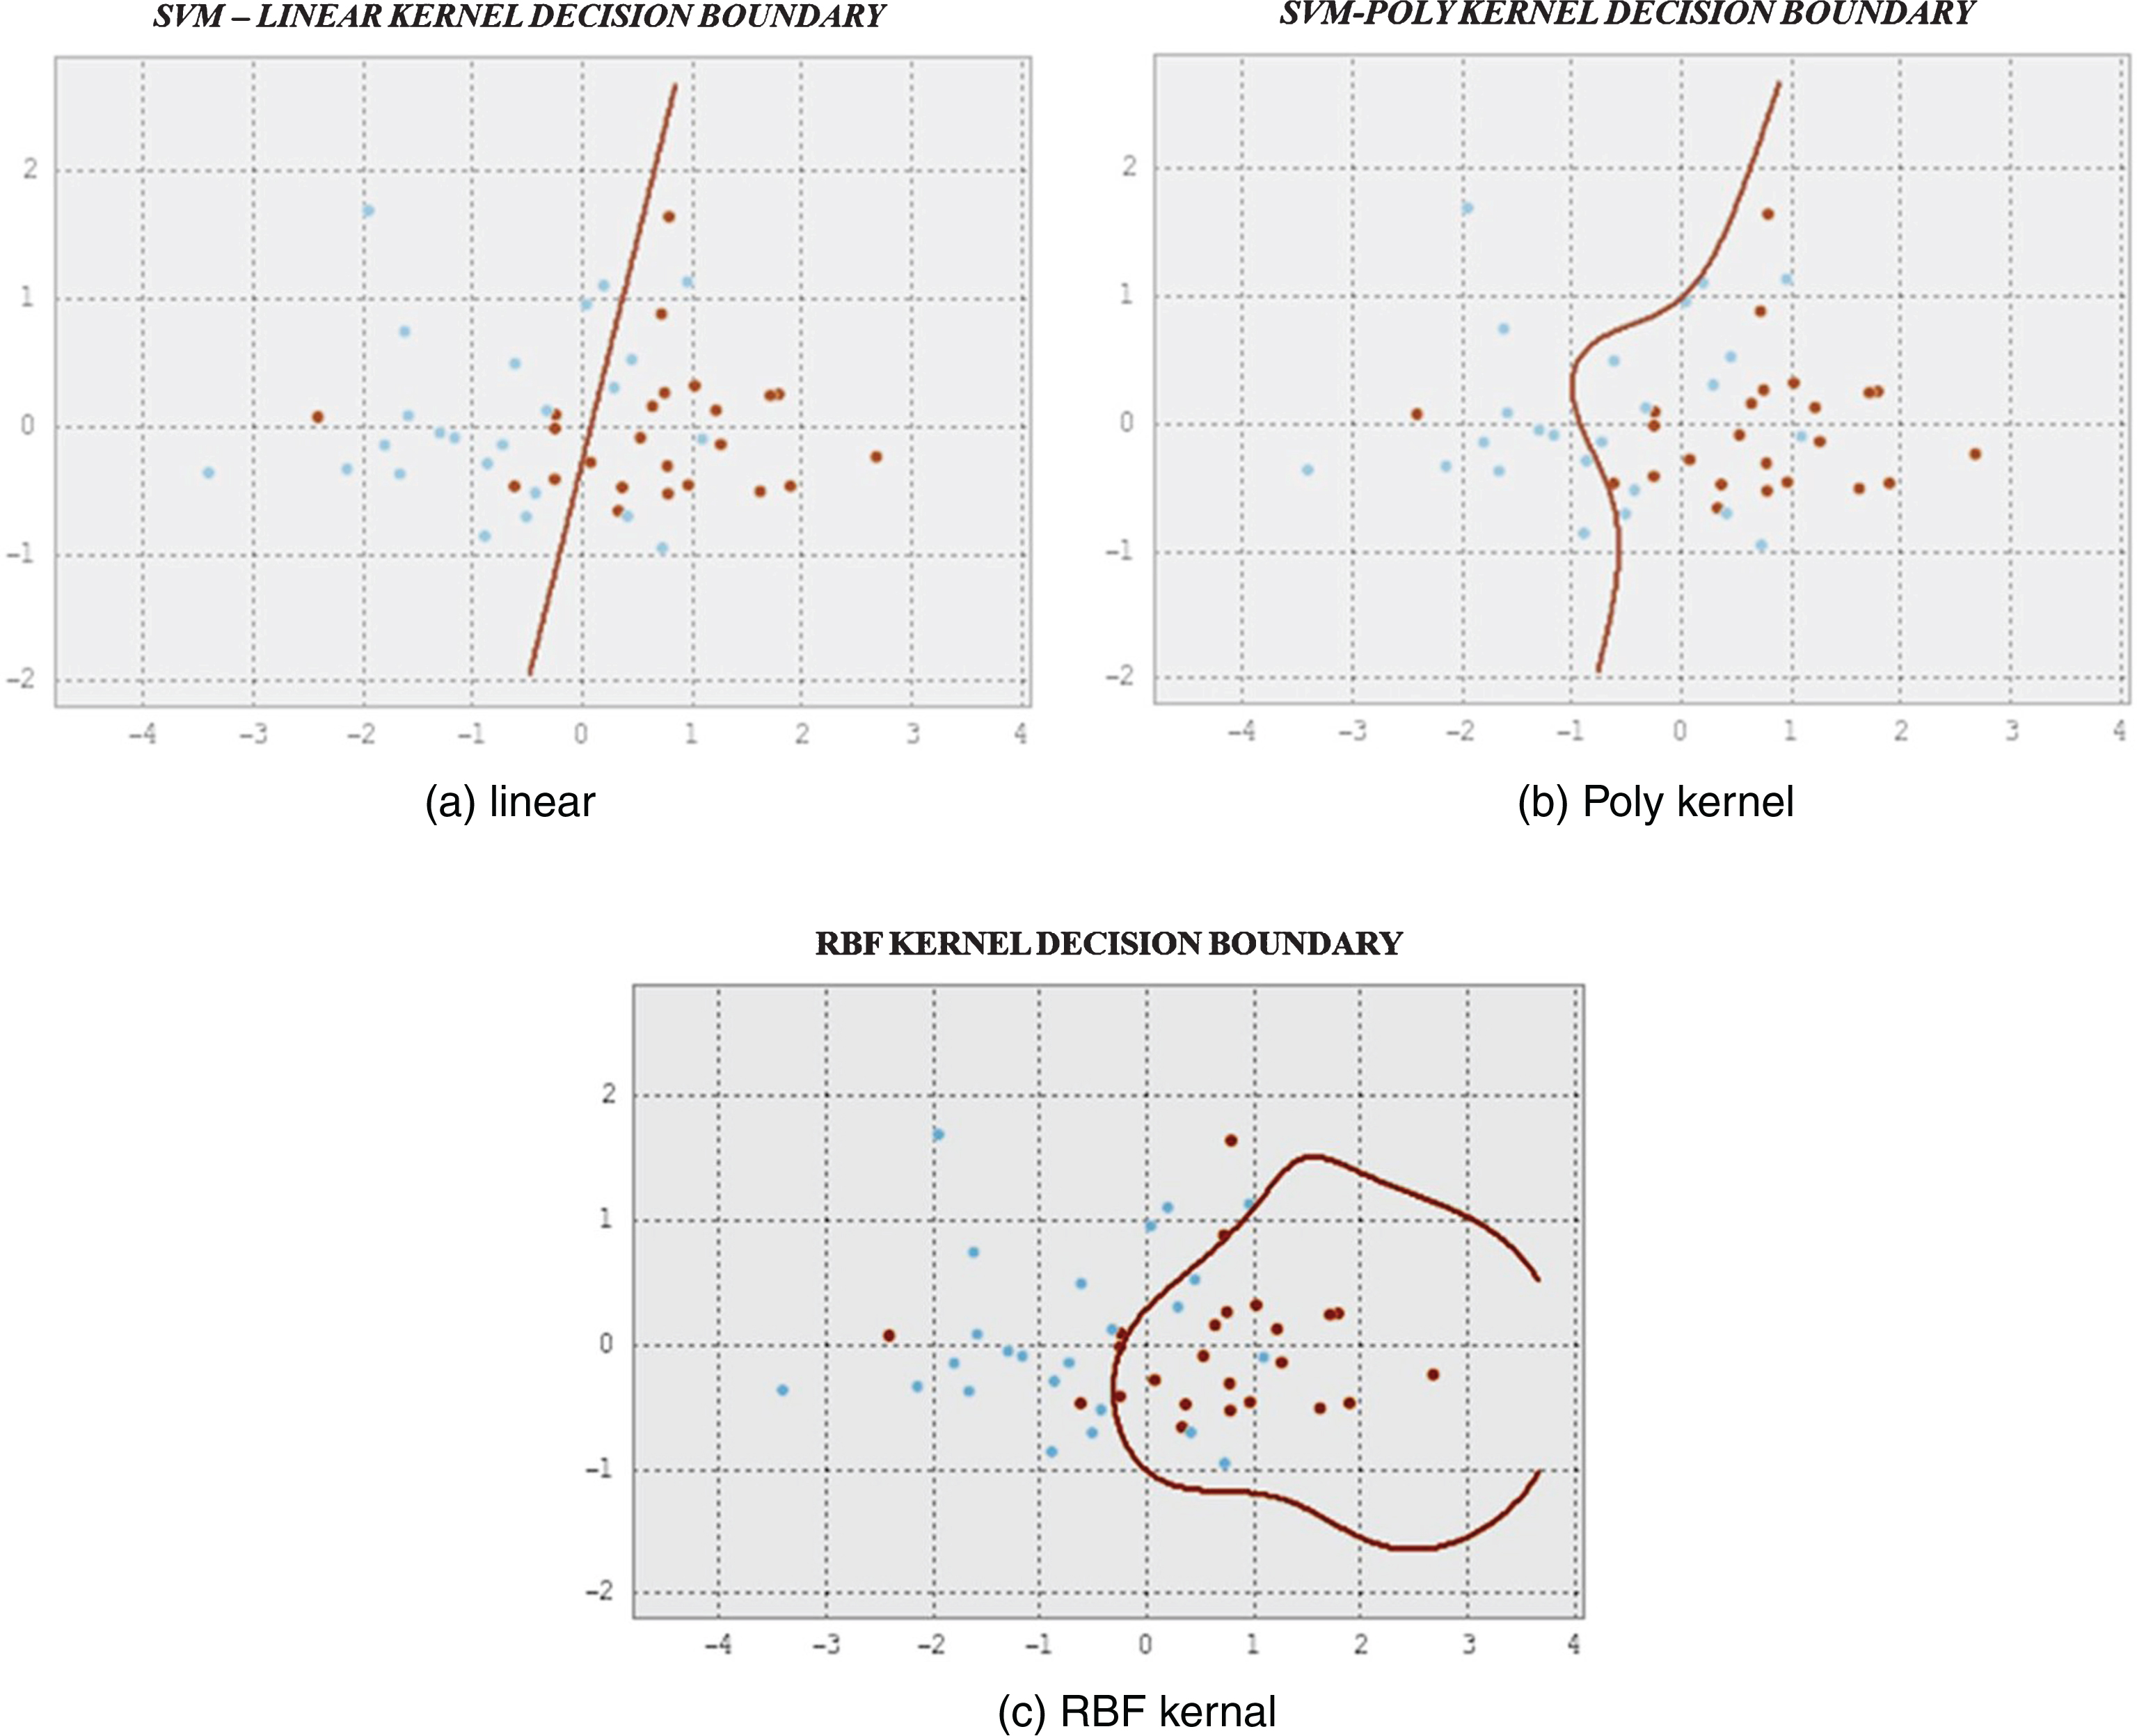
The results in the table show that the RBF kernel outperforms in two measures compared to the linear and poly kernel. This shows that the data points are linearly non-separable. To visualize the n-dimensional data points, the dimensions of the feature vector is reduced by using principal component analysis (PCA) method. PCA transforms the variables in the feature vector to a new set of variables known as principal components. Using these values, two dimensions plot for linear, poly and RBF kernel is plotted and is given in the Figs. 5a, 5b and 5c respectively.
Fig.5
Liner, Poly and RBF SVM plots.
6Conclusions
In this paper, we have proposed a model for cricket match outcome prediction, team structure analysis and player recommendation system using the statistics of the players extracted from a particular tournament. We have devised a method to find the player ranking system using players statistics in terms of tournament statistics. These ranking of players are used to model the SVM for match outcome prediction and team structure analysis. SVM model is trained using linear, poly and RBF and during the testing phase, it was shown that the accuracy, precision and recall rate for SVM with RBF had outperformed from other two methods. The results indicate that our data set is not linearly separable. So we intend to use the SVM with RBF method for match outcome prediction. In our player recommendation system, we have used player performance measures to cluster all the players using k-means clustering and similar players are found using k-nearest neighbor classifier.
Appendices
Appendix-1
We have used a supervised classification model, Support vector machines (SVM), which is capable of classifying both linear and nonlinear data to find the model parameters using the historical data sets. SVM is trained to predict the outcome of a match by finding the hyper plane (decision boundary) separating the tuples of one class (i.e., strengths of one team) from the other, based on the outcomes of past matches for similar (or the same, if possible) lineups of the two teams. This data set of tuples D can be written as (X1, y1), (X2, y2),......, (XD, yD), where Xi is set of training tuples with associated class labels yi. Each yi can take one of two values, either +1 or -1 corresponding to classes, outcome = {win} or outcome = {loss}. The data set X is generated using historic match data with the players ranking index in both the teams as provided in the Section 3 for which the outcome is already known. Our SVM model uses this historical information as a training data to find the parameters of the decision boundary. There are infinite number of separating hyperplanes that could be drawn and we are interested in finding the “best” one, which will have minimum classification errors on previously unseen tuples. The SVM approaches this problem by searching maximal marginal hyperplane (MMH), which gives the largest separation between the two classes. To achieve this our SVM model selects the support vectors from both the classes and tries to maximize the distance between support vector and separating hyperplane. This is required because in case our model selects the hyperplane which is not equidistant from both the classes then the classifier is biased towards one of the class. In case the feature vectors are linearly separable then this hyper plane could be found by SVM using the feature values provided. In case these feature vectors are not linearly separable, Then SVM uses non-linear mapping to transform original training data into higher dimension. With this new dimension, it searches for the linear optimal separating hyperplane. we have used polynomial and RBF kernel tricks to transform the feature sets into higher dimensional space and the separating hyperplane is found using these transformed feature vectors. Once our model finds the separating hyperplane, an unseen data tuple could be taken and assigned the class label using the model parameters found.
Appendix-2
To recommend a particular player who has not played in the tournament, we need to find the players with a precedence (i.e., statistics of matches past) most similar to the player concerned. To achieve this we have used an unsupervised learning method, clustering, to first cluster similar players using k-means clustering. Clustering the most similar players using the dataset helps extract the description of each cluster which helps in deciding the characteristics of the new player. Once these clusters are formed, the statistics of the new player are extracted from the club level matches are used with with the weights α to decide which cluster of players he belongs. To find this, we have used k-nearest neighbour classifier which finds the five nearest players by applying cosine similarity measures. These five nearest neighbours are checked for the cluster they belong and sum of these neighbours are calculated. Using maximum voting procedure, the cluster with maximum number of neighbours is chosen as the nearest cluster. In case there is a tie between the total number of nearest neighbour points from different clusters, the average of the points in each cluster is used in distance measure and one with minimum distance is selected as a cluster. In case there is a further tie between the distances calculated using average of points taken in the cluster, then the cluster of the nearest neighbour point with minimum distance is chosen as a cluster the player belongs. Using the characteristics of the selected cluster the position of the player is recommended.
References
1 | Ahmed F. , Jindal A. and Deb K. , (2011) , Cricket team selection using evolutionary multi-objective optimization, in ‘International Conference on Swarm, Evolutionary, and Memetic Computing’, Springer, pp. 71–78. |
2 | Akhtar S. and Scarf P. , (2012) , Forecasting test cricket match outcomes in play, International Journal of Forecasting 28: (3), 632–643. |
3 | Asif M. and McHale I.G. , (2016) , In-play forecasting of win probability in one-day international cricket: A dynamic logistic regression model, International Journal of Forecasting 32: (1), 34–43. |
4 | Bailey M. and Clarke S.R. , (2006) , Predicting the match outcome in one day international cricket matches, while the game is in progress, Journal of Sports Science & Medicine 5: (4), 480. |
5 | Kaluarachchi A. and Aparna S.V. , (2010) , Cricai: A classification based tool to predict the outcome in odi cricket, in ‘Fifth International Conference on Information and Automation for Sustainability’, IEEE, pp. 250–255. |
6 | Lemmer H.H. , (2004) , A measure for the batting performance of cricket players, South African Journal for Research in Sport, Physical Education and Recreation 26: (1), 55–64. |
7 | Lemmer H.H. , (2005) , A method for the comparison of the bowling performances of bowlers in a match or a series of matches, South African Journal for Research in Sport, Physical Education and Recreation 27: (1), 75–85. |
8 | Lemmer H.H. , (2007) , The allocation of weights in the calculation of batting and bowling performance measures, South African Journal for Research in Sport, Physical Education & Recreation (SAJR SPER) 29: (2), (2007) . |
9 | Lemmer H.H. , (2009) , Batting and bowling performance measures for list-, and first class cricket matches, South African Journal for Research in Sport, Physical Education & Recreation (SAJR SPER) 31: (1), (2009) . |
10 | Lemmer H.H. , (2013) , Team selection after a short cricket series, European Journal of Sport Science 13: (2), 200–206. |
11 | Omkar S. and Verma R. , (2003) , Cricket team selection using genetic algorithm, in ‘International Congress on Sports Dynamics (ICSD)’, Citeseer, pp. 1–3. |
12 | Perera H. , Davis J. and Swartz T.B. , (2016) , Optimal lineups in twenty20 cricket, Journal of Statistical Computation and Simulation 1–13. |
13 | Sankaranarayanan V.V. , Sattar J. and Lakshmanan L.V. , (2014) , Auto-play: A data mining approach to odi cricket simulation and prediction., in ‘SDM’, SIAM, pp. 1064–1072. |
14 | Swartz T.B. , Gill P.S. and Beaudoin D. , et al., (2006) , Optimal batting orders in one-day cricket, Computers & Operations Research 33: (7), 1939–1950. |


