
Factors influencing scoring in the NBA Slam Dunk Contest
Abstract
Scores of 464 dunks (of 682) in the 1984-2016 NBA Slam Dunk Contests (SDCs) were analyzed. Nonparametric regression was used to analyze the elements of dunks themselves (R2 = 0.44). Residuals were the dependent variable in a linear mixed-model with contest formatting and superlative variables as fixed effects; contestant and year were random effects. SDC scores were significantly influenced by the elements of a given dunk such as whether a pass was thrown, if the contestant rotated his body while airborne, or spun his arm while possessing the ball. Dunking later in the scheduled sequence increased scores in the initial round. Higher contestant popularity (measured by proportional newspaper mentions) and competing in home arenas increased scores. Replacing missed dunks reduced scores. Histrionic displays that were exhibited prior to dunking but were uninvolved in the execution of the dunk itself increased scores. Greater dunk novelty and judge experience reduced scores. The results are interpreted to show that athleticism influences scoring, that excitement factors prominently in scoring, and that SDC scoring is subject to similar superlative pressures found in other aesthetic sports. The findings are discussed and related to the NBA, SDC, and dunk contests in general.
1.Introduction
Slam dunking is the most efficient and spectacular maneuver for scoring points in basketball. Observers may cheer or jeer the points scored but the dunk is a crowd favorite. Hence, exhibitory dunk contests are held worldwide at all levels of organized basketball. To date, there has been no systematic examination of the factors that influence the predominate method of scoring in dunk contests: judge’s subjective evaluations. By factors, we refer to elements of a dunk itself, the context in which a dunk occurs, and others, such as the popularity of the contestants. To elucidate the influence of these factors on judge-awarded dunk scores, we analyzed data from the most well-known dunking competition, the NBA Slam Dunk Contest (SDC).
The text is organized as follows: [i] a review of, operationalization of, and hypotheses about the variables; [ii] descriptions of the data set; [iii] explanations of the analytic procedures; [iv] presentation of the results; and [v] discussion of the findings.
1.1.Variables
We focused on three broad factors thought to influence the dependent variable, judge-awarded dunk scores in SDCs. The factors were the [i] elements of a dunk such as the distance leapt from or airborne anatomical maneuverings; [ii] formatting and other contest-contextual pressures such as elimination schedule and replacement dunks; and [iii] superlatives that are exogenous of dunk execution such as contestant popularity and home advantage. First, however, we introduce the judging procedures as we understand them.
1.2.Dunk scores
At the beginning of each SDC telecast, commentators introduced the judges, judging procedures, and contestants. All SDCs utilizing judges featured a panel of five judges consisting predominately of former or current NBA players, though a minority were public figures. Telecast commentators or graphics specified that dunks were judged on “style, athletic ability, and creativity. Judges assigned an integer from 1 to 10, with greater values indicating a more athletic, creative, or stylistic dunk.” For SDCs 1989-96, judges could include tenths of points. The values from the five judges were summed to yield the score for a dunk. The maximum score for a successful dunk (i.e., would garner 2 points in basketball) was 50, across contests; the maximum for a missed dunk (i.e., missed field goal in basketball) was 25 until 2000, thereafter it was 30. Scores for all dunks in a round or the highest scoring dunks in a round were summed to determine which contestants progressed to the next round. In SDCs in which replacements for missed dunks were permitted, judges were asked to excuse the attempts that were replaced when evaluating the ultimate dunk.
With the exceptions described below, a contestant performed his dunk and then judges scored the dunk. Scores were always awarded after one dunk and before the next dunk was performed. It appears judges were unaware of what dunks would be performed. Although maneuvers have been disclosed to the press and in other media (Denberg, 1986, Aschburner, 1995, Tillery, 2008), it appears many contestants prefer to keep their strategies guarded (Denberg, 1986, Farrey, 1990, Aschburner, 1995, Schmitz, 2008) whereas others opt for an improvisational approach (Krieger, 2000, Dougherty, 2001, Rudman, 1987, Times, 2006).
There were several exceptions to the dunk-then-judge procedure. In the 1994-97 initial rounds and in the 1995 final round, each contestant received a single score for several dunks he performed consecutively, prior to judging (on the same 0–10, max of 50 scale). From 2009-13 dunks in the final rounds were not judged, rather, viewer submitted votes for a contestant were summed to determine the winner. No dunks were scored in the 2012 and 2014 SDCs when the winners were determined using the viewer voting method.
1.3.Dunk elements
Intuitively, dunk elements should correspond to variability in scores because the elements distinguish one dunk from others. Some elements require greater athleticism and thus are more difficult to execute successfully than others. Likewise, creativity and style are restricted by athleticism. Judging dunks on athletic ability ostensibly corresponds to difficulty as in figure skating (Union, 2016) or gymnastics (Butcher, 2017). This seems to be a reasonable interpretation of athletic ability absent a more precise definition. Insight into which elements might be most influential is inferable from the comments of past contestants.
Dominique Wilkins implied the importance of achieving maximal verticality (Bee, 1988). Clyde Drexler endorsed airborne movements of the legs (Wendy, 1989). Kenny Walker seconded the notion of leg movements and stressed the importance of hangtime and full extension of the arms (Wendy, 1989, Powell, 1990). Comments by Isaiah Ryder suggest leaping over obstructions such as players or motor vehicles (Aschburner, 1995). Julius Erving implied jumping farther away from the goal and approaching it from different angles (Spencer, 2000). Baron Davis indicated exerting maximal force on the basket while finishing (Dougherty, 2001).
These and other elements will be analyzed; the exceptions to the above being, duration of hangtime and the exertion of power at the finish because each is too specific for this seminal analysis. We anticipate that elements will influence judge-awarded dunk scores, with dexterously more demanding kinematics such as the between-the-legs and behind-the-back garnering greater scores. We expect that airborne rotations and leaping farther from the basket, particularly from the free throw line, will also increase scores.
1.4.Contest formatting
Except for 2012 and 2014, SDCs progressed in single-elimination format, with contestants generally performing at least two dunks in each round. Successive rounds culminated in a final round in which the winner was determined. Lower scoring competitors in a round were eliminated whereas higher scoring competitors survived to compete in the next round. Ties were decided with the tied-contestants performing additional dunks and eliminating the lower scoring contestant.
The number of contestants has varied over the years (see Table 1). In 1985, the top-two 1984 contestants and in 1986, the 1985 winner were each granted a first round by. Half or more contestants were generally eliminated in each round. Two contestants survived to the final rounds of all SDCs except 1993-97 and 2000-01, when three survived.
Table 1
Pertinent Variables by SDC Year
| Year | Cont. | Rnd. | Total | Eligible | Ineligible Counts | Att | Rep. | His. | Means | Dunk Scores | ||||
| No Foot. | No Score | Miss | DN | JE | Mean | SD | ||||||||
| 1984 | 9 | 3 | 45 | 36 | 2 | 0 | 7 | 1 | 0 | 0 | 0.6 | 0 | 43.9 | 4.18 |
| 1985 | 8 | 3 | 41 | 30 | 11 | 0 | 0 | 0 | 3 | 0 | 2.0 | 2 | 45.2 | 3.49 |
| 1986 | 8 | 3 | 39 | 25 | 13 | 0 | 1 | 1 | 9 | 0 | 1.8 | 0 | 45.5 | 4.51 |
| 1987 | 8 | 3 | 34 | 32 | 0 | 0 | 2 | 3 | 6 | 0 | 3.2 | 0 | 46.2 | 3.52 |
| 1988 | 7 | 3 | 32 | 30 | 0 | 0 | 2 | 1 | 6 | 0 | 5.0 | 3 | 45.1 | 4.39 |
| 1989 | 8 | 3 | 30 | 27 | 1 | 0 | 2 | 0 | 7 | 0 | 5.2 | 0 | 46.0 | 2.46 |
| 1990 | 8 | 3 | 30 | 30 | 0 | 0 | 0 | 6 | 8 | 0 | 5.1 | 1 | 47.5 | 2.12 |
| 1991 | 8 | 3 | 30 | 30 | 0 | 0 | 0 | 4 | 5 | 1 | 4.8 | 3 | 45.6 | 3.08 |
| 1992 | 7 | 3 | 28 | 22 | 2 | 0 | 4 | 1 | 3 | 1 | 6.4 | 8 | 45.1 | 2.60 |
| 1993 | 7 | 2 | 30 | 23 | 0 | 0 | 7 | 4 | 0 | 0 | 7.9 | 8 | 43.1 | 4.41 |
| 1994 | 6 | 2 | 34 | 3 | 1 | 27 | 3 | 0 | 0 | 0 | 1.4 | 9 | 46.6 | 2.62 |
| 1995 | 6 | 2 | 26 | 0 | 5 | 21 | 0 | 16.1 | ||||||
| 1996 | 6 | 2 | 26 | 3 | 1 | 19 | 3 | 0 | 0 | 0 | 19.6 | 11 | 45.3 | 4.17 |
| 1997 | 6 | 2 | 21 | 3 | 0 | 15 | 3 | 0 | 0 | 0 | 17.4 | 10 | 45.3 | 3.51 |
| 2000 | 6 | 2 | 24 | 17 | 1 | 0 | 6 | 7 | 1 | 0 | 6.7 | 5 | 46.4 | 3.46 |
| 2001 | 6 | 2 | 24 | 18 | 0 | 0 | 6 | 6 | 1 | 0 | 21.6 | 9 | 44.8 | 2.96 |
| 2002 | 4 | 2 | 16 | 13 | 0 | 0 | 3 | 5 | 1 | 0 | 17.4 | 16 | 42.3 | 4.89 |
| 2003 | 4 | 2 | 12 | 11 | 0 | 0 | 1 | 2 | 3 | 0 | 5.6 | 9 | 46.5 | 4.28 |
| 2004 | 4 | 2 | 12 | 9 | 0 | 0 | 3 | 7 | 2 | 0 | 10.2 | 1 | 46.1 | 3.22 |
| 2005 | 4 | 2 | 12 | 12 | 0 | 0 | 0 | 22 | 6 | 2 | 7.8 | 19 | 45.3 | 4.31 |
| 2006 | 4 | 2 | 14 | 14 | 0 | 0 | 0 | 17 | 17 | 1 | 6.4 | 3 | 45.7 | 3.10 |
| 2007 | 4 | 2 | 12 | 12 | 0 | 0 | 0 | 11 | 5 | 2 | 18.5 | 13 | 43.4 | 3.78 |
| 2008 | 4 | 2 | 12 | 8 | 0 | 4 | 0 | 2 | 1 | 2 | 14.8 | 16 | 45.8 | 4.17 |
| 2009 | 4 | 2 | 12 | 8 | 0 | 4 | 0 | 14 | 4 | 2 | 25.5 | 0 | 44.5 | 3.70 |
| 2010 | 4 | 2 | 12 | 8 | 0 | 4 | 0 | 4 | 4 | 0 | 9.2 | 4 | 42.1 | 4.19 |
| 2011 | 4 | 2 | 12 | 8 | 0 | 4 | 0 | 10 | 13 | 2 | 7.5 | 19 | 47.3 | 2.49 |
| 2012 | 4 | 1 | 12 | 0 | 0 | 12 | 0 | 3.1 | ||||||
| 2013 | 6 | 2 | 16 | 10 | 0 | 4 | 2 | 5 | 13 | 2 | 1.8 | 3 | 46.2 | 4.49 |
| 2014 | 6 | 1 | 6 | 0 | 0 | 6 | 0 | 2.0 | ||||||
| 2015 | 4 | 2 | 12 | 10 | 0 | 0 | 2 | 7 | 6 | 1 | 2.0 | 17 | 43.5 | 6.03 |
| 2016 | 4 | 2 | 16 | 15 | 0 | 0 | 1 | 8 | 3 | 0 | 3.6 | 11 | 47.3 | 4.45 |
| 178 | 682 | 467 | 37 | 120 | 58 | 148 | 127 | 16 | 8.1 | 7 | 45.3 | 3.83 | ||
Note: For columns with counts, bottom round indicates sum total from all SDCs. For columns with means, bottom row indicates mean across all SDCs. Att.=Attempts; Cont. = Contestants; Rnd. = Rounds; Rep. = Replacement Dunks; His. = Histrionics; No Foot. = No footage; DN = Dunk Novelty; JE = Judge Experience.
In the words of one Association executive in 1988: judging is “totally subjective” (Denberg, 1988). Another matter to consider then, is how individual judges interpret and apply the scoring criteria when evaluating a dunk. An inter-judge analysis of deviance would provide insight in this regard, but individual judge-scores were rarely displayed on the SDC broadcasts prior to 2000. Even then, of 170 judged dunks from 2000 and after (or 850 possible judge scores), 18.4% of judge-scores were not displayed on the broadcast (or 156 judge scores). To account for potential differences in how judges interpret and apply the scoring criteria, we include year as a random effect in the analysis and include a variable indicating prior judging experience of the judging panel in each SDC.
1.4.1Rounds
From 1984-92, the SDC consisted of three rounds and thereafter, two. Because dunks are scored on “athletic ability, creativity, and style”, less impressive competition should be awarded lower scores and eliminated from one round to the next. Thus, a reasonable expectation is that athletic and creative dunking increases in each round. However, judges might anticipate superior dunks in later rounds and be reluctant to award higher scores in initial rounds. Qualifying rounds in elite figure skating tend to yield lower scores and have greater variance compared to later rounds (Lee, 2004). Similar patterns have been documented in men’s elite gymnastics (Leskošek et al., 2010) and culinary competitions (Haigner et al., 2010). Our hypothesis is mean increases and variance decreases in scores will be observed as rounds progress.
1.4.2Sequence
Sequence effects, whereby performing later in sequence yields more favorable scores, have been demonstrated in figure skating (de Bruin, 2006), gymnastics (Morgan and Rotthoff, 2014), and synchronized swimming (Wilson, 1977). In SDCs, contestants completed several dunks in each round such that all completed their first dunk in order, then all completed their second in the same order, and so on. We refer to sequence, however, as the chronological completion of dunks within a round, from the first to the last. For example, in a round with four contestants who each dunked twice, dunk 4 is the first dunk of the last contestant and dunk 5 is the second dunk of the first contestant. We refer to this as positions in sequence.
Inasmuch as can be gleaned from telecasts and associated media, the initial round positioning of contestants in sequence was determined following “random draw” or “by draw”. Likewise, within each SDC, the contestant with the highest score in a round was often the last dunker in the following round, but sequences of some were determined randomly or by coin toss. Telecast commentators exhibited a change in verbiage in 1991, changing the description of initial round sequence from “by random draw” to “by draw”. Although subtle, and that ‘draw’ still implies some measure of randomness, the change in verbiage suggests that sequence may have no longer warranted the qualifier of ‘random’. That is, positions in sequence could have been coordinated, in lieu of randomization, to serve some extracurricular purpose such as positioning more popular contestants earlier or later in the sequence to appeal to viewers. To account for this possibility, a precursory examination of popularity, home-advantage, sequencing, and progressing beyond the initial round was conducted such that a trend was expected to emerge if sequence changed as a function of contestant popularity or home advantage and the extent to which those three variables influenced surviving the initial round.
Additionally, there was one exception to the randomness of sequence in the initial round. The winner of the previous SDC dunked last, if he was a contestant. Conceivably, the previous SDC winner has demonstrated an ability to successfully execute dunks that yield high scores and by being positioned later in the sequence, could moderate a sequence effect. To our knowledge, SDC judging protocols are less refined than that of the subjectively-judged Olympic sports. Because of this, we suspect there will be a sequence effect but are uncertain of the magnitude.
1.4.3Errors in execution
Unique to the SDC are replacement dunks, granted when a contestant misses a dunk (i.e., a missed field-goal in basketball). We also included in the analysis, attempts, or dunks aborted before attempting a dunk (i.e., not an attempted field goal). To our knowledge, no other aesthetic sports grant replacements of errancy. In 1984 replacements were prohibited but attempts were permissible. In the remainder of the 1980s and in the 1990s, contestants were generally afforded 1 or 2 replacements per round and attempts were permitted. In recent years, unlimited replacements per dunk have been allowed within a 90-or 120-second time limit.
Replacements and attempts might place additional pressure on the contestant to execute successfully, perhaps affecting performance (Dohmen, 2008, Kent and Ewell, 2001). Notably, retired NBA player and judge in recent years, Shaquille O’Neal, has contended that a maximum score (50) should not be awarded following a replacement dunk, indicating that contestants should be sufficiently practiced executing their dunks. For these reasons, we hypothesize that scores will decrease as replacements and attempts increase.
1.5.Superlatives
In competitive sanctioned sports, judges and referees are asked to maintain impartiality when evaluating performances and enforcing regulatory statutes. This is tenuous in application because myriad variables influence human cognition and behavior, often imperceptibly. Thus, it may be that factors exogenous of the actual dunk execution influence scoring.
1.5.1Contestant popularity
NBA basketball is a commodity, as are activities adjunct to it, such as the SDC. In addition to team performance, the most popular NBA players increase attendance at road games (Hausman and Leonard, 1997). They bolster gate revenues when visiting arenas (Berri and Schmidt, 2006), increase television ratings, and were the impetus for sustained growth in television contract revenues (Sarmento, 1998). Separately, heightened player status has been found to engender favoritism in professional baseball umpires (Mills, 2014) and accredited judges are prone to award higher marks to figure skaters carrying a positive reputation (Findlay and Ste-Marie, 2004). We suspect that popularity will influence judging in the SDC, resulting in higher scores for greater popularity.
1.5.2Home-status advantage
An advantage for competing at home has been found in US women’s collegiate gymnastics scores (Baghurst and Fort, 2008) and higher Olympic medal counts have been observed for host-countries, particularly, in subjectively judged events (Balmer et al., 2001). Reasonably, a SDC contestant performing before his hometown fans may be emphatically heralded. In association football, heightened crowd noise has been shown to influence officiating in favor of the home team (Pope and Pope, 2015). SDC judges generally observe from the court proximal to the crowd and as one 1987 judge remarked, “we have to, as judges, desensitize ourselves from the crowd and not let them affect us,” (Zeigler, 1988). Given this, we suspect that dunk scores will be inflated for contestants competing in their home city.
1.5.3Histrionics
Three-time contestant Shawn Kemp noted in 1994, “guys are starting to create a little more before the dunk,” (Richardson, 1994; italics added). Perhaps Kemp was referring to Dee Brown, whom he lost to in the 1991 SDC final. Brown became inextricably associated with the Reebok Pump sneaker by inflating the sneakers before many dunks and later stated his intention “to get the crowd into it.” (Moore, 1991) This sort of premeditated extradunking activity, which we term histrionics, typically exerts no direct influence on the execution of a dunk. Unnecessarily ornate passes performed by individuals other than the contestant were identified as histrionic.
Indeed, there is much subjectivity in identifying histrionics. 1986 SDC winner Spud Webb stood 170.18cm. Historically, basketball, and dunking especially, were reserved for taller people. Webb’s stature may have garnered a histrionic, underdog effect albeit inadvertently. Consider also Gerald Green in the 2007 SDC. Green’s teammate climbed a ladder, placed a cupcake on the back of the rim, and lit a candle anchored in the cupcake icing. At the peak of his vertical jump, Green exhaled and extinguished the candle flame before dunking. Despite the histrionics of a cupcake and lit candle, the procedure was ultimately functional as it demonstrated Green’s athleticism and enhanced the difficulty of his airborne activities. Contrast the cases of Webb and Green with the singing choir Blake Griffin staged in 2011 SDC. To account for this, we included contestant height and specified if histrionics was functional in the analysis.
In our observations, SDC commentators and judges appear to respond positively to and encourage histrionics. Some instances of functional histrionics, however, seem to be less obvious (e.g., Dwight Howard adhering a sticker high on the backboard was awarded a 42) and other instances, blatant (e.g., Dwight Howard dunking on an elevated basket after it was delivered to the court was awarded a 50). Overall, casual observation suggests judges may fail to register less obvious functional histrionics. We hypothesize that the presence of histrionics will increase dunk scores but functional histrionics will have a negligible influence.
1.5.4Dunk novelty
Numerous former winners have indicated there is pressure to execute novel dunks. “How many different dunks can you do?” pondered Dominique Wilkins after winning the 1990 SDC (David, 1990). 2008 victor Dwight Howard contended in 2014 that “I think people forget that every dunk has been done basically, it’s not a lot of stuff you can really do,” but noted in the same interview that, “there is some stuff I haven’t shown,” (Harris, 2014). Inaugural SDC winner Larry Nance speculated in 1998 that observers had become inured “getting to see the same [dunks] over and over,” (Jones, 1998). If the suspicions of contestants are accurate, it may be that judges score novel dunks more favorably. For example, sometime judge and commentator Kenny Smith can be heard on numerous broadcasts exclaiming, to the effect of, “show me something I haven’t seen before!” Therefore, the reuse of dunk elements could also result in reduced scores. To test this hypothesis, a variable indicating the number of prior instances of the elements in a dunk was included.
2.Data
All NBA SDC 1984-2016 were reviewed using unofficial but authentic footage primarily sourced from YouTube. Because the intent was to record the scores judged for each dunk, assign the elements of each dunk to one or more categorical variables, and evaluate how dunk elements influence scoring, securing footage of dunks and their scores was imperative. When possible multiple videos posted by different users were viewed for each dunk or cross-referenced from NBA TV broadcasts and other licensed NBA materials. In total, 682 dunks were identified. Dunks without scores or footage were inherently ineligible. Table 1 provides distributions of dunks by SDC year as well as other pertinent information we refer to throughout the text.
Footage of 36 dunks and the score of 1 dunk in the 1992 final could not be secured leaving 645. From 2009-13 dunks in the final rounds were not judged and no dunks in 2012 and 2014 were judged. Absent judged-scores, 38 dunks from these SDCs were ineligible for analysis, leaving 607. In the 1994-97 initial and in the 1995 final rounds, contestants received a single score for several completed dunks. The score for each completed dunk in these rounds is unknowable, rendering 82 dunks ineligible for analysis, leaving 525.
In our observations, judges appeared to discriminate little between the potential quality of scored missed dunks (i.e., the dunk that judges scored was a miss). Because of this, 58 missed dunks were also excluded, leaving 467 eligible for analysis. Additionally, three dunks were excluded because there was only a single legitimate instance of the principal element, Vince Carter hanging on the rim by his elbow-pit in the 2000 final. The other two were failed replications of Carter’s elbow-hang maneuver (Gerald Wallace, 2002; Richard Jefferson, 2003). Although the latter two dunks were not missed, that is, they would have counted as field goals in basketball, the judges scored as though the dunks were missed, in our estimation. This left a total of 464. Secondarily, sequence was indiscernible for 32 dunks from SDCs held in 1986, -88, and -92 because footage could not be secured. These 32 dunks were ineligible, leaving a total of 432 for the analysis of contest factors.
2.1.Interrater reliability
To ensure accuracy, dunk elements were identified and recorded by two raters. The first author identified all elements in all dunks eligible for analysis, twice. The second author was enlisted as a rater, pro bono. At the time, naïve to the study, but thereafter contributed significantly to the project. The first author provided the blinded rater an instructional text describing the methods used to identify dunk elements which is available on the ResearchGate page of the first author. The blind rater was supplied 108 dunks selected at random, with≥2 per SDC. This many dunks were needed to conclude that a Fleiss’ Kappa of 0.70 was greater than 0.50 at the 0.05 alpha level, with 0.80 power.
3.Method
3.1.Dunk elements
To quantitate dunk elements for analysis, we partitioned the dunk into four manageable components. First, there is a stage of pre-launch activity which is described below and is followed by the launch, which entails how a contestant becomes airborne (exclusively by jumping in the SDC). Third, once airborne, a variety of movements, or airborne activity, can be performed with or without possession of the ball. Fourth, during even the most rudimentary dunk, a controlled and possessed ball is manually guided from above the horizontal plane of the basket rim, into the basket. As the ball is guided downward through the basket, the non-dorsal side of the hand(s) (but potentially the arm(s), also) will contact the rim, known hereafter as the finish.
Pre-launch activity, launching, airborne activity, and finishing will always occur in sequence except for additional dunking executed after the finish, without returning to the substrate or hanging on the rim. Supplementary Table 1 contains additional commentary on the elements described below, including kinesthetic descriptions of airborne activity. This content is excluded for brevity but esoteric constructs vital to the analysis are defined below. Table 2 names and provides distributions and levels of each dunk element in the analysis.
Table 2
Levels and distributions of Dunk Element Variables
| Class | Element Variable | Levels | Level ns |
| KM | Arm Extension | not applicable, full, less than full | 191, 249, 24 |
| PLA | Baseline Approach | no, yes | 359, 105 |
| KM | Covered-Eyes | no, yes | 460, 4 |
| PLA | Distancea | none < key circle < lane line < free throw | 373, 55, 21, 15 |
| KM | Horizontal Rotationa | none <180°< 360° | 355, 44, 65 |
| KM | Leg-Kicking | no, yes | 453, 11 |
| KM | Limited Trajectory | no, yes | 397, 67 |
| KM | Maximum Vertical | no, yes | 455, 9 |
| PLA | Multiple Balls Dunkeda | no < yes | 452, 9 |
| KM | Obstruction | no, yes | 447, 17 |
| PLA | Pass | no, yes | 284, 180 |
| Fin. | Reverse Finish | no, yes | 355, 109 |
| KM | Touch Goal with Hand | no, yes | 452, 12 |
| KM | Swinging | no, yes | 401, 63 |
| Basic, Behind the Back, Between the Legs | 143, 5, 25 | ||
| Primary Kinematic | Cradle, Double-Pump, Reach, Tap Goal w/ Ball | 31, 92, 12, 2 | |
| Tomahawk, Windmill, Multiple Primaries | 27, 123, 4 |
Note. All variables are categorical unless noted. Bolded words are the level at which each variable is held constant in various models and figures. Fin. = Finishing; KM = Kinematic Modifier; PLA = Pre-Launch Activity. aOrdinal variable.
3.1.1Pre-launch activity
Pre-launch activity occurs prior to initiating a dunk when various predetermined modifiers of airborne activity are implemented, such as the coordination of a pass. Passing was recorded if the contestant assumed control of the ball while airborne (or after finishing one dunk and before returning to the substrate). Four launch-distances were specified including (distance from center of basket): none, key circle (2.36m), lane line (2.44m), and free throw line (4.19m). Distance was recorded if, for a one-footed launch, the launch-foot was on or behind the line or, for a two-footed launch, if the planted (back) foot was entirely behind the line or less than half of it was on and beyond the line.
3.1.2Airborne activity
Airborne activity was delineated into primary kinematics and kinematic modifiers, or primary and modifier for brevity. Although primaries and modifiers have each spawned colloquial appellations of dunks, we distinguished the two by a primary involving the maneuvering of a possessed ball (or the intent to assume possession, as described below) whereas modifiers can be performed with or without possession of the ball. By this system, two primaries cannot be performed simultaneously with a single ball but two primaries could be performed simultaneously with one arm each controlling a ball— a multiple-ball modifier.
However, a primary and a modifier can be executed simultaneously. Likewise, multiple modifiers could be executed simultaneously absent a primary (e.g., a 360° rotation while covering the eyes). The absence of both a primary and a modifier can be thought of as the most inanimate launch-then-finish dunk. Thus, although one might refer to a 360° dunk colloquially (i.e., with no primary), for empirical purposes, this system would refer to it as a dunk with no primary modified by a 360° rotation of gross anatomy.
3.1.2.1Primary kinematics
Ten primary kinematics were identified for the analysis. The majority were ascribed common, colloquial appellations and descriptions of others follow. Because there are 16 possible combinations of two primaries but only four instances of multiple primaries in the data set, we collapsed these into a single category. Tapping the goal with the ball was defined as volitionally touching a possessed-ball to any component of the goal while airborne, other than for the purposes of finishing. Reaching entails an exaggerated reaching of the arm(s) to obtain possession of a ball (e.g., for a pass) or when possessing the ball. The latter definition was applied parsimoniously, only to palpable exaggeration of flexion or abduction of the arm(s). Although the reach could justifiably be classified as a modifier in this system, we classified it as a primary because other primaries should not be simultaneously executable if the reach is palpable.
3.1.2.2Kinematic modifiers
Nine modifiers were identified. Because contestants’ intentions are largely unknowable, leg-kicking was ascribed parsimoniously and only when it appeared intentional. Limiter of trajectory refers to a contestant being beneath some component of the goal while airborne. For horizontal rotations of gross anatomy, if a contestant’s back was toward the goal as he launched, and no additional discernible rotation occurred while airborne, rotation was recorded as ‘none’.
Contestants vary in their arm extension, or angle of extension of the elbow joint (toward a straightened arm) on the double-pump, cradle, tomahawk, and windmill primaries, which is representative of athletic ability. We recorded if arm extension was notably less than maximal. Although our method is crudely subjective, the distinction is readily apparent to a reasonable observer.
Swings were defined as premeditated or improvisational appreciable maneuverings of the possessed ball prior to initiating a primary (i.e., swinging occurs first). Swings predominantly precede the cradle primary but our definition also accounts for appreciable maneuverings of the ball prior to other primaries. These instances are distinct of those same primaries absent the maneuvering. For example, swings included outstretching— but not reaching— to corral an awry pass or a slight circumduction of the arm prior to initiating a primary. Swings were distinguished from reaches because the swinging motion is less palpable, thus a primary may be initiated immediately without impediment.
Touching goal with the hand entails touching any component of the goal apparatus with the hand(s) while airborne, other than for the purposes of finishing, including slapping the backboard and grabbing the rim. Grabbing the rim could interrupt the natural airborne trajectory and, potentially, provide some advantage by delaying the descent, whereas slapping the backboard would not. We believed this was too granular for the analysis and settled on a combined variable.
3.1.2.3Finishing (& launching)
We recorded if dunks were finished with the back to the goal or if his side was to the goal but he was facing away from the goal (reverse finish). Launching was excluded from this analysis to avoid granularity. However, its core element is the launch employed, either one-or two-footed.
3.1.3Interrater reliability
Identifying and discretely classifying dunk elements is subjective. This is evident in Table 3 which contains the Cohen’s κ-coefficients and percent agreement between the combinations of two sets of dunks identified by the first author and the subset identified by the second author. A preponderance of weak κs bespeaks the subjectivity of classifying dunk elements (McHugh, 2012). Our agreements on the absence of a modifier produced inflated agreement values. For instance, in the second and third supracolumns of Table 3, 32 reverse finishes were identified but we agreed on only 10 (32.3%) whereas we agreed on 76 non-reverse finishes (77.6%).
Table 3
Inter-Rater Reliability of Initial Dunk Element Classifications
| Airborne Activity | FA 1 &FA 2a | FA 1 &SAb | FA 2 &SAb | |||||||||
| κ | z | p | % A | κ | z | p | % A | κ | z | p | % A | |
| Primary Kinematic | 0.76 | 35.03 | 0.00 | 0.752 | 0.61 | 14.56 | 0.00 | 0.679 | 0.55 | 12.69 | 0.00 | 0.633 |
| Reverse Finish | 0.90 | 19.51 | 0.00 | 0.936 | 0.37 | 4.16 | 0.00 | 0.789 | 0.30 | 3.39 | 0.00 | 0.761 |
| Rotation | 0.85 | 24.19 | 0.00 | 0.917 | 0.59 | 7.93 | 0.00 | 0.844 | 0.71 | 9.59 | 0.00 | 0.890 |
| Maximum Vertical | 0.55 | 12.40 | 0.00 | 0.991 | 0.50 | 5.59 | 0.00 | 0.927 | 0.33 | 3.54 | 0.00 | 0.899 |
| Leg-Kicking | 0.47 | 10.84 | 0.00 | 0.954 | –0.04 | –0.39 | 0.70 | 0.917 | –0.02 | –0.22 | 0.83 | 0.936 |
| Swinging | 0.84 | 18.31 | 0.00 | 0.936 | 0.11 | 1.27 | 0.20 | 0.835 | 0.08 | 0.96 | 0.34 | 0.807 |
| Arm Extension | 0.82 | 20.98 | 0.00 | 0.872 | 0.67 | 7.83 | 0.00 | 0.817 | 0.64 | 7.09 | 0.00 | 0.807 |
Note: FA = first author; SA = second author; an = 467, bn = 108. % A = percent aggreement.
These preliminary IRR fostered consensus classifications for the many dunks that we had initially classified incongruently. The opportunity also arose to more thoroughly define and delineate the elements. For example, the 32.3% agreement on reverse finishes was due to an imprecise definition. JMB was ascribing reverse finish using the definition provided above. However, in the instructions supplied to ESR, the latter scenario was only implied; back to the basket was emphasized, qualified by a gaze away from the basket. Although the classification of elements remained subjective, ultimately, the classification of dunk elements included in the analysis were decided upon conjointly.
3.2.Contest formatting
Year was included as a random effect to account for random year to year variance in scores not explained by other variables. To account for potential differences in how judges interpret scores, we examined several possible variables including, for each dunk, a sum of each judge’s prior exposure to all elements found in that dunk; and for each SDC, counts of judges who were current or former NBA players and the counts of judges who were former SDC contestants. However, the sole variable that influenced scores in the model was the sum of prior SDCs judged by members of judging panel. That is, if, in a given SDC, five judges had respectively judged 0, 0, 2, 4, and 0 previous SDCs, then the judge experience value for all dunks in that SDC would have been 6.
3.2.1Rounds
Because some SDCs had three rounds and others two, for SDCs with three rounds, we refer to the second round as the middle round and the third as the final. For SDCs with two rounds, we refer to the second round as the final round in respect of the greater stakes of the finale. The first round is always the initial. Round entered the analysis as a categorical variable with three levels: initial, middle, final.
3.2.2Sequence
Given the differences of total contestants over the years, we normalized contestant sequence-position in each round of each SDC and computed it separately for each set of overtime dunks within a round, (position in sequence – 1) /(total dunks in round – 1). The first position in sequence always equaled 0 and the last position always equaled 1. A dummy variable indicating if an initial round contestant won the previous SDC was also included.
3.3.Superlatives
3.3.1Home Status
Home-status was ascribed to dunks by contestants who were a member of the team hosting the SDC (e.g., Blake Griffin in 2011), played collegiately in the hosting city or surrounding area (e.g., Blue Edwards in 1992), or known to be a native of the hosting city or surrounding area (e.g., Spud Webb in 1986). The home-status variable was dummy coded.
3.3.2Contestant popularity
Myriad operationalizations of NBA player popularity exist in the literature (Berri and Schmidt, 2006, Brown et al., 1991, Burdekin and Idson, 1991, Kian, 2009, Scott et al., 1985) but a continuous variable was preferred as to capture year to year variation for repeat contestants. We elected to use newspaper article mentions because it satisfied the need for consistent coverage from 1983 through present (i.e., all SDCs).
For the 1988 through 2016 SDCs, NewsBank Access World News database searches were performed within the publication USA Today. Because UST is unavailable digitally prior to 1 JAN 1987, ProQuest searches of the New York Times and LexusNexus searches of the Washington Post were used for 1984 through 1987 SDCs. The NBA mentions string was: ‘NBA OR “national basketball association” OR “N.B.A.”’. We searched for all mentions within a date range from the day after the previous SDC through the day of a given SDC. For the first SDC, that range included the 365 days prior. Returned was the quantity of articles containing text that matched the criteria. This value was considered the total NBA mentions for a year (the value from NYT and WP were summed for 1984-87).
Searches with ‘AND “ [contestant’s name]”’ appended to the NBA mentions string were performed for each SDC date range. Contestants’ names were searched in quotes to ensure only his exact name would yield results. The values for each contestant in each SDC was divided by the NBA total mentions for that year, multiplied by 100, and used as the measure of player popularity.
We also collected the publicly available NBA All-Star team rosters to impute an ordinal All-Star status variable (Basketball Reference). The 10 All-Star starters, 5 for each NBA conference, are chosen by fan votes and then head coaches from each conference select the players for the All-Star team benches. Thus, being an All-Star starter indicates that a contestant is among 10 of the most popular players in a season. The All-Star status variable indicated whether a contestant was not an All-Star, was an All-Star reserve, or was an All-Star starter in the year of a SDC. We collected All-Star roster data, first, because the variable provides a means to check the ecological validity of newspaper mentions as a measure of player popularity. That is, we expected contestants who were All-Stars to have more mentions than those who were not All-stars and All-Star starters to have more mentions than both. Second, if the newspaper mentions were found to have substandard validity, All-Star status was to be used as the popularity measure.
3.3.3Histrionics
Dummy variables indicating whether histrionics was present and whether the histrionics was functional were included. Histrionics was ascribed to none of Webb’s 1986 dunks. Instead, contestant height, in inches, was also included as a continuous variable to avert subjective misevaluations.
3.3.4Dunk novelty
To quantitate dunk novelty, each dunk was given a string label that included the primary and the following modifiers, only if present: baseline approach, reverse finish, extent of rotation, launch distance, limiter of trajectory, obstruction, multiple balls, swinging, and if a pass was caught. For example, a dunk with a windmill primary, a pass caught, and reverse finish was labeled ‘windmill pass reverse’. All prior instances of a dunk label were counted using all 645 dunks with footage because even dunks without judge-awarded are observable. The resultant value indicated the quantity of instances of airborne activity having occurred prior to a given dunk, including in previous SDCs and earlier in the same contest.
3.4.Data analyses
All statistical analyses were completed using the R v3.3.2 console. Figures were created using ggplot2 (Wickham, 2016) and its extension, ggthemes (Arnold, 2013). For interrater reliability (IRR), the kappa2() function in the irr() package was used to compute Cohen’s Kappa values (Gamer et al., 2012). The IRR consisted of the primary kinematic and modifiers carrying greater subjectivity: reverse finishes, rotation, maximum vertical, leg-kicking, swinging, and arm extension. Other modifiers such as dunking multiple balls or catching a pass are comparatively unequivocal.
A measure of dunk difficulty was sought and derived in lieu of subjectively deciding which dunks were more difficult than others. Because scores were not used in this part of the analysis, all dunks with available footage were included (n = 645) in the derivation of a measure of dunk difficulty. First, we visually inspected the proportions of instances of each dunk element that had≥1 attempt, ≥1 replacement dunk, ≥1 of both, or was judged as a missed dunk. The premise is straightforward: the more athletic or difficult elements were expected to have a higher likelihood of error in execution. Logistic regression was used to evaluate this expectation. The dependent variable was a dummy variable indicating whether each dunk had > 1 attempt, >1 replacement, or was judged as a miss. All dunk elements except for the arm extension modifier were included as independent variables. Arm extension was excluded because visual inspection indicated that less-than-full had a high proportion of errors that we reasoned were related to something other than dunk difficulty. The logistic regression model was used to predict probabilities there would be an error for each of 645 dunks. An optimal cut-off was identified (0.191) and used to classify dunks as either ‘easier’ or ‘harder’.
Nonparametric regressions were conducted using the npregbw(), npreg(), and npsigtest() functions of the np package (v0.60-2; Hayfield and Racine, 2008), for bandwidth selection, model computation, and significance testing, respectively. Least-squares cross-validation was used to estimate fixed bandwidths for explanatory variables in local-linear least-squares regressions (LL). To avoid potential model misspecification due to the presence of local minima, the cross-validation procedure was restarted 100 times. 399 IID bootstrap replications were used to test significance of explanatory variables in LL model.
Upperbounds for bandwidths are specified as: 2 SDs for continuous variables; (d – 1) /d for nominal categorical variables, where d = levels; and 1 for ordinal categorical variables. As a bandwidth approaches zero, more weight is assigned to nearer values and less weight to farther values. Conversely, as a bandwidth approaches its upperbound, the difference in weights diminishes. Thus, the LL will essentially ‘smooth out’ or render irrelevant noninfluential explanatory variables. Readers interested in a more thorough, applied treatment of non-parametric regression using the np package are directed elsewhere (Delgado et al., 2014, Peiró-Palomino, 2016).
To test the validity of newspaper mentions as a measure of contestant popularity, a generalized linear mixed-effects model (GLMM) was conducted with the glmer() function of the lme4 package (v1.1–12) specifying a Poisson distribution (Bates et al., 2014). Contestant mentions was the dependent variable and it was offset by NBA mentions of the SDC year (producing a proportion). The ordinal All-star status variable entered as a fixed-effect. Year and contestant entered as random-effects with random intercepts. The cld() function in the lsmeans package (Lenth, 2016) was used to compute pairwise comparisons between All-star statuses.
The examination of randomness in sequence had two steps, whether popularity and home status influence sequence and whether those variables influenced surviving the initial round. First, a simple linear regression was conducted with a popularity and home-advantage interaction as independent variables and an alternative sequence variable as the dependent. The alternative sequence variable was computed using only the assigned position in the initial round of each SDC, that is, whether a contested performed first, second, third, etc. The alternative sequence variable was normalized as (assigned position – 1) /(total competitors in round – 1); the first contestant equaled 0 and the last contestant equaled 1. Second, a dummy variable indicating whether a contestant survived the initial round, or survived, was created as a proxy for scores (as to include all initial round contestants). SDCs 2012 and 2014 had only one round and the winner was indicated as having progressed (indeed, dunks were not scored by judges but the results are unchanged if excluding these years). A logistic regression was performed with survived as the dependent; sequence and a popularity-home status interaction were covariates.
To examine contest format and superlative variables, linear mixed-effects models (LMMs) were conducted with the lmer() function of the lme4 package (v1.1–12; Bates et al., 2014). Functions in the influence.ME (Nieuwenhuis et al., 2012) and LMERConvenienceFunctions (Tremblay and Ransijn, 2013) packages were used for LMM diagnostics. Tests of significance of fixed and random effects in LMMs were computed using the lmerTest (Kuznetsova et al., 2015) package. Confidence intervals for coefficients were computed at the 95% -level based on likelihood tests.
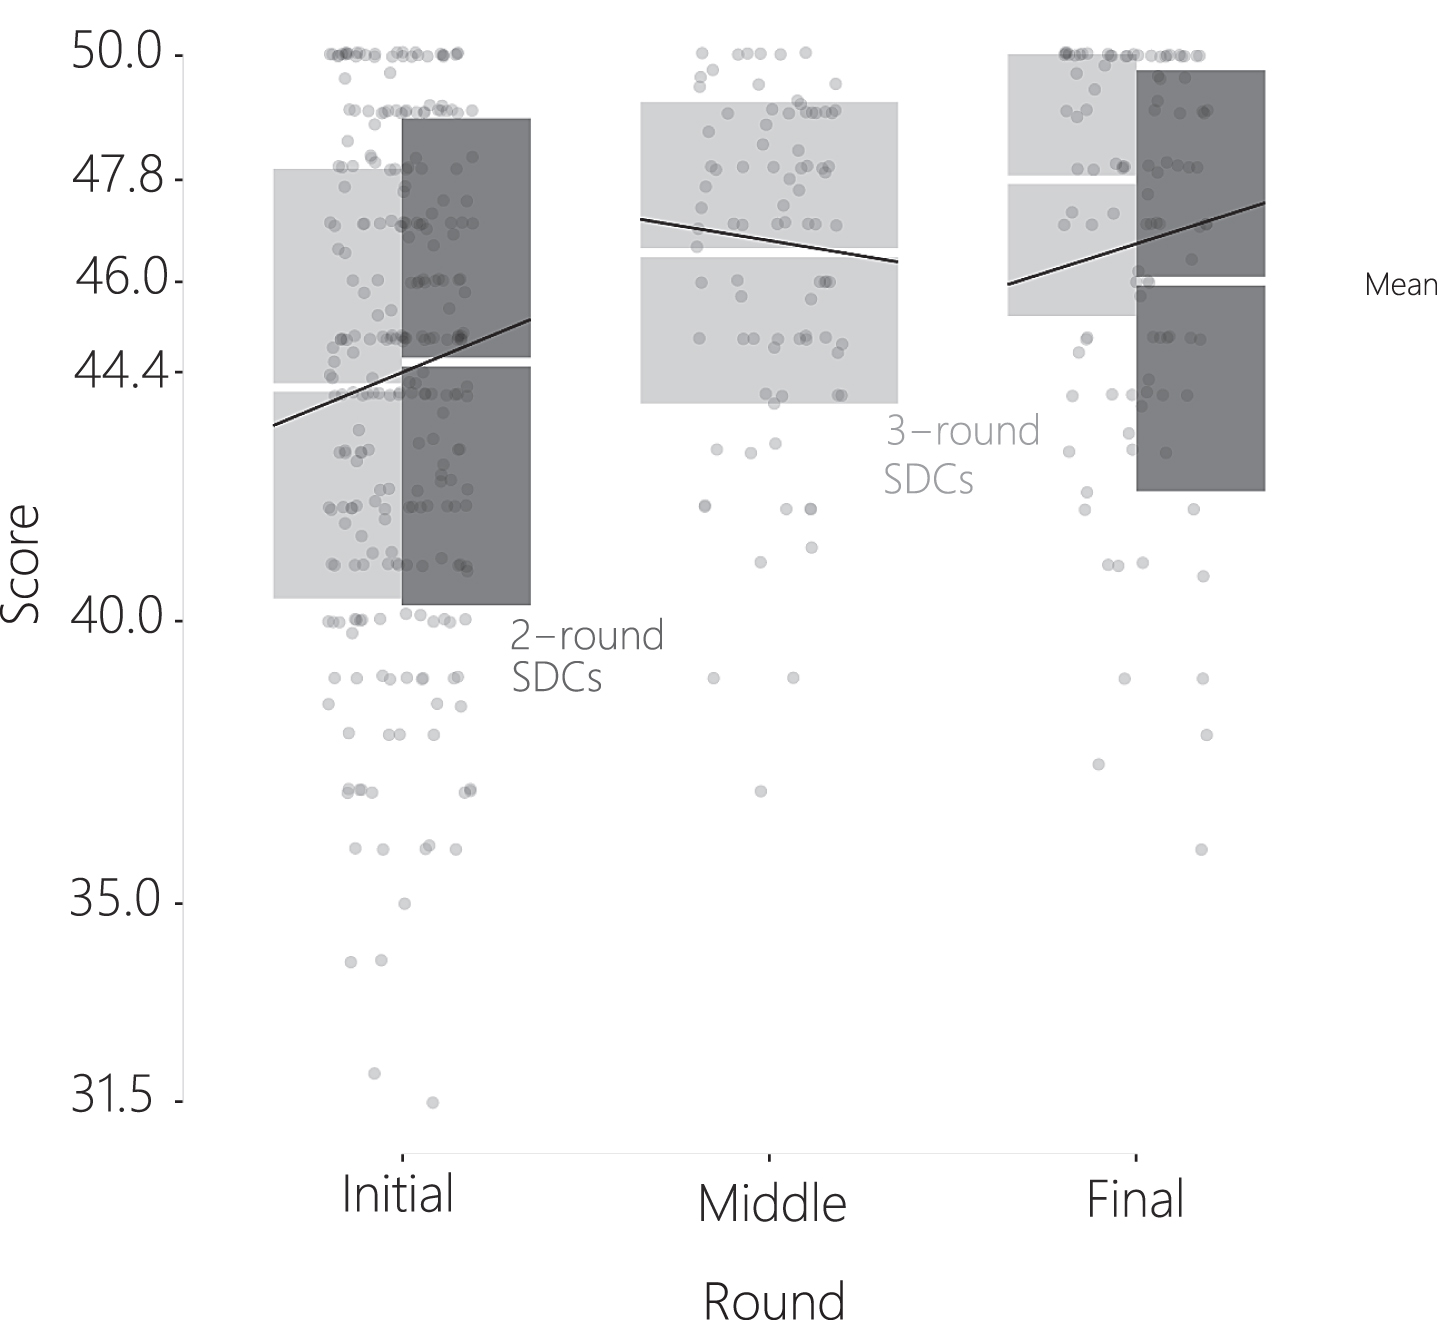
Figure 1 indicates that mean scores (white lines) increase from the initial to the final round. Simple regression slopes of score regressed onto the interaction of sequence and round indicate that the effect of sequence differs between rounds.1 Sequence, round, and the interaction of the two entered the LMM as fixed effects. The dummy variable indicating whether a contestant won the previous SDC (hereafter, WPS) and the WPS-sequence interaction entered as fixed effects.
Fig. 1
SDC Mean Scores ±1 SD by Round with effect of sequence superimposed. Differentiation between 2-and 3-round SDCs was only recognized after the analysis was complete. Hence, the analysis is based on the interaction of sequence×round whereas the figure suggests an interaction of sequence×round×total rounds is appropriate. The points are jittered to prevent overplotting, the points neither differentiate between SDC rounds nor correspond to sequence. Black lines are trend lines of scores regressed onto sequence×round, which yielded slightly improved fit over the main effects of each alone, R2 = 0.105 compared to R2 = 0.099. The trendlines are superimposed such that the leftmost point of each line is the first position in sequence and the rightmost point of each line is the last position in sequence. White line bisecting bars represents mean and the bars correspond to ±1 standard deviation in score.
Raw counts of replacement dunks and attempts for each dunk entered as fixed-effects. Judge experience, dunk novelty, contestant popularity and height, and the dummy indicators for histrionics, functional histrionics, and home-status entered the model as fixed-effects. SDC year entered the model as a random effect, as did contestants, due to repeated measurements; both were set with random intercepts. Score was the dependent variable, offset by the fitted values from the LL model to control for the influence of dunk elements.
4.Results
4.1.Dunk elements
Figure 2A was plotted to inspect the proportions of each primary and modifier with at least one replacement dunk, attempt, or that was a judged missed dunk. Interestingly, dunks with less-than-full extension had a higher proportion of attempts and replacements. This suggests contestants might have become fatigued after repeated misses and were less able to achieve full extension or that they became warry of committing another error and extended less to increase the likelihood of successfully dunking. Similarly, dunks with obstructions and limiters of trajectory plausibly are more difficult because airborne contestants must avoid colliding with an obstruction or the underside of the goal, respectively. However, in lieu of subjectively evaluating difficulty, logistic regression was used to predict probabilities and classify each dunk as easier or harder. The classifications of primaries and modifiers are shown in Fig. 2B.
Fig. 2
The X-axis of Panel A represents the proportion of all dunks with a given Primary or Modifier that required ≥1 attempt, replacement dunk, ≥1 of each, or a missed dunk that was scored. The Y-Axis of Panel A is sorted by total proportion of a given Primary or Modifier that required any of the four. The X-axis of Panel B represents the proportion of a given Primary or Modifier that was classified as easier or harder using logistic regression. The Y-Axis of Panel B corresponds to the Primary or Modifier, with the count of each that was classified as easier (left) or harder (right).
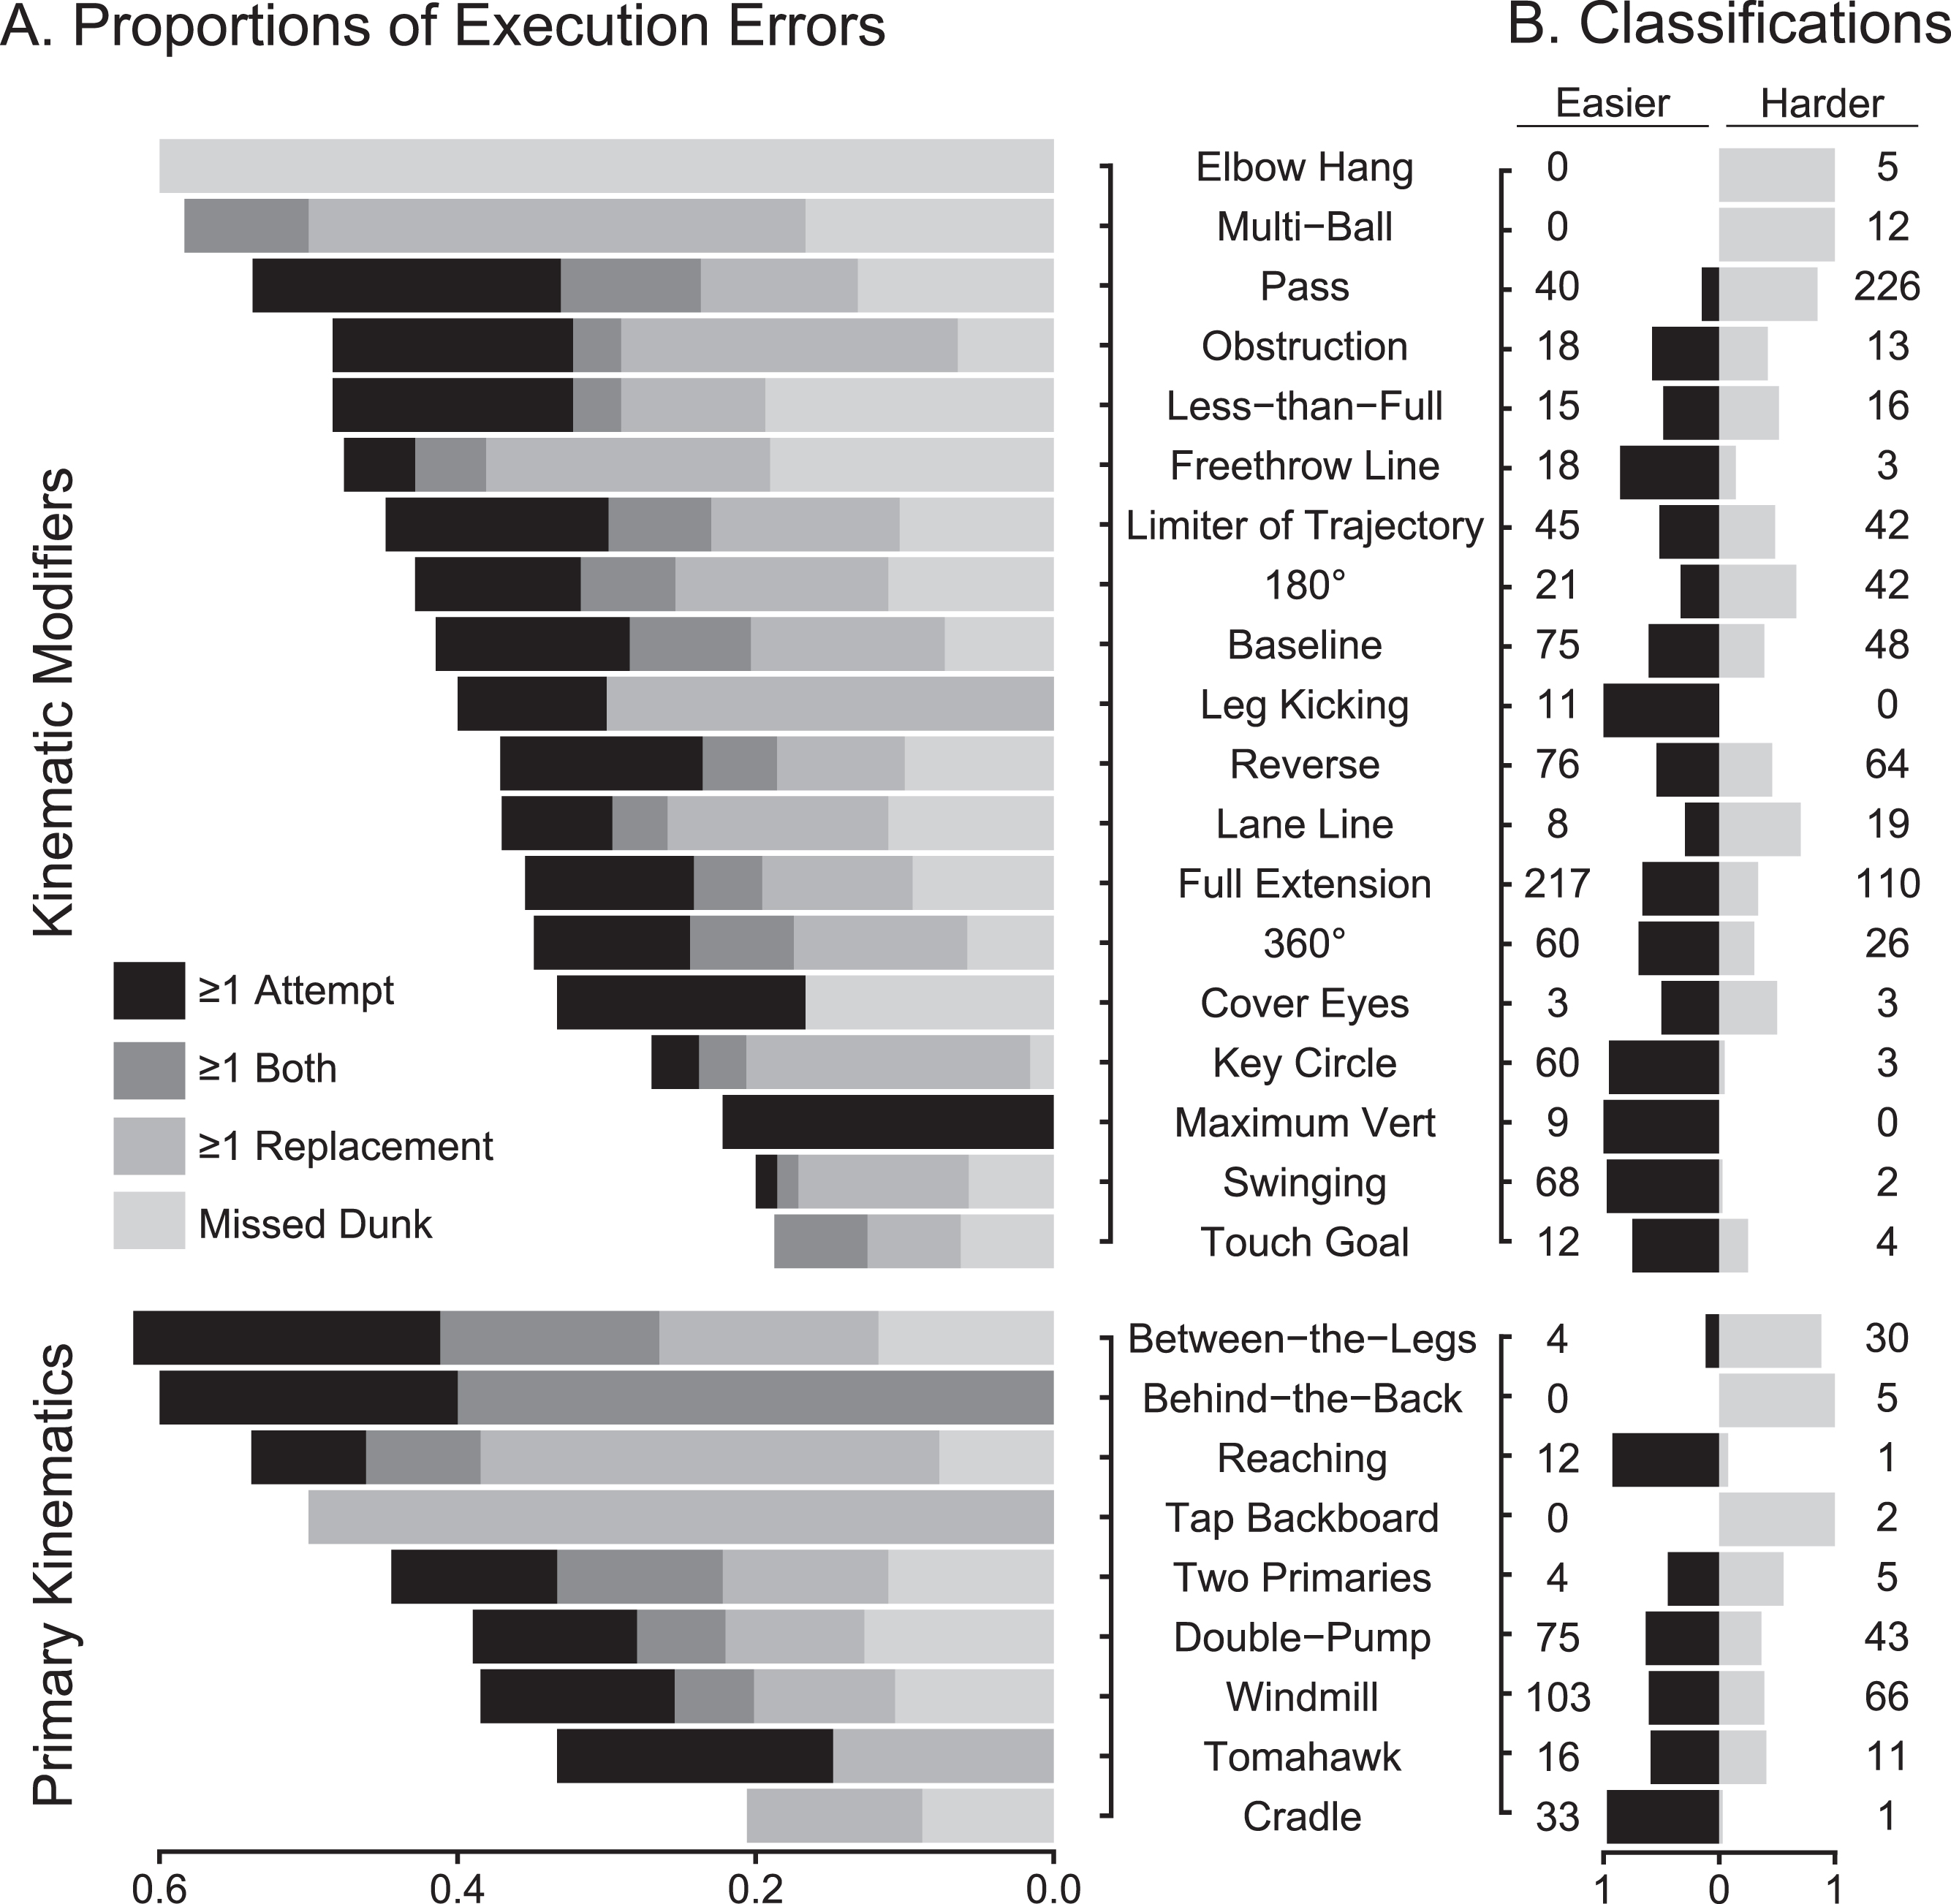
Overall, harder dunks (M = 45.8, SD = 3.77) were scored significantly higher than easier dunks (M = 44.99, SD = 3.88), t(386.5)=2.23, p = 0.03. Although some of the more athletic modifiers were less frequently classified as harder, the disparity is justifiable. For instance, dunks from the freethrow line were largely classified as easier likely because they were typically basic primaries without other modifiers. That is, assuming a contestant can leap the necessary distance, there is a reduced risk of error because those dunks were generally free of additional airborne activity. Likewise, dunks with passes reasonably require more attempts due to the triangulation and coordination necessary to locate and possess the ball in space while airborne. Summarily, the findings presented in Fig. 2 are interpreted as evidence that some dunk elements are harder to execute successfully than others, dunks with harder elements receive higher scores, and the objectively measured difficulty of elements are in line with our expectations.
All dunk element variables were included as explanatory variables with judge-awarded dunk scores as the dependent variable in the LL. Bandwidth estimates appear in Table 4 along with the upperbound for each variable. Figure 3 contains the partial means of primary kinematics with each of the relevant modifiers held constant and how each modifier influences scores with other modifiers held constant.
Fig. 3
Expected Primary Scores with and without Modifiers. The horizontal grey lines represent the mean score of a given Primary Kinematic without Kinematic Modifiers, as predicted by the LL model. The bars associated with each Kinematic Modifier represent how a given Modifier is predicted to change the mean for a Primary, with each white line through the bar representing ±2 points. Some Modifiers are not shown in the figure because little or no change appeared for all Primaries. For each Kinematic Modifier in the figure, all other Kinematic Modifiers are set at their absence (the levels are specified in Table 2).
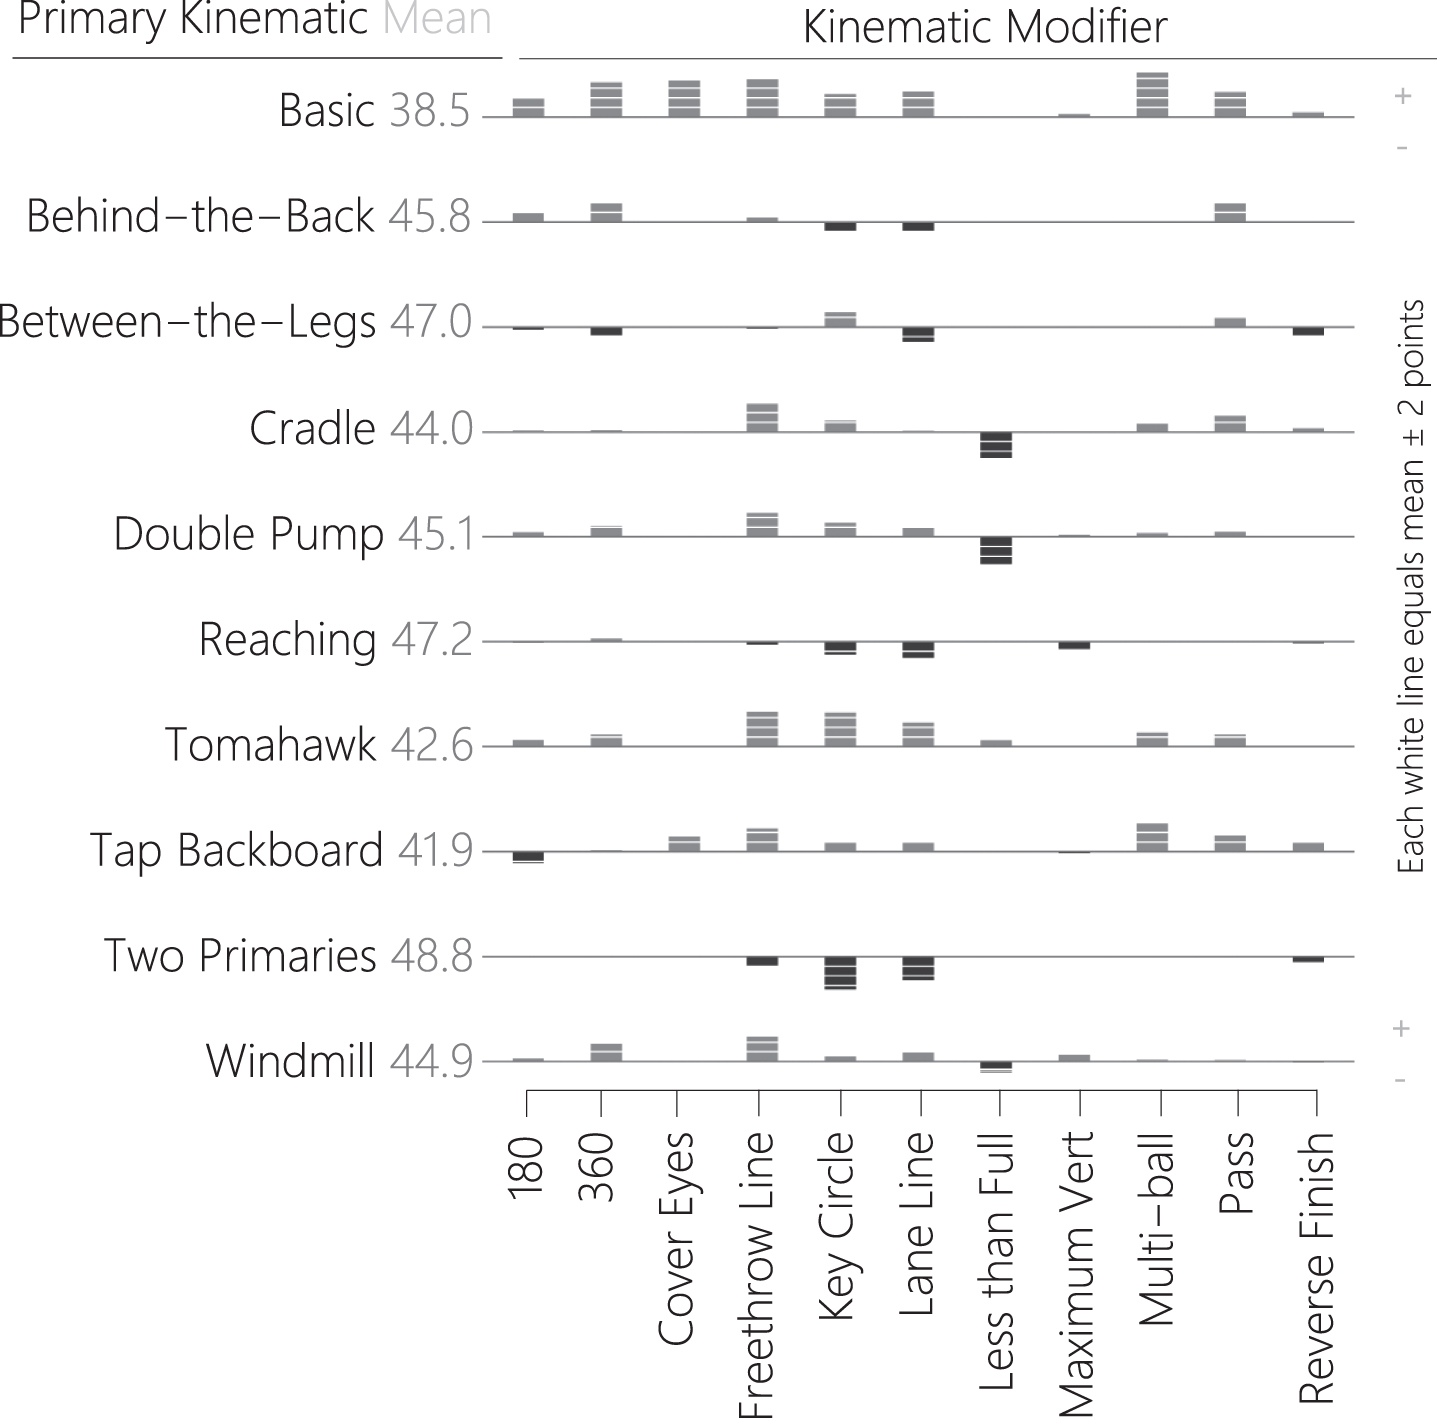
Table 4
Nonparametric regression of scores onto dunk elements
| Element | UB | BW | p |
| Primary Kinematic | 0.90 | 0.092 | 0.000 |
| Airborne Rotation | 1.00 | 0.148 | 0.000 |
| Arm Extension | 0.67 | 0.059 | 0.000 |
| Pass | 0.50 | 0.067 | 0.000 |
| Reverse Finish | 0.50 | 0.237 | 0.003 |
| Cover Eyes | 0.50 | 0.014 | 0.008 |
| Touch Goal | 0.50 | 0.012 | 0.048 |
| Limited Trajectory | 0.50 | 0.392 | 0.065 |
| Launch from Distance | 1.00 | 0.028 | 0.068 |
| Baseline Approach | 0.50 | 0.374 | 0.118 |
| Multiple Balls | 1.00 | 0.003 | 0.198 |
| Obstruction | 0.50 | 0.499 | 0.419 |
| Maximum Verticality | 0.50 | 0.036 | 0.514 |
| Swing | 0.50 | 0.500 | 0.564 |
| Leg Kicking | 0.50 | 0.500 | 0.872 |
| R2 | 0.442 | ||
| SE | 2.913 | ||
Note:UB = Upperbounds; BW = bandwidth.
The results of the LL indicate that primary kinematics, catching a pass, rotation, reverse finishes, arm extension, approaching from the baseline, covering the eyes, limits of trajectory, and jumping from a distance are explanatorily relevant to judge awarded dunk scores. That these variables are also statistically significant at or near conventional significance levels, tends to support our hypotheses. Leaping over obstructions and leg-kicking could be irrelevant elements in SDC judge awarded dunk scores given that the bandwidths for the variables are essentially equal to the upperbounds. Other modifiers, however, such as maximum verticality and swings appear to be relevant but not statistically significant. The distinction between relevance and significance is important. For example, excluding baseline approach, leg kicking, and limited trajectory from the model yields an R2 = .441 whereas excluding all explanatory variables with p > 0.10 yields an R2 = .356 (each with 10 restarts of cross-validation procedure).
4.2.Validity of popularity measure
From 1984-2016, 118 NBA players comprised 178 contestant-spots in SDCs. Of those 178, 27 were All-stars, 12 were All-star starters, and the remainder were not All-stars. The raw mean of popularity was 2.33 (SD = 2.38, range 0 to 12.82). The quantity of newspaper mentions for each SDC contestant was the dependent variable in a GLMM, offset by the quantity of NBA newspaper mentions for a given SDC year. All-star status was a fixed effect. Contestant and year were random effects with random intercepts. Model summary appears in Table 5 and indicates that newspaper mentions increase such that non-All-stars are mentioned in 1.1% of NBA articles, All-stars in 1.9%, and All-star starters in 2.5% of articles pertaining to the NBA when accounting for year and contestant (and holding NBA mentions constant). All-star starters (z = 7.3, p < 0.001) and All-stars (z = 6.9, p < 0.001) were mentioned in significantly more articles than non-All-stars, and All-star starters more than All-stars, z = 2.3, p = 0.062. We interpreted this as evidence that proportional contestant newspaper mentions were an acceptably valid measure of contestant popularity.
Table 5
GLMM testing validity of Popularity and partial marginal means of newspaper mentions by All-Star status
| Fixed Effects | Coef | SE | z | p |
| Intercept | – 4.03 | 0.11 | – 36.24 | 0.000 |
| All-star status (Linear) | 0.57 | 0.03 | 35.80 | 0.000 |
| All-star status (Quadratic) | –0.13 | 0.03 | – 2.37 | 0.027 |
| Random Effect | SD | χ2 | p | |
| Year | 0.787 | 0185.84 | 0.000 | |
| Contestant | 0.381 | 2029.10 | 0.000 | |
| All-Star Status | PMM | 95% CL | SE | |
| Not All-Star | 0.011 | 0.008 | 0.014 | 0.001 |
| All-Star | 0.019 | 0.015 | 0.024 | 0.002 |
| All-Star Starter | 0.025 | 0.018 | 0.033 | 0.004 |
Note: AIC = 1696.2; without Year, AIC = 1880.1; without Contestant = 3723.3. PMM = partial marginal mean; CL = confidence level. All-Star status data points are proportions of a NBA mentions-constant = 1895.674.
4.3.Randomness of sequence
As stated, from 1984-2016 there were 178 contestant-spots in SDCs. Of those, 175 were sequenced in an initial round, 15 of which had home status. Additionally, sequence for 7 contestant-spots was indeterminable leaving 168 for analysis, 14 with home status. The regression indicates variance in initial round sequence was poorly explained by contestant popularity (b = 0.002, p = 0.841), having home advantage (b = 0.011, p = 0.929), and the interaction of the two (b = 0.028, 033 p = 0.395), R2 = 0.01, F(3, 114)=0.572, p = 0.63). However, a trend of more popular home contestants being positioned later in sequence is evident in Supplementary Figure 1, as is a very popular home outlier positioned mid-sequence (R2 = 0.03, p = 0.14 and significant interaction when outlier is excluded). This finding suggests that sequence might have been coordinated such that more popular contestants with home status were positioned later in sequence in SDC initial rounds. However, the aim of the study is examining how these factors influence scoring.
A logistic regression had the survive dummy as the dependent variable with sequence as well as an interaction between popularity and home status as covariates. The logistic model indicates that sequence was a significant predictor of surviving the initial round (z = 3.09, p = 0.002) whereby performing last carried a 0.97 probability of surviving whereas performing in the middle was 0.48 and performing first was 0.31. Popularity (z = 0.829, p = 0.407), home status (z = –0.603, p = 0.547), nor the interaction (z = 0.661, p = 0.509) were significant predictors. We interpret these results to mean that, whether or not sequence was coordinated around popular and home status contestants, it appears that if such coordination occurred, judging in initial rounds was influenced by sequence more so than the superlative variables.
4.4.Format & superlatives
As seen in Table 1, attempts and replacements dunks increased as time progressed, due to changes in SDC rules. Fourteen SDC winners competed in the following SDC and completed 30 dunks in the initial rounds. Fifteen contestants with home status completed 60 dunks in 11 SDCs. The average and median height of SDC contestants was 78in (SD = 3.61) with a range of 66in to 88in. Sixteen dunks were identified as having histrionics, five of which were also functional. Regarding dunk novelty, dunks had been executed an average of 6.66 (SD = 10.84) times prior. The average judge experience of each panel was 7.14 (SD = 6.26) prior SDCs judged.
Offset by the fitted values from the dunk elements LL, judge awarded dunk scores were the dependent variable in a LMM. All the contest format and superlative variables described earlier were fixed effects. Year and contestant were random effects with random intercepts. No violations of normality or homoscedasticity were evident following visual inspection of the LMM residuals plotted against the fitted values, other than precisely truncated scatter in the upper right quadrant which is plausibly attributable to the maximum possible dunk score of 50. Likewise, the linearity of each fixed effect was evident in plots of profile zeta functions.
Fifty-six potentially influential observations were identified using a Cook’s distance cutoff of 4/432 (0.009); the quantity influential for each fixed effect appears in Table 6 and many were potentially influential over multiple fixed effects. All potentially influential observations occurred in 2009 and after. The estimates most effected by exclusion are those for attempts and replacement dunks. Attempts and replacements began increasing in the mid-2000s. Thus, the influence of these observations is attributable to regulatory and participatory changes over time (as opposed to measurement or model specification). We have no reason to exclude these observations on ecological grounds but do acknowledge their statistical influence and include a summary of the model without these cases in Table 6.
Table 6
LMM of scores on contest format and superlative factors, controlling for elements
| Fixed Effects | Model with All Observations | Excluding Influential Obs. | ||||||||||
| Coef. | SE | t | p | 95% CI | ninfl . | Coef. | SE | t | p | |||
| Contest Formatting | ||||||||||||
| Constant | 6.08 | 4.40 | 1.38 | 0.17 | –2.40 | 14.57 | 4.60 | 4.36 | 1.05 | 0.30 | ||
| Attempts | –0.30 | 0.13 | – 2.35 | 0.02 | –0.54 | –0.05 | 17 | –0.13 | 0.15 | –0.88 | 0.38 | |
| Replacements | –0.31 | 0.20 | – 1.58 | 0.12 | –0.69 | 0.08 | 22 | –0.63 | 0.26 | – 2.46 | 0.01 | |
| Won Previous SDC | –0.19 | 1.08 | –0.17 | 0.86 | – 2.28 | 1.91 | 14 | –0.80 | 1.20 | –0.67 | 0.51 | |
| Sequence | 1.69 | 0.49 | 3.45 | 0.00 | 0.74 | 2.64 | 56 | 1.59 | 0.52 | 3.03 | 0.00 | |
| Round, Middle | 1.77 | 0.63 | 2.80 | 0.01 | 0.56 | 3.02 | 18 | 1.75 | 0.63 | 2.80 | 0.01 | |
| Round, Final | 1.66 | 0.50 | 3.34 | 0.00 | 0.71 | 2.65 | 36 | 1.66 | 0.51 | 3.22 | 0.00 | |
| Judge Experience | –0.08 | 0.04 | – 1.92 | 0.06 | –0.15 | 0.00 | 22 | –0.06 | 0.04 | – 1.51 | 0.14 | |
| Sequence×WPS | 0.70 | 1.51 | 0.47 | 0.64 | – 2.19 | 3.64 | 1.35 | 1.71 | 0.79 | 0.43 | ||
| Sequence×Middle | – 1.26 | 1.03 | – 1.22 | 0.22 | – 3.25 | 0.74 | – 1.08 | 1.03 | – 1.05 | 0.30 | ||
| Sequence×Final | – 1.24 | 0.79 | – 1.56 | 0.12 | – 2.76 | 0.30 | – 1.09 | 0.83 | – 1.32 | 0.19 | ||
| Superlatives | ||||||||||||
| Home | 0.94 | 0.48 | 1.96 | 0.05 | 0.00 | 1.87 | 21 | 0.99 | 0.49 | 2.03 | 0.04 | |
| Popularity | 0.20 | 0.08 | 2.42 | 0.02 | 0.04 | 0.35 | 20 | 0.18 | 0.08 | 2.34 | 0.02 | |
| Height | –0.09 | 0.06 | – 1.69 | 0.10 | –0.20 | 0.01 | 13 | –0.08 | 0.06 | – 1.38 | 0.17 | |
| Histrionics | 2.76 | 0.75 | 3.68 | 0.00 | 1.33 | 4.24 | 10 | 2.72 | 0.85 | 3.19 | 0.00 | |
| Functional Histrionics | –0.38 | 1.37 | –0.27 | 0.78 | – 3.01 | 2.30 | 12 | –0.38 | 1.91 | –0.20 | 0.84 | |
| Dunk Novelty | –0.03 | 0.01 | – 2.27 | 0.02 | –0.05 | 0.00 | 34 | –0.02 | 0.01 | – 1.67 | 0.10 | |
| Random Effects | n | SD | χ2 | p | 95% CI | n | SD | χ2 | p | |||
| Contestant | 94 | 1.16 | 18.90 | 0.00 | 0.68 | 1.56 | 77 | 1.03 | 15.60 | 0.00 | ||
| Year | 28 | 0.93 | 18.20 | 0.00 | 0.49 | 1.30 | 23 | 0.77 | 15.30 | 0.00 | ||
| Residual | 2.23 | 2.05 | 2.41 | 2.19 | ||||||||
Note: ninfl. = n of observations influential to a fixed effect.
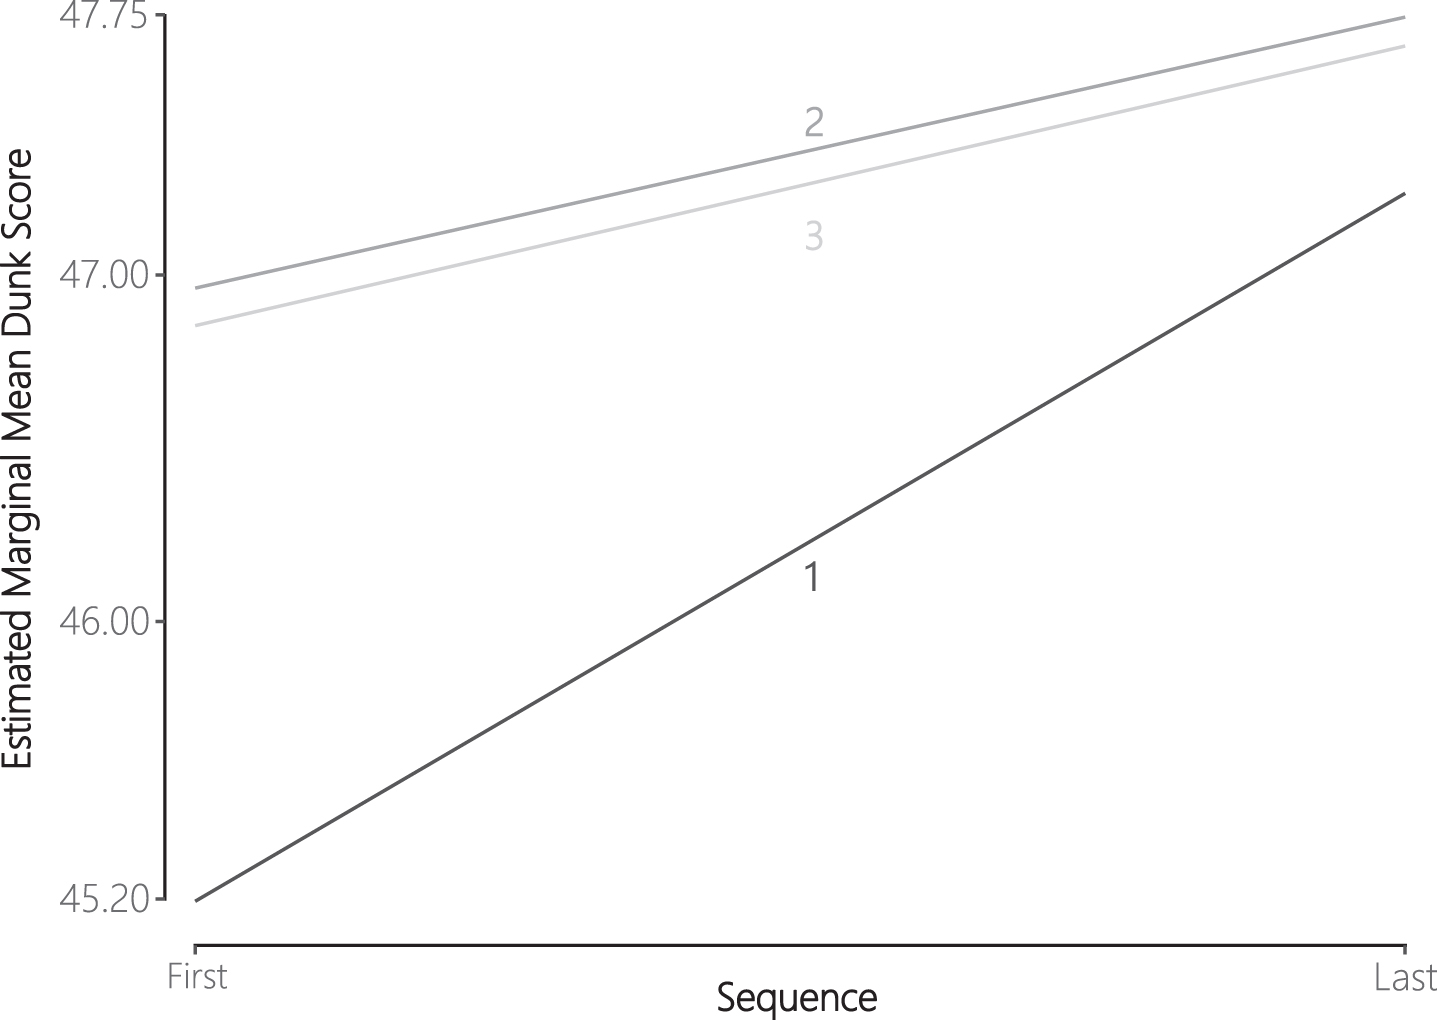
Attempts were significant predictors of lower scores (replacements approached significance). The interaction between WPS and sequence was not significant, indicating the effect of sequence on scores is independent of the initial round positioning of the previous SDC winner. Compared to the initial round, dunks yielded significantly higher scores in the middle and final rounds, the difference for each approaching two points. The interaction between sequence and round was significant for the initial round, the final round approached significant, and was not significant for the middle round. Figure 4 contains the estimated marginal mean dunk scores by sequence, for each round (Lenth, 2018).
Fig. 4
Estimated Marginal Mean Scores in Sequence by Round.
A significant home advantage equivalent to a one-point increase in scores was found. Dunk scores increased as popularity increased. The effect of contestant height trended toward significance, with scores increasing as height decreased such that a contestant of 208.28cm of height would receive about ∼1 point less for the same dunk completed by a contestant of 182.88cm. The presence of histrionics was significant, imparting a 2.7-point advantage, but there was no effect of the functionality of the histrionics. Dunk novelty had a significant effect of decreasing scores. A dunk that had been done 20 times before could be expected to lose ∼0.50 point. Judge experience approached significance also, reducing scores.
4.5.Post-hoc examination of scoring in rounds and dunking prowess
Although the LMM indicates that dunks generally receive higher scores in the middle and final rounds, it is unclear what is driving this difference. It may be that contestants with greater dunking prowess generally survive to later rounds. However, it may also be that judges award higher scores in later rounds because they expect that scores should be greater as contests progress. Post-hoc analyses were undertaken to better understand the differences in scoring between rounds.
Using all dunks with available footage and the easier/harder dichotomous variable discussed earlier (see §4.1), the proportion of harder dunks made (i.e., not missed dunks) in the initial round of each SDC was computed for each contestant. The logistic regression used to evaluate randomness of sequence (see §4.3) was recomputed with this proportion included as a covariate. The effect of dunk difficulty on surviving the initial round trended toward significance (β=0.641, p = 0.131), otherwise the model was virtually unchanged. The effect of difficulty would be such that a contestant had a 50% likelihood of survival if he had zero harder dunks and a 58% likelihood if half of his dunks were difficult.
Scores of all made dunks from initial rounds in all SDCs were then regressed onto an interaction between the easier/harder variable and a yes/no indicator of surviving, with contestant as a random effect. This LMM indicated that harder dunks were scored higher (β=1.686, p < 0.001) and surviving contestants produced higher scores (β=3.643, p < 0.001) but the interaction was nonsignificant (p = 0.242). Pairwise comparisons adjusted with Tukey’s method indicated that survivors were rated 4.04 points higher on easier dunks and ∼3 points higher on harder dunks (ps < 0.001) compared to nonsurvivors. For nonsurvivors, harder dunks were scored significantly higher than their easier dunks (p = 0.01). Importantly, easier dunks done by survivors were scored ∼1.9 points higher than the harder dunks done by nonsurvivors (p = 0.018). Dunk difficulty appears to be negligibly influential on surviving the initial round because contestants who survived produced higher scores on easier and harder dunks, suggesting greater dunking prowess.
Data were then subsetted to include only made dunks from participants who survived the initial round (n = 319). That is, made dunks from all rounds in each SDC by all contestants who survived the initial round in each SDC. Easier/harder dunk was the dependent variable regressed onto the interaction of round and a categorical variable indicating whether that year the SDC had two or three rounds. Harder dunks were more likely to be executed in 2-round SDCs (β=1.53, p = 0.003) than 3-round SDCs. The interaction was not significant and there was no round effect. Pairwise comparisons showed that there were no differences between rounds within 2-and 3-round SDCs (ps > 0.95). This demonstrates that, among the more skilled dunkers, the difficulty of dunks has increased through the history of the SDC but there are no differences in dunk difficulty between rounds within eras.
The LMM of superlatives performed in §4.4 was recomputed with this subset of the data (n = 291 eligible); but functional histrionics was dropped due to there being no instances of it in the subset. Scores did not significantly differ between rounds (ps > 0.36), which would suggest that the effect of higher scores in later rounds is plausibly attributable to lower scores for contestants who did not survive the initial rounds. Effects of attempts and replacements (ps > 0.40), sequence (p = 0.34), dunk novelty (p = 0.39), and home advantage (p = 0.11) were no longer significant. Popularity and histrionics remained significant, with similar effects on scores, and judge experience significantly decreased scores (β= – 0.09, p = 0.03).
Lastly, an interaction between round and the categorical variable indicating whether a SDC had two or three rounds was included in the post-hoc superlatives LMM. Pairwise comparisons indicate that the average final round score was 1.32 points higher than that of initial rounds in 3-round SDCs (p = 0.03); middle rounds trended toward having higher average scores,+0.91, than initial rounds (p = 0.16). However, the difference between final and initial rounds in 2-round SDCs, although – 0.69 points, was nonsignificant (p = 0.63). Effects of other variables were comparable to the first post-hoc superlatives LMM (see Supplementary Table 2). Because dunk difficulty for superior dunkers was not different between rounds within either type of SDC, this suggests that scores were inflated in the final rounds of 3-round SDCs but not 2-round SDCs.
5.Discussion
Analyzed in the present study were factors that influence SDC dunk scores. The primary airborne kinematic and six (of 14) modifiers were found to relevantly influence scores, generally in line with the reports of former contestants and our hypotheses. Sequence, round, and dunk attempts influenced scores as hypothesized, but the more nuanced effect of round is addressed below. Lesser dunk novelty and greater prior judge experience were both found to reduce scores. Heightened contestant popularity, having home-status, and engaging in histrionics each increased scores when controlling for dunk elements and other factors. Tertiarily, newspaper mentions were found to be an acceptably valid predictor of contestant popularity.
5.1.Elements
Preliminary analyses revealed that more athletic dunk elements had higher proportions of errors of execution. Using an aggregate indicator of error, logistic regression generally classified the more difficult dunk elements accordingly, and in line with our expectations. Despite this, and that harder dunks averaged higher scores than easier dunks, the measure of dunk difficulty cannot capture all the nuances of elements and misses subtle differences in difficulty between the execution of elements in different dunks. This shortcoming could be overcome in future studies by objectively measuring the airborne activity of dunk elements.
The LL supported the hypotheses regarding primaries and modifiers. Although the more athletic primaries such as behind-the-back and between-the-legs were generally scored higher than others when controlling for modifiers, pairwise comparisons were not performed. The model expected more athletic modifiers such as 360° rotations of gross anatomy and launching from the free throw line to increase scores by two or more points for most primaries. Likewise, lesser extension of the arms considerably reduced scores for the cradle, double-pump, and windmill primaries (but it actually increased for tomahawks). Taken together, these findings indicate that executing more athletically-demanding elements increases scores in the SDC.
However, in ordinary least-squares terms, the dunk elements model accounted for less than half of the variance in dunk scores. Some variation may be due, in part, to there being fewer scheduled dunks and the use of fan votes (instead of judging) that restricted sample sizes for many of the elements that emerged or became more prevalent after 2000. Alternatively, factors we did not measure such as judges’ angle of observation (Dallas et al., 2011) or inflated scores for more difficult elements irrespective of the quality of execution (Morgan and Rotthoff, 2014) may be at play. Nonetheless, the model appears to support the system we used to classify the dunk elements. The raw mean score awarded for dunks with the basic kinematic is 44.45 whereas the LL estimated it to be 38.5 in the absence of modifiers (the least of all primaries), indicating that the execution of modifiers contributes considerably to scores of dunks ascribed the basic kinematic.
Although the elements are observable, the system used to identify dunk elements remains imprecise and subjective. Regarding imprecision, for example, the swing modifier most commonly precedes the cradle kinematic; however, swinging was given broader applicability in the analysis. Using swinging to account for appreciable maneuverings of the ball prior to initiating any primary kinematic may have adulterated how swinging behaved in the model. This system also provides little objective measure (e.g., distance and rotation are semi-quantitative) as to the degree of difficulty or athleticism necessary to complete a dunk element. Therefore, concerning subjectivity, a matter for future study is examining quantifiable, objective measurements that correspond to athletic ability or difficulty such as measurement of airborne anatomical motions (e.g., length of the arc of ball movement during a windmill) or the duration of the goal shaking after finishing (as a proxy for dunk power). Notably, the present finding that contestants of shorter stature tend to be scored higher than their taller counterparts suggests that the duration of hangtime prior to finishing is also a target for objective measurement (Harding and James, 2010).
More broadly, this system of identifying dunk elements may also be confounded because it requires every element be assigned to a discrete class. This is highly subjective and, as indicated in Table 3, prone to inconsistent application between raters. For example, a John Starks dunk in 1992 was initially viewed as a double-pump with less-than-full arm extension by the first author but as reaching by the second author (our consensus was reaching). If standardized dunk contest scoring protocols were implemented by a governing body, competition could be unduly influenced by this or a similar nominal system of classifying elements. One concern is discrete classes might portend intuitive score-ranges that could outweigh the assessment of the airborne activity that was observed. Imagine the present authors were judging this 1992 John Starks dunk. JMB may have awarded a lower score simply because he ascribed ‘less-than full extension’ (implying less athleticism) whereas ESR may have awarded a higher score to Starks for outstretching to catch the ball (implying greater athleticism)— for what is the same anatomical motion. Another concern is the use of classes could restrict creativity by compelling contestants to utilize only dunk elements listed in a regulatory document. Thus, future operationalizations in empirical study and protocols of competition should strive to objectively quantify airborne activity.
5.2.Format
The LMM indicated that dunk scores decreased as the judging experience of the judges increased. Scores are estimated to be reduced ∼0.25 point when the judging panel has judged 3 previous SDCs combined. In line with the finding that dunk novelty slightly increased scores, this suggests that scores are slightly lowered when judges have observed more dunks. The present findings cannot directly inform whether this is due to judges’ preference for novel dunks or whether they become more discriminate in their evaluation and scoring of dunks. If judges do become more discriminate in scoring with increasing experience, we might expect judges’ prior exposure to all elements found in a dunk to affect its scores. However, a variable measuring this sort of exposure was discarded from the model due to its lack of influence (even when considering polynomic terms and dunk novelty was excluded) and judge experience reduced scores in the post-hoc model using data from contestants with greater dunking prowess. It appears that judges grant higher scores for novel dunks, which is in line with our conclusions below about their preference for excitement. If additional individual-level judge scoring data were obtained (i.e., pre-2000), this could be further teased apart by examining how each judge scores in the presence of various elements, when controlling for novelty.
5.2.1Rounds
As indicated in Fig. 1, SDC scores increased and the variability of scores tended to decrease from the initial to the final round. The distinction between SDCs with 2-or 3-rounds seen in Fig. 1 was only recognized after analysis and was addressed post-hoc using a subset of dunks by contestants with ostensibly greater dunking prowess. post-hoc analyses indicated that, among superior dunkers, there were no differences in dunk difficulty between rounds within 2-and 3-round SDCs. Dunks were comparably difficult across rounds among superior contestants and so scores should have also been comparable. However, scores were significantly greater in the final than in the initial rounds of 3-round SDCs but not 2-round SDCs. Later-round biases have been documented in aesthetic sports with more rigorous protocols (Lee, 2004, Leskošek et al., 2010) and our findings suggest that such a bias was present in earlier SDCs but subsequently diminished. Thus, at least in recent years, it appears judges are appropriately awarding scores across rounds and the round effects reported in §4.4 are likely due to lower scores of contestants who did not survive the initial rounds rather than inflated scores in later rounds.
The diminution of later round score inflation over time may be attributable to changes in contest procedures. For example, reducing the quantities of contestants, rounds, and dunks per round resulted in judges scoring fewer dunks while an increase in dunk difficulty occurred in parallel. Fewer contestants may have served to restrict entry to more elite dunkers. Having fewer opportunities would have allowed contestants to execute harder dunks in the repertoires that they otherwise might have reserved if there were more required dunks in the initial rounds. If so, the number of less impressive dunks would also be limited. Given that there were fewer dunks and those dunks were generally more difficult, the effects of dunk novelty within contests could also have led to the diminution of later-round score inflation. Accounting explicitly for within-SDC novelty could be used to address that matter going forward. Future study could also more thoroughly examine scoring across rounds by considering factors such as aggregated popularity of all contestants or competitiveness of the contest (e.g., measured by win probabilities).
5.2.2Sequence
As hypothesized and in line with previous research on subjective judgments (de Bruin, 2006, Li and Epley, 2009, Morgan and Rotthoff, 2014, Page and Page, 2010, Wilson, 1977), higher scores were awarded to dunks later in sequence, especially for the initial round where the last dunk yielded a 1.69-point advantage over the first. This effect was independent of the most-previous SDC winner being the last contestant in the initial round as well as the other superlative variables. The difference between first and last dunk was < 0.50-point and not significant in the middle and final rounds. However, we did not control for the position of the highest scorer from one round to the next, within contests, as he was often positioned last.
Also, within rounds, all contestants completed their first dunk in order, their second dunk in the same order, and so on, but sequence at this level of ordering was not directly accounted for in the analysis. However, consider the current SDC format which features four contestants, each with two dunks in the initial round. With all else held constant, the LMM predicts that the fifth dunk in the initial round carries a 1-point advantage over the first dunk— even though the fifth and first dunks would be performed by the same contestant. This is interpreted to show that judges award higher scores later in the sequence of the initial round, but sequence appears to be minimally influential in the middle and final rounds. This is perhaps due to contestants in later rounds exhibiting generally exhibiting greater dunk prowess, as indicated by our post-hoc analyses. Nevertheless, sequence effects could be further assessed in future analyses by accounting for possible influence exerted on the score of a dunk by the previous dunk, an effect detected in other subjectively evaluated competitions (Page and Page, 2010).
Additionally, a preliminary analysis of sequence revealed the possibility that sequence was coordinated around popular contestants with home status; that is, potentially undermining the assumption that sequence was random. We did not account for this possibility in the LMM because a subsequent analysis indicated that a contestant’s surviving the initial round was significantly predicted by sequence but not the superlative variables. Thus, it seemed SDC judges were sufficiently impervious to any coordination of sequence, if it occurred. Additionally, the approximate correlation between coefficients of popularity and home status in the LMM r = – 0.03 suggests that, if some sample of other dunks were also included in the model, the coefficient of the two variables could change irrespective of one another. However, this conclusion is made tentative by the limited instances of home status.
5.2.3Replacements & attempts
Scores decreased by ∼1 point for every three replacement dunks or attempts prior to completing the dunk that was scored by judges. We based our hypothesis on prior research and posited that SDC contestants may be ‘choking’ under increased pressure to dunk successfully following one or more failures. Although ‘choking’ remains a plausible explanation, we speculate this finding may also be due to the loss of novelty or lowered excitement, corresponding with our conclusions about histrionics, described below. Boring stimuli have been shown to reduce favorability ratings (Leary et al., 1986) and, perhaps, repeated attempts or replacements bored judges, resulting in lower scores. Also, replacements may attenuate scores because a dunk could be revealed in a replacement or attempt (unless the next attempt is different), akin to a ‘spoiler’ (Benton and Hill, 2012, Tsang and Yan, 2009), which is in line with our finding that dunk novelty increases and judge experience decreases scores. Alternatively, it may be that contestants resorted to less impressive dunks after repeated attempts and replacements. This was not accounted for in the present study but should be addressed in the future.
5.3.Superlatives
5.3.1Home status
A significant, ∼1-point advantage was found for contestants at their home site when controlling for dunk elements, contest formatting, and other superlatives. Prior studies have shown that competing before a home or supportive crowd can enhance performance (Greer, 1983) and an oppositional crowd can inhibit performance (Lefebvre and Passer, 1974, cf., Butler and Baumeister, 1998). In reviewing footage, however, the one instance we saw of the crowd outright booing a contestant was attributable to prior comments Clyde Drexler made about that team (Shirk, 1985). A performance enhancing effect may then be inapplicable since SDC crowds typically cheer following every dunk and even before the dunk when encouraged by contestants. Applying objective measurements of athletic ability such as duration of hangtime would allow future research to better discern if athletic performance is enhanced at the home site or if contestants at their home site merely garner in inflated scores.
5.3.2Contestant popularity
Greater contestant popularity increased scores such that a contestant of median popularity would receive an advantage of about 0.25-point over the least popular contestants but those at and above the 90th percentile of popularity would receive an advantage of about 1-to 2.39-points. This finding evidenced when controlling for dunk elements, formatting, and the other superlatives. It may be that this inflation of scores is exclusively the result of the popularity. However, it is also conceivable that the most popular contestants exhibit athletic abilities or other qualities that led to their heightened popularity as NBA players and that those abilities or qualities translate to the SDC in a way that is apparent to judges but is uncaptured by the system used to classify dunk elements. That is, for example, Michael Jordan jumped higher than most players and this facilitated his success as a basketball player and in the SDC. This could be disentangled with the application of more objective measurement of dunk elements.
5.3.3Histrionics
The presence of histrionics was found to inflate scores when controlling for dunk elements and contest formatting. A common histrionic act is the tributary uniform alteration whereby contestants don the jerseys of former, often revered NBA players. This may indicate a belief that the uniform will enhance performance (Lee et al., 2011) or that positive regard for the revered player will transfer to the contestant and influence judging (Langmeyer and Walker, 1991). Other instances of histrionics correspond to the latter, such as involving a celebrity when a teammate would suffice (e.g., to throw a pass), but neither rationale explains contestants introducing histrionics such as the presence of a singing choir or effervescing cheerleaders.
Ultimately, a desire to induce excitement appears to underlie histrionics. A more inclusive explanation for the use of histrionics then is excitation transfer (ET). ET occurs when a stimulus arouses the autonomic nervous system (ANS) and the residual of that arousal influences the emotional response to a subsequent, unrelated stimulus. For instance, attractiveness ratings of potential mates are heightened following ANS arousal induced via exercise (White et al., 1981) or a roller coaster ride (Meston and Frohlich, 2003). Although this is a matter for future study, if we apply the ET theory to the SDC, histrionics would excite judges, who then award inflated scores.
If our interpretation of histrionics is accurate, then histrionics may benefit the SDC, the contestants, and the NBA. That is, histrionics might enhance the promotional utility of or interest in the SDC. For example, future research might examine if histrionics in one SDC increases fan interest in the following or if histrionics helps boost the contestant’s popularity.
5.4.Shortcomings
The SDC is an exhibition held during All-Star Weekend, a time many NBA players reserve for rest. Although it potentially boosts brand exposure (Blount, 1987, Nathan, 1991, Aschburner, 1995), the SDC in no way affects basketball rankings, other than the risk of injury and how an injury might impact team success. SDC outcomes may then be subject to certain exhibitory trivialities compared to a dunk contest motivated exclusively by intrinsic athletic competitiveness. We are not insinuating that SDC outcomes might be marginalized; rather that, NBA players likely and appropriately train to maximize basketball skills whereas dunking specialists would likely train to maximize dunking skills. Thus, it remains to be seen if the methods and findings of this study are applicable to dunk contests involving dunking specialists.
Given the number of variables employed in the analysis, the SDC offers a relatively small data set. The small n could undermine many of the conclusions we have drawn, particularly those regarding the dunk elements. This latter point can be addressed if future study distills airborne activity into a few continuous and categorical variables that are measurable to some extent in the movements of any primary or modifier. However, despite the relatively small data set, the LMM was relatively unchanged when 56 dunks were excluded due to potential statistical influence.
Also, given the significant effects of several superlative factors, we cannot assume that scoring procedures were consistently implemented throughout SDC history. We do know that the procedure of determining a winner has changed because viewers voted for the winning contestant in some SDCs. That is, the SDC has been used as a promotional vehicle (Nelson, 1995, Latimer, 1994) and the NBA is a commodity of competitive entertainment. Therefore, it is not unimaginable that judges could be encouraged by SDC organizers to evaluate dunks in a way that maximizes entertainment value or could bolster status of a contestant. Likewise, irrespective of encouragement, it may be that judges, like fans, are excited by the SDC and their capacity for subjectivity is reduced— this corresponds to our conclusions about histrionics.
5.5.Applicability
Our findings could be of immediate value for SDC contestants. Consider the 2017 SDC: Aaron Gordon used three replacement dunks while attempting to catch a ball that bounced from the floor after being dropped from a high hovering drone. First, the histrionics of a drone are expected to garner + 2.76 points for whichever dunk he performed as well as some amount of additional points for catching a pass ‘from’ the drone. Second, Gordon was attempting the between-the-legs airborne kinematic which requires greater athleticism and coordination than other primaries, i.e., increased risk for error. Third, by using three replacement dunks, Gordon’s score would be expected to decrease by ∼1 point. The between-the-legs kinematic has an average score of 47 when controlling for other dunk elements whereas, say, the windmill kinematic is 44.9 and demands less athleticism. If we are willing to imagine that Gordon successfully dunks a windmill on his first try, with no replacements, and all else is unchanged, we expect his score to be ∼48.5 whereas with a between-the-legs with three attempts we would expect it to be ∼49. Thus, the reward of a higher expected score for the between-the-legs is not only limited by the maximum possible score of 50 but is also diminished by its difficulty.
Less publicized dunk contests will be staged at a secondary school pep rallies or broadcasted on network television in fringe time slots. Ideally, the findings reported herein are applicable to contestants in those dunk contests, too. Aside from the potential applicability of the foregoing anecdote (i.e., perform creditable dunks one can execute successfully on the first try), the totality of the findings indicates that judges respond positively to excitement that surrounds a given dunk. The influence of excitement on judging may be acceptable or even preferable in exhibitory dunk contests. However, if the dunk contest is to ever become a standalone, sanctioned, athletic competition then the influence of excitement on judging will need to be addressed.
Additionally, the present findings demonstrate the usefulness of newspaper mentions as a measure of popularity for NBA players. Summarily, although more precise and objective methods of quantifying the dunk elements is appropriate for future analysis of the SDC, and dunk contestants in general, the present study is the first to analyze the dunk contest while also contributing to the literature on subjective judging in aesthetic sports.
Supplementary material
{ label (or @symbol) needed for fn } The supplementary material is available in the electronic version of this article: http://dx.doi.org/10.3233/JSA-190242.
Acknowledgments
This research was made possible by Morehead State University and University of Kentucky hosting resources necessary for completion. We would thank the reviewers for taking their time to provide us with insightful critiques. Their insights into round-order effects, randomness of sequence, and the potentially confounding effects of dunk novelty and judge experience, as well as other insight, produced an enhanced manuscript.
References
1 | Arnold, J. , (2013) , ggthemes: Extra themes, scales and geoms for ggplot, R package version 1. |
2 | Aschburner, S. , (1995) , Can Rider slam dunk NBA challengers? Star Tribune: Newspaper of the Twin Cities, 1995 Feb 11. |
3 | Baghurst, T. , & Fort, I. , (2008) , Subjective judging and the home advantage in female collegiate Division I gymnastics, Women in Sport and Physical Activity Journal 17: , 3–7. |
4 | Balmer, N.J. , Nevill, A.M. , & Williams, A.M. , (2001) , Home advantage in the Winter Olympics (1908-1998). Journal of sports sciences, 19: , 129–139. |
5 | Basketball Reference. NBA & ABA All-Star Game Stats and History [Online]. http://www.basketball-reference.com/. Sports Reference, LLC. [Accessed December 2016]. |
6 | Bates, D. , Mächler, M. , Bolker, B. , & Walker, S. , (2014) , Fitting linear mixed-effects models using lme4, Journal of Statistical Software 67: , 48. |
7 | Bee, S. , (1988) , Hometown politics rule dunk contest jordan edges dominique, but it’s judges who get slammed. Sacramento bee, 1988 Feb 07. |
8 | Benton, A. , & Hill, S. , The spoiler effect? Designing social TV content that promotes ongoing WOM, Informs conference on Information Systems and Technology, (2012) . Citeseer. |
9 | Berri, D.J. , & Schmidt, M.B. , (2006) . On the road with the National Basketball Association’s superstar externality, Journal of Sports Economics, 7: , 347–358. |
10 | Blount, R. , (1987) , Spud’s One in a Million – A year ago, Spud Webb became slam-dunk king of the NBA, and an instant - marketing phenomenon soon thereafter. Despite being sidelined by an - injury, he’s still in demand, The Atlanta Journal and The Atlanta Constitution, p.1. |
11 | Brown, E. , Spiro, R. , & Keenan, D. , (1991) , Wage and nonwage discrimination in professional basketball: Do fans affect it? American Journal of Economics and Sociology, 50: , 333–345. |
12 | Burdekin, R.C. , & Idson, T.L. , (1991) , Customer preferences, attendance and the racial structure of professional basketball teams, Applied Economics, 23: , 179–186. |
13 | Butcher, S. , Liping, H. , Tomita, H. , Soo Han, Y. , Marcos-Felipe, J. , Albrecht, H. , Mickevics, A. , & Tanskanen, J. , (2017) , 2017 Code of Points: Men’s Artistic Gymnastics. Fédération Internationale de Gymnastique. |
14 | Butler, J.L. , & Baumeister, R.F. , (1998) , The trouble with friendly faces: Skilled performance with a supportive audience, Journal of personality and social psychology, 75: , (1213) . |
15 | Dallas, G. , Mavidis, A. , & Chairopoulou, C. , (2011) , Influence of angle of view on judges’ evaluations of inverted cross in men’s rings, Perceptual and motor skills, 112: , 109–121. |
16 | David, D. , (1990) , Wilkins slams way to dunk title;Slam-dunk contest, USA TODAY, 1990 Feb 12. |
17 | De Bruin, W.B. , (2006) , Save the last dance II: Unwanted serial position effects in figure skating judgments, Acta psychologica, 123: , 299–311. |
18 | Delgado, M.S. , Henderson, D.J. , & Parmeter, C.F. , (2014) , Does education matter for economic growth? Oxford Bulletin of Economics and Statistics, 76: , 334–359. |
19 | Denberg, J. , (1988) , Dominique wilkins to NBA: - Take this dunk contest and stuff it, The Atlanta Journal and The Atlanta Constitution, (1988) Feb 11. |
20 | Denberg, J.J.D.S.W. , (1986) , Dunking is serious business for Spud - NBA’s smallest player faces tall task in slam-dunk competition Saturday, The Atlanta Journal and The Atlanta Constitution, 1986 Feb 08. |
21 | Dohmen, T.J. , (2008) , Do professionals choke under pressure? Journal of Economic Behavior & Organization, 65: , 636–653. |
22 | Dougherty, M. , (2001) , Slam-dunk competition lacks star power. USA TODAY (Arlington, VA), 2001 Feb 10. |
23 | Farrey, T. , (1990) , Punk of Dunk - Kemp will try to ‘Rattle’ ‘EM, The Seattle Times, 1990 Feb 10. |
24 | Findlay, L.C. , & Ste-Marie, D.M. , (2004) , A reputation bias in figure skating judging. Journal of Sport and Exercise Psychology, 26: , 154–166. |
25 | Gamer, M. , Lemon, J. , Fellows, I. , & Singh, P. , (2012) , irr: Various coefficients of interrater reliability and agreement, R package version 0.84, 137. |
26 | Greer, D.L. , (1983) , Spectator booing and the home advantage: A study of social influence in the basketball arena, Social Psychology Quarterly, 252–261. |
27 | Haigner, S.D. , Jenewein, S. , Müller, H.-C. , & Wakolbinger, F. , (2010) , The first shall be last: Serial position effects in the case contestants evaluate each other. DICE discussion paper. |
28 | Harding, J.W. , & James, D.A. , (2010) , Analysis of snowboarding performance at the burton open Australian half-pipe championships, International Journal of Performance Analysis in Sport, 10: , 66–81. |
29 | Harris, T. , (2014) , A Drive for Drama - League tries to breathe new life into well-worn format of Slam Dunk Contest. Times-Picayune, The (New Orleans, LA), 2014 Feb 16. |
30 | Hausman, J.A. , & Leonard, G.K. , (1997) , Superstars in the National Basketball Association: Economic value and policy, Journal of Labor Economics, 15: , 586–624. |
31 | Hayfield, T. , & Racine, J.S. , (2008) , Nonparametric econometrics: The np package, Journal of statistical software, 27: , 1–32. |
32 | Jones, T. , (1998) , Dunking: The Thrill is Gone, Columbus Dispatch, The (OH), 1998 Feb 06. |
33 | Kent, M. , & Ewell, C. , (2001) , SuperSonics’ Mason slams competition Okla. State alumnus dedicates dunk victory to plane crash victims Pro Basketball NBA All-Star notebook. Sun, The (Baltimore, MD), 2001 Feb 11. |
34 | Kian, E.M. , (2009) , The NBA: Not yet a global sport league in newspaper coverage, The SMART Journal, 4. |
35 | Krieger, D. , (2000) , Carter up to Elbows in Dunk Prowess, Rocky Mountain News (CO), 2000 Feb 13. |
36 | Kuznetsova, A. , Brockhoff, P.B. , & Christensen, R.H.B. , (2015) , Package ‘lmerTest’. R package version, 2. |
37 | Langmeyer, L. , & Walker, M. , (1991) , A first step to identify the meaning in celebrity endorsers, NA-Advances in Consumer Research Volume 18: . |
38 | Latimer, C. , (1994) , NBA Slam-Dunk Contest Conjures Memories, Struggles for Identity., 12 February. |
39 | Leary, M.R. , Rogers, P.A. , Canfield, R.W. , & Coe, C. , (1986) , Boredom in interpersonal encounters: Antecedents and social implications, Journal of Personality and Social Psychology, 51: , 968. |
40 | Lee, C. , Linkenauger, S.A. , Bakdash, J.Z. , Joy-Gaba, J.A. , & Profitt, D.R. , (2011) , Putting like a pro: The role of positive contagion in golf performance and perception, PLoS One, 6: , e26016. |
41 | Lee, J. , (2004) , Outlier aversion in evaluating performance: Evidence from figure skating. |
42 | Lefebvre, L. , & Passer, M.W. , (1974) , The effects of game location and importance on aggression in team sport, International Journal of Sport Psychology. |
43 | Lenth, R. , (2018) , Emmeans: Estimated marginal means, aka least-squares means, R Package Version, 1. |
44 | Lenth, R.V. , (2016) , Least-squares means: The R package lsmeans, Journal of Statistical Software, 69: , 1–33. |
45 | Leskošek, B. , Čuk, I. , Karácsony, I. , Pajek, J. , & Bučar, M. , (2010) , Reliability and validity of judging in men’s artistic gymnastics at the 2009 university games, Science of Gymnastics Journal, 2: , 25–34. |
46 | Li, Y. , & Epley, N. , (2009) , When the best appears to be saved for last: Serial position effects on choice, Journal of Behavioral Decision Making, 22: , 378–389. |
47 | Mchugh, M.L. , (2012) , Interrater reliability: The kappa statistic, Biochemia medica, 22: , 276–282. |
48 | Meston, C.M. , & Frohlich, P.F. , (2003) , Love at first fright: Partner salience moderates roller-coaster-induced excitation transfer, Archives of sexual behavior, 32: , 537–544. |
49 | Mills, B.M. , (2014) , Social pressure at the plate: Inequality aversion, status, and mere exposure, Managerial and Decision Economics, 35: , 387–403. |
50 | Moore, D. , (1991) , Brown pumps up for slam dunk title, Dallas Morning News, 1991 Feb 10. |
51 | Morgan, H.N. , & Rotthoff, K.W. , (2014) , The harder the task, the higher the score: Findings of a difficulty bias, Economic Inquiry, 52: , 1014–1026. |
52 | Nathan, D.E. , (1991) , Brown Wants More, Worcester Telegram & Gazette, 7 October. |
53 | Nelson, G. , (1995) , The star behind NBA All-Stars - Seattle’s Rick Welts has Midas touch, turning NBA Properties into gold, The Seattle Times, February 5, p.1. |
54 | Nieuwenhuis, R. , Te Grotenhuis, H. , & Pelzer, B. , (2012) , Influence. ME: Tools for detecting influential data in mixed effects models. |
55 | Page, L. , & Page, K. , (2010) , Last shall be first: A field study of biases in sequential performance evaluation on the Idol series, Journal of economic behavior & organization, 73: , 186–198. |
56 | Peiró-palomino, J. , (2016) , Social capital and economic growth in Europe: Nonlinear trends and heterogeneous regional effects, Oxford Bulletin of Economics and Statistics. |
57 | Pope, B.R. , & Pope, N.G. , (2015) , Own-Nationality Bias: Evidence from UEFA Champions League Football Referees, Economic Inquiry, 53: , 1292–1304. |
58 | Powell, S. , (1990) , Dunkers strutting new stuff, Miami Herald, The (FL), 1990 Feb 08. |
59 | Richardson, R. , (1994) , Jammin’//Only the strong survive the slam-dunk contest, St. Paul Pioneer Press (MN), 1994 Feb 12. |
60 | Rudman, S. , (1987) , Jordan showing Touch of Erving and King Midas, Seattle Post-Intelligencer, 1987 Feb 07. |
61 | Sarmento, M.R. , (1998) , The Nba On Network Television: A Historical Analysis, University of Florida. |
62 | Schmitz, B. , (2008) , Cleared for takeoff. Lancaster New Era (PA), 2008 Feb 16. |
63 | Scott, F.A. , Long, J.E. , & Somppi, K. , (1985) , Salary vs. marginal revenue product under monopsony and competition: The case of professional basketball, Atlantic Economic Journal, 13: , 50–59. |
64 | Shirk, G. , (1985) , Dr. J must give way to younger dunk kings, Philadelphia Inquirer, The (PA), 1985 Feb 10. |
65 | Spencer, S. , (2000) , The right stuff? Resurrected, corrected and hoping it won’t be rejected, the NBA’s slam-dunk contest is back, San Jose Mercury News (CA), 2000 Feb 12. |
66 | Tillery, R. , (2008) Feb 16 2008, RE: Exclusive preview of Gay’s 1st dunk. |
67 | Times, D.C.D. , (2006) , Iguodala will be in dunk contest, Delaware County Daily Times (Primos - Upper Darby, PA), 2006 Feb 01. |
68 | Tremblay, A. , & Ransijn, J. , (2013) , LMERConvenienceFunctions: A suite of functions to back-fit fixed effects and forward-fit random effects, as well as other miscellaneous functions, R package version, 2: , 919–931. |
69 | Tsang, A.S. , & Yan, D. , (2009) , Reducing the spoiler effect in experiential consumption, NA-Advances in Consumer Research Volume 36: . |
70 | Union, I.S. , (2016) , Special Regulations & Teachnical Rules: Single & Pair Skating and Ice Dance 2016. Dubrovnik. |
71 | Wendy, E.L. , (1989) , Walker flies to victory in slam dunk contest, Lexington Herald-Leader (KY), 1989 Feb 12. |
72 | White, G.L. , Fishbein, S. , & Rutsein, J. , (1981) , Passionate love and the misattribution of arousal, Journal of Personality and Social Psychology, 41: , 56. |
73 | Wickham, H. , 2016, ggplot2: Elegant graphics for data analysis, Springer. |
74 | Wilson, V.E. , (1977) , Objectivity and effect of order of appearance in judging of synchronized swimming meets, Perceptual and Motor Skills, 44: , 295–298. |
75 | Zeigler, M. , (1988) , Second chance gives Jordan dunk title, San Diego Union, The (CA), 1988 Feb 07. |
Notes
1 The interaction of round and sequence yield slightly improved goodness-of-fit over the main effects alone, R2 = 0.105 compared to R2 = 0.099.


