
A development model to guide the recruiting of female shot putters at the NCAA Division I Championship level
Abstract
Given the high stakes nature of NCAA athletics, it has become increasingly important for coaches to recruit athletes who can compete and make substantive contributions to a team’s success. The purpose of this study was to develop an analytic to predict the time it would take a high school female shot putter to contribute a score at the NCAA Championship meet based on her personal best high school performance. Performance data from high school and college performances were collected from NCAA women’s shot putters, who completed their eligibility from 2012–2017 (N = 63), and graphed to construct a trend line which plotted the top shot put performance of each individual from high school (y) against their best result from each of four or five years in collegiate competition (x). Strong correlations were found between high school and collegiate performance for the first three years of collegiate competition with statistical significance achieved at p < 0.0001. The correlation progressively decreased with each year of collegiate competition with years four and five of collegiate eligibility demonstrating a diminished statistical significance at p < 0.05. Minimum high school performances were calculated in order to produce a statistically significant result that could score for each place at the NCAA meet for a given amount of years competing in NCAA Division I track and field. The results provide track and field coaches with the first analytical model that can assist in determining a high school recruit’s ability to contribute valuable points at the most important competitions.
One of the greatest challenges facing coaches at the NCAA Division I level is evaluating an athletes’ potential and then predicting how they will develop through the course of their collegiate athletic careers. The result of this vetting process will often determine who a coach will recruit into their program with the expectation that these student athletes will be able to compete and make substantive contributions to a team’s success. This challenge is especially formidable for an NCAA track and field coach who has a maximum number of full scholarships at their disposal that is less than the number of events contested in the championship program. This circumstance makes the evaluation process during the recruitment period of critical importance, since a coach with limited scholarships available to award top athletes cannot afford to misevaluate an athlete’s potential if they are hoping to have a successful program. In this regard, the implications of a poor evaluation are more severe for the track and field coach than for an NCAA coach in a sport with multiple scholarships per position such as American football, basketball, women’s volleyball, or women’s soccer. Thus, it appears an NCAA track and field coach could derive a great benefit from an analytic tool in helping to make these determinations.
The use of analytic models to determine future performance is well documented and has been embraced by coaches in individual sports such as swimming (Stanula et al., 2012), speed skating (Kuper & Sterken, 2003), and gymnastics (Nassib, Mkaouer, Riahi, Wali, & Nassib, 2017) as well as in the team sports of ice hockey (Roczniok et al., 2013), soccer (Arndt & Brefeld, 2016; Gonaus & Muller, 2012) and American football (Bergman & Logan, 2016). While the sport of track and field has also made an effort to use predictive analytics to determine future performance, most of that work has focused on the running events. Such studies have concentrated on determining ways to predict performance in long distance races (McLaughlin, Howley, Bassett, Thompson, & Fitzhugh, 2010; Stratton et al., 2009), and the 400 m meter hurdles (Przednowek, Iskra, & Przednowek, 2014).
Unlike most running events in track and field, throwing events, such as the shot put, are considered ‘late blooming’ events in which athletes peak in their mid to late 20’s (Babbitt, 2016). This will put their top career performances outside the collegiate competition window of 18–23 years of age. The long maturation process for the shot put can be explained by the need for the extensive technical and power development that is fundamental for throwing success, which is very labor intensive and takes many years to fully develop (Rudman, 2002). Technical development typically revolves around executing a large number of throws, and throwing drills to develop the proper motor patterns necessary to throw the desired distances (Judge, Young, & Wanless, 2011; Babbitt, Chang, Lin, & Cheng, 2012). This can make future performance prediction especially challenging for the throws, since athletes in these power-based technical events develop later in their careers compared with other track and field events such as sprinting and jumping (Tilinger, Kovar, & Hlavata, 2005). Unfortunately, there is very little research in this area with regard to long term development for emerging athletes in the throws. There have been minimal studies focusing upon prediction of performance in the throwing events of track and field (Pilianidis, Mantzouranis, Kyriakoulakis, Proios, & Kotzamanidis, 2012; Radicchi, 2012; Heazlewood, 2006; Grycmann et al., 2015) however, these investigations have been concerned with medal winning performances at the Olympic Games and IAAF World Championships, rather than yearly performance development for athletes of an age with which NCAA coaches would be concerned.
In order for a track and field coach to identify athletes that can contribute to a team score at the NCAA Championship level, he or she must be able to make informed decisions on how many years it will take for them to develop into an NCAA scoring performer. Currently, there is a large gap between the performance level of the top female high school shot putters in the United States and the minimum performance needed to obtain a scoring place at either the NCAA Indoor/Outdoor Track and Field Championships. Calculations from the Milesplit Network (www.milesplit.com) show that during the period spanning 2012–2017, there is an average of a 1.66 m gap between the average personal best for the top 10 senior female high school shot putters and the average 8th place finish at the NCAA Track & Field Championships. The width of this performance gap is significant, and has been trending wider. This dilemma poses a great challenge for the NCAA coach to make an accurate prognostication of how long it will take for this gap to be bridged. The size of this gap suggests that it may take at least three years in the NCAA system for the vast majority of female shot putters to have the potential to score at the NCAA Division I level.
Since a sizable majority of incoming freshman female shot putters are so far away from NCAA Division I scoring level performance, it is critical that the collegiate coach be able to correctly assess their potential to develop into successful throwers. It is very likely that these prospects will be well served by taking a red shirt year at the beginning of their collegiate career, where they do not have to compete for the university, so they can just focus on developing their technique and power. In light of these issues, an analytic to predict the time it would take a high school female shot putter to contribute a score at the NCAA Championship meet based on her personal best high school performance could be helpful in forecasting latent sports performance in a discipline such as the shot put.
1Importance of performance analysis for NCAA track & field coaches
To clarify the importance of performance analysis for the NCAA track and field coach, it is necessary to put into the context how the information will be utilized for recruiting and putting together a roster. Ultimately, program success at the NCAA Division I level in track and field is determined by how well the team, and by association the individual members, perform at the NCAA Championships. The sport of track and field conducts both indoor and outdoor championships. Each of which is considered a separate season, and they hold equal weight in terms of importance. Team performance is decided by how many points each team scores, and points are added up based on performance placing in the individual running, relay, and field events. Scoring is calculated on a 10-8-6-5-4-3-2-1 point-scale for the top eight finishers, with 10 points being awarded for first place and 1 point being awarded for eighth. Since team scoring is the definitive measure of a team’s success at the championships, it can be very easy to determine a single individual’s contribution to the overall team’s finish. Shot put is perhaps the most important throwing event in the sport of collegiate track and field in terms of scoring at the collegiate level, for it is the only throwing event contested in it’s pure form in both the indoor and outdoor seasons. Therefore, the performance level is highly developed compared with other throwing events, and shot putters tend to be most coveted throwing athletes in the collegiate system.
Another critical factor that influences the team track and field dynamic has to do with the nature of scholarship funding for the sport. Track and field is considered an equivalency sport with regard to athletic scholarship allocation and a team’s scholarship allotment can be split up and divided into various amounts. The maximum number of scholarships that an NCAA Division I women track and field program is allowed to award is 18. However, the NCAA Outdoor Track & Field Championships contest 21 different events, and the NCAA Indoor Championships contest 17 different events, with eight scoring places per event. This provides a total of 168 potential scoring opportunities outdoors and 136 scoring opportunities indoors. This situation means there are far more scoring places in a track and field competition than there are full scholarships by over a 9:1 margin outdoors and 7:1 indoors. By contrast, NCAA Division I sports such as American football and women’s basketball have relatively auspicious position/scholarship ratios of 4:1 and 3:1, respectively. For this reason, every large scholarship awarded in track and field is counted on to be a scorer, and there is no such thing as a “second string” athlete or a depth chart. A success rate of 100% is the goal of each track and field coach and everyone is considered a “starter”, whereas team sports have “failure” built into their system since there is only one starter per position and multiple athletes competing for one starting place.
The purpose of this study was to develop an analytic to help predict the time it would take a high school female shot putter to be capable of producing a result to be an NCAA Championship scorer based on her personal best high school performance. Specifically, the study sought to (a) calculate the rate of development throughout a female shot putters collegiate career at the NCAA Division I level based on her high school performance, and (b) to determine how many years it will take before that athlete would have the potential to contribute a score at the NCAA Division I Championship meet.
2Methods
Sixty-three of the top female shot putters from the NCAA Division I level (both US and international athletes), who completed their collegiate eligibility during the 2012–2017 seasons were selected for the performance analysis. Each of the subjects that were selected also had a minimum performance of 16.50 meters while in college. The minimum performance threshold for the subject group was established since it was the lowest possible performance needed to have a chance to score at the NCAA Championship meet during their eligibility period. It was also necessary to use only throwers that had completed their collegiate eligibility during these seasons so all years of collegiate competitions could be considered in evaluating the performance development profile. The best shot put performances for all throwers were recorded from their high school competition using the Milesplit Network (www.milesplit.com) website. Top performances for each year of collegiate eligibility, including redshirt years, were collected from the TFFRS (Track & Field Results Reporting System) list compiled by USTFCCCA (United States Track & Field and Cross Country Coaches Association).
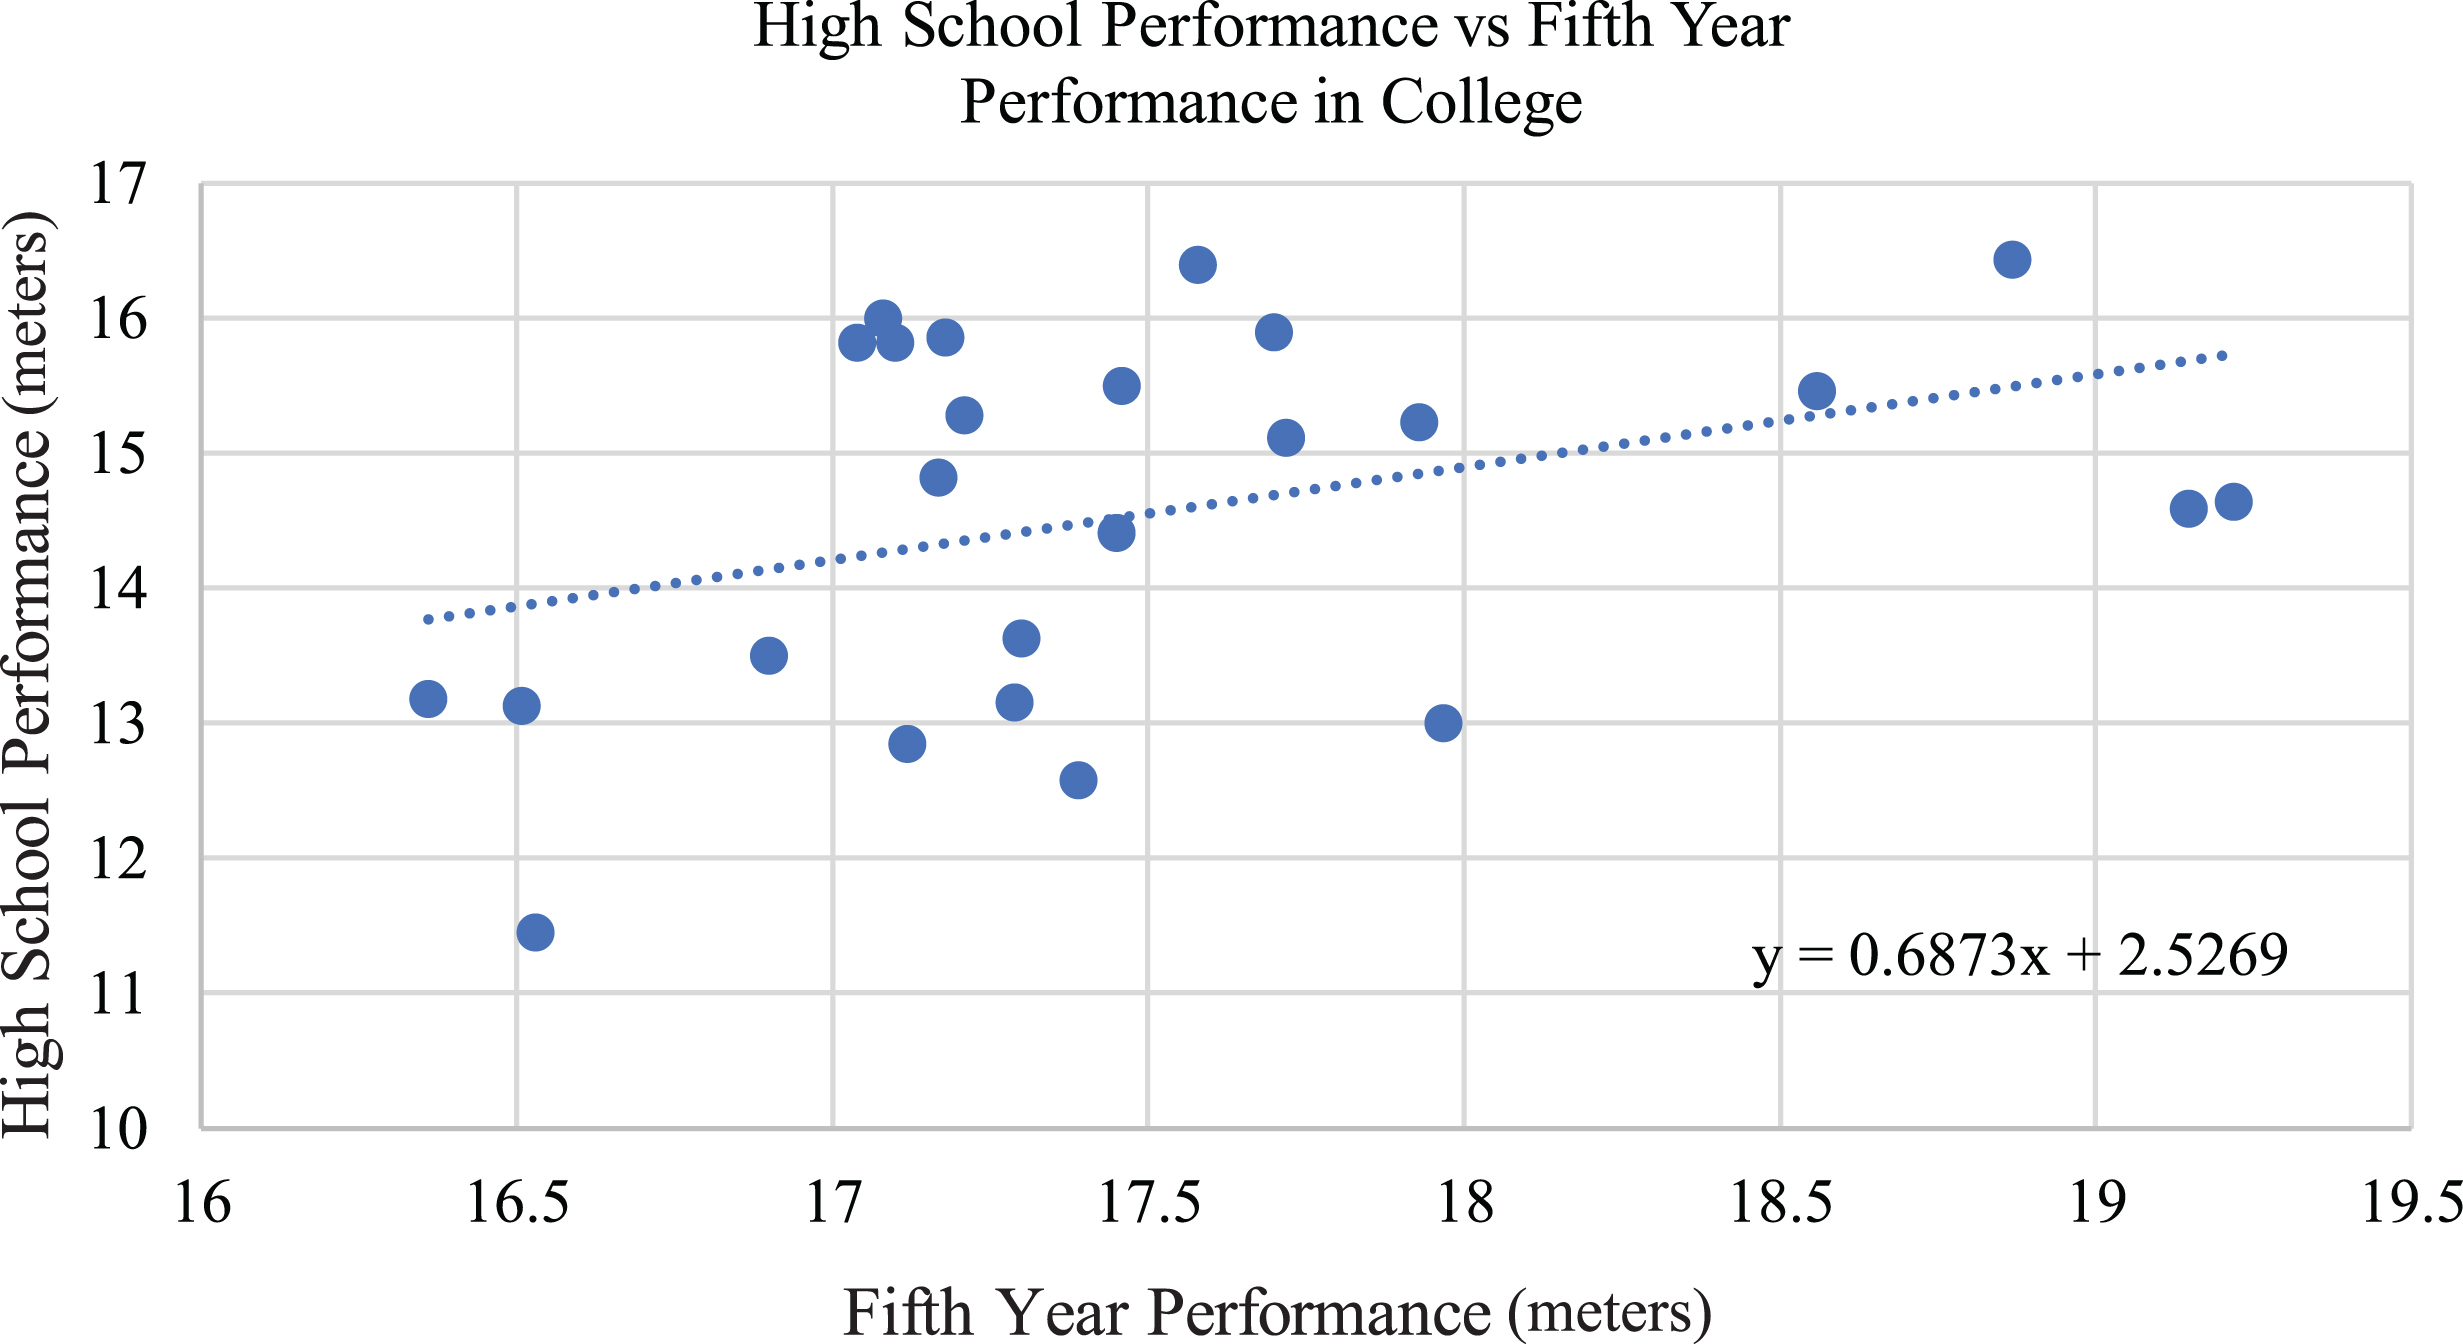
This data was graphed to develop a trend line which plotted the top shot put performance of each individual from high school (y) against their best result from each of their four to five years of collegiate competition (x) (see Figs. 1–5). The slope of the trend lines generated for each of the five competitive seasons, in which y represents the high school performance and x equals the collegiate performance after a given numbers of years in the collegiate system, denoted the rate of projected improvement in shot put performance. Calculations were performed for each of the given time periods, ranging from high school through first year of collegiate competition, to high school through the fifth year of collegiate competition. Correlation coefficients were calculated for performances for all five time periods of potential competition with statistical significance set for α at <0.05.
Fig. 1
Trend lines for first year collegiate performance based on high school personal best.
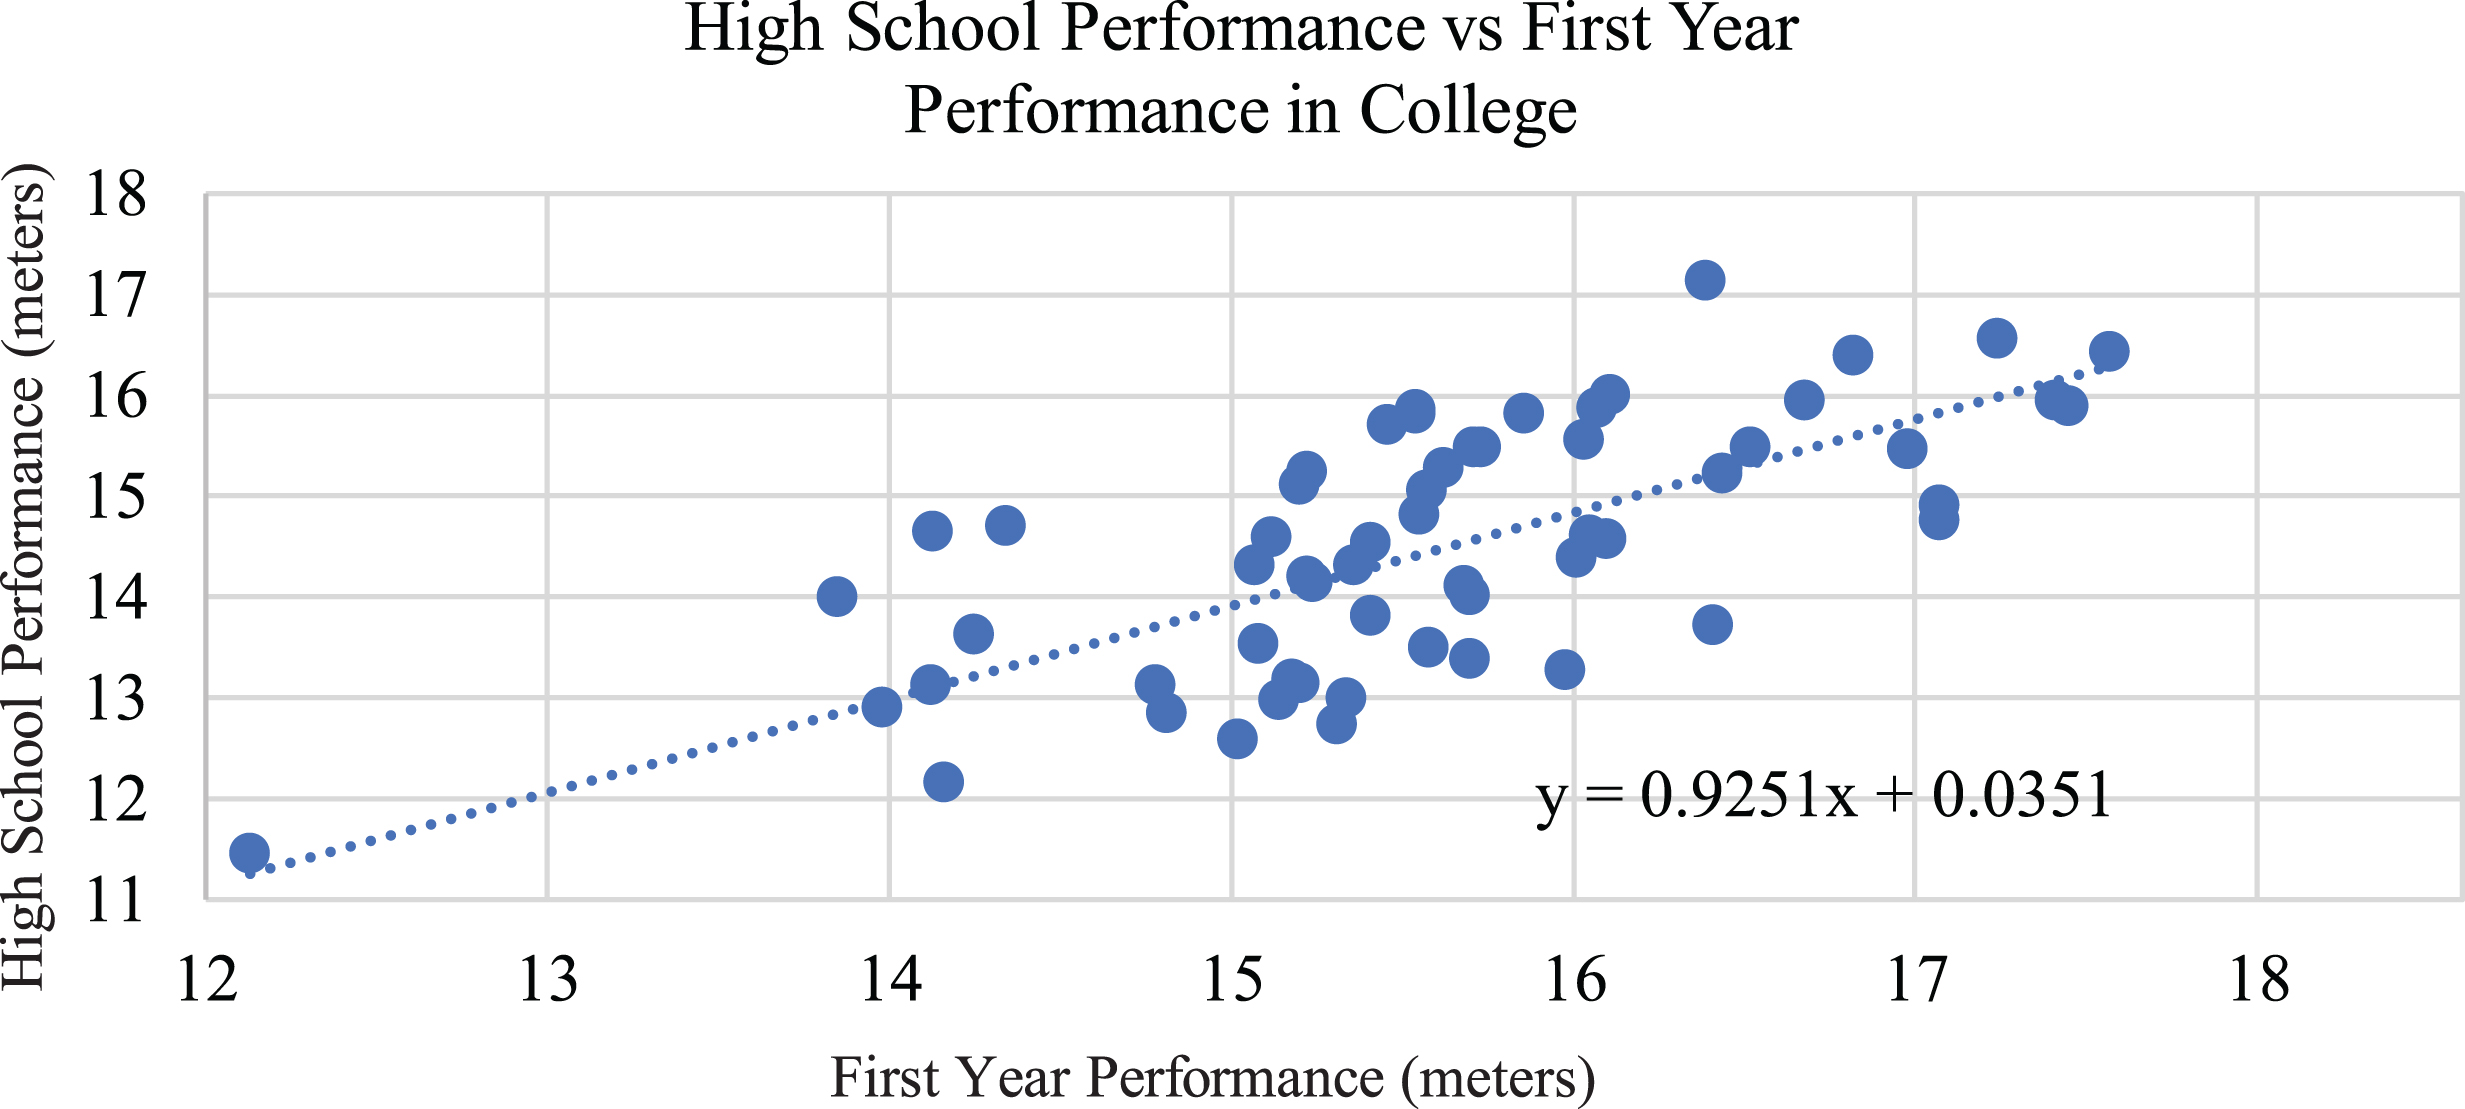
Fig. 2
Trend lines for second year collegiate performance based on high school personal best.
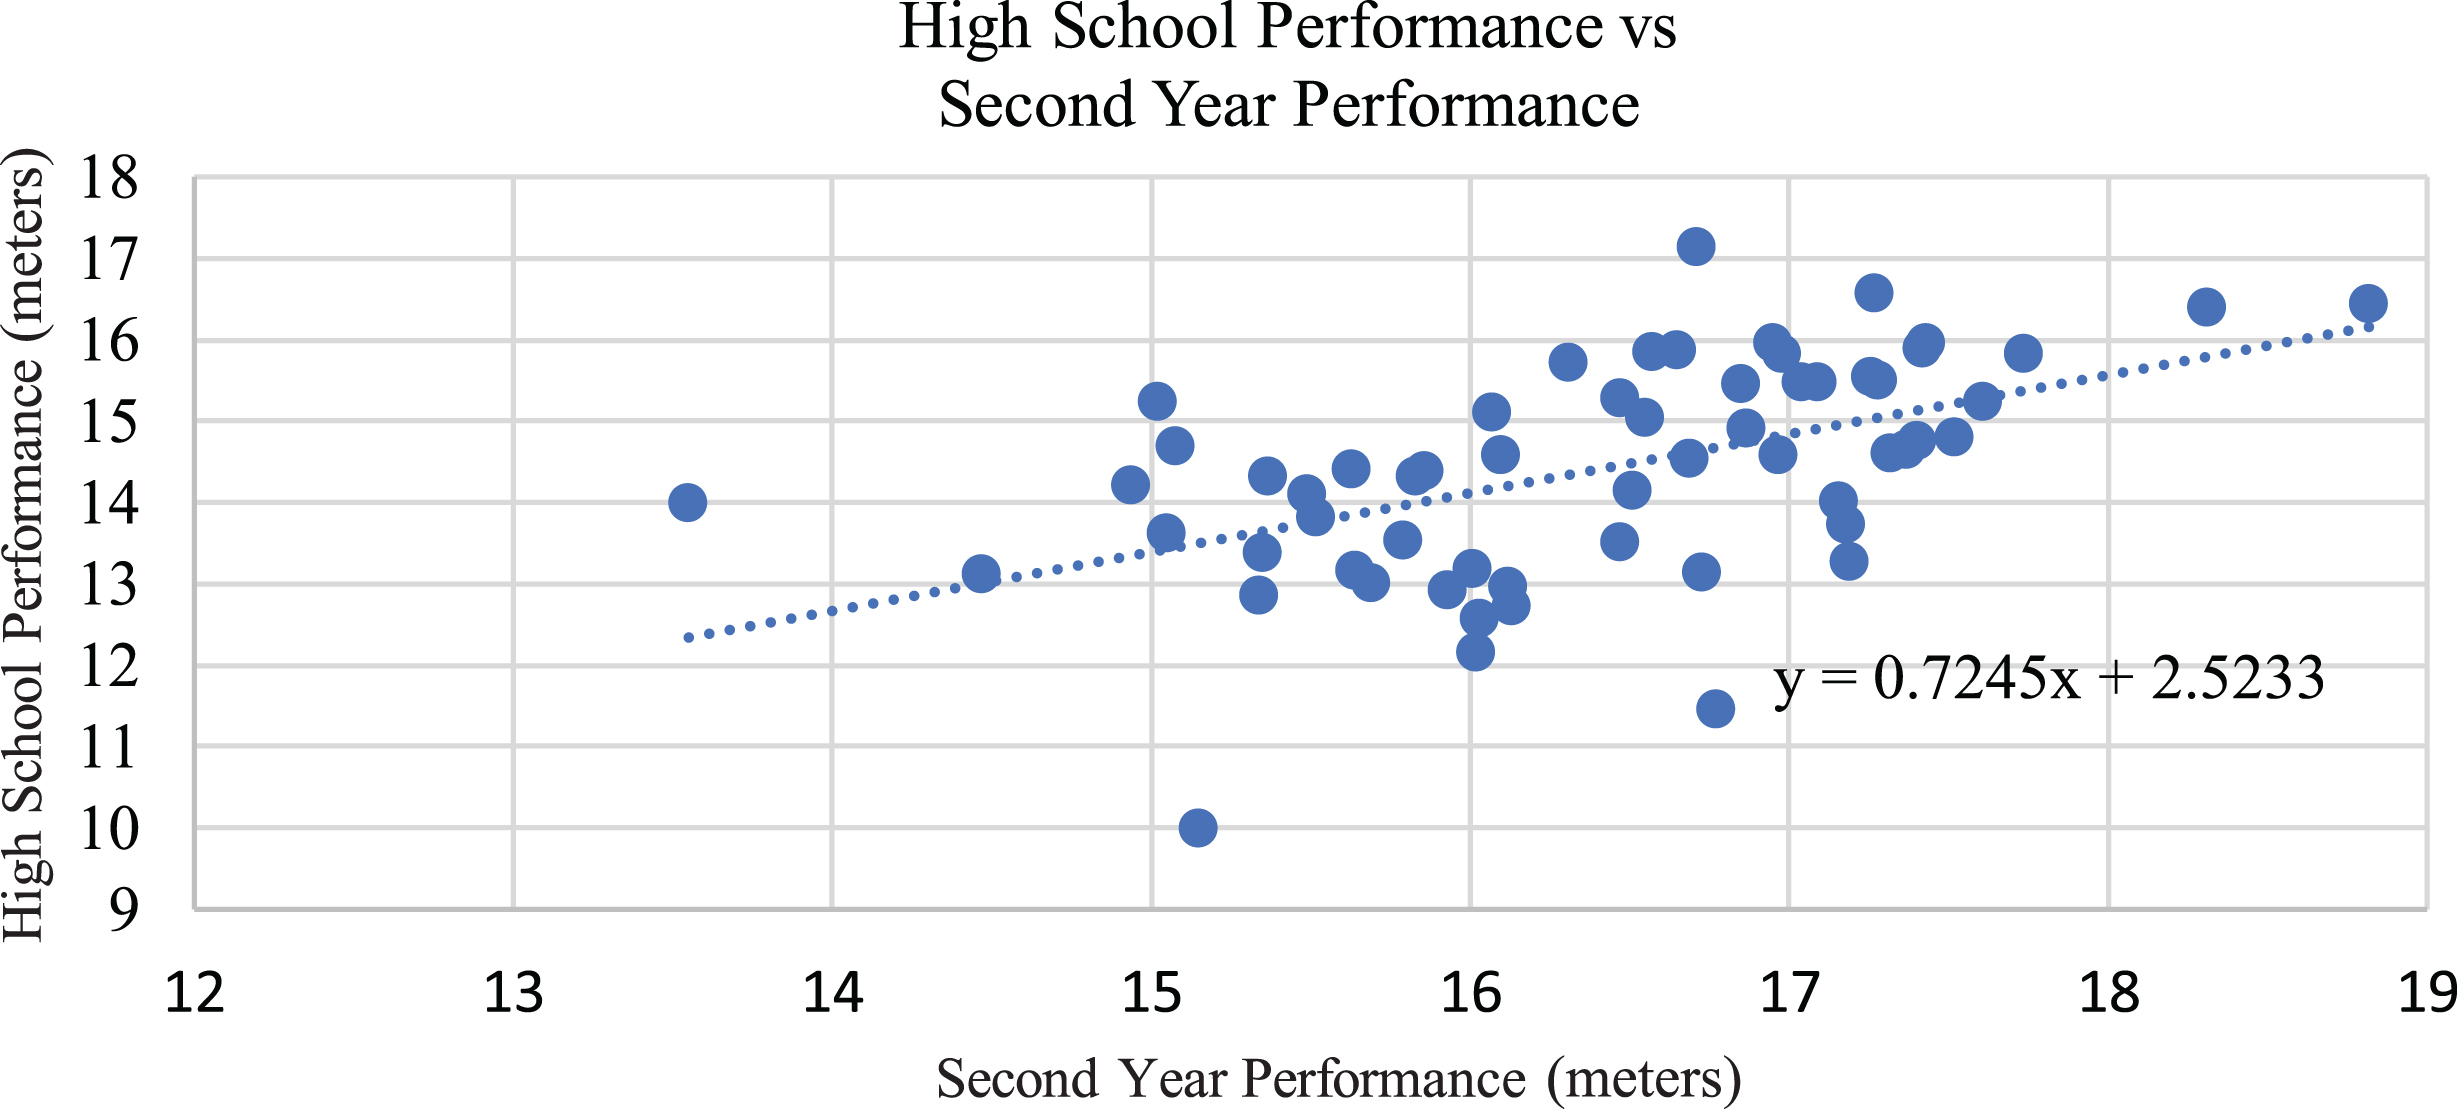
Fig. 3
Trend lines for third year collegiate performance based on high school personal best.
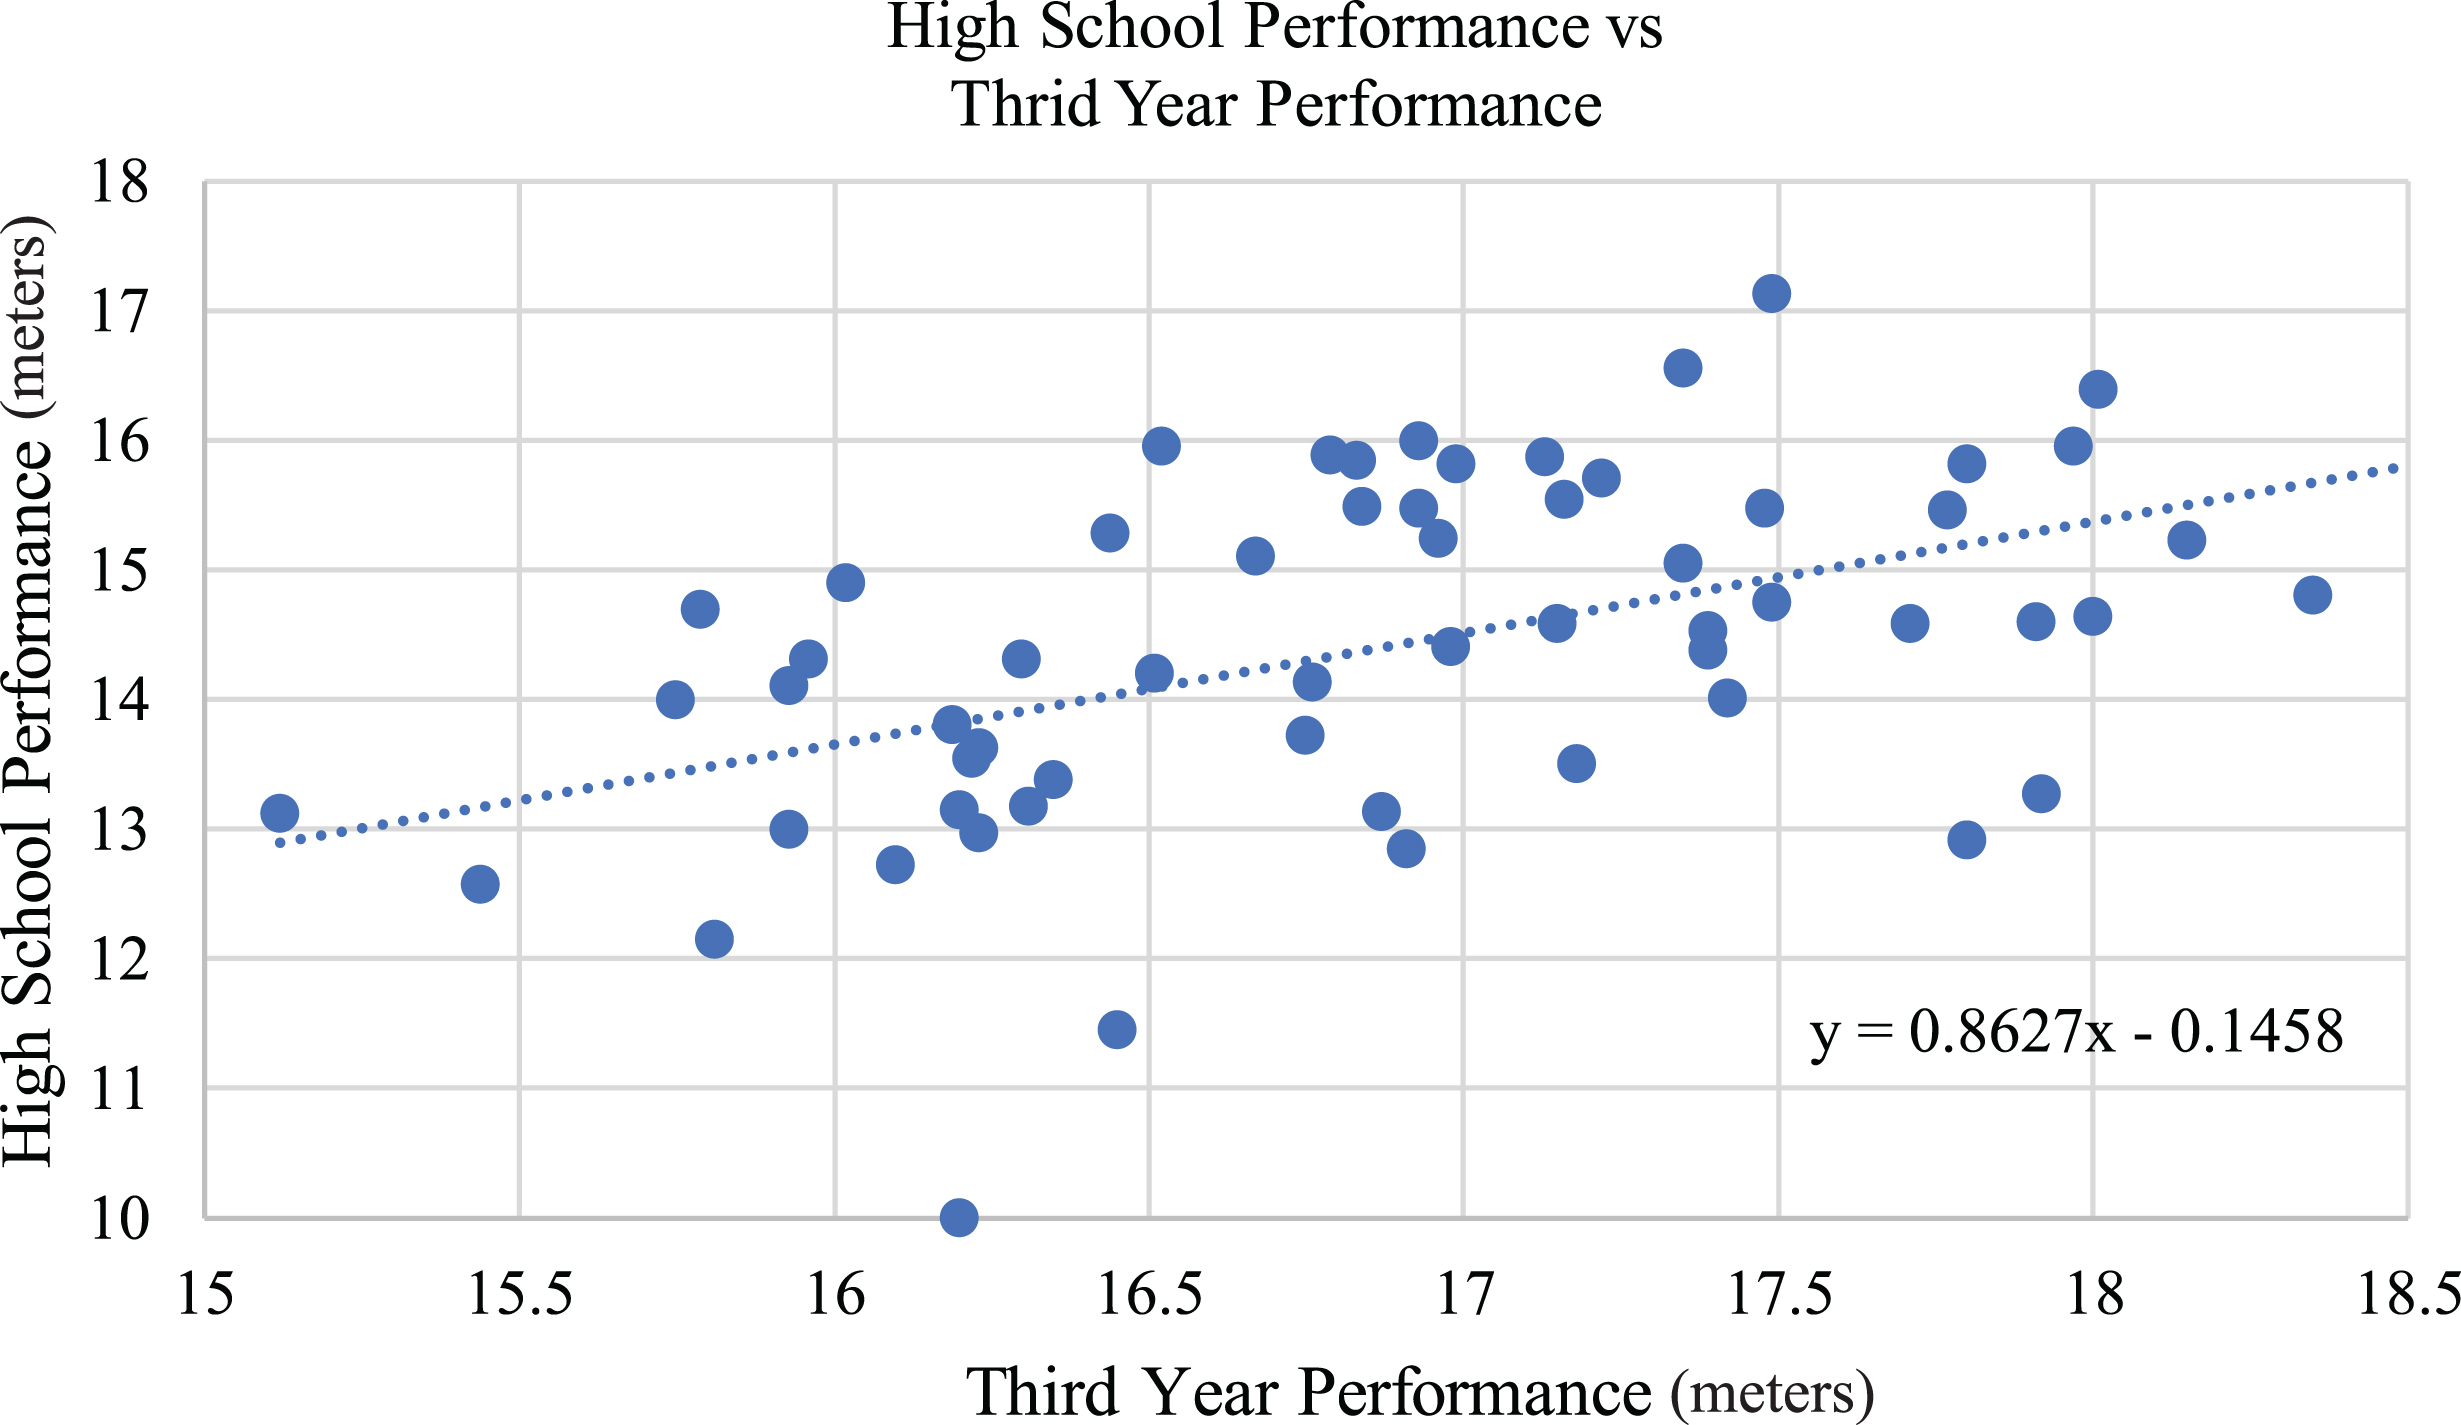
Fig. 4
Trend lines for fourth year collegiate performance based on high school personal best.
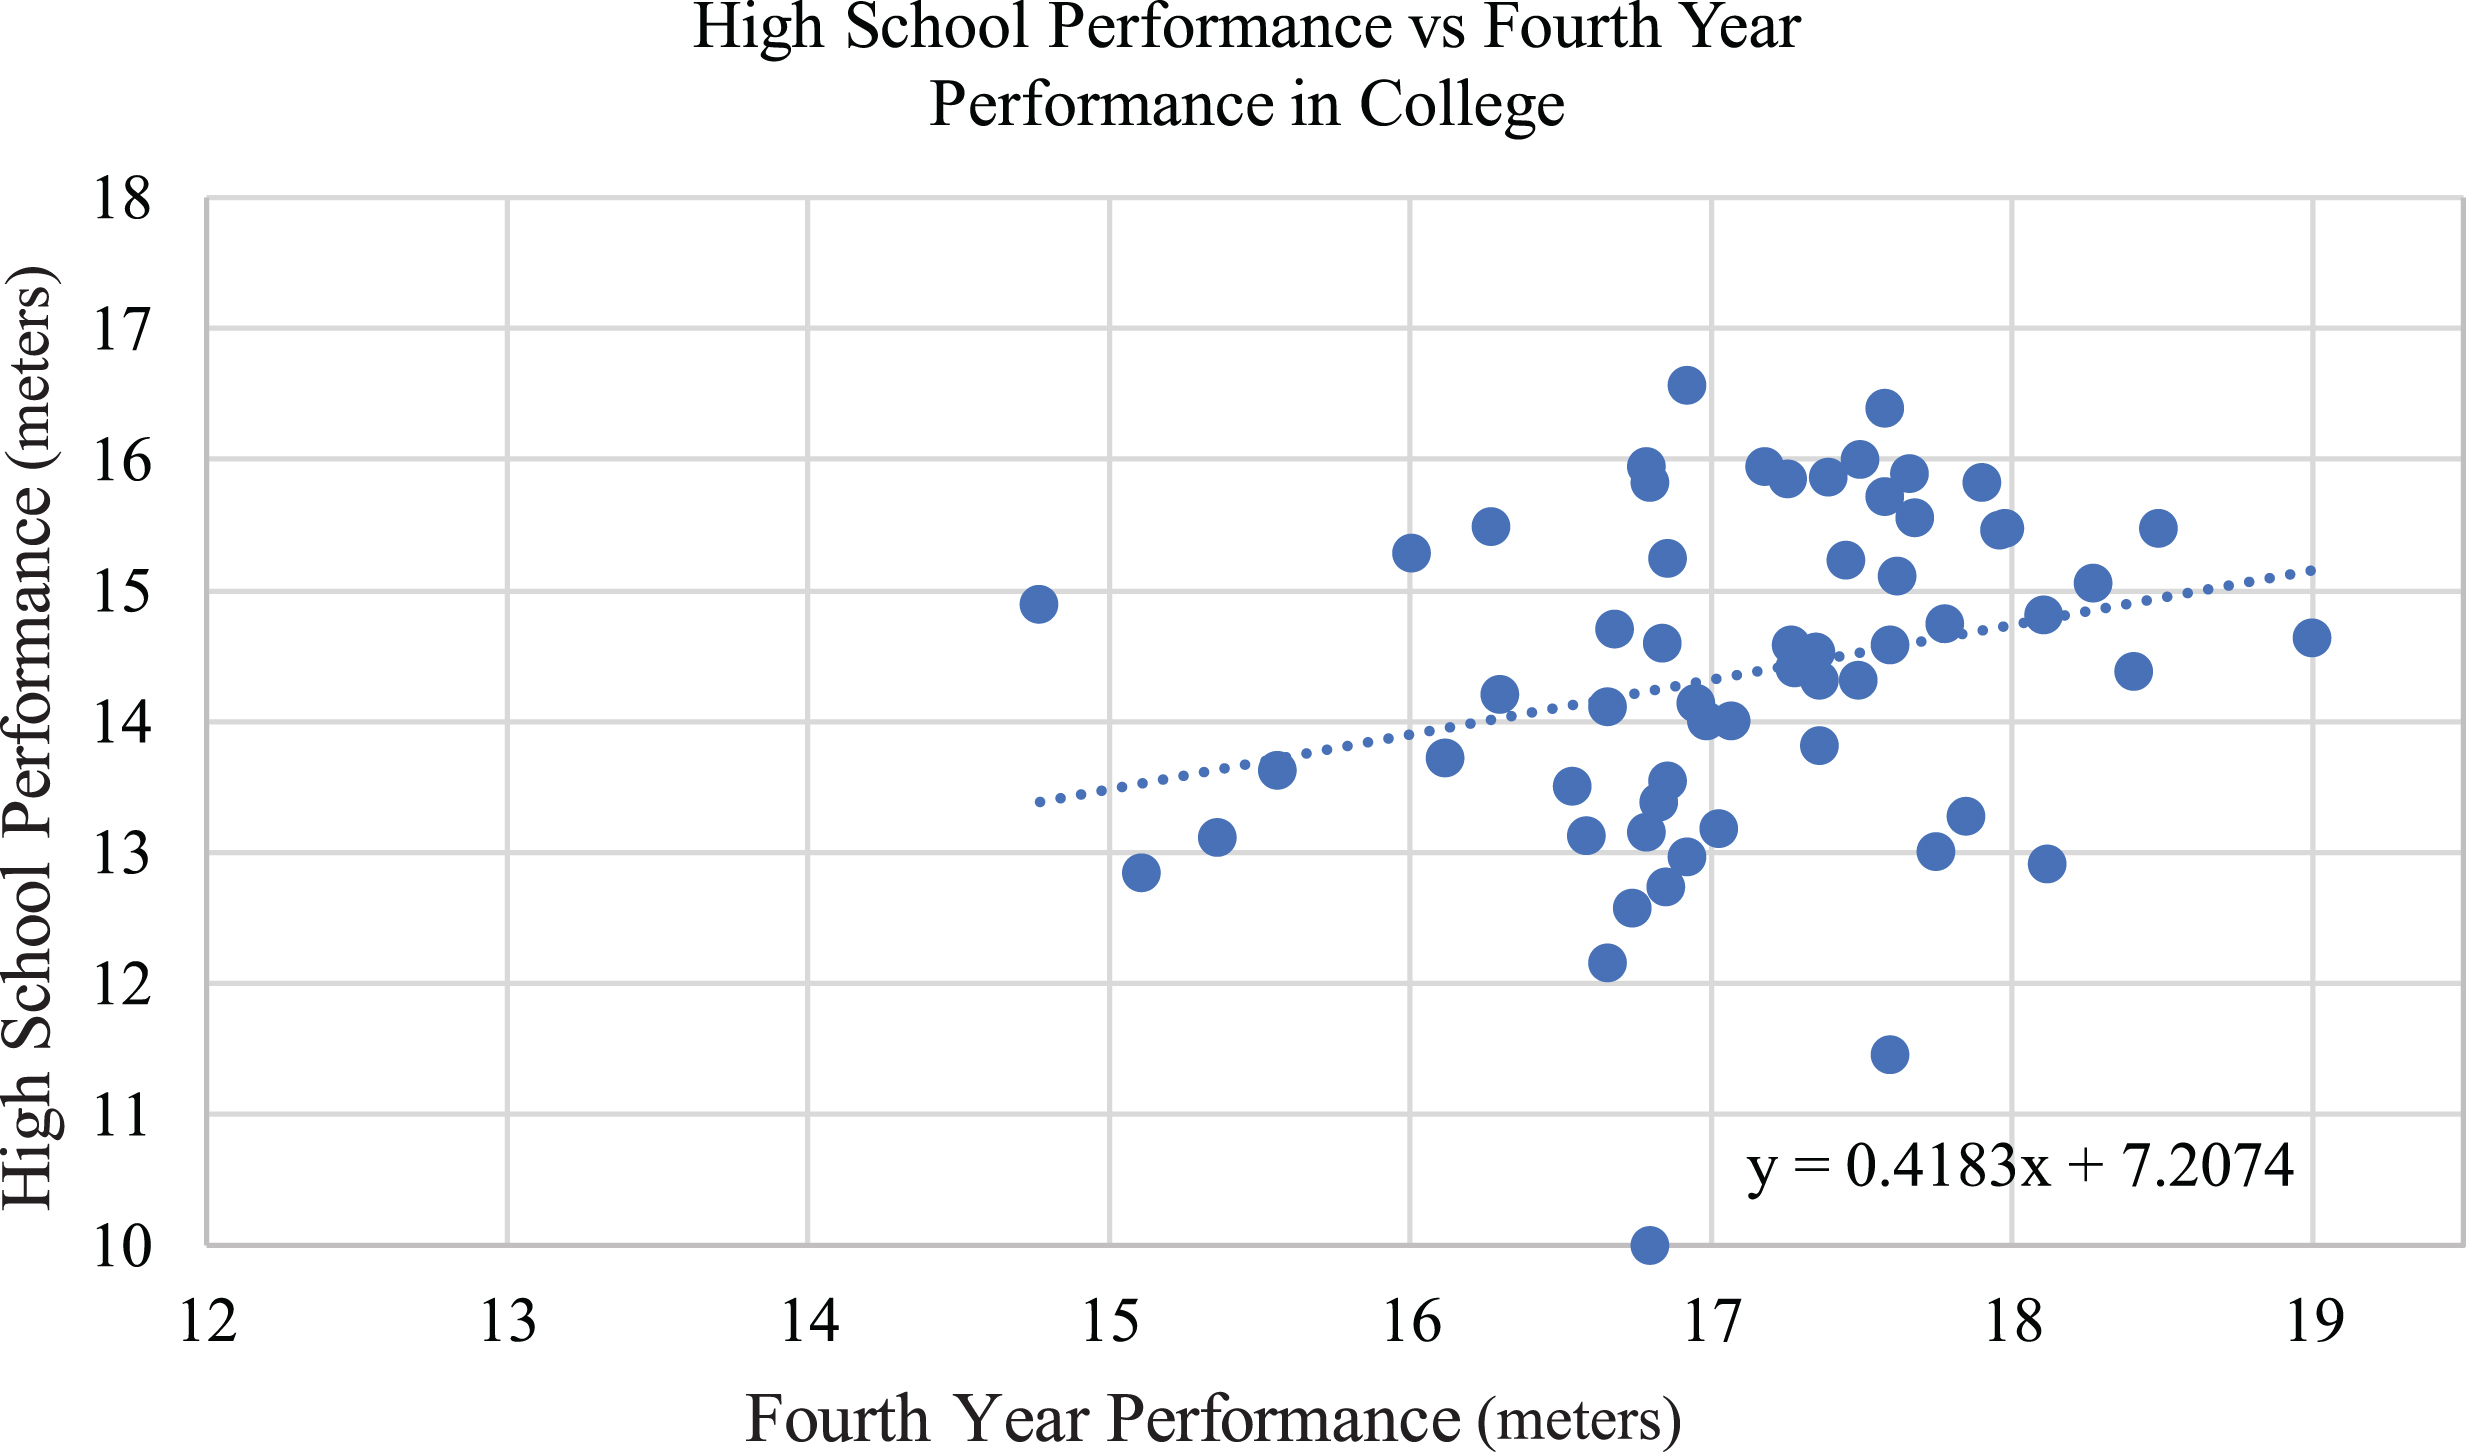
Fig. 5
Trend lines for fifth year collegiate performance based on high school personal best.
Once the slopes for each trend line were determined, the minimum high school performances were able to be calculated to produce a result that could score for each place at the NCAA meet for a given amount of time in the NCAA Division I track and field system. This was done by first calculating the average distance for places 1–8 at the NCAA Championships for the years 2012–2017 (see Tables 1 and 2). The value of x was then determined for each scoring place at both indoor and outdoor NCAA meets for each of the seasons. Values for x listed in Tables 1 and 2 for each of the eight scoring places were plugged into the equation for the slope of a given competitive year to generate the minimum high school performance (y) necessary to have a statistically significant chance of scoring in that particular scoring place at the NCAA Championship meet. Calculations were conducted for all eight scoring places in each of the five years of potential competition for both the NCAA Indoor and Outdoor Championships. Results for the minimum high school performance (y), were put in a table format to easily compare the projected performances needed to score a certain place within a certain number of seasons of competition/training. Finally, the average eligibility year for the eight scoring places was calculated for each season between the years 2012 through 2017 (see Tables 1 and 2).
Table 1.
Average distance (in meters) for seasons 2012–2017 for each place at the NCAA Outdoor Championships for women’s shot put
| Year | 1st | 2nd | 3rd | 4th | 5th | 6th | 7th | 8th | Avg. Year |
| 2017 | 19.15 | 17.92 | 17.49 | 17.47 | 17.42 | 17.40 | 17.28 | 17.22 | 3.625 |
| 2016 | 19.33 | 17.99 | 17.88 | 17.65 | 17.49 | 17.48 | 17.01 | 16.91 | 3.625 |
| 2015 | 18.35 | 17.96 | 17.83 | 17.64 | 17.22 | 17.14 | 17.07 | 16.79 | 3.625 |
| 2014 | 17.73 | 17.48 | 17.47 | 17.27 | 17.26 | 17.20 | 17.07 | 16.79 | 3.625 |
| 2013 | 18.91 | 17.85 | 17.30 | 17.24 | 17.15 | 17.04 | 16.86 | 16.83 | 3.875 |
| 2012 | 18.44 | 17.80 | 17.67 | 17.36 | 17.35 | 17.31 | 17.21 | 17.14 | 2.875 |
| Average | 18.65 | 17.83 | 17.60 | 17.43 | 17.31 | 17.26 | 17.08 | 16.94 | 3.54 |
Table 2.
Average distance (in meters) for seasons 2012–2017 for each place at the NCAA Indoor Championships for women’s shot put
| Year | 1st | 2nd | 3rd | 4th | 5th | 6th | 7th | 8th | Avg. Year |
| 2017 | 19.56 | 18.40 | 17.78 | 17.57 | 17.55 | 17.40 | 17.34 | 17.23 | 3.625 |
| 2016 | 17.97 | 17.68 | 17.66 | 17.63 | 17.60 | 17.48 | 17.22 | 17.04 | 4.25 |
| 2015 | 18.62 | 18.47 | 17.40 | 17.25 | 17.25 | 17.14 | 17.19 | 17.14 | 3.25 |
| 2014 | 18.15 | 17.89 | 17.30 | 17.27 | 16.97 | 17.20 | 16.82 | 16.73 | 4.0 |
| 2013 | 19.22 | 17.69 | 17.52 | 17.45 | 17.20 | 17.04 | 17.03 | 16.99 | 3.875 |
| 2012 | 19.00 | 17.97 | 17.68 | 17.42 | 17.15 | 17.31 | 16.59 | 16.33 | 3.5 |
| Average | 18.75 | 18.01 | 17.55 | 17.43 | 17.31 | 17.28 | 17.03 | 16.91 | 3.75 |
3Results
High school and collegiate shot put performances for 63 of the top women’s shot putters at the NCAA Division I level were entered onto a series of scatterplot graphs which produced linear trend lines revealing a significant correlation between high school performance and collegiate performance at all levels of eligibility where α was set at p < 0.05 (see Figs. 1–5). Results were summarized in Table 3 showing a strong correlation between high school and collegiate performance for the first three years of eligibility. The correlation progressively decreased with each year of collegiate competition, in which statistical significance was achieved at p < 0.0001 for the first three years. Years four and five of collegiate eligibility demonstrated a diminished statistical significance at p < 0.05.
The average distance for each place at the NCAA Championships was plugged into each equation for each of the five years of collegiate eligibility. The performance tables generated from this data are presented as Tables 4 and 5. These tables indicate a minimum high school performance required to have a chance to throw the distance necessary to place at a given level at the NCAA meet for each of the five potential years of collegiate eligibility. For example, the data from Table 4 indicates that the minimum high school performance needed to for an incoming freshman to project to be an eighth-place scorer at the NCAA Outdoor Championship meet in their first year of college would be 15.70 m. The same thrower would project out to have the potential to throw a distance capable of scoring second place at the NCAA Outdoor Championship in their second year of college. The average eligibility year for all scoring places was calculated for each year and found to be 3.75 for Indoor Championship scorers and 3.54 for Outdoor Championship scorers (see Tables 1 and 2).
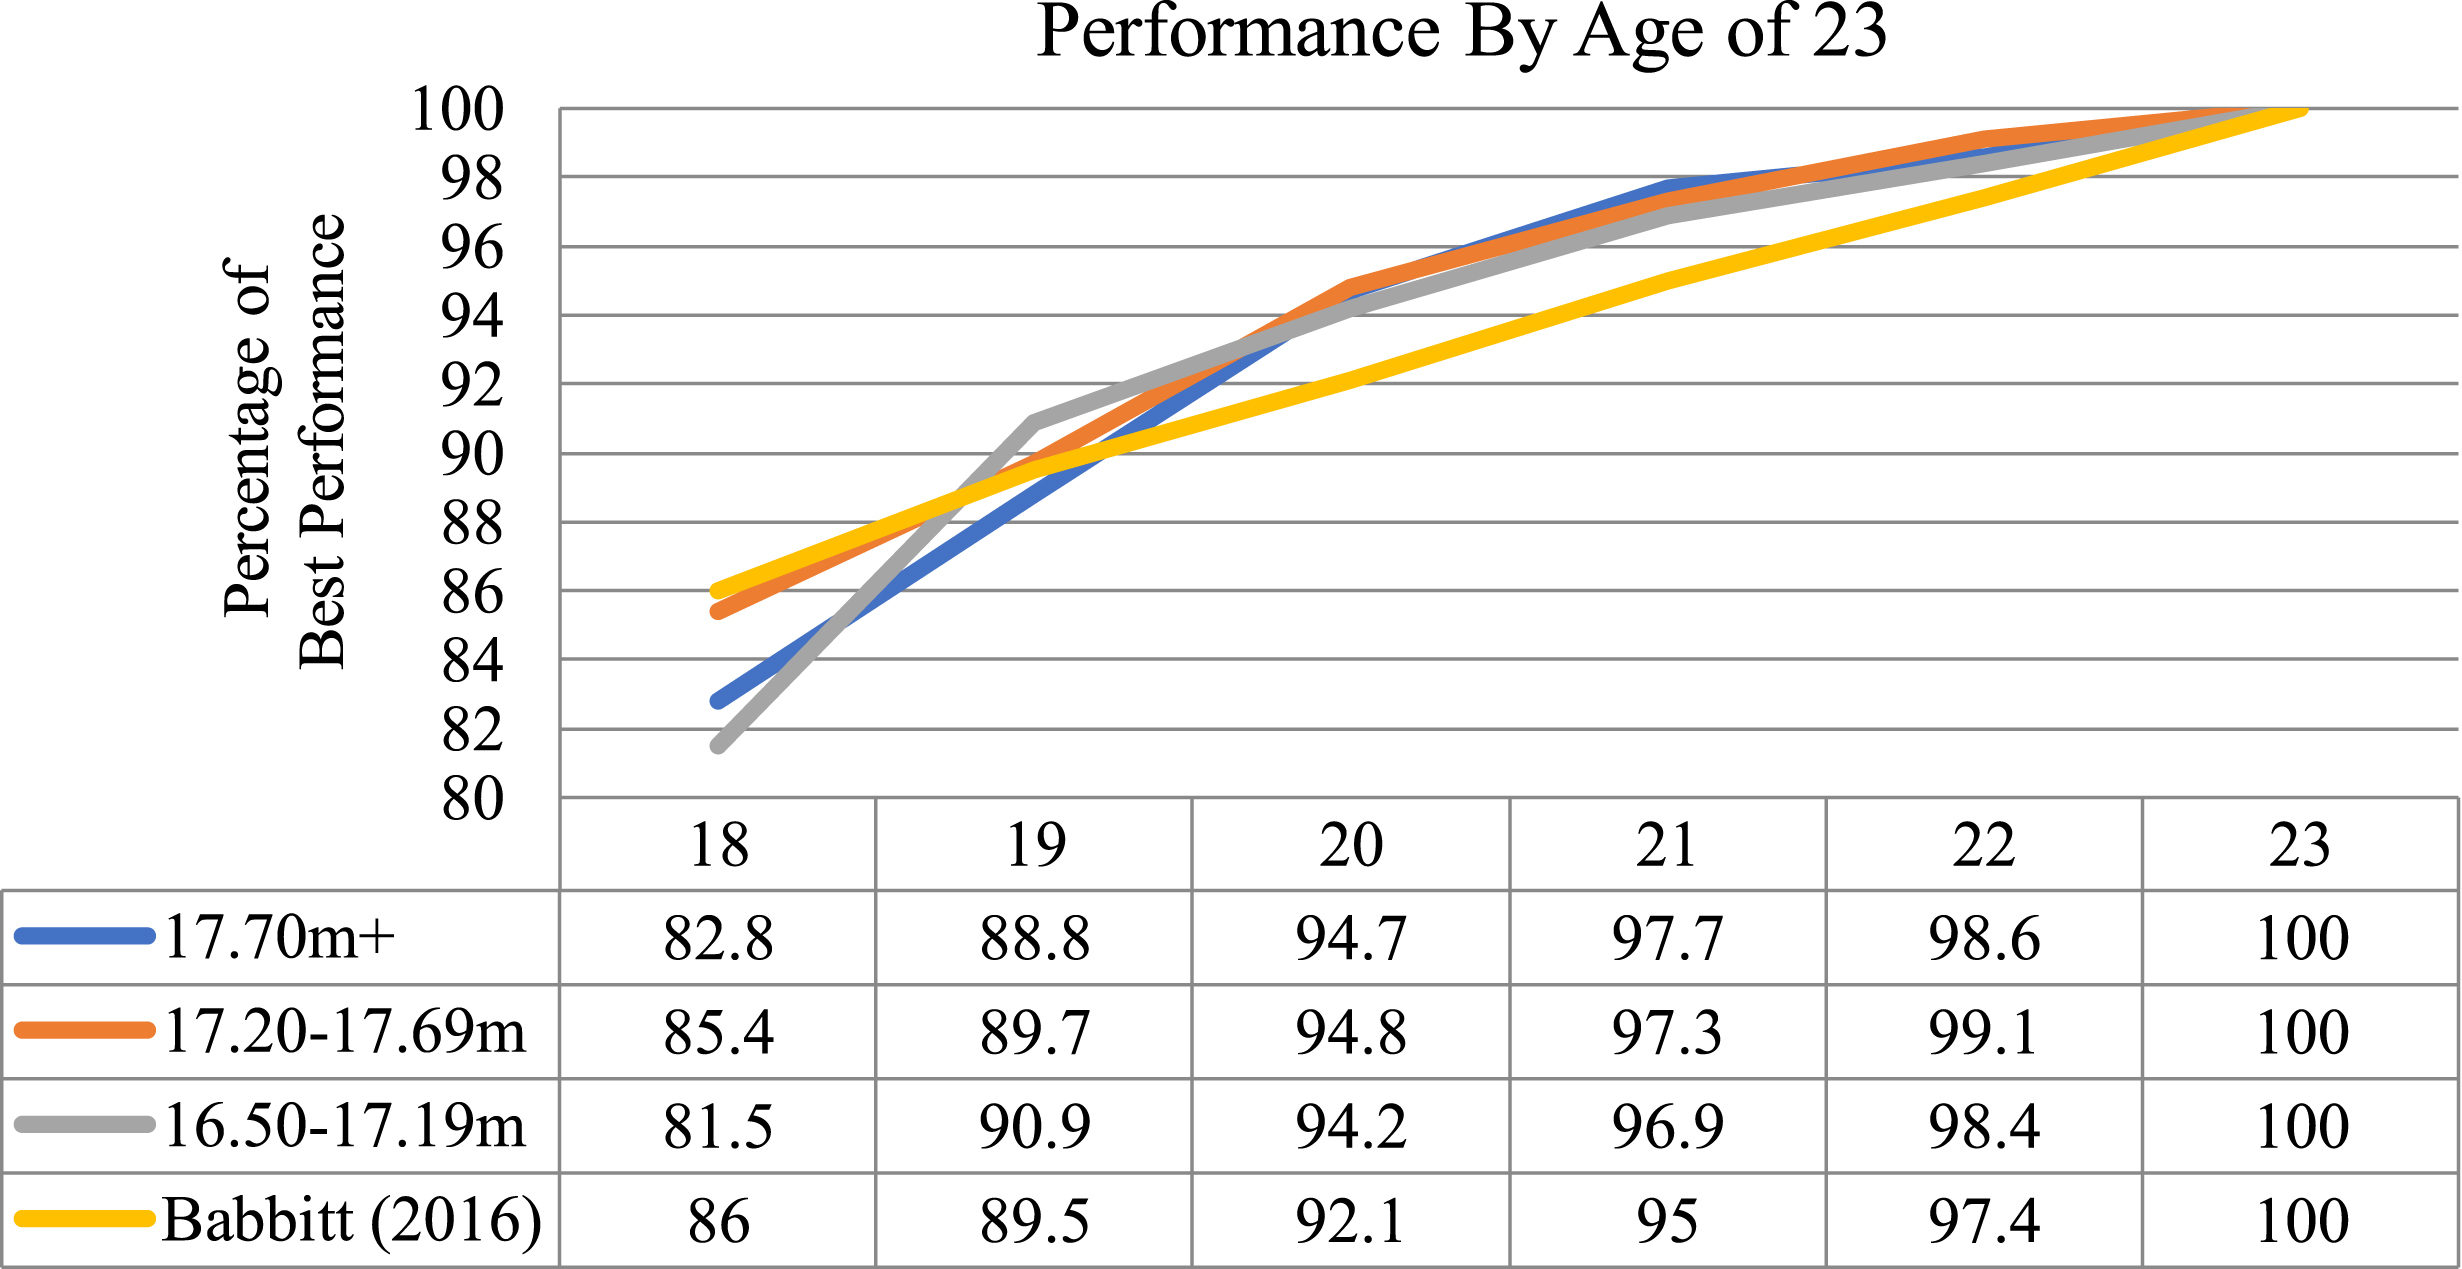
A final evaluation of the data was carried out to compare the rate of development for three subgroups of the female collegiate shot putters pool of 63, relative to the developmental rates seen for the top female shot putters of all time during this age period (18–23 years of age) as established in a study by Babbitt (2016). This comparison was carried out to see if all subgroups at the age level developed in a similar nature or if there were visible differences. Seasonal best performances for each year between the ages of 18 to 23 were averaged and then measured as a percentage of the result the throwers would eventually be able to perform at age 23 (see Fig. 6). Results from Fig. 6 show that all three subgroups which make up the total NCAA female shot putters pool improved between anywhere from one and a half to three times the rate of the top group from the study by Babbitt (2016) in their first year of college (age 19). The NCAA female shot putters rate of improvement continued to be greater than the world elite throwers for year two, going from age 19 to 20. The developmental rates were comparable between the ages of 20 to 22, before switching to a negative relationship where the elite group developed between one and a half to three times faster than the NCAA female shot putting subgroups. This result clearly suggests that the NCAA female shot putters develop at a considerably faster rate than that of elite shot putters from the ages of 18 to 20.
Table 3
A summary of the number of subjects, correlation coefficient, level of significance, and slope of trend line (where y = high school performance, and x = collegiate performance for that given year) for each year of collegiate eligibility
| N | r | p | Slope | |
| High School to 1st year | 62 | 0.682 | p < 0.0001 | y = 0.9251(x) + 0.0351 |
| High School to 2nd year | 62 | 0.5261 | p < 0.00001 | y = 0.7245(x) + 2.5233 |
| High School to 3rd year | 63 | 0.5161 | p < 0.00001 | y = 0.8627(x) –0.1458 |
| High School to 4th year | 61 | 0.2574 | p < 0.045 | y = 0.4183(x) + 7.2074 |
| High School to 5th year | 27 | 0.3797 | p < 0.050 | y = 0.6873(x) + 2.5269 |
Table 4.
Minimum high school performance (in meters) projected to throw the Outdoor NCAA scoring place performance for a given year
| Year | 8th place | 7th place | 6th place | 5th place | 4th place | 3rd place | 2nd place | 1st place |
| 1st year | 15.70 | 15.83 | 16.00 | 16.04 | 16.16 | 16.31 | 16.52 | 17.28 |
| 2nd year | 14.79 | 14.89 | 15.02 | 15.06 | 15.15 | 15.27 | 15.44 | 16.03 |
| 3rd year | 14.47 | 14.59 | 14.74 | 14.79 | 14.89 | 15.04 | 15.24 | 15.94 |
| 4th year | 14.29 | 14.35 | 14.42 | 14.44 | 14.49 | 14.56 | 14.66 | 15.00 |
| 5th year | 14.16 | 14.26 | 14.38 | 14.42 | 14.50 | 14.61 | 14.77 | 15.34 |
Table 5.
Minimum high school performance (in meters) projected to throw the Indoor NCAA scoring place performance for a given year
| Year | 8th place | 7th place | 6th place | 5th place | 4th place | 3rd place | 2nd place | 1st place |
| 1st year | 15.67 | 15.78 | 15.91 | 16.02 | 16.16 | 16.27 | 16.70 | 17.38 |
| 2nd year | 14.77 | 14.85 | 14.95 | 15.04 | 15.15 | 15.23 | 15.57 | 16.10 |
| 3rd year | 14.44 | 14.54 | 14.66 | 14.76 | 14.89 | 14.99 | 15.39 | 16.03 |
| 4th year | 14.27 | 14.32 | 14.38 | 14.43 | 14.49 | 14.54 | 14.73 | 15.04 |
| 5th year | 14.14 | 14.22 | 14.31 | 14.39 | 14.50 | 14.58 | 14.90 | 15.41 |
Fig. 6.
The rate of performance development for three subgroups of female NCAA shot putters with had personal best of 17.70m+, 17.20m–17.69 m, and 16.50m–17.19 m while in college are compared with the developmental rates of the 24 best female shot putters of all-time, expressed as a percentage of their best performance at the age of 23.
4Conclusions
The ultimate goal of the study was to develop an analytic to help predict the time it would take a female shot putter to be capable of producing a result to be an NCAA Championship scorer based on her personal best high school performance. The final form of this analytic took shape in the projection tables appearing in Tables 4 and 5. In addition, the analytic forecasted the rate of development throughout a female shot putters collegiate career at the NCAA Division I level based on her high school performance, and estimated how many years it would take before an athlete would have the potential to contribute a score at the NCAA Division I Championship meet. Data from Tables 1 and 2 clearly establish it takes nearly four years in the collegiate system (3.75 years for indoor, and 3.54 years for outdoor) for a female shot putter have the capability to score at the NCAA Division I Championship meet.
These findings are in line with the premise that the majority of incoming freshman shot putters are not well prepared to score right away at the NCAA Championships, and would need at least three years to develop NCAA Division I scoring potential. This is typically not the case in other power-based events such as sprints, relays, or jumps who may be able to score as freshman. The most likely variable slowing the development of female throwing athletes is that many of the top young female shot putters often participate in other event areas in addition to the throws while in the US high school system. Moreover, many also participate in additional sports while in high school, such as basketball, soccer, volleyball, or softball. This circumstance does not allow for much emphasis on specific throws training or development which relies on a variety of forms of power training (Stone et al., 2004).
Power training methods for the throws are generally centered around classical weight lifting, which is built around the power and Olympic lifts (Poprawski, 1988), along with various forms of running, jumping, special strength exercises, and plyometric routines and circuits (Pavlovic, Brankovic, & Zivkovic, 2012; Judge et al., 2013; Judge & Bellar, 2012; Terzis, Spengos, Karampatsos, Manta, & Georgiadis, 2009; Karampatsos, Korfiatis, Zara, Georgiadis, & Terzis, 2017; Zaras et al., 2013). The inability of the majority of throwing athletes in the United States to participate in a comprehensive year-round system of throws training until they matriculate into the collegiate system, delays exposure to high-level training methods until they are nearly 20 years of age. The scarcity of early throws specialization, therefore, produces a situation where it is extremely rare for a female high school shot putter to produce a performance even close to one that would be at a scoring level at the NCAA Championship meet, thus underscoring the cause for the previously mentioned gap between high school and NCAA Championship performance.
One serendipitous finding was revealed from this study that may help explain the reason for this large gap. It is that female shot putters do improve quite rapidly once they are in the collegiate system relative to sports elite performers of the same age. Evidence of this steep ‘learning curve’ is provided in the results from Fig. 6 showing that all three subgroups, making up the total NCAA female shot putters pool, improved at 1.5 to three times the rate of the elite group of the same age (19), in their first year of college. The NCAA Division I female shot putters rate of improvement continued to be greater than the world elite throwers for their second year in the university system as well. It was not until the third and fourth years in the collegiate system that the developmental rates became comparable with their elite cohorts between the ages of 20 to 22, before switching to a negative relationship at age 23 (fifth year) where the elite group developed between one and a half to three times faster than the NCAA female shot putting subgroups. These findings suggest the appearance of an ‘accelerated’ development zone during the first two years in the collegiate system. This ‘surge’ in performance is likely due to benefits of transitioning from a ‘part-time’ training setting in high school, to a highly focused year round training and competition environment in the collegiate system. Over time, however, it does appear that the accelerated development effects from this transition appear to wear off after four years in the collegiate system.
In terms of practical function, the projection tables (see Tables 4 and 5) created from this studies analysis are designed to be the initial step in making a forecast from high school or pre-collegiate results to allow for coaches to set up the best strategy for the throwers collegiate career. In terms of precision, these projections potentially provide an accurate prognostication for the majority of incoming collegiate shot putters who have sports specific training ages of three to four years. Sport specific training is defined as the numbers of years that an athlete has specialized in one particular sport, whereas training age is defined as the number of years an individual has trained or participated in various sports (Balyi, Way, & Higgs, 2013). There are, however, conceivable shortcomings in that these projections may tend to underestimate the future performance of throwers who have limited exposure to training and competition before entering college. These groups would have a sport specific training age of 1–2 years, or a training age of 2–3 years. Furthermore, future throwing performance could also be overestimated for female shot putters who have had many years of high quality year-round training, and competition experience, with sport specific training ages of 4–6 years upon entering the collegiate system.
An additional limitation of the projection tables to be considered is that the performance projections only predict the potential of a given throwing result during the competitive year. They do not guarantee that the result will necessarily happen at the championship meet and only submit that the individual would have the ability to produce the result if they perform well and the conditions are good. It should also be noted that there are both physical and psychological factors that can influence a shot putters projected performance, in addition to personal best results and training age. Anthropomorphic factors such a height, weight, and arm-span can also play large rolls in individual performance development (Young & Li, 2005), where larger and stronger individuals are considered better prospects for long term development in the shot put when all other variables are held equal (Judge, 2013). From a psychological perspective, most athletes entering the collegiate system are between the ages of 17–19, and are subjected to a wide variety of new life changing variables, while at the same time, developing rapidly at their given sport. Factors, such as being away from home for the first time, a new and often more challenging academic regimen, and exposure to new training methods and better competition, can have both positive and negative effects on all aspects of a student-athlete’s life, thus making their progress extremely unpredictable. While it is often difficult to predict future performance when taking into account the multitude of outside variables, this studies aim was to provide the first step in developing a model to forecast collegiate women’s shot put development based on performance trends gathered from a large sample of female shot put performers who have excelled in the NCAA Division I system within the past six years. Further refinement of the projection model can be accomplished by taking into account a broader survey of these variables, and may be necessary to produce a more sophisticated and accurate prediction model of throwing performance.
References
1 | Arndt, C. & Brefeld, U. , (2016) , Predicting the future performance of soccer players, Journal of Statistical Analysis and Data Mining, 9: (5), 373–382. |
2 | Babbitt, D. , Chang, M.H. , Lin, C.Y. & Cheng, S.C. , (2012) , Rotational shot put development: Ming-Huang Chang (2011 season), Sports Coaching Science, 26: , 65–84. |
3 | Babbitt, D. , (2016) , Development rates, a comparison for elite performers in the throwing events, Techniques, 10: (2), 34–40. |
4 | Balyi, I. , Way, R. & Higgs, C. , (2013) , Long Term Athlete Development, Champaign, IL., Human Kinetics. |
5 | Bergman, S. & Logan, T. , (2016) , The effect of recruit quality on college football team performance, Journal of Sports Economics, 17: (6), 578–600. |
6 | Gonaus, C. & Muller, E. , (2012) , Using physiological data to predict future career progressions in 14 to 17 year old Austrian soccer academy players, Journal of Sports Science, 30: , 1673–1682. |
7 | Grycmann, P. , Maszczyk, A. , Socha, A. , Golas, A. , Wilk, M. , Zajac, T. & Pzednowek, K. , (2015) , Modelling analysis and prediction of women javelin throw results in the years 1946-2013, Biology of Sport, 32: (4), 345–350. |
8 | Heazlewood, T. , (2006) , Prediction versus reality; the use of mathematical models to predict elite performance in swimming and athletics at the Olympic games, Journal of Sports Science & Medicine, 5: (4), 480–487. |
9 | Jensen, S. & Mulholland, J. , (2014) , Predicting the draft career success of tight ends in the national football league, Journal of Quantitative Analysis in Sports, 10: (4), 381–396. |
10 | Judge, L. , (2013) , The complete track and field coaches’ guide to conditioning for the throwing events, Monterey, CA., Coaches Choice. |
11 | Judge, L.W. , Young, M. & Wanless, E. , (2011) , Using sports science and training theory to Develop elite performance: A case study of a 2005 world championship finalist in the women’s shot put, International Journal of Sports Science and Coaching, 6: (3), 365–385. |
12 | Judge, L. & Bellar, D. , (2012) , Variables associated with the personal best performance in the glide and spin shot put for U.S. collegiate throwers, International Journal of Performance Analysis in Sport, 12: (1), 37–51. |
13 | Judge, L. , Bellar, D. , Thrasher, A. , Simon, L. , Hindawi, O. & Wan-less, E. , (2013) , A pilot study exploring the quadratic nature of the relationship of strength to performance among shot putters, International Journal of Exercise Science, 6: (2), 171–179. |
14 | Karampatsos, G. , Korfiatis, P. , Zara, N. , Georgiadis, G. & Terzis, G. , (2017) , Acute effect of countermovement jumping on throwing performance in track and field athletes during competition, Journal of Strength and Conditioning Research, 31: (2), 359–364. |
15 | Kuper, G. & Sterken, E. , (2003) , Endurance in speed skating; the development of world records, European Journal of Operational Research, 148: (2), 293–301. |
16 | McLaughlin, J. , Howley, E. , Bassett, D. , Thompson, D. & Fitzhugh, E. , (2010) , Test of the classic model for predicting endurance running performance, Medicine and Science in Sport and Exercise, 42: (5), 991–997. |
17 | Nassib, S , Mkaouer, B. , Riahi, S. , Wali, S. & Nassib, S. (2017) , Prediction of gymnastics physical profile through an international program evaluation in women artistic gymnastics, Journal of Strength and Conditioning Research, 10.1519/JSC.0000000000001902 |
18 | Pavlovic, R. , Brankovic, N. & Zivkovic. , (2012) , Poweras afactorof successful results in shot put, Research in Kinesiology, 40: (2), 141–146. |
19 | Pilianidis, T. , Mantzouranis, N. , Kyriakoulakis, T. , Proios, M. & Kotzamanidis, C. (2012) , Longitudinal evaluation and prediction of performance in throwing events in Mediterranean games, Physical Training, December 2012. |
20 | Poprawski, B. , (1988) , Aspects of strength, power and speed in shot put training, New Studies in Athletics, 1: (1), 89–93. |
21 | Przednowek, K. , Iskra, J. & Przednowek, K. (2014) , Predictive modelling in 400-metres hurdles races, Proceedings of the 2nd International Congress on Sport Sciences Research and Technology Support, 137–144. |
22 | Radicchi, F. , (2012) , Universality, limits, and predictability of gold-medal performance at the Olympic games, PLoS One, 7: (7), e40335. |
23 | Rocznoik, R. , Maszczyk, A. , Stanula, A. , Czuba, M. , Pietraszewski, P. , Kantyka, J. & Starzynski, M. , (2013) , Physiological and physical profiles and on-ice performance approach to predict talent and male youth ice hockey players during draft to hockey team, Isokinetics and Exercise Science, 21: (2), 121–127. |
24 | Rudman, G. , (2007) , Development of throwers. In: The Throws, Contemporary Theory, Technique, and Training, Thompson G. ed. Mountain View, CA., Tafnews Press, 12–15. |
25 | Stanula, A. , Maszczyk, A. , Rocznoik, R. , Pietraszewski, P. , Ostrowski, A. , Zajac, A. & Strzala, M. (2012) , The development and prediction of athletic performance in freestyle swimming, Journal of Human Kinetics, 32: , 97–107. |
26 | Stone, M. , Sanborn, K. , O’Bryant, H. , Hartman, M. , Stone, M. , Proulx, C. , Ward, B. & Hruby, J. (2004) , Maximum strength-power-performance relationships in collegiate throwers, Journal of Strength and Conditioning Research, 17: (4), 739–745. |
27 | Stratton, E. , O’Brien, B.J. , Harvey, J. , Blitvich, J. , McNicol, A.J. , Janissen, D. , Paton, C. & Knez, W. (2009) , Treadmill velocity best predicts 5000 meter run performance, International Journal of Sports Medicine, 30: (1), 40–45. |
28 | Terzis, G. , Spengos, K. , Karampatsos, G. , Manta, P. & Georgiadis, G. (2009) , Acute effect of drop jumping on throwing performance, Journal of Strength and Conditioning Research, 23: (9), 2592–2597. |
29 | Tilinger, P. , Kovar, K. & Hlavata, P. , (2005) , A study on the dynamic progress of performances of prominent world-class athletes in selected track and field events, Kinesiology, 37: (1), 92–98. |
30 | Young, M. & Li, L. , (2005) , Determination of critical parameters among elite female shot putters, Sports Biomechanics, 4: (2), 131–148. |
31 | Zaras, N. , Spengos, K. , Methenitis, S. , Papadopoulos, C. , Karampatsos, G. , Georgiadis, G. , Stasinaki, A. , Manta, P. & Terzis, G. , (2013) . Effects of strength vs. ballistic-power training on throwing performance, Journal of Sports Science and Medicine, 12: (1), 130–137. |


