
Data analytics in performance of kick-out distribution and effectiveness in senior championship football in Ireland
Abstract
In recent years, data analytics has been a growing phenomenon in many fields, including sport, and there has been an increased focus on how technology will impact the work of coaching and performance professionals. This paper provides a reflection of the use of data analytics within the Gaelic Athletic Association’s (GAA) football coaching practice in Ireland, and evaluates for coaches how to enhance kick-out distribution and effectiveness. Specifically, the study aimed to dissect and analyse kick-out strategies to assess from a coaching perspective, the impact on distribution and effectiveness. The research is a result of the modern day professional approach taken by most GAA Inter County teams, and intends to fill the research gap of performance analysis within the context of Gaelic Football. Video analysis of eight Men’s Inter-County Ulster Senior Gaelic Football Championship matches was completed using video analysis software. The key parameter of investigation was kick-outs, with distance and direction being the variables specifically analysed. Three factors were established to measure kick-out effectiveness: retaining possession, attack building, and score/scoring opportunity. A questionnaire was devised for data collection with 75 players and 25 coaches to gather opinions and add further depth to the statistical evidence. Kick-outs to the wings (57.6%) and 65m+ (53.8%) were the most common distribution strategy employed by goalkeepers. Kick-outs to 21–45 m produced notably greater success rates of possession retention (87%) and attack building (55%) than the longer kick-outs. Kick-outs to the wings contributed an 8% greater success rate of creating scoring opportunities as opposed to central kick-outs. Kick-outs to the centre were the only parameter to result in a negative net difference of scores between both teams (–1%). It was established that kick-outs can be successful attacking elements when used efficiently. Short kick-outs to the wings appear to be the most effective strategy to improve the likelihood of possession retention, attack building and creation of scoring opportunities. An implication of this study for sports science is to make data analytics more accessible to GAA coaches, and address the challenges faced by coaches in this area by translating knowledge of performance analysis of kick-outs into working practice on the field.
1Introduction
Today more than ever, it is important to address connections between data analytics, sports science and coaching, and this research study was designed to help build on the relationship between research and coaching practice in Gaelic football. Coaches consider aspects of sports science when preparing athletes and players for competition; a fundamental purpose of such sports science research is to produce knowledge that helps improve player performance. There is a need for more research in gaelic games, and this paper offers an account of Kickouts in the Ulster Championship at the time of the study; although conducted in 2010, this paper can be a useful benchmark as a comparison to modern day research.
Within Gaelic games, undoubtedly sports scientists and coaches can learn from each other; it is important that this develops as the processes involved in sports coaching are explored from a scientific perspective and coaches can use this knowledge to assist players to acquire skills by training and playing effectively, thereby enhancing their performance. Gaelic games are the only mass spectator sports that remain amateur (Moran, 2001); yet despite being as amenable to scientific research as other major sports, research into Gaelic games has significantly faltered behind that of other field games (Reilly and Collins, 2008). Gaelic football in particular, in this new millennium is embracing modern sporting techniques to better support the players and the management function. As a result, this research study is timely as it investigates the distribution, effectiveness and role that kick-outs play in modern Gaelic football. Kick-outs are a key element of Gaelic football as it is a passage of play when the goalkeeper is in total control of the ball and under no pressure from the opposition. According to the previous event, i.e. a score or a ‘wide’ (See Appendix 1 for Glossary of Key Terms), the completion time and kick-out direction can make kick-outs become influential, strategic plays. For example, to develop momentum and maintain pressure, kick-outs may be taken very quickly and short (i.e. 21–45 m). Conversely, to help the team compose themselves or sustain contained pressure, a kick-out completion time may be slowed down.
Science support programmes are increasingly being adopted by Gaelic Inter-County teams, whilst Irish academic institutions are developing research primarily devoted to Gaelic games (Reilly and Doran, 2001). However this growth in interest in research has been until now confined to quite a narrow domain. Previous studies in Gaelic football have been based on anthropometry (Keane et al., 1997; Reilly et al., 2000), rule changes (Doggart et al., 1993) and work-rate (McErlean et al., 1998). In order to establish the potential of performance analysis in Gaelic football, attention must be given to research in other football codes (Douge, 1988). In relation to Australian Rules Football, Appleby and Dawson (2002) studied the style and success of kick-ins and found that on average, 57% of kick-ins successfully reached their intended target. Although kick-ins are strategic kicks from the goal area, because the kick is from the hands and not from a set goalkeeper, unlike in Gaelic football, one is unable to accurately compare or contrast the positions, despite Australian Rules being the sport most comparable to Gaelic football.
Gaelic football lacks published findings such as that produced by Appleby and Dawson (2002); however several significant, unpublished research studies do exist. The potential of performance analysis in Gaelic was highlighted by McGuigan (2006) and Carolan (2005) who researched scoring and key performance parameters in Gaelic football respectively. From his study in 2006, McGuigan established that winning the midfield battle, and playing a short passing game will improve chances of victory. The study provided a thorough analysis of several factors (such as scores, free-kicks, and turnovers) and remains a standard bearer for future performance analysis research in Gaelic football. Carolan (2005) interestingly found that only 50% on kick-outs were retained. This would appear to be an unexpectedly low rate given that the goalkeeper is under no pressure from opponents during kick-outs. While these Kick-out Distribution and Effectiveness developments are welcome, a notable absence of literature on goalkeeper kick-out distribution remains across the football codes, especially Gaelic. The majority of Carolan’s (2005) study focused on attacking play, yet it does provide a solid basis for the current study to delve further into the key parameter of kick-outs.
The current study aimed to fill a research gap in the literature relating to performance analysis in Gaelic football, specifically directed at kick-outs. The study aimed to identify, analyse and dissect strategies behind goalkeeper kick-outs during the Ulster Inter-County Senior Gaelic football championship, specifically assessing distribution, possession retention, attack building and creation of scoring opportunities.
2Research design
2.1Participants
Due to the nature of the data collection in this primarily quantitative research study, participants were not required for the notational analysis aspect of the study. Video footage of the eight matches (Table 1) in the Ulster Men’s Senior Inter-County Championship involving nine teams was analysed. In total, 288 players (age 25.6±3.9 years, height 181.5±5.4 cm, weight 80.9±10.3 kg) actions were tracked during the analysis, which included substitutions. Player profiles (Appendix 2) of every squad member were retrieved from the Ulster GAA Council. A questionnaire (Appendix 3) was designed and completed by 100 participants, all of whom were a selection of Gaelic Football players (75) and coaches (25) from Ulster. The participants surveyed varied from presently involved players/coaches to retired players/coaches, and from those with club level to inter-county level experience.
Table 1
Match characteristics of analysed matches
| Date | Match | Stage | Venue | Result (Goals-Points) |
| 16/5/10 | Derry v Armagh | Preliminary | Celtic Park | 1–7 v 1–10 |
| 23/5/10 | Antrim v Tyrone | QF | Casement Park | 1–13 v 2–14 |
| 30/5/10 | Donegal v Down | QF | Ballybofey | 2–10 v 1–15 |
| 6/6/10 | Armagh v Monaghan | QF | Casement Park | 0–9 v 1–18 |
| 12/6/10 | Cavan v Fermanagh | QF | Breffini Park | 0–13 v 1–13 |
| 19/6/10 | Tyrone v Down | SF | Casement Park | 0–14 v 0–10 |
| 27/6/10 | Fermanagh v Monaghan | SF | Breffini Park | 2–8 v 0–21 |
| 18/7/10 | Monaghan v Tyrone | Final | Clones | 0–7 v 1–14 |
2.2Data definition
To define the variables used for video tagging, experts in the field of Gaelic football were surveyed via email to clarify a definition of each key element (Appendix 1). The precision of accurately defining the key elements was essential for repeatability of the test. The same operator notated each game, and therefore eliminated the possibility of operator judgement cross-over.
2.3Data collection
All of the video footage was received directly from the Ulster GAA Council. Statistical data was obtained through the video analysis software Dartfish (Connect Plus 5.5) which, along with training in its use, was provided by the Sports Institute of Northern Ireland (SINI). SINI were invested in provision of such support because of the lack of Gaelic Games research at the time. A tagging panel specifically designed for the study was produced in conjunction with the Lead Performance Analyst in SINI. The role of this Lead Analyst was specifically outlined from the outset of the study –the role was agreed as assisting in making the decisions on what to analyse, and he acted as a support if anything was needed during the process; he reviewed the findings, and being satisfied with the results, did not suggest any changes. The tagging panel was piloted on two matches prior to initiation of the study’s notation. The tagging process used in this study is displayed in Appendix 4.
The questionnaire was developed through www.surveymonkey.com and was distributed via email to key stakeholders within the context of the study. The purpose of the questionnaire (which contained both open ended and closed questions) was to gather opinions and attitudes on notational analysis, using quantitative and qualitative analysis, to add further depth to the statistical evidence. Contact via email with the various GAA County Boards across Ulster was made in order to contact to the people in question. The survey was anonymous, with confidentiality guaranteed and had a 100% response rate. The study was approved by the University Ethics Committee prior to data collection.
2.4Data analysis
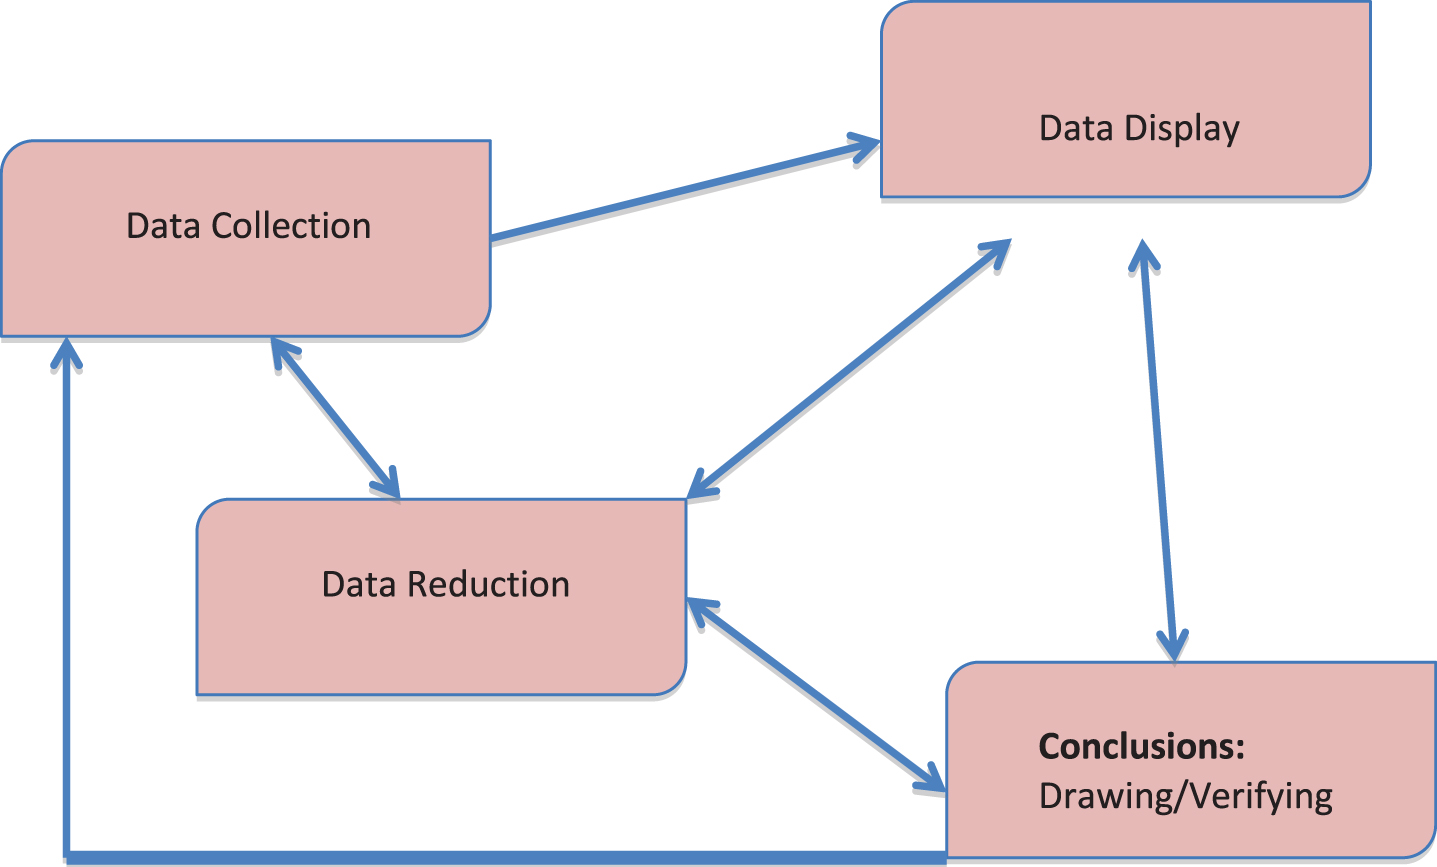
The computerized notation system (Dartfish) used enabled the development of a large database of raw data, which was manually analysed to highlight any significant patterns, trends and differences in the data and to specifically answer the research questions of the study. Data obtained from the questionnaire was analysed (manually and computerized) to extract consistent themes from a range of the written and verbal communication, and involved a process proposed by Miles and Huberman (1994) (Appendix 5). The website used to create the questionnaire automatically analysed the questionnaire data by calculating both the response count and response percentage of each answer.
3Results
3.1Kick-out distribution
Compiled results included analysis of kick-outs (KO’s) from all teams from eight matches, thus amassing 351 kick-outs. The mean number of kick-outs per match was 44 (±9.9). The most common distance KO was 65m+ with 53.8% (±19.9), whilst 57.6% (±13.9) of KO’s were directed to the ‘wings’ (Table 2).
Table 2
Percentage distribution of Kick-Outs in Ulster Senior Gaelic Championship
| Stage | Name | Total Number of KO’s | KO’s to Wings (%) | KO’s to the Centre (%) | KO’s to the Sideline (%) | KO’s to 21–45 m (%) | KO’s to 45–65 m (%) | KO’s to 65 m+ (%) |
| Ulster | 351 | 57.6 | 39.6 | 2.8 | 8.8 | 34.6 | 53.8 | |
| Winners | Tyrone | 63 | 74.6 | 22.2 | 3.2 | 20.6 | 30.2 | 46.0 |
| Finalist | Monaghan | 59 | 50.8 | 47.5 | 1.7 | 13.6 | 44.1 | 40.7 |
| SF | Down | 51 | 39.2 | 58.8 | 2.0 | 3.9 | 13.7 | 80.4 |
| SF | Fermanagh | 51 | 56.9 | 39.2 | 3.9 | 2.0 | 64.7 | 29.4 |
| QF | Armagh | 40 | 72.5 | 25 | 2.5 | 10 | 30 | 57.5 |
| QF | Antrim | 26 | 65.4 | 26.9 | 7.7 | 3.8 | 42.3 | 46.1 |
| QF | Cavan | 22 | 40.9 | 59.1 | 0.0 | 0.0 | 31.8 | 68.2 |
| QF | Donegal | 24 | 62.5 | 33.3 | 4.2 | 0.0 | 8.3 | 91.7 |
| Prelim | Derry | 15 | 40 | 60 | 0.0 | 13.3 | 33.3 | 53.3 |
| Mean | 39 | 55.87 | 41.3 | 2.8 | 7.4 | 33.16 | 57.03 | |
| SD | 17.8 | 13.9 | 15.5 | 2.4 | 7.2 | 16.6 | 19.9 | |
| Mean Number of Kick-Outs Per Match = 44 (+- 9.9) | ||||||||
Note: ‘Ulster’ averages are based on the number of matches played, and the ‘Mean’ totals are based on the number of teams.
The average time taken to take a kick-out was 32.1 seconds (Table 3). In total, 3.5 hours (38%) of match time was taken up in anticipation of kick-outs. The top two ranking teams were found to have averaged the shortest kick-out times across all teams.
Table 3
Ranking system of teams’ average kick-out times, ranking from shortest to longest
| Rank | Team | Average KO Times (s) | Stage Reached |
| 1 | Tyrone | 25.05 | Winners |
| 2 | Monaghan | 25.65 | Finalists |
| 3 | Antrim | 26.46 | QF |
| 4 | Fermanagh | 27.56 | SF |
| 5 | Cavan | 28.25 | QF |
| 6 | Down | 28.9 | SF |
| 7 | Derry | 31.86 | QF |
| 8 | Armagh | 33.88 | QF |
| 9 | Donegal | 34.13 | 1st Round |
| Average Kick-Out Time in Ulster SFC 2010 | 28.1 | ||
| Percentage of time with ball out of play in anticipation of a | 29.4% | ||
| kick-out in Ulster SFC 2010 | |||
Note: Stoppages such as injuries or substitutions were not used when calculating average kick-out times or the percentage of time with ball out of play.
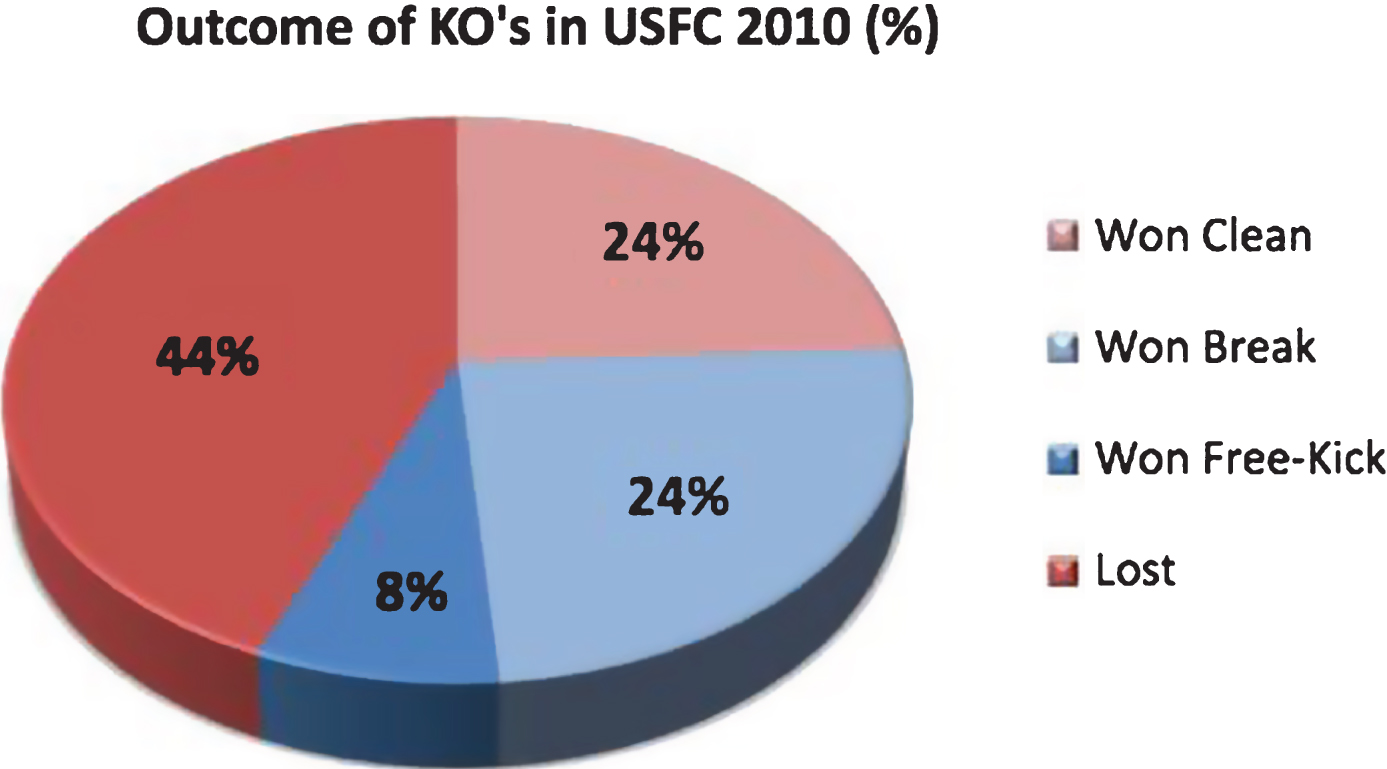
Approximately 44% of all kick-outs resulted in loss of possession with only a quarter of KO’s resulting in possession won cleanly (Fig. 1).
Fig.1
Percentage outcome of KO’s.
3.2Kick-out effectiveness
Classification of KO effectiveness was based on three areas: Possession Regain, Attack Building, and Scores/Scoring Opportunity (Tables 4 and 5). In terms of direction, a greater rate of possession was regained from KO’s to the wings (60.4%), with 54% of kick-outs to the centre won. The 21–45 m KO (87.1%) was the most successful KO distance regarding retaining possession. Kick-outs to 21–45 m yielded the greatest percentage of attack building (54.8% ± 11), whilst in terms of direction, KO’s to the wings (34.5% ± 27.6) were considerably superior in attack building than KO’s to the centre (22.3% ± 11.4). Kick-outs to the wings (18%) contributed greater to creating scoring opportunities than centrally directed KO’s (10%).
Table 4
Kick-out effectiveness based on kick-out distance
| 21–45 m | 45–65 m | 65 m+ | |
| Retained Possession (%) | 87 | 58 | 53 |
| Attacks Started (%) | 55 | 28 | 27 |
| Score/Scoring Opportunity (%) | 16 | 16 | 14 |
| Resulting in Opponents Score (%) | 10 | 13 | 13 |
| Net Difference of scores/scoring | +6 | +4 | +1 |
| opportunities for both teams (%) |
Table 5
Kick-out effectiveness based on kick-out direction
| Wings | Centre | |
| Retained Possession (%) | 60.4 | 54 |
| Attacks Started (%) | 34.5 | 22.3 |
| Score/Scoring Opportunity (%) | 18 | 10 |
| Resulting in Opponents Score (%) | 13 | 11 |
| Net Difference of scores/scoring | +5 | –1 |
| opportunities for both teams (%) |
Tables 4 and 5 present the net difference various kick-outs have on the scoring opportunities of both teams. It was highlighted that KO’s to both 21–45 m (+6%) and the wings (+5%) result in the greatest positive net difference for the KO team. Kick-outs to the centre were the only kick-out parameter that resulted in a negative net difference (–1%).
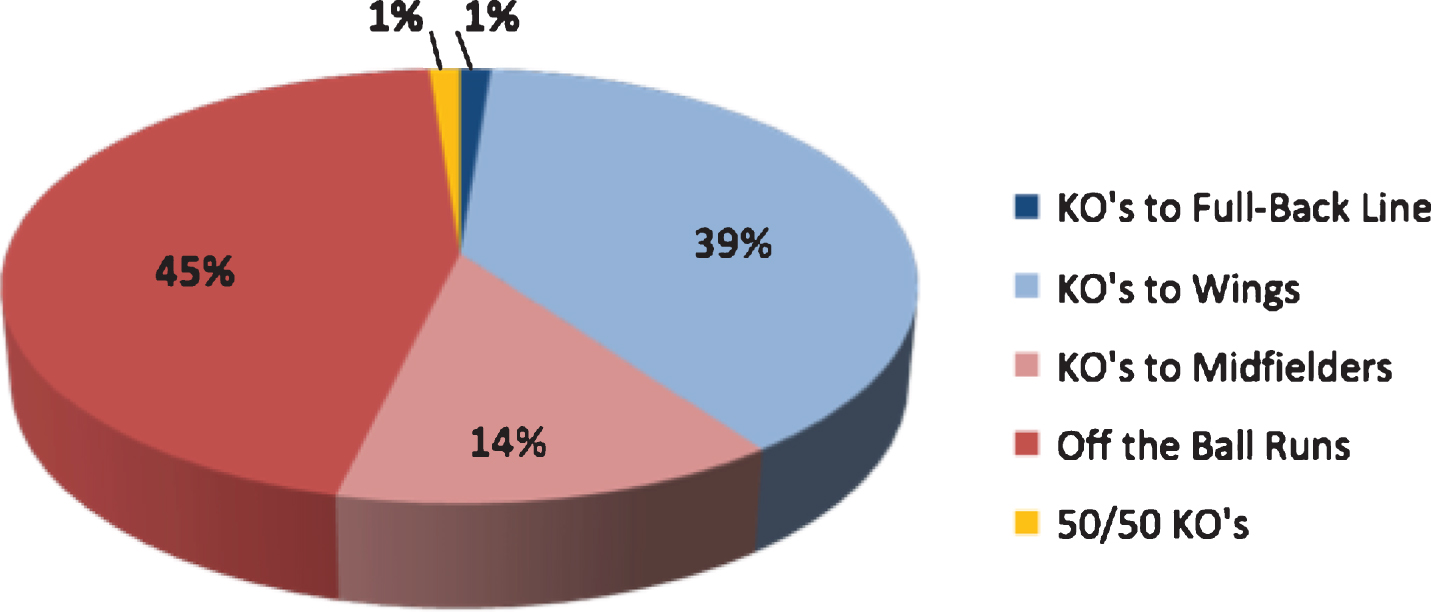
Based on completed questionnaires of 100 key stakeholders, Fig. 2 highlights that ‘off the ball’ runs (45%) were the most common, successful kick-out strategy employed over the past thirty years.
Fig.2
Most frequent successful kick-out strategies over the past 30 years.
4Discussion
The purpose of this study was to analyse kick-outs in Gaelic football. Previous quantitative analysis of Gaelic football primarily focused on player movement patterns (Reilly and Keane, 2002), with the bulk of team sport performance analysis concentrating on attacking play (Yiannakos and Armatas. 2006; Abt et al., 2002; Olsen and Larsen, 1997). In contrast, a lack of research exists on kick-outs in team sports, especially Gaelic football. The current study analysed kick-out distribution, and various aspects of effectiveness.
4.1Distribution
In total, 351 kick-outs (KO’s) were analysed during the study, with an average of 44 KO’s per match; which is more than one KO every two minutes and is in adherence to Martin’s (2003) findings. Table 2 established that KO’s to 65m+ (53.8%) were considerably the most common distribution outcome. This suggests that teams either prefer to take a direct approach to score building, or view the kick-out primarily as a defensive parameter to clear the ball as far away from the goal as possible. The results correlate to the findings of Appleby and Dawson (2002) on Australian Rules who found that on average the favoured kick type for kick-ins’ was ‘long’ to 50m+ (47%). In coherence with Carolan’s (2005) findings, kick-outs to the wings (57.6%) were considerably the most common directional kick-out; although it must be noted that the ‘wings’ takes up two thirds of the field position.
Due to goalkeepers being in unpressurised control of the ball during kick-outs, it was surprising to report that in total, more KO’s were lost (59.3%) than retained (Fig. 1). An explanation of this may be due to the fact that the opposing team can ‘break’ the ball due to it not being in their half of the pitch. The KO team on the other hand can ill afford not to attempt the ‘clean catch’ as it will otherwise put the opposing team in a dangerous attacking pitch position.
Across the eight matches, barring instances of injuries or unforeseen stoppages, the average time taken to complete a KO was 32.1 s, whilst the ball was out of play 38% of match time in anticipation of KO’s. Table 3 displays a ranking system of the teams based on the speed of their average KO time. Interestingly the table ranks Tyrone, Monaghan and Donegal first, second and last respectively. Given the fact that Tyrone defeated Monaghan in the final and Donegal lost in a preliminary round, it would be easy to assume that a quicker KO time contributes to the overall success of a team. Although this would be a ill advised assumption as there are numerous other factors to be accounted for that attributes to this statistic. It is however likely that quicker kick-outs enable fast counter attacking football, and is advantageous in the sense that it reduces the time for opposition teams to regroup. A key limitation of Table 3 however is that both Tyrone and Monaghan played three matches whilst Donegal only played one, which may have attributed to their longer KO time.
4.2Effectiveness
To distinctively determine ‘effectiveness’ is extremely difficult in relation to this study as there are many individual factors to incorporate such as regaining possession, attack building and scoring opportunities. Indeed simply regaining possession may not always be advantageous to a team. For example, if a player regains possession deep in their own half but is immediately put under pressure from 2-3 opposition players, then it would be difficult to classify the KO as being effective. The lack of research reported in the literature pertaining to performance analysis on kick-outs, leaves it challenging to make any generalisations about its effectiveness. Therefore for the purpose of this study, the effectiveness of the KO’s was broken into three subsections; regaining possession, attack building and scoring opportunities.
The percentage of kick-outs retained decreased the further the distance kicked, which adhered to Carolan’s (2005) findings. A noteworthy difference of 34.4% exists between the percentage of possession regained from KO’s to 21–45 m and KO’s to 65m+, in favour of the shorter distance. Considering only 8.8% of KO’s were distributed to 21–45 m and 53.8% to 65m+ (Table 2), it appears illogical that Gaelic teams persist with the long ball strategy. A long kick will result in the ball travelling in the air for a greater time, allowing more defensive players to arrive at the site of contest (Appleby and Dawson, 2002), and thus therein lies a possible explanation of the lower success rate of longer KO’s.
In the modern game, a goalkeeper is required to be dynamic and involved in attack building. For this reason, the study analysed the percentage of KO’s directly leading to the start of an attack. Substantially, 21–45 m KO’s (55%) lead to an attack at almost twice the rate of the longer ranged KO’s, which is likely a result of the increased rate of retaining possession. The findings are consistent with Appleby and Dawson’s (2002) who found that kick-ins to 25–50 m had the greatest correlation with the ball entering the opponents half of the pitch.
In 1983, Franks et al. concluded that it would be advantageous for soccer players to keep sequential passing to≤3. Bates (1988) interestingly found that 94% of goals scored in varying levels of international soccer resulted from moves involving≤4 passes, enabling a conclusion that direct play is more beneficial than possession play. Albeit in a different code of football, the current study findings failed to detect any difference in benefit of direct play (long KO’s) and shorter KO’s on scoring outcome. However, kick-outs to the wings contributed an 8% greater success rate of creating scoring opportunities as opposed to central kick-outs. With eight player positions consuming central positions, and only four player positions per wing, it appears that the increased space contributes to the creation of scoring opportunities by enabling more room to deliver a pass to an attackingplayer.
Considering the majority of KO’s lost possession (59.3%), it was important to analyse the net difference between kick-out placement on scores/scoring opportunities for and against teams (Tables 4 and 5). Kick-outs to 21–45 m (+6%) had a greater net difference of scores for and against than any other distance and thus was the most effective strategy as regards overall scores. Of greater interest, KO’s to the centre resulted in more scores against than for (net difference –1%) whereas KO’s to the wings (+5%) proved to have the greatest net difference. This suggests that coaches would benefit the team by developing and incorporating kick-out strategies into training that will allow them to create more scoringopportunities.
4.3Team strategies
It is important to acknowledge that the norm does not indicate the most successful strategy. A breakdown for each team’s KO’s (Appendix 6, 7 and 8) was produced prior to the calculation of summative results in order to present evidence of this point. Tyrone, who eventually won the tournament for the second successive year, kicked 22.8% of their KO’s to the centre, which is approximately half of the average, and opted for the strategic placement to the wings instead to maximise retention of possession. It is essential to note that a ‘one size fits all’ approach does not exist, as successful teams develop strategies to suit their strengths (Keane et al., 1993). From studying anthropometric profiles, Tyrone’s central midfield players were on average the smallest and second lightest of all the teams in Ulster; this makes their short game approach understandable.
4.4Player and coach opinions on kick-outs
From the fifty stakeholders interviewed, the most common kick-out strategy appeared to be the use of off the ball runs to create space. Player movement patterns were not analysed in the current study, however off the ball runs can be used to influence the actual directional/placement of kick-outs. What is of interest to the present study, and which adheres to the findings, is that 39% (Fig. 2) of stakeholders stated that kick-outs to the wings was their most frequently successful approach, whilst a mere 14% used kick-outs to the centre as their most common strategy.
5Study limitations and recommendations
A key limitation of data collection is the possibility of an incident/s during the match passing by unnoticed and consequently untagged in the video analysis. The benefit of this study was be that every video clip analysed was validated (Appendix 9) by a Lead Performance Analyst from the SINI. In instances of irregularity in the work of both analysts, the match in question was re-analysed until both sets of data correspond. Due to the video footage being supplied by the BBC (British Broadcasting Corporation), it was common for the start of kick-outs to be obscured due to the screening of action replays. This particularly affected the recording of the timing of the kick-out, in which case the operator had to determine how much extra to add on to the recorded time. However, intra-tester reliability was strong due to the use of the same operator throughout tagging.
Pitch markings were qualitatively used to assess kick-out distance, however as previously highlighted, matches took place in various locations and it is unlikely that every venue’s pitch dimensions are consistent in size. Despite all of the eight matches in the Ulster Championship being analysed, the required number of matches required to generate a normative profile is unclear (Sforza et al., 1997). As a researcher exploring performance analysis in Gaelic, the lack of literature made comparison of results difficult, as no protocol exists to guide data collection and analysis. Therefore additional research in the area is required to add depth to this reference data, possibly across varying levels of competition and in different provinces. Using mobile hardware such as laptops and iPads in future research would enable the obvious benefit of notational analysis to being taken out to the field and completed in real-time with less complexity, resulting in increased efficiency for the coaches and players (Pearson and Buchanan, 2010). To fully utilise the potential of future research findings among the Gaelic football fraternity, it may be beneficial to produce a graphical presentation of results or even video casts (Orlick, 1989), as opposed to the academic format used in the present study.
6Conclusion
This study has established that shorter kick-outs and kick-outs to the wings are the most effective strategies that will improve the likelihood of regaining possession and attack building. This short game approach adopted, largely by the successful teams, is likely a thriving response to the ‘blanket defence’ that has become a hugely successful tactic over the last decade. Retaining possession becomes all the more difficult when the player is crowded by opposition and a severe lack of space exists, and thus the short passing combats this. With approximately 30% of kick-outs directly contributing to starting attacks, coaches/players can significantly improve chances of team success by developing strategies based around shorter, quicker kick-outs to the wings. Although there is no secret formula of success, the results provided from this study suggest that kick-outs can be successful attacking elements when used effectively. With the increase in support for coaching and sports science research in GAA games in Ireland and internationally, the results of this study should help to inform improvement in sports science research that support GAA football coaching practice.
Appendices
Appendix 1. Glossary of key parameters
| Kick -Out | A placed kick from the ground, resultant from the ball crossing the end-line having been touched last by an opposition team member. |
| Ball Won Clean: | When a player wins possession directly from the kick-out without being touched by another player. The player must be deemed to have adequate control of the ball, and capable of having an intentional influence on its subsequent outcome. |
| Break Won: | When a player wins possession indirectly from the kick-out. The player must be deemed to have adequate control of the ball, and capable of having an intentional influence on its subsequent outcome. |
| Point: | When the ball is kicked or fisted over the crossbar and between the upright goalposts. |
| Wide: | When the ball crosses the end line after being contacted last by the attacking team, resulting in a goal kick. |
| ‘45’ | When the ball crosses the end line after being contacted last by the defending team, resulting in a 45 m free kick for the attacking team. |
| 21–45 m | The section of the pitch that is between 21 m and 45 m from the goal line. |
| 45–65 m | The section of the pitch that is between 45 m and 65 m from the goal line. |
| 65m+ | The section of the pitch that is 65 m or more from the goal line. |
| Left: | The vertical section of the pitch deemed to be positioned to the left hand side of the pitch. |
| Centre: | The vertical section of the pitch deemed to be positioned in the centre of the pitch. |
| Right: | The vertical section of the pitch deemed to be positioned to the right hand side of the pitch. |
| Sideline: | If the ball crosses the sideline directly from the kick-out without being in contact with any players. |
| Turnover: | When the team in possession loses control of the ball, and the resultant possession is regained by a member of the opposing team. |
| 50/50: | When the likelihood of possession of the ball being won by either team at a given moment is equal. |
| Fouled Ball: | When the team in possession of the ball makes an illegal contact with the ball in the context of the rules of Gaelic. |
| Long Ball: | A pass greater than 30 metres in length. |
| Short Ball: | A pass less than 30 metres in length. |
| Ball Carried: | Direct running whilst in possession of the ball. |
| Attack: | Any process in which the ball crosses the oppositions 45 m line. Commencement of attacks is when the ball is carried over the 45 m line, or if it is kick passed or fist passed over the 45 m line. |
| Shot: | An attempt by a player to move between the goalpost, either above or under the crossbar. |
| Shot Short: | When a shot intended for a score fails to travel the distance required to reach the goal posts. |
| Score: | When the ball is moved between the goalpost, either above or under the crossbar. |
| Scoring Opportunity: | When the previous passage of play enables a realistic opportunity to make a score. A scoring opportunity can arise during play or as a result of a free-kick. |
Appendix 2. Team average anthropometry profiles
| Central position | Wing positions | |||
| Height (cm) | Weight (kg) | Height (cm) | Weight (cm) | |
| Tyrone | 183 | 87 | 180 | 79 |
| Monaghan | 186 | 89 | 181 | 80 |
| Down | 186 | 87 | 180 | 80 |
| Fermanagh | 186 | 87 | 179 | 78 |
| Cavan | 189 | 87 | 178 | 79 |
| Antrim | 185 | 86 | 180 | 86 |
| Armagh | 186 | 87 | 185 | 87 |
| Derry | 185 | 86 | 181 | 81 |
| Donegal | 188 | 94 | 181 | 81 |
| Mean | 186 | 88 | 181 | 81 |
| SD | 1.7 | 2.5 | 1.9 | 3.2 |
Central positions: Centre Half Back, 2 Midfielders, Centre Half Forward. Wing positions: 2 Wing Half Backs, 2 Wing Half Forwards.
Appendix 3. Study questionnaire
| Please tick what role in Gaelic you specialise in: (You can tick more than one box)□ | ||
| Goalkeeper | Half-Back | Midfielder |
| Half-Forward | Coach | |
| Other If other, please state: | ||
| What years were you involved as a coach? (You can tick more than one box)□ | ||
| Presently | Within last 5 years | 10–20 years ago |
| 20 years ago+ | ||
| What years were you involved as a player? (You can tick more than one box)□ | ||
| Presently | Within last 5 years | Within last decade |
| 10–20 years ago | 20 years ago+ | |
| What level did you play at? (You can tick more than one box)□ | ||
| Club | County Minor | County U21 |
| County Senior | Provincial | Third Level |
| Club County | Senior | N/A |
| What level did you coach at? (You can tick more than one box)□ | ||
| Club | County Minor | County U21 |
| County Senior | Provincial | Third Level |
| N/A | ||
| Is/Was there much emphasis on goalkeeper training during your time involved in Gaelic? | ||
| (There are separate sections for different eras. Please tick where relevant to the eras you were involved in. You can enter data | ||
| for more than one era if you were personally involved through different eras.) | ||
| Eras | Often | Regularly | Rarely | Very Rarely |
| Present | ||||
| Within last 5 Years | ||||
| Within last 10 Years | ||||
| 10–20 Years Ago | ||||
| 20 Years Ago+ | ||||
| What did this consist of? | ||||
| (There are separate sections for different eras. Please tick where relevant to the eras you were involved in. | ||||
| You can enter data for more than one era if you were personally involved through different eras.) | ||||
| Present | Within 5 | Within Last | 10–20 | 20 + Years | |
| Years | 10 Years | Years Ago | Ago | ||
| Goalkeeper practiced kick-outs separately from teammates after training | |||||
| Goalkeepers worked together hitting shots on each other | |||||
| Goalkeeper coaches were involved to work specifically with the Goalkeepers | |||||
| Goalkeepers were specifically trained in a conditioned game every night in training |
If other, please state along with the era:
------------------------------------------
------------------------------------------
------------------------------------------
------------------------------------------
| During your involvement in Gaelic, was it regular for teams to incorporate kick-out strategies | ||||
| to benefit team efficiency? | ||||
| (There are separate sections for different eras. Please tick where relevant to the eras you were involved in. | ||||
| You can enter data for more than one era if you were personally involved through different eras.) | ||||
| Eras | Often | Regularly | Rarely | Very Rarely |
| Present | ||||
| Within last 5 Years | ||||
| Within last 10 Years | ||||
| 10–20 Years Ago | ||||
| 20 Years Ago+ | ||||
| Was there any statistical/notational analysis of Kick-Outs during your involvement in Gaelic? | ||
| (There are separate sections for different eras. Please tick where relevant to the eras you were involved in. | ||
| You can enter data for more than one era if you were personally involved through different eras.) | ||
| Eras | Yes | No |
| Present | ||
| Within last 5 Years | ||
| Within last 10 Years | ||
| 10–20 Years Ago | ||
| 20 Years Ago+ | ||
If yes, please explain in more detail along with the era:
----------------------------------------------------------
----------------------------------------------------------
----------------------------------------------------------
----------------------------------------------------------
If you used kick-out strategies, what was the most successful strategy you used?
(You can tick more than one, but only if it was a regular strategy)
| Short Kick-Outs to the full back line□ | ||
| Kick-Outs to the wing-forwards□ | ||
| Off the balls runs to create space□ | ||
| Short Kick-Outs to the wing-backs□ | ||
| Kick-Outs to the midfielders□ | ||
| 50/50 Kick-Outs□ |
If other please state:
---------------------------------------
---------------------------------------
---------------------------------------
---------------------------------------
| What is your opinion on statistical/video analysis, used by the majority of current | ||
| Inter-County Gaelic teams? | ||
| (You can tick more than 1 box)□ | ||
| Beneficial | Important | Necessary |
| Time waster | Too much bother | Unnecessary |
| Optional Comment: | ||
| ------------------ | ||
| ------------------ | ||
| ------------------ | ||
| In your opinion, what is the most important aspect of a goalkeeper’s role? | ||
| Rank in order of 1-5□ | ||
| Kick-Outs | Shot Stopping | Communication |
| Leader | Good under the high ball | |
| If other, please state along with their rank: | ||
| --------------------------------------------- | ||
| --------------------------------------------- | ||
| Are there any additional comments you would like to include? | ||
| ------------------------------------------------------------------- | ||
| ------------------------------------------------------------------- | ||
| ------------------------------------------------------------------- | ||
| ------------------------------------------------------------------- | ||
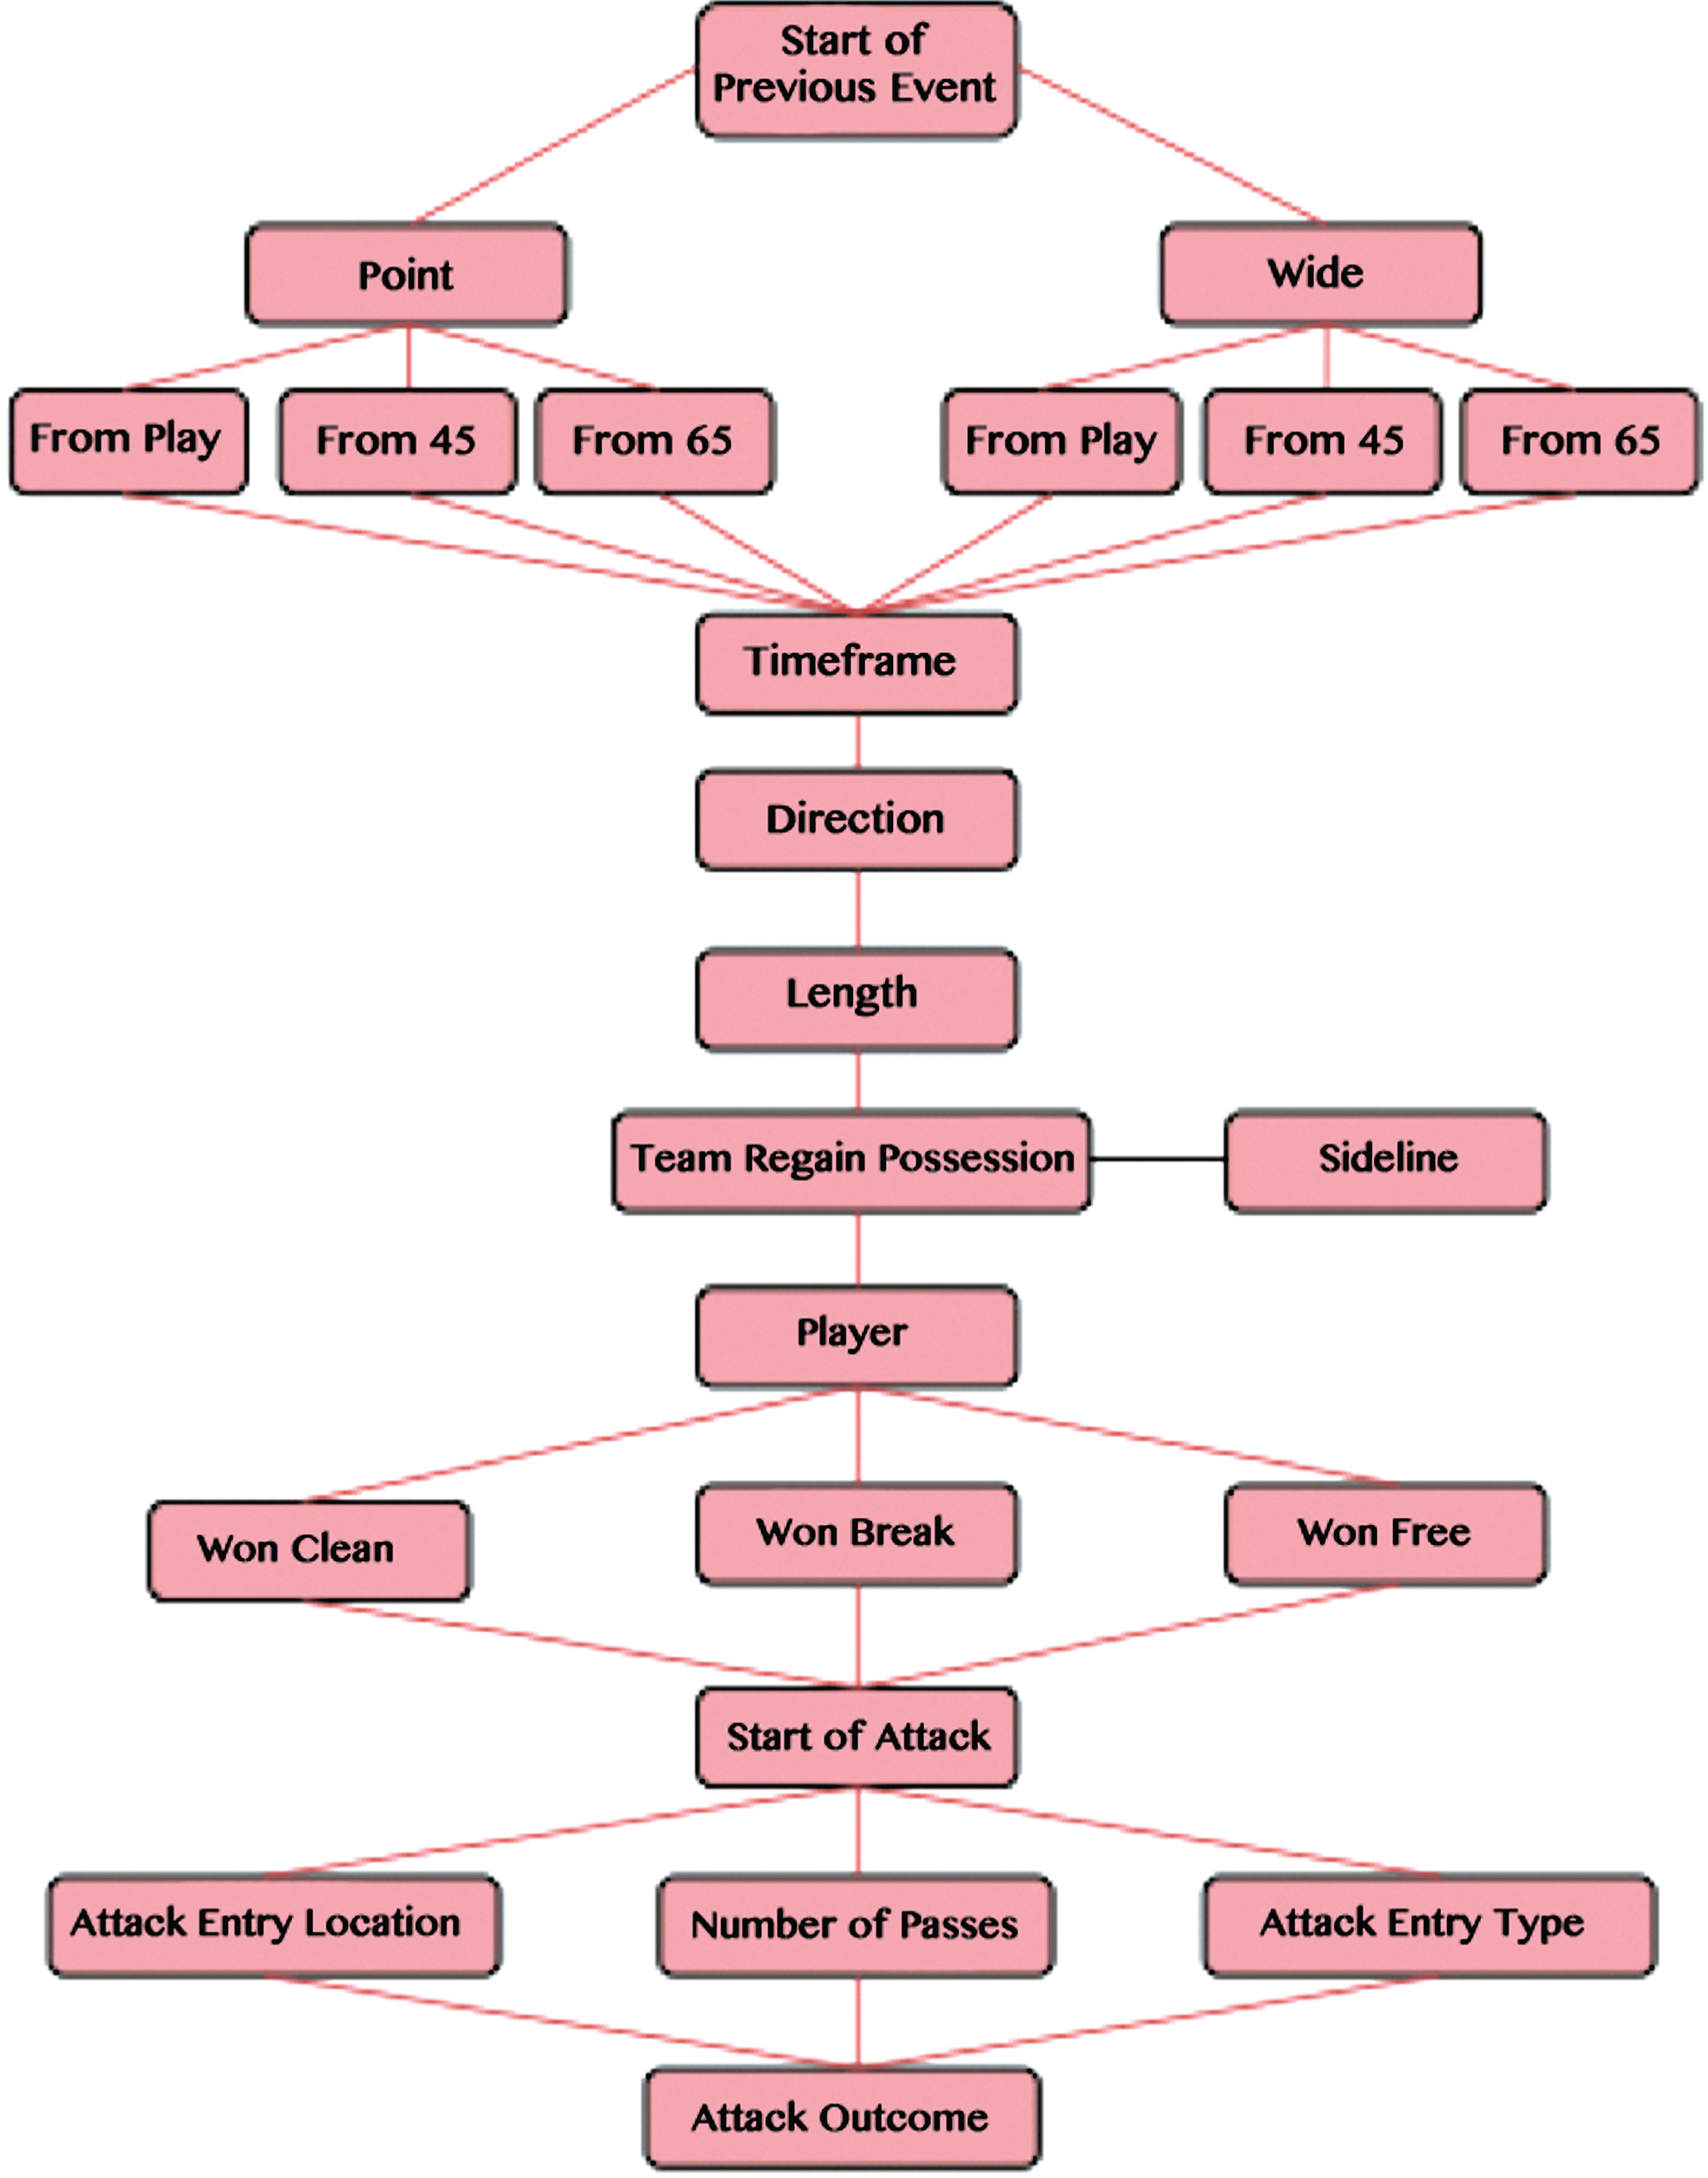
Appendix 4. Flow diagram highlighting the tagging process of the study
Appendix 5. An interactive model of qualitative data analysis for the study (Miles and Huberman, 1994, p.12)
Appendix 6. Team percentage breakdown of kick-outs resulting in regained possession from placement direction of kick-outs
| Stage | Name | Wings (%) | Centre (%) | 21–45m (%) | 45–65 m (%) | 65m+ (%) |
| Ulster | 60.4 | 54.0 | 87.1 | 57.0 | 52.7 | |
| Winners | Tyrone | 57.4 | 64.3 | 84.6 | 52.6 | 51.7 |
| Finalist | Monaghan | 73.3 | 42.9 | 75 | 61.5 | 50 |
| SF | Down | 45.0 | 60 | 100 | 42.9 | 53.7 |
| SF | Fermanagh | 58.6 | 55 | 100 | 56.3 | 60 |
| QF | Armagh | 58.6 | 40 | 100 | 41.7 | 52.2 |
| QF | Antrim | 64.7 | 85.7 | 100 | 63.6 | 75 |
| QF | Cavan | 55.6 | 30.8 | 0 | 71.4 | 26.7 |
| QF | Donegal | 53.3 | 62.5 | 0 | 100 | 52.4 |
| Prelim | Derry | 66.7 | 66.6 | 100 | 60 | 62.5 |
| SD | 8.2 | 16.5 | 42.5 | 17.4 | 12.8 |
Appendix 7. Percentage breakdown of kick-outs directly leading to the start of an attack for the kick-out team
| Stage | Name | Number of KO’s | 21–45m (%) | 45–65 m (%) | 65m+ (%) | Wings (%) | Centre (%) |
| Ulster | 28.8 | 54.8 | 27.9 | 26.5 | 34.5 | 22.3 | |
| Winners | Tyrone | 30.2 | 53.8 | 26.3 | 24.1 | 31.9 | 28.6 |
| Finalist | Monaghan | 33.9 | 50 | 42.3 | 25 | 50 | 21.4 |
| SF | Down | 23.5 | 100 | 0 | 24.3 | 25 | 23.3 |
| SF | Fermanagh | 23.5 | 0 | 21.2 | 66.7 | 27.6 | 20 |
| QF | Armagh | 32.5 | 75 | 25 | 34.8 | 41.4 | 20 |
| QF | Antrim | 42.3 | 100 | 54.5 | 33.3 | 47.1 | 42.9 |
| QF | Cavan | 13.6 | n/a | 28.6 | 6.7 | 22.2 | 7.7 |
| QF | Donegal | 33.3 | n/a | 0 | 36.4 | 100 | 37.5 |
| Prelim | Derry | 6.7 | 0 | 0 | 12.5 | 0 | 11.1 |
| SD | 11 | 41.9 | 19.3 | 17.2 | 27.6 | 11.4 |
Appendix 8. Percentage breakdown of Kick-Outs directly resulting in a score/scoring opportunity for the KO team
| Stage | Name | Number of KO’s | 21–45m (%) | 45–65 m (%) | 65m+ (%) | Wings (%) | Centre (%) |
| Ulster | 15 | 16 | 16 | 14 | 18.3 | 10 | |
| Winners | Tyrone | 16 | 31 | 11 | 14 | 14.9 | 21 |
| Finalist | Monaghan | 20 | 13 | 31 | 13 | 33.3 | 7 |
| SF | Down | 6 | 0 | 0 | 7 | 5.0 | 7 |
| SF | Fermanagh | 16 | 0 | 15 | 20 | 24.1 | 5 |
| QF | Armagh | 13 | 0 | 17 | 13 | 26.3 | 0 |
| QF | Antrim | 19 | 0 | 18 | 25 | 17.6 | 29 |
| QF | Cavan | 14 | n/a | 14 | 13 | 5.3 | 15 |
| QF | Donegal | 17 | n/a | 0 | 18 | 13.3 | 25 |
| Prelim | Derry | 7 | 0 | 0 | 13 | 16.7 | 0 |
| SD | 4.9 | 11.9 | 10.4 | 5.2 | 9.4 | 10.8 |
Appendix 9. Cross marker validation of tagging results
| Event | Outcome | Operator 1 | Operator 2 | Absolute Difference |
| Kick-Out Outcome | Team A | 13 | 13 | 0 |
| Team B | 7 | 7 | 0 | |
| Total | 20 | 20 | 0 | |
| Kick-Out Location | L5 | 8 | 8 | 0 |
| R5 | 5 | 5 | 0 | |
| C5 | 5 | 5 | 0 | |
| Sideline | 2 | 2 | 0 | |
| Total | 20 | 20 | 0 | |
| Regained Possession | Yes | 14 | 14 | 0 |
| No | 4 | 5 | 1 | |
| N/A | 2 | 1 | –1 | |
| Total | 20 | 20 | 0 | |
| Position | Corner Back | 2 | 2 | 0 |
| Full Back | 0 | 0 | 0 | |
| Half Back | 3 | 3 | 0 | |
| Centre Half Back | 0 | 0 | 0 | |
| Midfielder | 4 | 6 | 2 | |
| Half Forward | 4 | 5 | 1 | |
| Centre Half Forward | 1 | 1 | 0 | |
| Corner Forward | 0 | 0 | 0 | |
| Full Forward | 0 | 0 | 0 | |
| N/A | 4 | –1 | –3 | |
| Blank | 2 | 2 | 0 | |
| Total | 20 | 20 | 0 | |
| Previous Event | Point from Play | 8 | 8 | 0 |
| Wide from Play | 6 | 6 | 0 | |
| Goal from Play | 2 | 2 | 0 | |
| Goal from Penalty | 0 | 0 | 0 | |
| Point from Free | 3 | 3 | 0 | |
| Wide from Free | 1 | 1 | 0 | |
| Point from 45 | 0 | 0 | 0 | |
| Wide from 45 | 0 | 0 | 0 | |
| Total | 20 | 20 | 0 | |
| Length of Kick-Out | 21–45 | 3 | 3 | 0 |
| 45–65 | 10 | 10 | 0 | |
| 65+ | 6 | 2 | –4 | |
| N/A | 1 | 0 | –1 | |
| Blank | 0 | 5 | 5 | |
| Total | 0 | 5 | 5 | |
| Attack Entry | Long Ball | 7 | 5 | –2 |
| Straight | 0 | 3 | 3 | |
| Diagonal | 0 | 2 | 2 | |
| Free Kick | 3 | 2 | –1 | |
| Sidelin | 0 | 0 | 0 | |
| Solo | 4 | 6 | 2 | |
| Short Pass | 2 | 1 | –1 | |
| Kick Pass | 0 | 1 | 1 | |
| Hand Pass | 0 | 0 | 0 | |
| N/A | 4 | 6 | 2 | |
| Total | 20 | 20 | 0 | |
| Passes | Forward | 26 | 25 | –1 |
| Backward | 10 | 9 | –1 | |
| Lateral | 5 | 2 | –3 | |
| Total | 41 | 36 | –5 | |
| Turnovers | Poor Kick Pass | 3 | 2 | –1 |
| Poor Hand Pass | 1 | 0 | –1 | |
| 50/50 | 2 | 1 | –1 | |
| Player Dispossessed | 2 | 2 | 0 | |
| Fouled Ball | 2 | 3 | 1 | |
| Shot Short | 1 | 2 | 1 | |
| Post | 0 | 0 | 0 | |
| Save | 0 | 0 | 0 | |
| Blank | 9 | 10 | 1 | |
| Total | 20 | 20 | 0 | |
| Destination Pass | L1 | 0 | 0 | 0 |
| L2 | 0 | 0 | 0 | |
| L3 | 1 | 1 | 0 | |
| L4 | 7 | 7 | 0 | |
| L5 | 0 | 0 | 0 | |
| L6 | 0 | 0 | 0 | |
| C1 | 0 | 0 | 0 | |
| C2 | 0 | 0 | 0 | |
| C3 | 0 | 1 | 1 | |
| C4 | 2 | 3 | 1 | |
| C5 | 0 | 1 | 1 | |
| C6 | 0 | 0 | 0 | |
| R1 | 0 | 0 | 0 | |
| R2 | 0 | 0 | 0 | |
| R3 | 5 | 5 | 0 | |
| R4 | 1 | 0 | –1 | |
| R5 | 1 | 0 | –1 | |
| Blank | 4 | 2 | –2 | |
| Total | 20 | 20 | 0 | |
| Outcome Area | L3 | 1 | 2 | 1 |
| L4 | 4 | 3 | –1 | |
| L5 | 2 | 0 | –2 | |
| C3 | 0 | 0 | 0 | |
| C4 | 1 | 1 | 0 | |
| C5 | 5 | 5 | 0 | |
| R3 | 1 | 0 | –1 | |
| R4 | 3 | 3 | 0 | |
| R5 | 1 | 1 | 0 | |
| Blank | 2 | 5 | 3 | |
| Total | 20 | 20 | 0 | |
| Outcome of Attack | Point | 2 | 1 | –1 |
| Goal | 1 | 1 | 0 | |
| Wide | 3 | 3 | 0 | |
| Scoreable Free | 0 | 0 | 0 | |
| Turnover | 10 | 9 | –1 | |
| Out for 45 | 0 | 0 | 0 | |
| Blank | 4 | 6 | 2 | |
| Total | 20 | 20 | 0 |
REFERENCES
1 | Abt G.A. , Dickson G. and Mummery W.K. , (2002) . Goal scoring patterns over the course of a match: An analysis of the Australian National Soccer league. In: Sinks W. , | T. and Murphy A. eds., Science and Football IV. London: E & FN Spon., 106–111. |
2 | Appleby B. and Dawson B. , (2002) . Video analysis of selected games activities in Australian Rules football, Journal of Science & Medicine in Sport 5: (2), 129–142. |
3 | Bates R. , (1988) . Football Chance: Tactics and Strategy. In: Reilly T. , Lees A. , Davids K. and Murhy W. eds., Science and Football. London: E & FN Spon., pp. 293–301. |
4 | Carolan J. , (2005) . Analysis of Selected Performance Parameters in Gaelic Football, Unpublished Thesis, University College Dublin. |
5 | Douge B. , (1988) . Football: The common threads between the games. In: Reilly T. , Lees A. , Davids K. and Murhy W.J. eds., Science and Football. London E & FN Spon., pp. 3–19. |
6 | Keane S. , Reilly T. and Hughes M. , (1993) . Analysis of work rates in Gaelic Football, Australian Journal of Science and Medicine in Sport 25: , 100–102. |
7 | Keane S. , Reilly T. and Borrie A. , (1997) . A comparison of fitness characteristics of elite and non-elite Gaelic football players. In: Reilly T. , Bangsbo J. and Hughes M. eds., Science and Football III. London: E & FN Son., pp. 3–6. |
8 | Martin D. , (2003) . Effectiveness of augmented feedback on performance analysis in Gaelic football, Unpublished Thesis, University of Ulster. |
9 | McErlean C. , Murphy M. and O’Donoghue P. , (1998) . Time motion analysis of work-rate within various positional roles of elite ladies Gaelic football, Journal of Sports Sciences 16: (1), 21–22. |
10 | McGuigan K. , (2006) . Scoring in Gaelic football. Unpublished Thesis, University of Ulster. |
11 | Miles M.B. and Huberman A.M. , (1994) , Qualitative Data Analysis: An Expanded Sourcebook. Thousand Oaks, CA: Sage. |
12 | Moran S. , (2001) . The Gaelic athletic association and professionalism in Irish sport, Studies: An Irish Quarterly Review 90: (359), 276–282. |
13 | Olsen E. and Larsen O. , (1997) . Use of match analysis by coaches. In: Reilly T. , Bangsbo J. and Hughes M. eds., Science and Football III. London: E & FN Son., pp. 209–220. |
14 | Orlick T. , (1989) . Reflections on sport psych consulting with individual and team sport athletes at summer and winter Olympic Games, The Sport Psychologist 3: , 358–365. |
15 | Pearson J. and Buchanan G. , (2010) . Real-Time Document Collaboration Using iPads. Retrieved Online, 2nd February 2011, from http://research.microsoft.com/en-us/events/booksonline10/program.aspx. |
16 | Reilly T. and Collins K. , (2008) . Science and the Gaelic sports: Gaelic football and hurling, European Journal of Sport Science 8: (5), 231–240. |
17 | Reilly T. and Doran D. , (2001) . Science and gaelic football: A Review, Journal of Sports Sciences 19: , 181–193. |
18 | Reilly T. , Rienzi E. and Doran D. , (2000) . Kinanthropometric profiles of elite players in three football codes. Proceedings from Communication to the Vth Annual Conference of the European College of Sports Science. Jyvaskyla, Finland, 5-7 July. |
19 | Reilly T. and Keane S. , (2002) . Estimation of physiological strain on Gaelic football players during match-play, In: Sinks T. , Reilly T. and Murphy A. eds., Science and Football IV. London: E & FN Spon., pp. 96–100. |
20 | Sforza C. , Michielon G. , Grassi G. , Alberti G. and Ferrario V.F. , (1997) . Bivariate analysis of the repeatability of football offensive schemes. In: Reilly T. , Bangsbo J. and Hughes M. eds., Science & Football III. London: E & FN Son., pp. 233–239. |
21 | Yiannakos A. and Armatas V. , (2006) . Evaluation of the goal scoring patterns in European Championship in Portugal 2004, International Journal of Performance Analysis in Sport 6: (1), 1–9. |


