
Modeling the NCAA basketball tournament selection process using a decision tree
Abstract
Each year, 68 teams are invited to participate in the NCAA basketball tournament. Of these 68 teams, 36 are given an at-large bid by a selection committee rather than automatically qualifying. However, despite the process being public, the exact method by which teams are ranked against other teams to determine which teams are given at-large bids is not known. Many factors are known or theorized to be in use, including the RPI, top 50 wins, and strength of schedule. In this paper we attempt to provide a quantitative method to mimic the team made by the selection committee by constructing a decision tree. We then test our method on years 2012–2016, where we find that in each year all but one team selected by our method was invited to the tournament.
1Introduction
The men’s college basketball championship tournament held by the National Collegiate Athletic Association (NCAA), henceforth referred to as the tournament, attracts mass media and popular attention across the country. Surprisingly, for such a popular event, the method by which teams are selected for participation in the tournament is something of a mystery. Each year 32 teams are guaranteed entry by winning their conference tournaments. However, the other 36 teams are selected by a selection committee whose job is to determine which teams are best qualified to play in the tournament. While the procedure followed by the selection committee to select the 36 teams is known, the details on exactly how the teams are ranked have not been made fully public. There has been much speculation on which factors are important to the committee, how quantitative or qualitative their assessment is, and how much of it is just the “eye test”.
In this paper we propose a decision-making method that attempts to mimic the process performed by the selection committee. Here we focus solely on the selection process, where we identify the teams that will be given entrance into the tournament, rather than also attempting to predict the seed each team will be assigned. We then present the results of our method when tested over the years 2012–2016, and show that we are able to correctly select all but one team in each of those years.
2Background
There has been much public speculation on how the committee selects teams for the tournament. The process by which a committee selects teams is public (NCAA, 2016); each committee member identifies 36 teams which they believe should be given entrance, as well as marks any team which they believe should be considered for entry. Then, any team which at least all-but-two committee members select for inclusion will be added to the tournament. The remaining teams are taken from the lists for inclusion and consideration and filtered down via another series of ballots. Finally, those teams are ranked by each committee member, and the highest ranked teams are added to the tournament four at a time.
The uncertainty comes when attempting to determine how a committee member decides which teams are stronger than other teams. The members have copious amounts of data available, including box scores, head-to-head results, results against common opponents, conference schedules, overall and non-conference strength of schedule, road record, injury reports, coach availability, and other tracked metrics (NCAA, 2016). However, it is not known which of these pieces of information is used and how much they are weighted. For example, it was long thought that the Rating Performance Index (RPI) was a large factor in the selection process (Ezekowitz, 2013), but recent statements from committee members state that the RPI is used to determine which teams are considered, but is not a determining factor (Stephens, 2015). Other statements by committee members suggest the importance of acquiring top-50 wins (wins against a team with a top-50 RPI) and avoiding 200+ losses (losses against a team with an RPI of over 200) (Katz, 2016).
The RPI metric is used to rank teams based on each team’s wins, losses, and strength of schedule (how strong their opponents were). The current formula for RPI is given as
(1)
where WP is Winning Percentage, OWP is Opponents’ Winning Percentage, and OOWP is Opponents’ Opponents’ Winning Percentage. The WP is calculated as number of wins / number of games, where a home win is counted as 0.6, a neutral win is 1, and an away win is 1.4. This weighting is due to the observed influence of game location on game outcome, where home teams tend to win significantly more than away teams. The OWP is the average of the WP for each of a team’s opponents, while the OOWP is the average of each opponent’s OWP.
While official statements may seek to downplay the role of RPI, the RPI values are embedded into numerous pieces of information the committee admits to using. For example, top-50 wins are counted as wins against teams with the top 50 RPI ranks, while strength of schedule measure the strength of each team using its RPI rank. Therefore, the RPI of each team is inherently included in the committee selection process.
The RPI has also been subjected to criticisms. One of the most frequent criticisms is that it relies too heavily on strength of schedule (Pomeroy, 2011). As seen in the formula for RPI, the strength of the opponents appears in both the OWP and OOWP components, which means that 75% of the RPI value is dependent on opponent strength to some degree. This can cause problems for teams in weaker conferences, since they do not play against strong opponents in their conference. Indeed, playing a weaker team is typically detrimental to a team’s RPI rank regardless of the outcome of the game. Another criticism is that RPI does not take into account margin of victory. However, the RPI rankings are officially acknowledged to be used in the selection process, so we chose to include them.
In light of the weaknesses found in the RPI, several other rating systems have risen to popularity. The Basketball Power Index (BPI) was introduced in 2013 by ESPN and referred to as “a little more refined than any other existing power ranking”(Oliver, 2013). The formula for the BPI is not included in the literature, but it is said to include information such as whether a team is missing an important player during a game, how close the game was, the pace of the game, and strength of schedule (Oliver, 2013).
Another popular rating system is provided by Ken Pomeroy, who scores each team using a pythagorean winning percentage (Pomeroy, 2012).His ratings combine the adjusted offensive efficiency (AdjO) and adjusted defensive efficiency (AdjD) which are an estimate of the points scored (for offense) or allowed (for defense) per 100 possessions against the average defense (or offense). The formula to combine these into the pythagorean rating is
(2)
Jeff Sagarin also publishes the popular Sagarin rankings, but his formula is also proprietary.
3Methodology
The goal of this method is to predict which teams will be selected for entrance into the tournament. In order to do this, we must first choose which pieces of information pertaining to each team to use. This information will then be built into a model to determine the relative strength of the teams considered for entry in the tournament.
3.1Choosing relevant information
We decided to use some expert rankings in conjunction with some performance metrics for the teams over the regular season.
The first included ranking is RPI, which is known to be a factor that the selection committee at least considers. We also chose to include other expert rankings to potentially make up for some of the weaknesses in the RPI system. The main expert rankings in popular use are the BPI, Pomeroy rankings, and the Sagarin rankings. In order to determine which ranking systemto use, we compared the RPI, BPI, Pomeroy, and Sagarin rankings for each team between the years 2012 and 2016. The plots showing the pairwise comparison between these ranking systems can be found in fig. 1, where each point on each plot represents the different rankings of a single team. We then calculated the pair-wise Spearman correlation coefficients between the RPI, BPI, Pomeroy, and Sagarin rankings (given in Table 1) and observed that the BPI, Sagarin, and Pomeroy rankings were all highly correlated. Since the correlation coefficient was so large, using all of the ranking systems would provide only marginally more information than using just one; therefore, for the sake of simplicity, we opted to only use the Pomeroy rankings.
Fig.1
Plot comparing RPI, BPI, Pomeroy, and Sagarin.
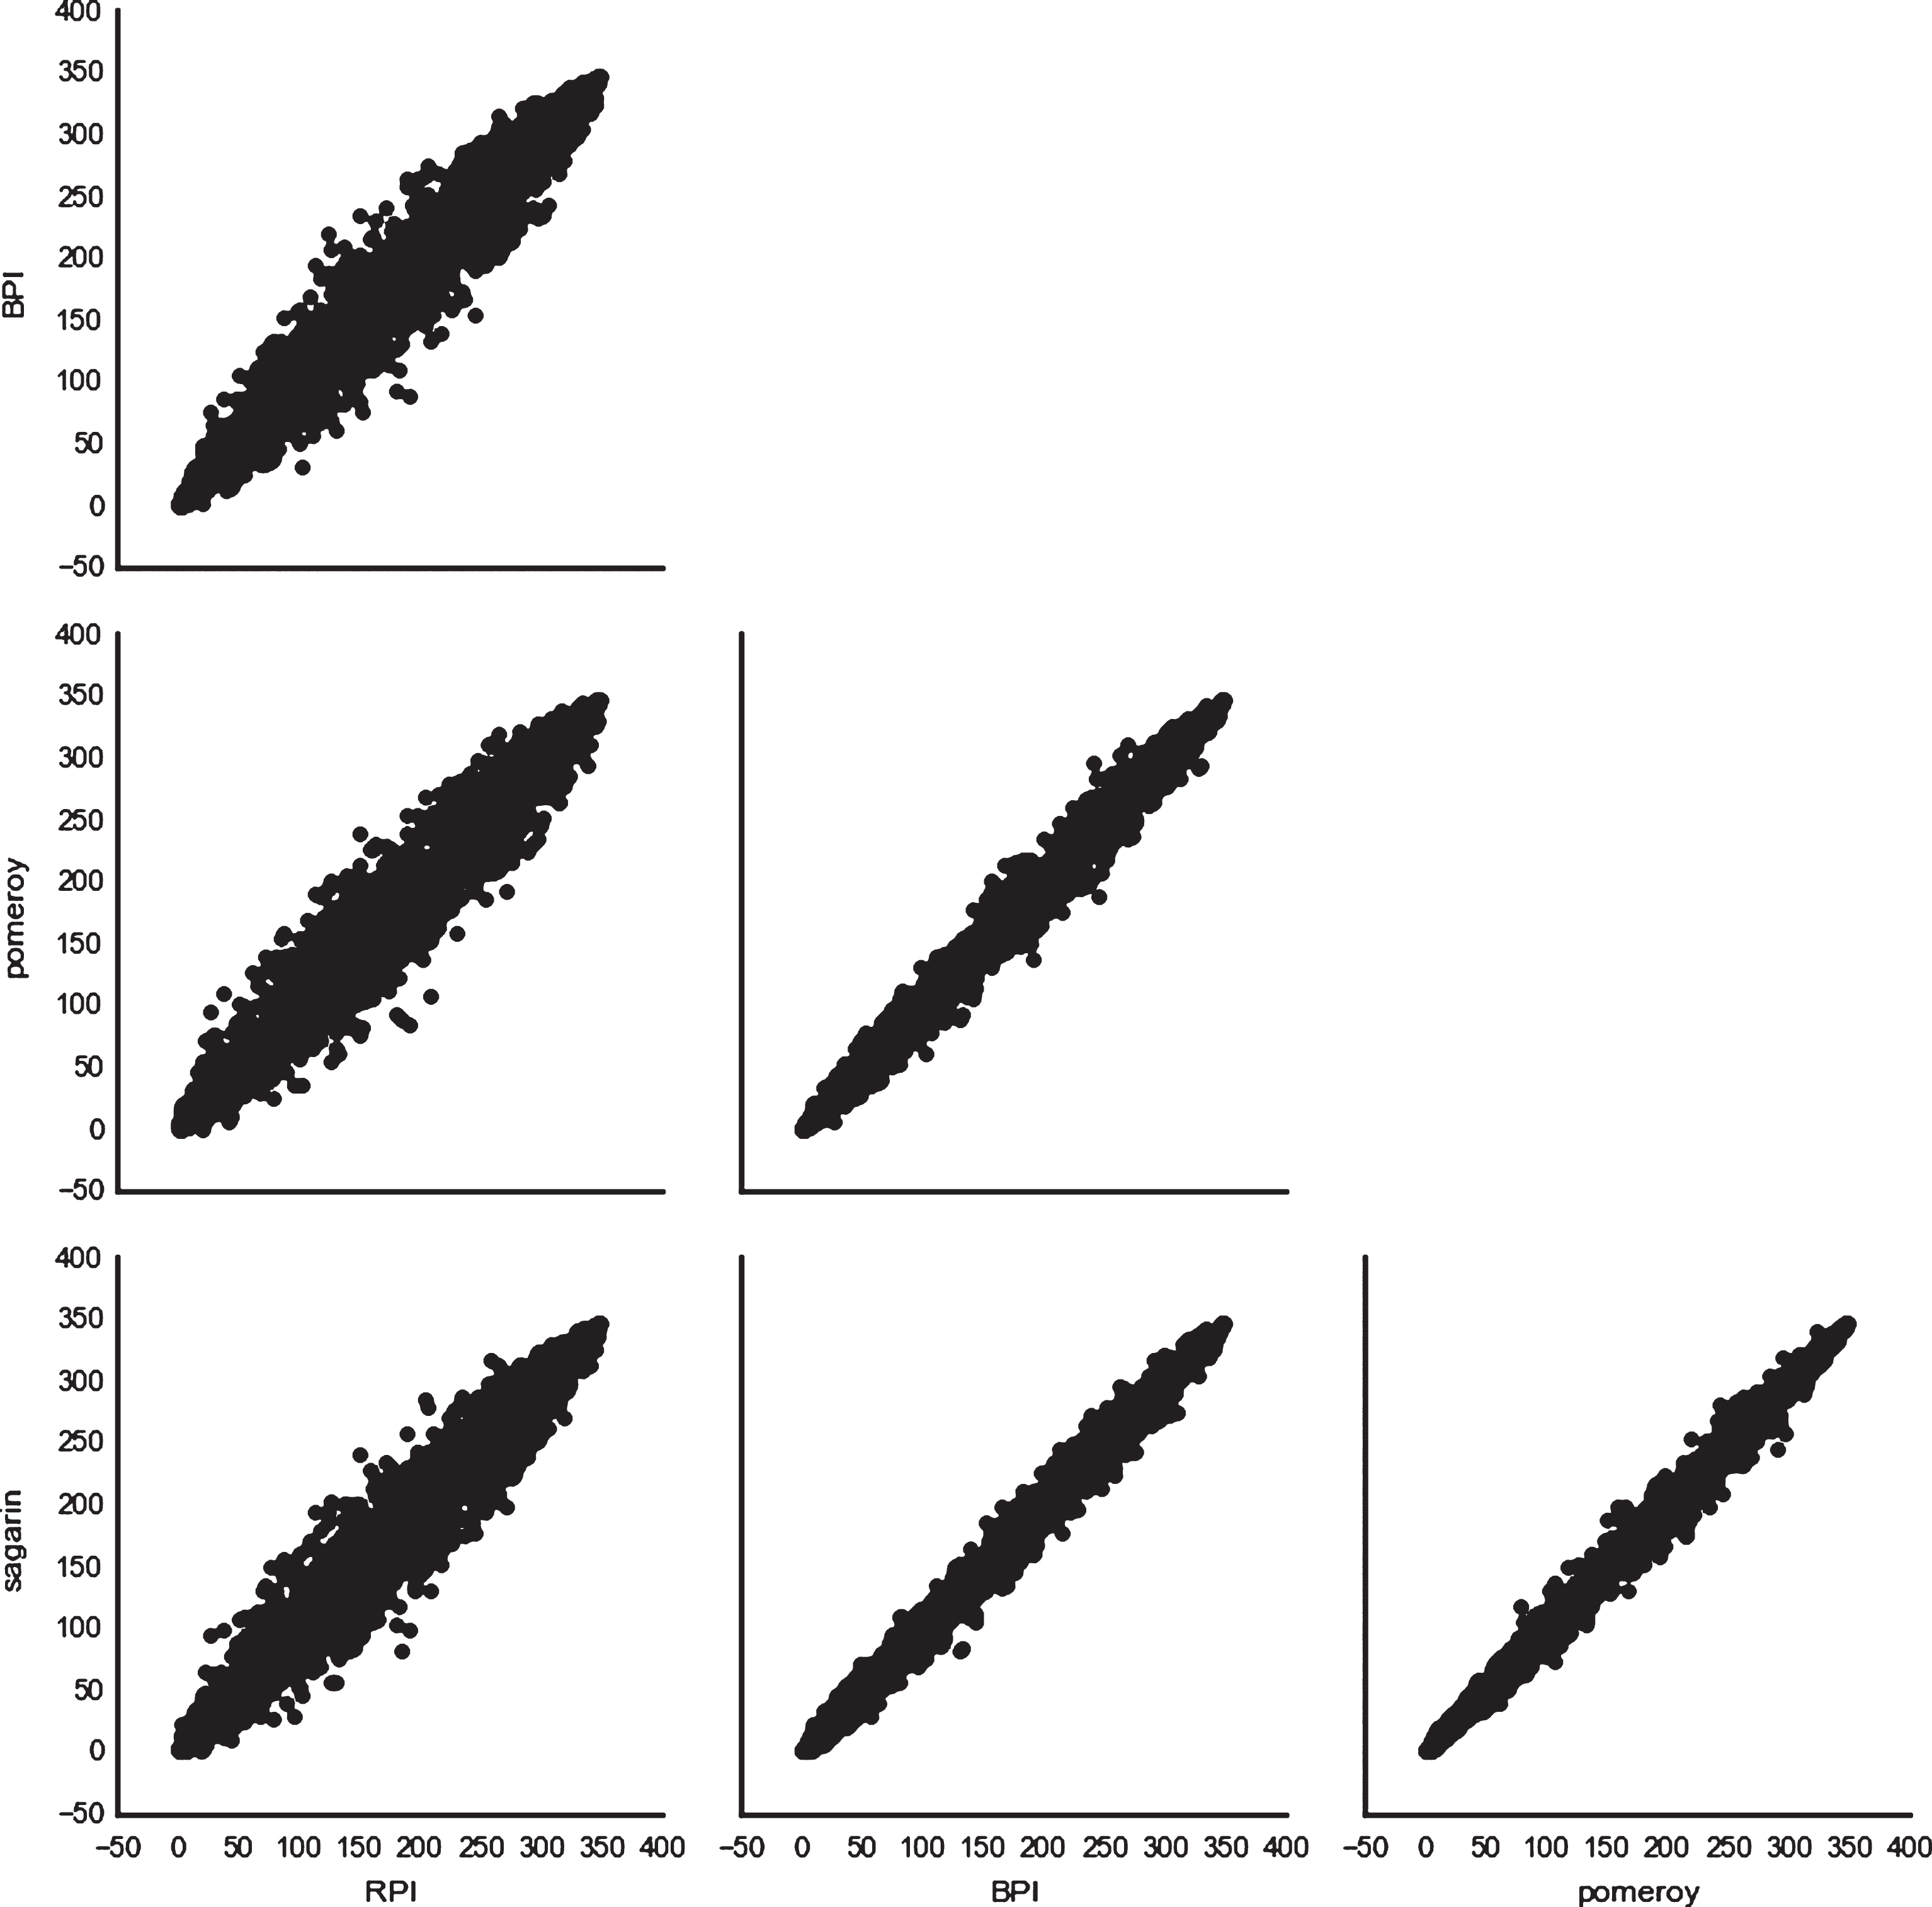
Table 1
Correlation between ranking systems
| RPI | BPI | Pomeroy | Sagarin | |
| RPI | ||||
| BPI | 0.967 | |||
| Pomeroy | 0.965 | 0.991 | ||
| Sagarin | 0.968 | 0.994 | 0.994 |
Choosing the relevant performance metrics to use was done by examining the statements made by the selection committee in the past. The metrics most frequently mentioned were the number of top 50 wins (wins against the teams with the 50 highest RPI values) (Katz, 2016), the number of 200+ losses (losses against teams with an RPI rank of more than 200), and the strength of schedule of each team (NCAA, 2016).
Through experimental results, we also included the number of games played against the top 100 teams and the record of the team in their last 12 games before the tournament. The intuition behind including the last 12 games is that a team that plays well during their most recent 12 games are more likely to look strong to a selection committee than a team who plays poorly in those last games. The number 12 was chosen because the last 12 games is a statistic tracked and provided by ESPN. The inclusion of recent games and games against the top 100 teams was decided by doing some data exploration. In particular, we looked at how those two statistics were correlated with tournament entry, and determined them to be worthy inclusions. There are other more performance-oriented variables that were briefly considered such as field goal percentage, three point percentage, etc., but we opted not to include those since we were able to build a reasonably accurate decision tree without them. We were also aiming to have our process resemble the actual process of the selection committee as closely as possible, and therefore aimed to use only statistics that the committee is known to use.
3.2Selecting tournament teams
Selecting the teams for the tournament was a two-step process. The first step was to evaluate the teams in a pair-wise fashion, thereby determining which team was stronger than which other teams. To do this, each team was compared to each other team in the same year, and the stronger of the two teams (according to our evaluation method) was given one victory. Then, the teams with the most pair-wise victories were chosen for the tournament.
The teams we used as candidates for tournament selection were the teams in the NCAA tournament with a seed of ten or higher who had been granted an at-large bid into the tournament and the one and two-seeded teams in the National Invitation Tournament (NIT), which is a tournament played by teams who were not granted entrance to the NCAA tournament. The best teams that played in the NIT should be a reasonable approximation for teams that were close to but did not get invited to the NCAA tournament. We used these teams because we decided to focus solely on the teams that may or may not make it into the tournament, rather than including the high-performing teams that are certain to make the tournament. These teams are those that the media typically classified as bubble teams, discussing their merits and deficiencies in the weeks leadin up to Selection Sunday. Note that high performing teams (i.e., teams who ended upbeing seeded No. 9 or better) compare favorably to the teams that we focused our analysis on, and hence, would be selected for the tournament based on our pairwise comparison process.
Our evaluation method for determining which team was the stronger of a given pair is modeled as a decision tree. The decision tree was created by experimenting with various combinations of factors that could model the selection process. The goal was to create a tree without relying on complex conditions, since increasingly complex conditions could result in the tree being less generalizable and applicable to future years. Also, since the tree is meant to mimic the process done by the selection committee, it seemed unlikely that the conditions should be complex. Although the resulting pairwise comparison could also be applied to teams that are safely in the tournament, we opted to narrow our focus to only include those teams in contention for an at-large bid. The full tree is shown in fig. 2, and the intuition behind the different conditions can be found in Table 2.
Fig.2
Tree to determine stronger of two teams.
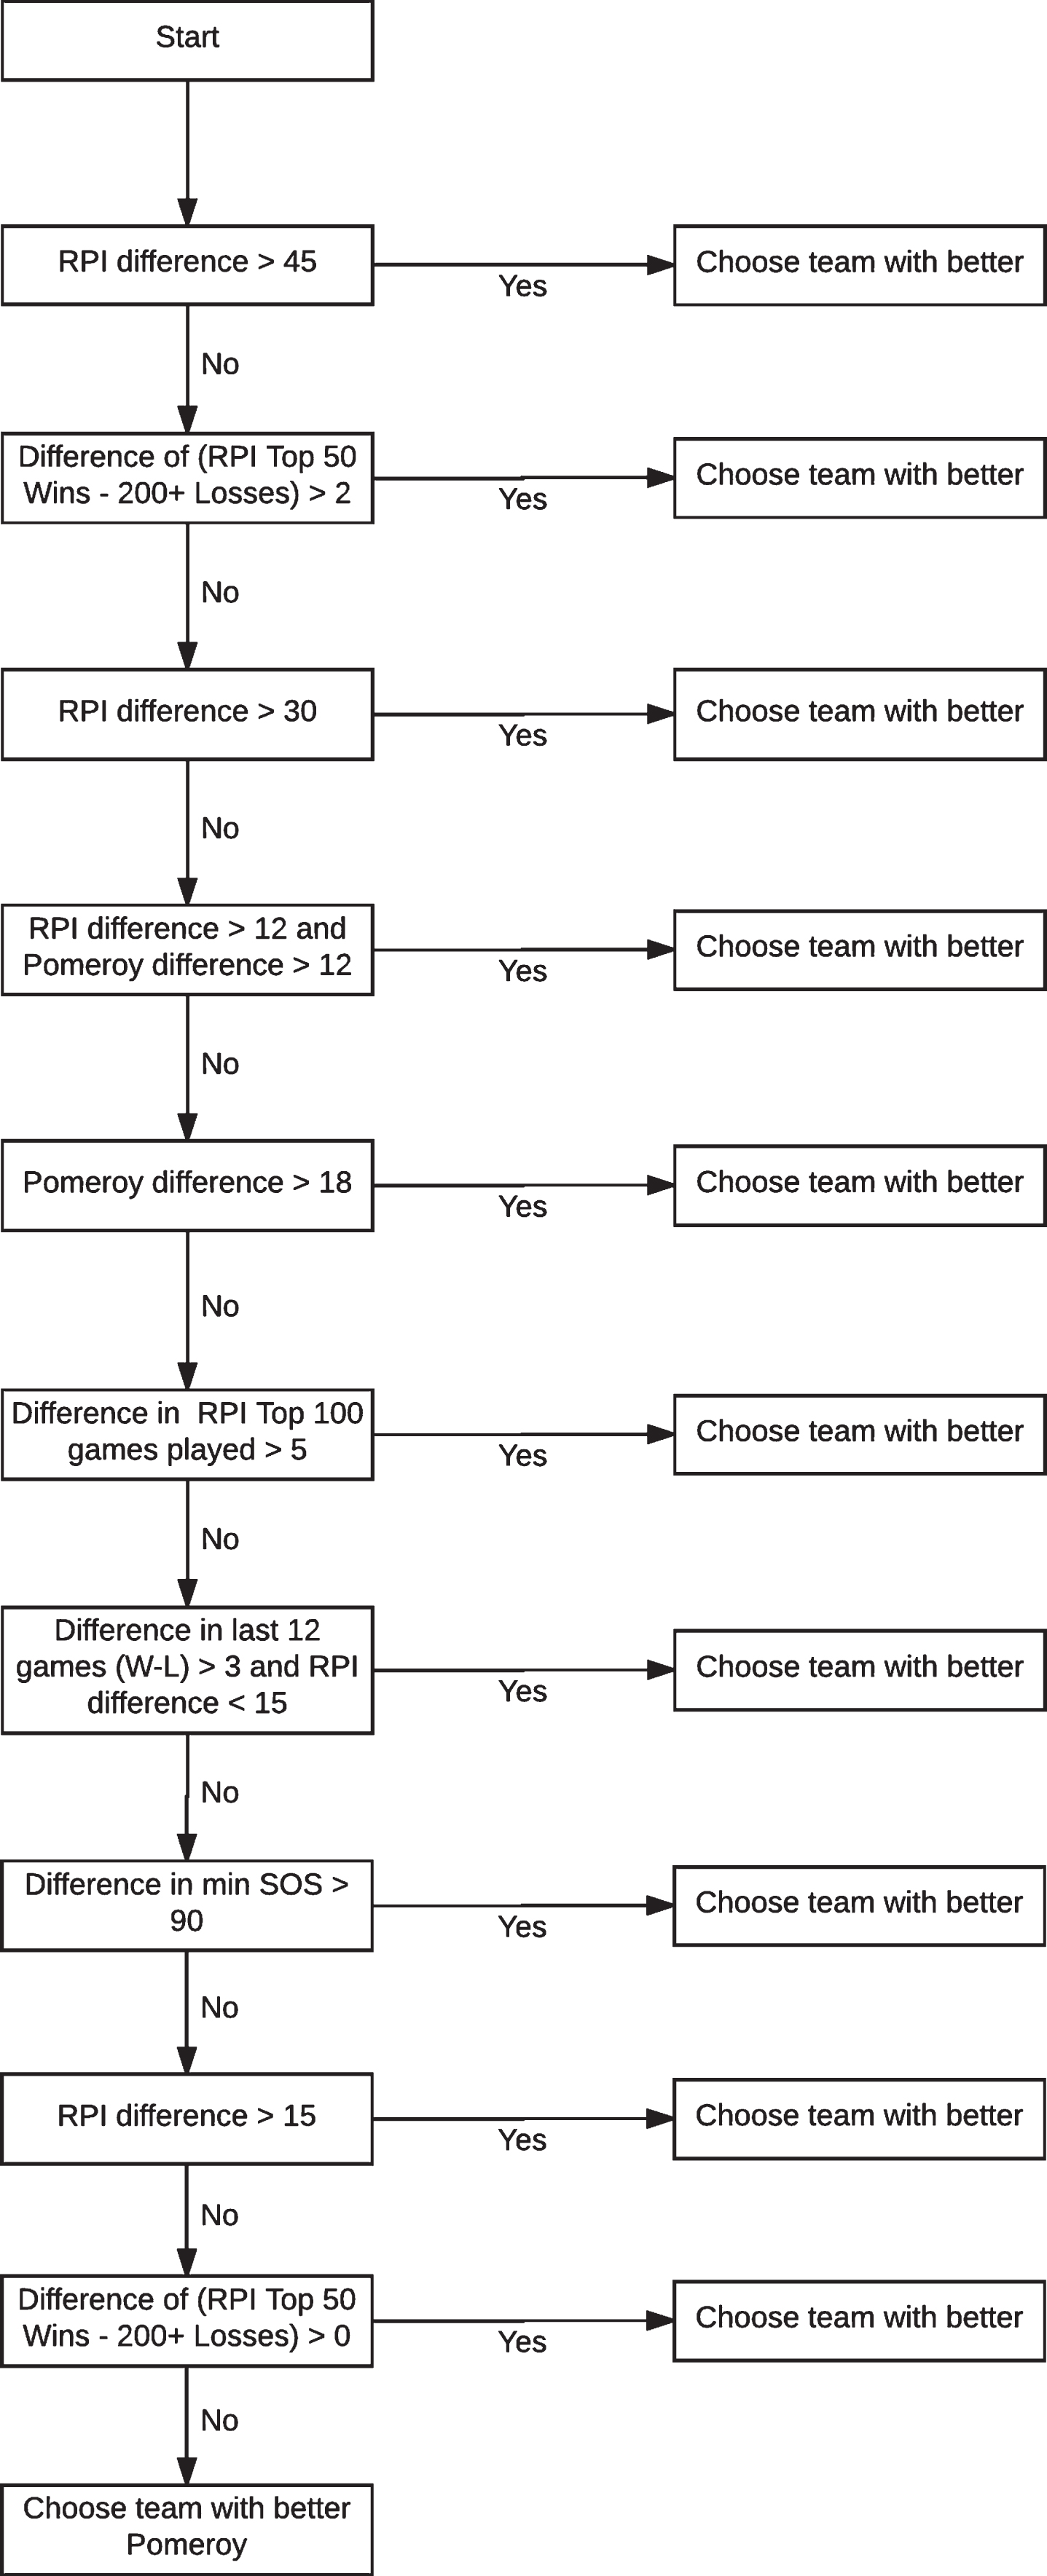
Table 2
Intuition behind criteria in our ranking decision tree
| Condition | Intuition |
| RPI difference > 45 | If one team has a much better RPI, choose that team |
| Difference of (RPI Top 50 Wins - 200+ Losses) > 2 | One top 50 win is negated by one 200+ loss. If one team has at least 2 more, pick that team |
| RPI difference > 30 | Same RPI condition with smaller threshold |
| RPI difference > 12 and Pomeroy difference > 12 | If one team has both a moderately better RPI and Pomeroy ranking, pick that team |
| Pomeroy difference > 18 | If one team has a moderately better Pomeroy ranking, pick that team |
| Difference in RPI Top 100 games played > 5 | If one team has played at least 5 more games against the top 100 teams, pick that team |
| Difference in last 12 games > 3 and RPI difference < 15 | If both teams have a similar RPI, pick the one that has done better in the past 12 games |
| Difference in min SOS > 90 | If one team has had a much stronger strength of schedule, pick that team |
| RPI difference > 15 | If one team has a moderately better RPI, pick that team |
| Difference of (RPI Top 50 Wins - 200+ Losses) > 0 | Same as the second condition, but with a lower threshold |
| Choose team with better Pomeroy | If a decision has not been made yet, default to the team with better Pomeroy rank |
Some of the data is preprocessed before being run through the tree. Instead of the raw strength of schedule value, we use the minimum of the strength of schedule and the non-conference strength of schedule (where a lower value indicates a stronger strength of schedule). A strong non-conference strength of schedule indicates a team that made an effort to play against strong teams despite being in a weak conference. However, the original strength of schedule is also included so as not to penalize teams in strong conferences who do not feel the need to look elsewhere for strong competition. Additionally, the RPI, strength of schedule, and Pomeroy rankings are converted to ordinal values by year instead of using the raw values. This way, we avoid inter-year variation in the values, since each team is ranked only against teams in the same year. Finally, the last 12 games of each team were combined into a single number, which was computed as the number of wins - the number of losses in those last 12 games. For example, A team with a 7–5 record in its last 12 games would be assigned a score of 7–5=2.
4Results
Evaluating the accuracy of the tree was done by attempting to select the correct teams for the tournament for the years 2012–2016. The teams selected for each year and their rank is given in Table 3–7.The tables show the teams we used, the rank our method assigned to each team, and their seed in the tournament if they were granted entrance. In each of the five years, our method allowed one team into the tournament that did not actually make the tournament, but selected all the others correctly.
Table 3
2012 Tournament Selections
| Predicted Selections | Predicted Non-Selections | |
| Actual Selections | 10 teams: | 1 team: |
| Texas | Iona | |
| Purdue | ||
| Xavier | ||
| South Florida | ||
| West Virginia | ||
| NC State | ||
| Virginia | ||
| California | ||
| Colorado State | ||
| BYU | ||
| Actual Non-Selections | 1 team: | 8 teams |
| Seton Hall |
Table 4
2013 Tournament Selections
| Predicted Selections | Predicted Non-Selections | |
| Actual Selections | 9 teams: | 1 team: |
| Colorado | Middle Tennessee | |
| Iowa State | ||
| Minnesota | ||
| California | ||
| Boise State | ||
| Cincinnati | ||
| Saint Mary’s | ||
| La Salle | ||
| Oklahoma | ||
| Actual Non-Selections | 1 team: | 11 teams |
| Baylor |
Table 5
2014 Tournament Selections
| Predicted Selections | Predicted Non-Selections | |
| Actual Selections | 8 teams: | 1 team: |
| Tennessee | NC State | |
| Dayton | ||
| Nebraska | ||
| Stanford | ||
| Arizona State | ||
| BYU | ||
| Iowa | ||
| Xavier | ||
| Actual Non-Selections | 1 team: | 11 teams |
| Florida State |
Table 6
2015 Tournament Selections
| Predicted Selections | Predicted Non-Selections | |
| Actual Selections | 9 teams: | 1 team: |
| Texas | Georgia | |
| Ohio State | ||
| UCLA | ||
| BYU | ||
| Indiana | ||
| Ole Miss | ||
| Davidson | ||
| Boise State | ||
| Dayton | ||
| Actual Non-Selections | 1 team: | 9 teams |
| Temple |
Table 7
2016 Tournament Selections
| Predicted Selections | Predicted Non-Selections | |
| Actual Selections | 7 teams: | 1 team: |
| Syracuse | Temple | |
| Vanderbilt | ||
| Wichita St | ||
| Michigan | ||
| Tulsa | ||
| Pittsburgh | ||
| VCU | ||
| Actual Non-Selections | 1 team: | 11 teams |
| Florida |
Some interesting observations can be made about the results. First, there was no single year where our method selected every team correctly. Whenever the method was adapted get every team right for a given year, it caused the other years to become significantly less accurate. Furthermore, some teams were entered into the tournament despite a seeming lack of foundation in the metrics used. Iona in 2012 is an example of this, with numbers that are far worse than other teams that were denied entrance to the tournament. This leads to the conclusion that the committee selection process is not an exact science - there seems to be some human factor involved that uses information outside the available numbers.
We can estimate which factors are most important to the committee by examining our decision tree. Factors used in a condition early on in the tree are more discriminatory, since they are able to operate with less prior information. In this tree, we can see that the RPI is highly distinguishing - it appears in two of the top three conditions. It is also implicitly present in the third one by virtue of the fact that top 50 and 200+ teams are determined by their RPI rank. Therefore, despite the statements fo the committee that RPI is not heavily used for selection, it seems to be either very important or a very good indicator. The RPI combined with the top 50 wins and 200+ losses seem to provide a strong indicator of whether a team will be in the tournament.
5Conclusion
In this paper we presented a decision-making method that would mimic the results of the selection committee. We found that we could provide a close approximation, but that the actual selection process seems to also rely on factors that cannot be easily explained by numbers. In particular, we tested our method over the years 2012–2016, and found that it selected all but one of the teams correctly each year. However, the remaining team was sometimes ranked far below others in our analysis.
One interesting avenue for future work would be to expand the method to incorporate seeding as well as selection. Here, we do not ascribe any value to the ranking of teams - they are either chosen for inclusion in the tournament or they are not. However, the real selection committee assigns each team a seed after the selection process is complete, so this would be a suitable addition to this method. Another possible area would be to incorporate more detailed information such as injury reports, further sources of expert opinion, etc. This would reduce the simplicity or the resultant model and therefore may be undesirable, but may also provide more accurate results. The largest gain, however, would come from more statements by the selection committee on exactly what information they use and value.
References
1 | Ezekowitz J. , (2013) . The RPI is Not the Real Predictive Indicator – The Harvard Sports Analysis Collective. https://harvardsportsanalysis.wordpress.com/2013/02/19/rpi-prediction/. (Visited on 06/16/2016). |
2 | Katz A. , (2016) . ESPN.com – Memphis would have bumped Tulsa with win, chairman says. http://espn.go.com/espn/print?id=14966925. (Visited on 06/16/2016). |
3 | NCAA, (2016) . March Madness bracket: How the 68 teams are selected for the Division I Men’s Basketball Tournament – NCAA.com. http://www.ncaa.com/news/basketball-men/article/2016-03-13/march-madness-bracket-how-68-teams-are-selected-division-i. (Visited on 06/16/2016). |
4 | Oliver D. , (2013) . BPI –The College Basketball Power Index explained. http://espn.go.com/mens-college-basketball/story/_/id/7561413/bpi-college-basketball-power-index-explained. (Visited on 08/29/2015). |
5 | Pomeroy K. , (2011) . Basketball RPI: Why it’s a lousy way to pick teams for the NCAA Tournament. http://www.slate.com/articles/sports/sports_nut/2011/03/ratings_madness.html. (Visited on 06/16/2016). |
6 | Pomeroy K. , (2012) . The kenpom.com blog. http://kenpom.com/blog/index.php/weblog/entry/ratings_glossary. (Visited on 08/29/2015). |
7 | Stephens M. , (2015) . NCAA tournament makes example of Colorado State by saying RPI no longer important. http://www.coloradoan.com/story/sports/csu/mens-basketball/2015/03/15/colorado-state-ncaa-tournament-rpi/24829067/. (Visited on 06/16/2016). |


