
Matchup models for the probability of a ground ball and a ground ball hit
Abstract
We develop matchup models for the probability of a ground ball and a ground ball hit using twelve years of major league baseball play-by-play data. The models are based on player descriptors that can be estimated reliably from small samples which facilitates the use of the models for prediction. The model for ground ball probability is obtained by generalizing the log5 model to include both ground ball and strikeout rates for the batter and pitcher. A strikeout rate cross term is shown to be significant in this model which leads to regions of the matchup space, termed matched and mismatched Krate configurations, where either the batter or pitcher is favored relative to the log5 prediction. We also build a model for the probability that a ground ball becomes a hit which separates the contributions of the batter, pitcher, and defense. We show that this probability has a strong dependence on the pitcher’s ground ball and strikeout rates and that the structure of this dependence changes with the platoon configuration. We give a physical justification for the model and provide examples of pitchers with characteristics that significantly lower or raise their expected ground ball hit rates. The new models for the probability of a ground ball and a ground ball hit are tested on out-of-sample data and shown to provide more accurate predictions than alternative models.
1Introduction
The ability to predict the distribution of outcomes for a batter/pitcher matchup in baseball is useful for informing roster construction and player usage decisions (Koo, 2013). The historical samples that are available for a particular batter/pitcher matchup, however, are typically too small to support accurate prediction (Fox, 2005a) (Stern and Sugano, 2007) (Tango et al., 2007). An alternative approach is to develop predictive models that are based on characteristics of the batter and pitcher. James (1983) with Adams introduced the log5 model that predicts the probability of a binary outcome for a confrontation between two players as a function of the outcome rates for the players and for the environment. The log5 model, which is also known as the James function, has a number of desirable properties (Hammond et al., 2015) and has been used for many years to model the probability of outcomes in baseball (Carleton, 2009) (Fox, 2005b) (Levitt, 1999). It was recently shown using nearly one million observations that the log5 model accurately predicts the probability of a strikeout for a matchup and that incorporating additional explanatory variables can be used to improve the accuracy of the model (Healey, 2015).
About thirty-two percent of batter/pitcher matchups in major league baseball in 2014 resulted in a ground ball. The expected run value of a ground ball is significantly less than the average run value for a matchup in general which makes this outcome a desirable result for a pitcher (Murphy, 2015). Both batters and pitchers have a significant influence on the probability that a confrontation ends with a ground ball. Batters with uppercut swings, for example, will tend to hit fewer ground balls than batters with flatter swings. On the other hand, pitchers who specialize in offerings that are thrown in the lower part of the strike zone with downward movement will tend to induce more ground balls than other pitchers (Lependorf, 2013). Ground ball rates also depend on the platoon configuration for a matchup which is defined by the handedness (left or right) of the batter and pitcher. The ability of batters and pitchers to hit and induce ground balls is a repeatable skill and studies have shown that batter and pitcher ground ball rates can be estimated reliably using small samples (Carleton, 2012) (Carleton, 2013).
We will use twelve years of major league play-by-play data to develop a model for the probability of a ground ball for a batter/pitcher matchup. Starting from the log5 model which utilizes the batter and pitcher ground ball rates, we show that an additional strikeout rate cross term is highly significant for all four platoon configurations. This cross term leads to regions of the matchup space that have a significantly higher or lower probability of a ground ball than the standard log5 prediction. These regions occur when the batter and pitcher ground ball rates deviate significantly from the league average. This is consistent with the work of Morey and Cohen (2015) who also observed differences between log5 estimates and the outcome of simulations for cases where batter and pitcher rates deviate from league averages. We define matched Krate configurations for which ground balls are less likely than log5 predicts and, in addition, we present evidence that these configurations also lead to fewer strikeouts. Thus, matched Krate configurations are favorable for batters for these outcomes. Similarly, we define mismatched Krate configurations which have the opposite property. The new model is evaluated on out-of-sample data.
We will also build a model for the probability that a ground ball becomes a hit. Several researchers have studied the variables that affect the probability that a batted ball in general becomes a hit with particular attention devoted to the influence of the pitcher. McCracken (2001) postulated that there was little, if any, difference in the ability of major league pitchers to affect opponent batting average on batted balls in the field of play (BABIP). While this assertion provided a useful approximation, subsequent research showed that this claim was not strictly correct. Tippett (2003) concluded that a pitcher’s influence on BABIP is significant. He observed, for example, that pitchers with a high strikeout rate tend to allow a lower BABIP which has been confirmed by several subsequent studies (Bradbury, 2005) (Swartz, 2010a). Lichtman (2004) showed that pitchers have considerable control over their ground ball rate which impacts BABIP since ground balls become hits more often than fly balls. Swartz (2010b) used additional data to confirm this conclusion and to further quantify the dependence of BABIP on a pitcher’s ground ball rate. Lichtman (2004) had also speculated that pitchers might be able to control how hard a ball is hit and suggested the use of batted ball speed to investigate this hypothesis. Several years later, HITf/x data (Jensen, 2009) which provides estimates of the speed and direction of batted balls became available. In a 2011 study, Fast (2011a) used HITf/x measurements to show that both batters and pitchers influence the speed of a batted ball in the plane of the playing field and that batters control a larger share of the variance. He also showed (Fast, 2011b) that this speed has a strong correlation with the likelihood that a batted ball becomes a hit. Thus, batters and pitchers can influence their BABIP by affecting both the vertical launch angle and the speed of batted balls. The probability that a batted ball becomes a hit also depends on the defensive ability of the team in the field since defenders with greater range will typically allow fewer hits over a given distribution of batted balls.
In this paper, we will develop a predictive model for the probability that a ground ball results in a hit for a batter/pitcher matchup. Log5 is not a useful starting point for this model since the required batter and pitcher ground ball batting averages cannot be estimated reliably using small samples (Carleton, 2012) (Carleton, 2013). Instead, we use alternative explanatory variables in a binary logit model. We show that the probability that a ground ball becomes a hit depends on the platoon configuration and that, for most regions of the parameter space, is negatively correlated with the pitcher’s ground ball and strikeout rates. We also quantify the impact of the pitcher’s infield defense and the running speed of the batter. Our results build on Swartz’s (2010b) analysis of ground ball pitchers and on Lederer’s (2009) observations regarding the variables that impact ground ball BABIP. We present a physical justification for the model that is based on Cartwright’s (2012) analysis of HITf/x data. The model is also tested on out-of-sample data.
2Matchup Models
2.1Binary Logit Model
A logit model is often used to characterize the probability of a result in a binary experiment as a function of a set of explanatory variables. We will use this model to represent the probability of a groundball and its outcome in a matchup between a batter and a pitcher. If we let E represent the probability of a ground ball for a matchup, then the logit model takes the form
(1)
where x1, x2, …, xn are the explanatory variables and the logistic function
(2)
ensures that the probability E is between 0 and 1. Several authors including Wooldridge (2013) provide a more detailed description of the logit and related models.
2.2Log5 Model
The log5 model (James, 1983) is a standard technique for representing the probability of an outcome in a binary experiment and has been widely used to describe matchups in sports. For our application, we denote the league, batter, and pitcher ground ball rates by L, B, and P with corresponding odds ratios Lo = L/(1 - L) , Bo = B/(1 - B) , and Po = P/(1 - P) . The log5 probability E* of a ground ball for a matchup between a batter and a pitcher satisfies (Healey, 2015)
(3)
and, therefore, the log5 model is a special case of the logit model in (1) with n = 2, c = - ln(Lo) , c1 = 1.0, x1 = ln(Bo) , c2 = 1.0, and x2 = ln(Po) . The mathematical properties of the log5 model have been examined in detail (Hammond et al., 2015).
3Modeling the Probability of a Ground Ball
3.1Player Descriptors
We will investigate models in the form of equation (1) for predicting the probability of a ground ball. A first step is to establish a set of descriptors for batters and pitchers that can be used to derive the model explanatory variables. Carleton (2012, 2013) showed that strikeout rate and ground ball rate reach a high reliability at smaller sample sizes than are required for other candidate player descriptor variables. This enables these rates to be estimated reliably for many players using only the observations within a single platoon configuration for a single season. For this reason, batter and pitcher strikeout and ground ball rates will be used to define the model explanatory variables.
Player descriptors will be computed using Retrosheet play-by-play data. Since the information required to compute ground ball rates has only been recorded since 2003, our analysis will consider matchups in major league baseball over the years from 2003 to 2014. Before player descriptors are computed, we remove all plate appearances that resulted in a bunt or an intentional walk and we also remove all plate appearances with a pitcher as a batter. Adjusted plate appearances refer to plate appearance totals after this removal of bunts, intentional walks, and pitchers as batters. For both batters and pitchers, strikeout rate is defined as strikeouts divided by adjusted plate appearances and ground ball rate is defined as ground balls divided by adjusted plate appearances. We note that ground ball rate is often defined as the ratio of ground balls to balls in play, but we instead use adjusted plate appearances in the denominator for consistency with the log5 model.
Strikeout and ground ball rates vary from season to season and also depend on the platoon configuration. Figure 1 shows that strikeout rates have been increasing since 2003 and that rates tend to be higher for same-sided platoon configurations (LHP vs LHB and RHP vs RHB). Figure 2 shows that ground ball rates decreased from 2003 to 2009 but have increased from 2009 to 2014. In addition, same-sided configurations have led to higher ground ball rates over the last few years. We will represent each player and the league using separate strikeout and ground ball rates for each year and for each platoon configuration. Table 1, for example, gives the individual player descriptors for switch-hitter Victor Martinez and right-handed pitcher Felix Hernandez for the 2014 season.
Fig.1
League average strikeout rate.
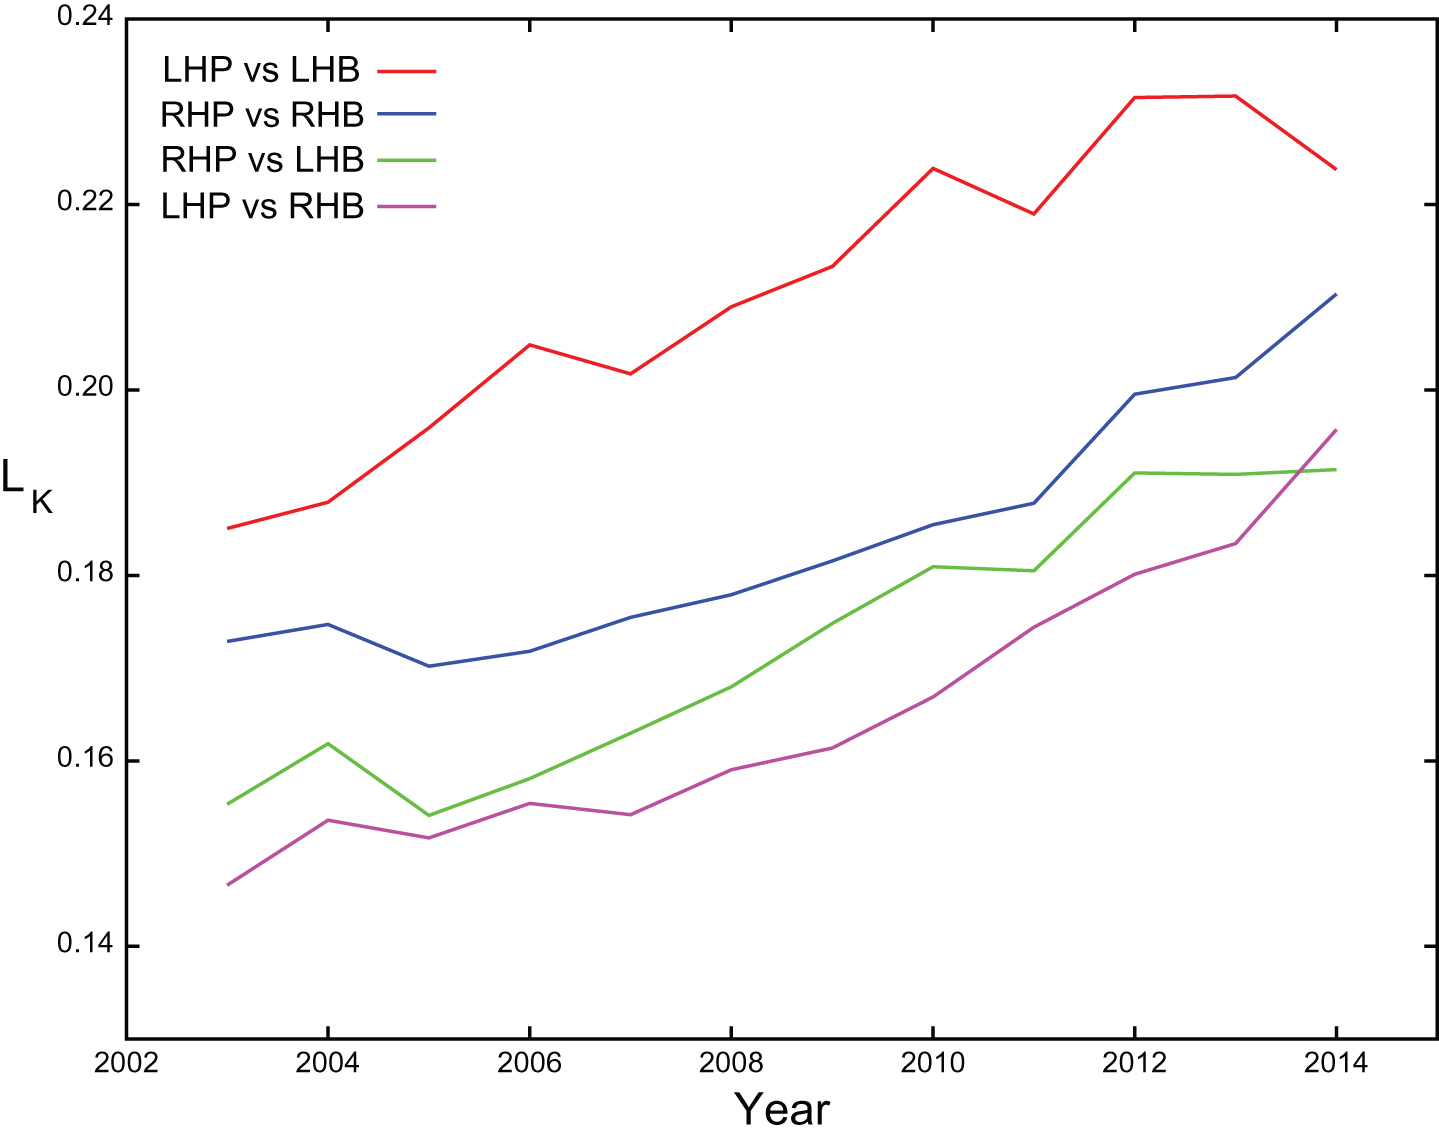
Fig.2
League average ground ball rate.
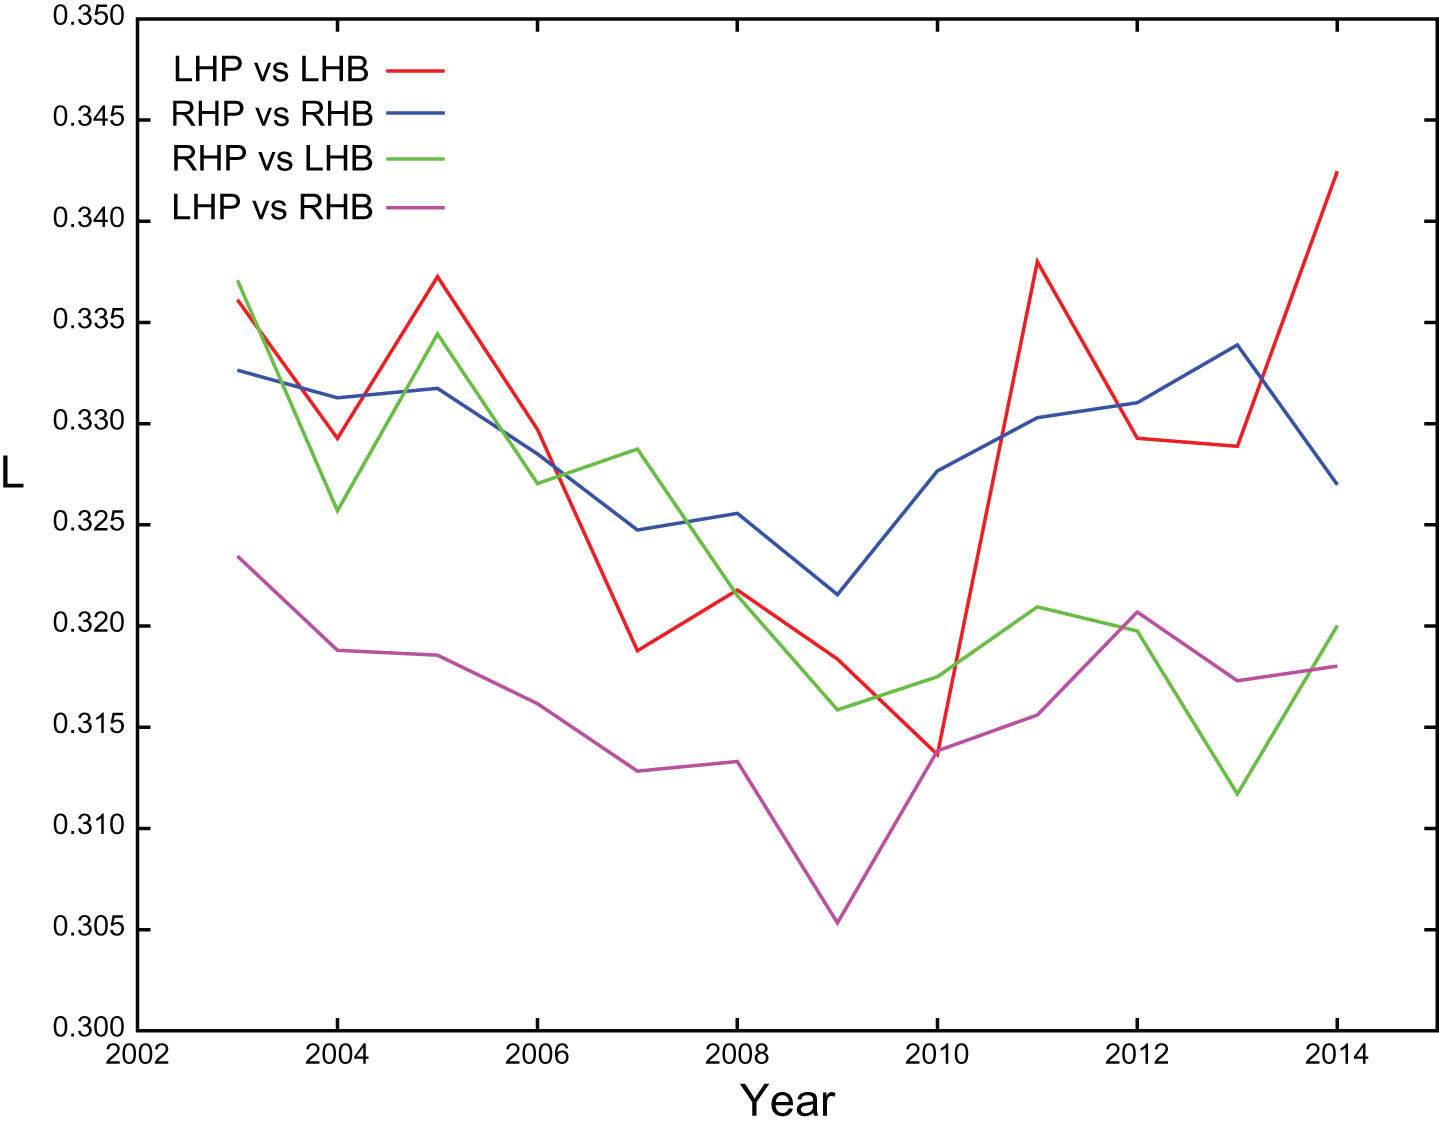
Table 1
Player descriptors for switch-hitter Victor Martinez and right-handed pitcher Felix Hernandez for 2014
| Player Name | Role | Year | Configuration | SO Rate | GB Rate |
| Victor Martinez | Batter | 2014 | RHP vs LHB | 0.060738 | 0.379610 |
| Victor Martinez | Batter | 2014 | LHP vs RHB | 0.092105 | 0.302632 |
| Felix Hernandez | Pitcher | 2014 | RHP vs RHB | 0.296588 | 0.375328 |
| Felix Hernandez | Pitcher | 2014 | RHP vs LHB | 0.257198 | 0.383877 |
3.2Logistic Regression
Following previous work (Healey, 2015), player descriptors for a batter or pitcher will be regarded as reliable if the player amassed at least 150 adjusted plate appearances for a year and platoon configuration. Thus, the data set for analysis will include every plate appearance from 2003 to 2014 except bunts, intentional walks, and pitchers as batters for which reliable player descriptors are available for both the batter and pitcher for the year and platoon configuration. Table 2 summarizes the total number of plate appearances for each platoon configuration thatsatisfy these criteria.
Table 2
Number of observations used for each platoon configuration over the years 2003 to 2014
| LHP vs LHB | LHP vs RHB | RHP vs LHB | RHP vs RHB |
| 25945 | 133351 | 444797 | 480101 |
Using the set of plate appearance observations for a platoon configuration, logistic regression can be used to recover the associated logit model for a set of explanatory variables. We evaluated models that included all combinations of log odds ratio and linear terms with cross terms in ground ball and strikeout rates. The model with the most significant variables is given by
(4)
where Lo, Bo, and Po are the odds ratios of the league, batter, and pitcher ground ball rates L, B, and P for the year and platoon configuration and
(5)
where BK, PK, and LK are the strikeout rates for the batter, pitcher, and league for the year and platoon configuration. Equation (4) uses the same explanatory variables as the log5 model in equation (3) with the additional strikeout rate cross term
Tables 3, 4, 5, and 6 present the results of the logistic regression for each of the four platoon configurations. Each table contains the coefficients (c0, c1, c2, c3) , standard errors, z-statistics, andp-values that result when using the log5 coefficient values (c0 = -1.0, c1 = 1.0, c2 = 1.0, c3 = 0.0) as the null hypothesis. We see that the c0, c1, and c2 coefficient values are close to the log5 values and that the p-values for these coefficients are all above 0.05 except for the c1 coefficient for the RHP versus RHB configuration. Since the null hypothesis includes the log5 coefficient values for c0, c1, and c2, the p-values indicate that we can accept the standard log5 coefficient values for eleven of the twelve cases and use the slightly larger value of 1.028248 for c1 for the RHP versus RHB configuration. In addition, the cross term
Table 3
Binary logit output, LHP versus LHB, 25945 observations
| Variable | Description | Coefficient | Std. Error | z-Statistic | p-value |
| ln(Lo) | log odds league GB rate | -1.001387 | 0.059800 | -0.023185 | 0.9815 |
| ln(Bo) | log odds batter GB rate | 1.010243 | 0.036774 | 0.278543 | 0.7806 |
| ln(Po) | log odds pitcher GB rate | 1.017145 | 0.048937 | 0.350338 | 0.7261 |
|
| (batter SO rate)*(pitcher SO rate) | -11.77256 | 3.718200 | -3.166198 | 0.0015 |
Table 4
Binary logit output, LHP versus RHB, 133351 observations
| Variable | Description | Coefficient | Std. Error | z-Statistic | p-value |
| ln(Lo) | log odds league GB rate | -0.989104 | 0.030083 | 0.362200 | 0.7172 |
| ln(Bo) | log odds batter GB rate | 1.014524 | 0.019649 | 0.739164 | 0.4598 |
| ln(Po) | log odds pitcher GB rate | 0.969426 | 0.022077 | -1.384855 | 0.1661 |
|
| (batter SO rate)*(pitcher SO rate) | -10.97408 | 2.227715 | -4.926160 | 0.0000 |
Table 5
Binary logit output, RHP versus LHB, 444797 observations
| Variable | Description | Coefficient | Std. Error | z-Statistic | p-value |
| ln(Lo) | log odds league GB rate | -1.019780 | 0.015758 | -1.255232 | 0.2094 |
| ln(Bo) | log odds batter GB rate | 1.018485 | 0.010419 | 1.774115 | 0.0760 |
| ln(Po) | log odds pitcher GB rate | 1.001088 | 0.011290 | 0.096368 | 0.9232 |
|
| (batter SO rate)*(pitcher SO rate) | -8.174651 | 1.203490 | -6.792453 | 0.0000 |
Table 6
Binary logit output, RHP versus RHB, 480101 observations
| Variable | Description | Coefficient | Std. Error | z-Statistic | p-value |
| ln(Lo) | log odds league GB rate | -1.018437 | 0.014757 | -1.249335 | 0.2115 |
| ln(Bo) | log odds batter GB rate | 1.028248 | 0.010912 | 2.588642 | 0.0096 |
| ln(Po) | log odds pitcher GB rate | 0.993906 | 0.009630 | -0.632851 | 0.5268 |
|
| (batter SO rate)*(pitcher SO rate) | -5.030661 | 1.056461 | -4.761803 | 0.0000 |
The strikeout rate cross term is the primary difference between the four-variable model E in equation (4) and the log5 model E* in equation (3). Let D = E - E* be the difference between the models for a plate appearance observation. Table 7 presents the mean and maximum values of |D| over all of the plate appearance observations that were used to build the models in Tables 3, 4, 5, and 6. The largest differences exceed seven percent in predicted ground ball probability.
Table 7
Mean and maximum of absolute difference between 4-variable model and log5
| Pit_Hand | Bat_Hand | Observations | Mean(|D|) | Max(|D|) |
| Left | Left | 25945 | 0.007668 | 0.074980 |
| Left | Right | 133351 | 0.004667 | 0.073378 |
| Right | Left | 444797 | 0.003206 | 0.050879 |
| Right | Right | 480101 | 0.002576 | 0.046752 |
3.3Matched and Mismatched Krate configurations
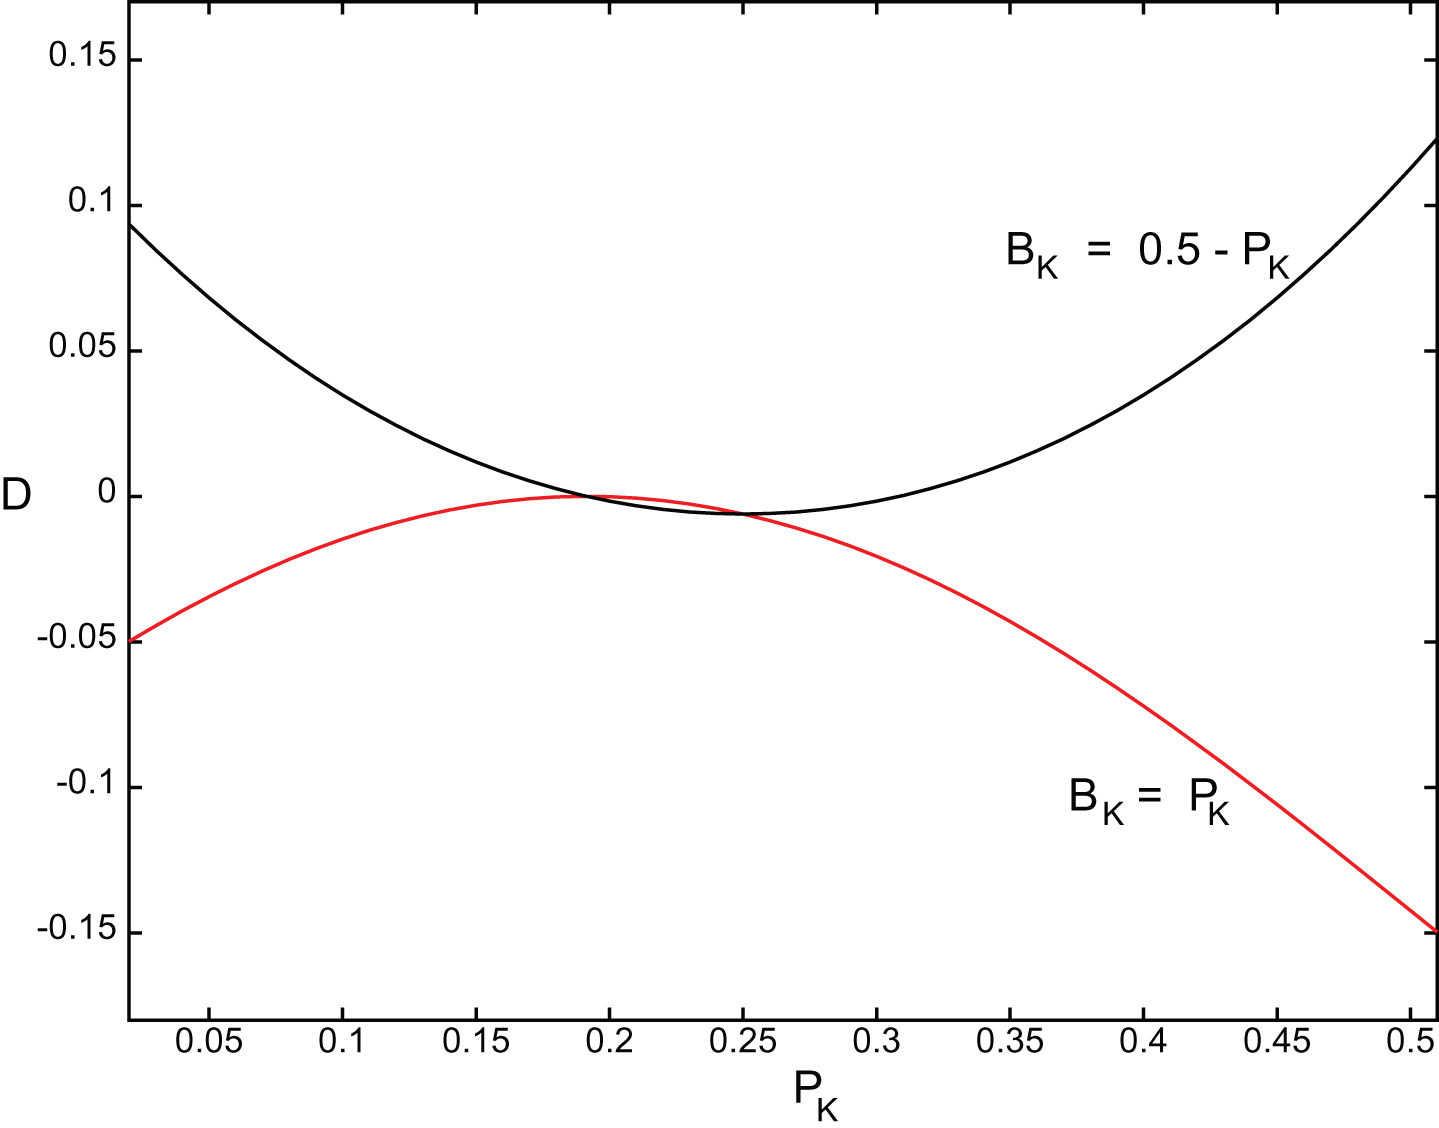
Figures 3 and 4 allow us to examine the differences between E and E* as a function of the batter and pitcher strikeout rates. Figure 3 plots the D = E - E* surface as a function of BK and PK for the RHP versus LHB configuration for 2014 (LK = 0.191) with the batter and pitcher ground ball rates set to the league average (B = P = L = 0.320) for this configuration. The shape of the surface will be similar for the other platoon configurations with the degree of curvature dependent on the size of the c3 coefficient. We will refer to matchups for which BK and PK are both significantly below or both significantly above the mean LK as matched Krate configurations. We will refer to matchups for which BK and PK are both significantly different from the mean LK but are on different sides of LK as mismatched Krate configurations. Figure 4 shows the structure of the surface along the two orthogonal directions BK = PK and BK = 0.5 - PK . The BK = PK curve shows that for matched Krate configurations we will see fewer ground balls than log5 predicts. The BK = 0.5 - PK curve shows that for mismatched Krate configurations we will see more ground balls than log5 predicts. The structure of this surface may result from the way that the interaction between the distribution of pitches and swings changes as pitcher and batter strikeout rates change.
Fig.3
E - E* surface for RHP versus LHB, 2014, (B = P = L).
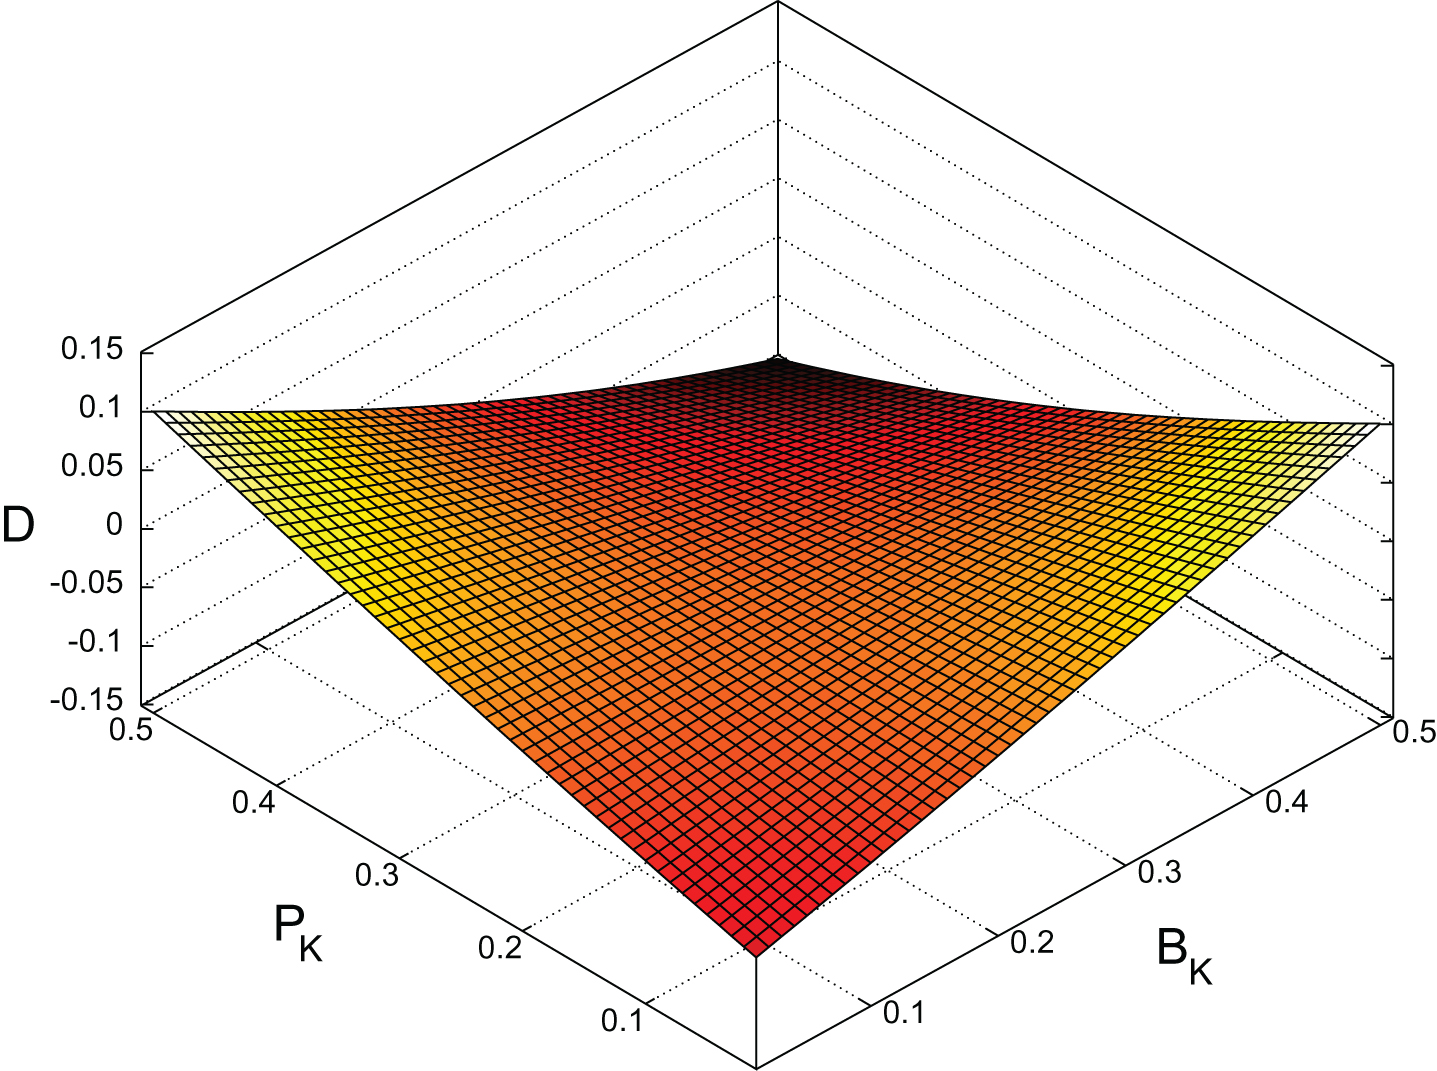
Fig.4
One-dimensional slices of E - E* surface (RHP versus LHB, 2014).
3.4The Aoki, Kershaw, and Diamond Example
As an example of the difference between the log5 model and the four-variable model of equation (4), we consider the case of left-handed batter Nori Aoki against left-handed pitchers Clayton Kershaw and Scott Diamond in 2013. The strikeout and ground ball rates for the three players are shown in Table 8 and the league average ground ball and strikeout rates for this year and configuration are L = 0.329 and LK = 0.232 . We see that the Aoki/Kershaw matchup is a mismatched Krate configuration while the Aoki/Diamond matchup is a matched Krate configuration. Since Diamond’s ground ball rate is significantly higher than Kershaw’s, the log5 ground ball probability for Aoki/Diamond (E* = 0.622854) is significantly higher than for Aoki/Kershaw(E* = 0.494198) . However, since Aoki has a low strikeout rate and Kershaw and Diamond have high and low strikeout rates respectively, the strikeout rate cross term will have a significant impact on these matchups. Table 9 shows that the predicted ground ball probability E using equation (4) is significantly different from E* for both matchups and that E is actually higher for Aoki/Kershaw than for Aoki/Diamond. Thus, even though Aoki/Diamond has a log5 ground ball probability that is about 0.129 higher than for Aoki/Kershaw, the inclusion of the strikeout rate cross term in the model results in a higher predicted ground ball probability for Aoki/Kershaw.
Table 8
Player descriptors for Nori Aoki, Clayton Kershaw, and Scott Diamond for 2013
| Player Name | Role | Year | Configuration | SO Rate | GB Rate |
| Nori Aoki | Batter | 2013 | LHP vs LHB | 0.058824 | 0.604278 |
| Clayton Kershaw | Pitcher | 2013 | LHP vs LHB | 0.387097 | 0.238710 |
| Scott Diamond | Pitcher | 2013 | LHP vs LHB | 0.124183 | 0.346405 |
Table 9
Comparison of 4-variable model and log5 for LHP vs. LHB matchups for 2013
| Matchup | 4-variable model | log5 | Difference |
| Aoki vs. Kershaw | 0.569178 | 0.494198 | 0.074980 |
| Aoki vs. Diamond | 0.568888 | 0.622854 | -0.053966 |
3.5Do More Ground Balls Mean Fewer Strikeouts?
Since pitchers induce more ground balls for mismatched Krate configurations than the log5 model predicts, we might reasonably ask whether these additional ground balls come at the expense of fewer strikeouts. We can answer this question by considering a model for strikeout probability EK of the form
(6)
where LKo, BKo, and PKo are the odds ratios of LK, BK, and PK . This model uses the same explanatory variables as log5 for predicting strikeout probability but includes the additional strikeout rate cross term
Tables 10 and 11 present the results of the logistic regression for EK for the RHP versus LHB and RHP versus RHB platoon configurations. The
In summary, the
Table 10
Binary logit output, RHP versus LHB, 444797 observations
| Variable | Description | Coefficient | Std. Error | z-Statistic | p-value |
| ln(LKo) | log odds league strikeout rate | -1.017762 | 0.016340 | -1.087001 | 0.2770 |
| ln(BKo) | log odds batter strikeout rate | 1.022494 | 0.010673 | 2.107479 | 0.0351 |
| ln(PKo) | log odds pitcher strikeout rate | 0.990792 | 0.011804 | -0.780076 | 0.4353 |
|
| (batter SO rate)*(pitcher SO rate) | -1.736038 | 1.459464 | -1.189504 | 0.2342 |
Table 11
Binary logit output, RHP versus RHB, 480101 observations
| Variable | Description | Coefficient | Std. Error | z-Statistic | p-value |
| ln(LKo) | log odds league strikeout rate | -1.010867 | 0.015366 | -0.707269 | 0.4794 |
| ln(BKo) | log odds batter strikeout rate | 1.012229 | 0.010118 | 1.208602 | 0.2268 |
| ln(PKo) | log odds pitcher strikeout rate | 0.993737 | 0.010932 | -0.572909 | 0.5667 |
|
| (batter SO rate)*(pitcher SO rate) | -2.272633 | 1.224326 | -1.856232 | 0.0634 |
3.6Utility for Out-of-Sample Prediction
We also evaluated the use of the new model for the analysis of out-of-sample data. For this purpose, we used the ground ball rates L, B, P and the strikeout rates LK, BK, PK observed in 2014 along with the model presented in Tables 3–6 which was derived using 2003-2014 data to predict the probability of outcomes in 2015. We considered all 2015 matchups which involve a batter and pitcher for which the rates estimated for 2014 were deemed reliable according to the criteria described in section 3.2. Let
Table 12 compares the three models. We see that the 4-variable model has a larger log-likelihood than log5 for each platoon configuration. We also see that both models perform significantly better than the baseline model which assigns the league average prediction to each matchup. The differences in the log-likelihood for the models can be used to compute a p-value for the use of the 4-variable model over the 3-variable model for this out-of-sample data. For the two configurations involving right-handed pitchers, which have the largest number of observations, the p-values are less than 0.05 which supports the use of the 4-variable model. For the configurations involving left-handed pitchers, the log-likelihood values are only slightly better for the 4-variable model and the p values exceed 0.2.
Table 12
Log-likelihood for out-of-sample prediction
| Pit_Hand | Bat_Hand | Observations | League average | log5 | 4-variable model |
| Left | Left | 1083 | -719.6 | -695.7 | -695.6 |
| Left | Right | 5224 | -3301.8 | -3245.9 | -3245.1 |
| Right | Left | 26420 | -16493.0 | -16255.9 | -16253.7 |
| Right | Right | 24598 | -15729.0 | -15542.1 | -15537.6 |
4Modeling the Probability of a Ground Ball Hit
The fate of the ground balls hit by a batter or allowed by a pitcher over the course of a season can have a significant impact on the overall success of the players and their teams. In this section, we consider models for the probability EH that a ground ball results in a hit. As before, bunts are not considered to be ground balls and we exclude plate appearances with pitchers as batters.
4.1Model Variables
4.1.1Platoon Configuration
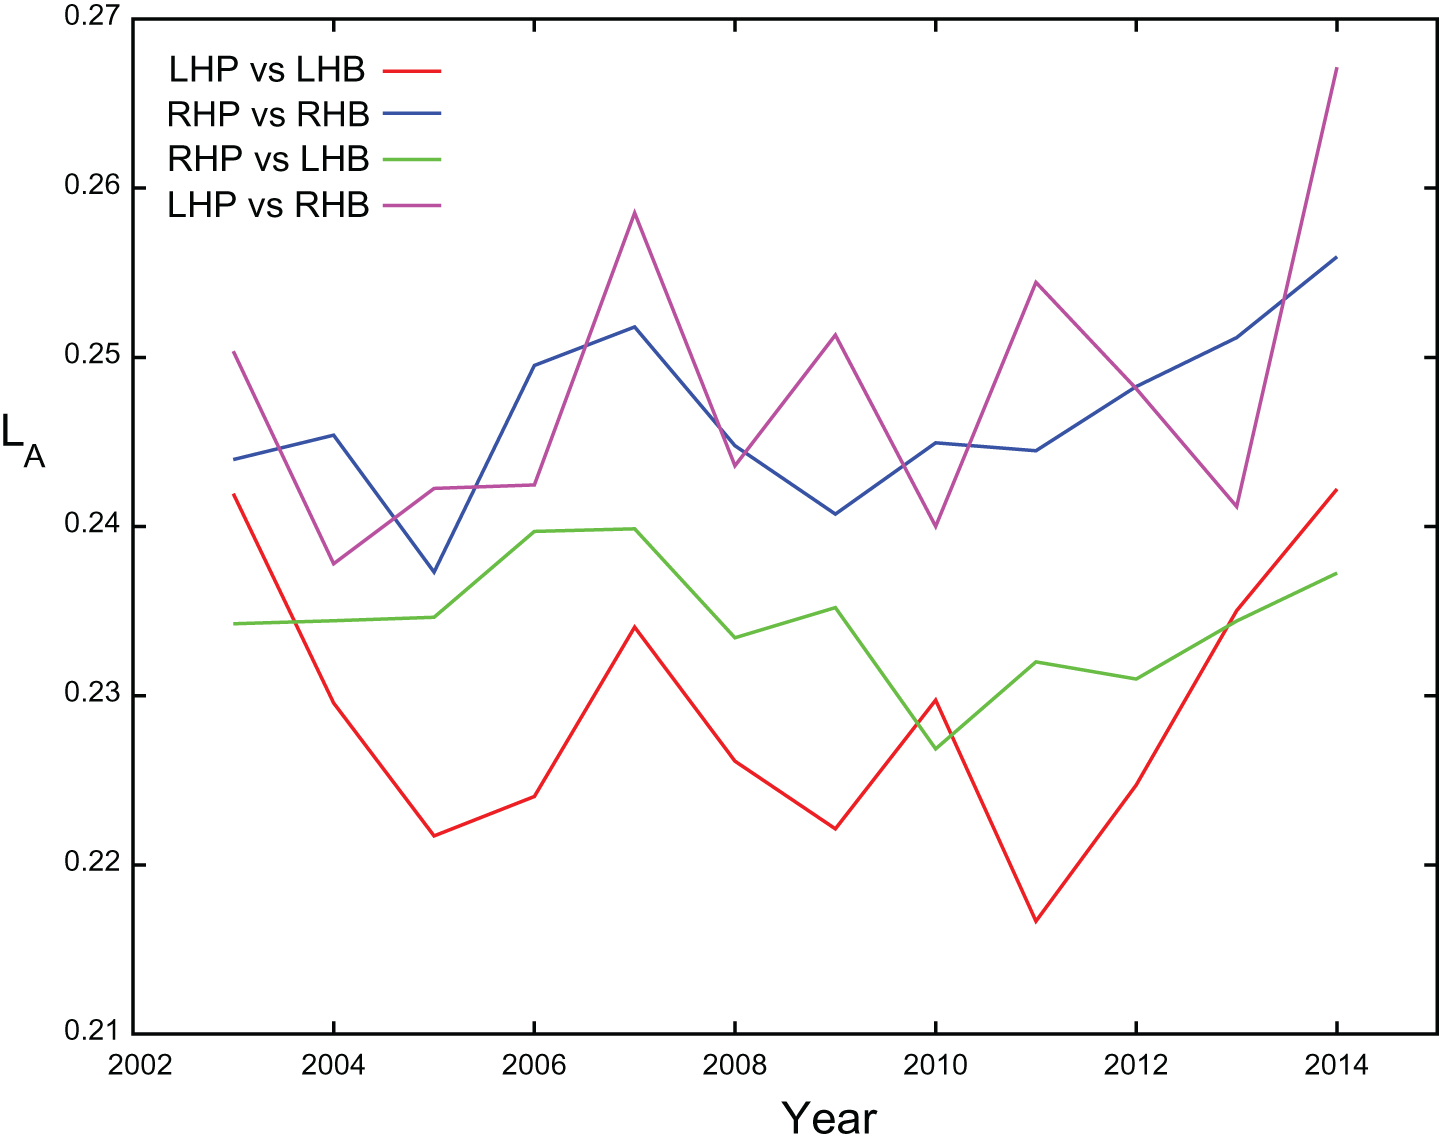
The probability that a ground ball becomes a hit depends on the platoon configuration. Let LA be the league batting average on ground balls which is the ratio of ground ball hits to total ground balls. Figure 5 plots LA for each platoon configuration for the years between 2003 and 2014. We see that platoon configurations involving right-handed batters result in higher values of LA since right-handed batters hit more ground balls to the left side of the infield which require longer throws to first base. We also see that LA depends on the year as, for example, LA rose sharply between 2013 and 2014 for all four platoon configurations. Interestingly, teams deployed an all-time high number of infield shifts in 2014 that were intended to reduce LA (James, 2015). We also note that there is more year-to-year fluctuation in LA for platoon configurations involving left-handed pitchers because these configurations include fewer ground ball observations.
Fig.5
League batting average on ground balls.
4.1.2Batter and Pitcher Descriptors
An attempt to model EH might be based on the associated log5 explanatory variables of batter ground ball batting average, pitcher ground ball batting average, and league ground ball batting average. Batting averages for individual batters and pitchers, however, require a large number of plate appearances to reach a high level of reliability (Carleton, 2012) (Carleton, 2013). Thus, a model for EH that uses the log5 explanatory variables would be difficult to apply in practice due to the difficulty of obtaining reliable estimates for the batter and pitcher ground ballbatting averages. As discussed in section 3.1, the B, BK, P, and PK player descriptors can be estimated reliably from small samples and we will consider the use of these descriptors for modeling EH . The probability that a ground ball for a matchup results in a hit also depends on the distribution of the speed and direction of batted balls for the batter and pitcher. Batters who hit harder ground balls, for example, will tend to have a higher ground ball batting average than otherwise similar batters. HITf/x data (Jensen, 2009) can be used to estimate the speed and direction of batted balls, but is not publicly available at this time.
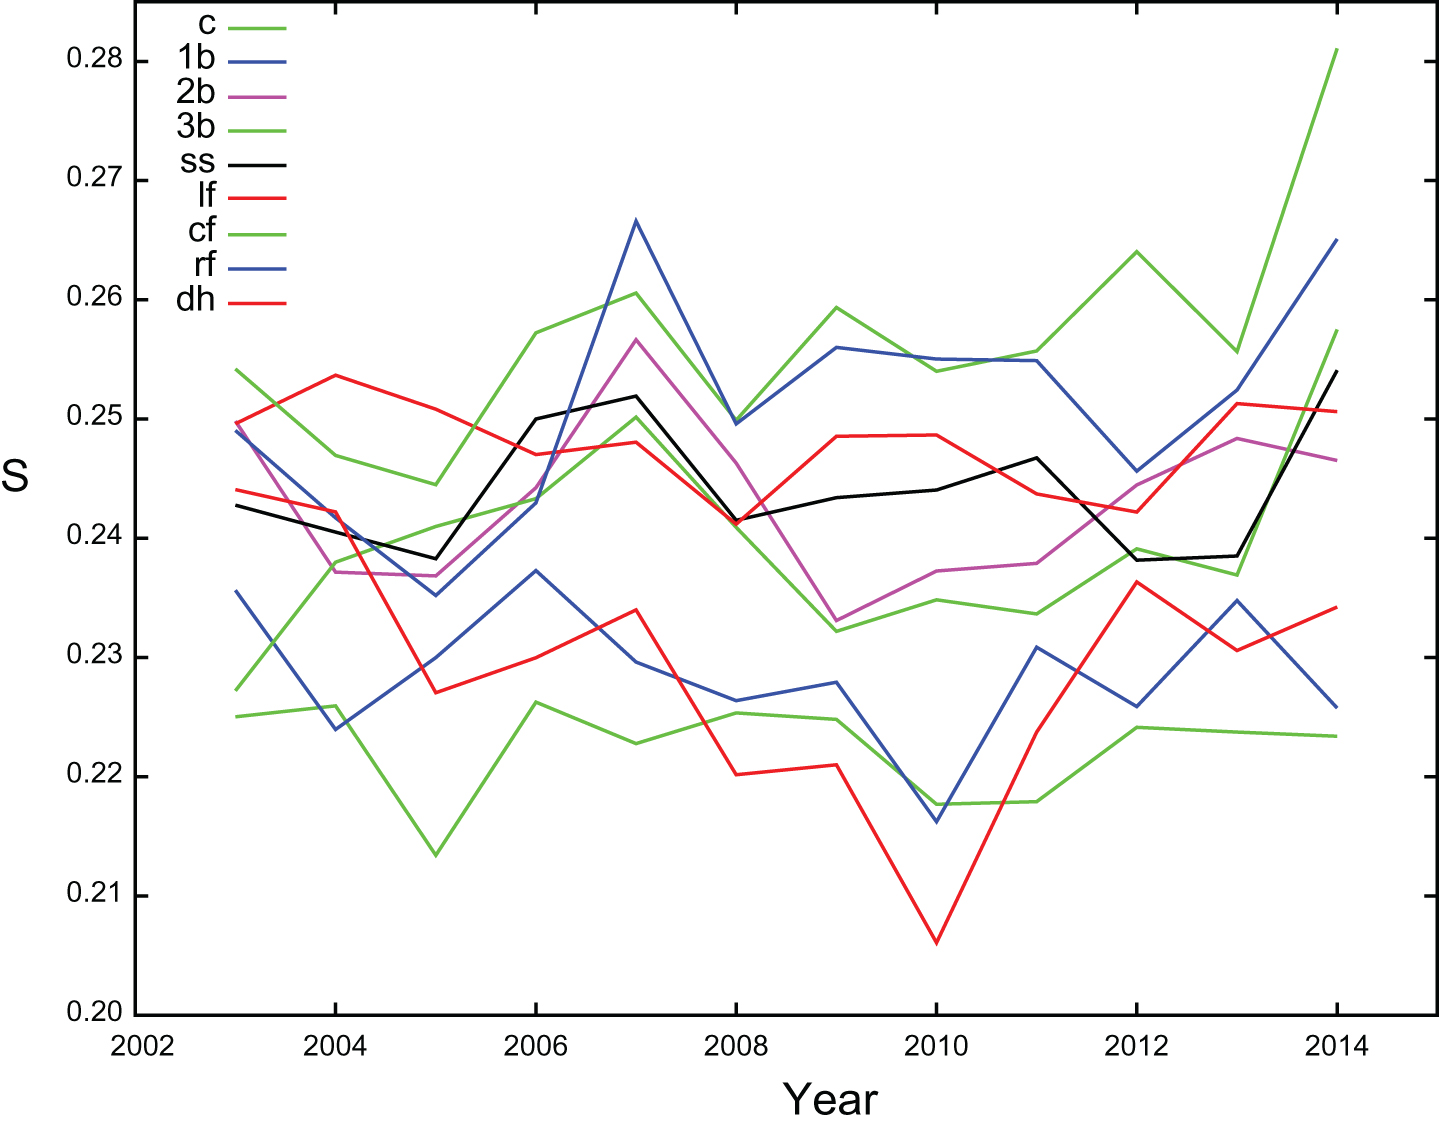
A batter’s running speed also has a significant impact on EH since faster runners beat out more infield hits and force infielders to play shallower which compromises range. A player’s position can be used as a measure of running speed (Lederer, 2009). Centerfielders, for example, are typically faster runners than catchers. Table 13 gives the ground ball averages by position over the years 2003 to 2014. We see that outfielders have the highest ground ball averages and are followed by middle infielders while designated hitters, first basemen, and catchers produce the lowest ground ball averages. Figure 6 plots the ground ball averages by position for the years from 2003 to 2014 and shows that the averages can also vary over time. The ground ball average of designated hitters, for example, declined from 0.244 in 2003 to 0.206 in 2010 but has since increased to 0.234 in 2014. We define the batter positional speed S for a plate appearance as the ratio of ground ball hits to the total number of ground balls that were produced by the batter’s position for that year after removing all plate appearances that involve the current batter. The variable S is not computed separately for each platoon configuration due to the limited number of samples that are available for some position/configuration combinations. Other possible measures for batter speed include the Bill James speed score (James, 1987) which is based on variables such as a player’s number of stolen base attempts, triples, and runs scored per opportunity. We selected the positional speed measure over the Bill James speed score due to the latter’s dependence on variables besides speed. Stolen base attempts, for example, depend on a manager’s tendencies, triples depend on power and good fortune, and runs scored depend on the hitting ability of other batters in a lineup.
Table 13
Ground ball batting average by position over the years 2003 to 2014
| CF | RF | LF | SS | 2B | 3B | DH | 1B | C |
| 0.257 | 0.251 | 0.248 | 0.244 | 0.243 | 0.240 | 0.229 | 0.229 | 0.222 |
Fig.6
League batting average on ground balls by position.
4.1.3Defense
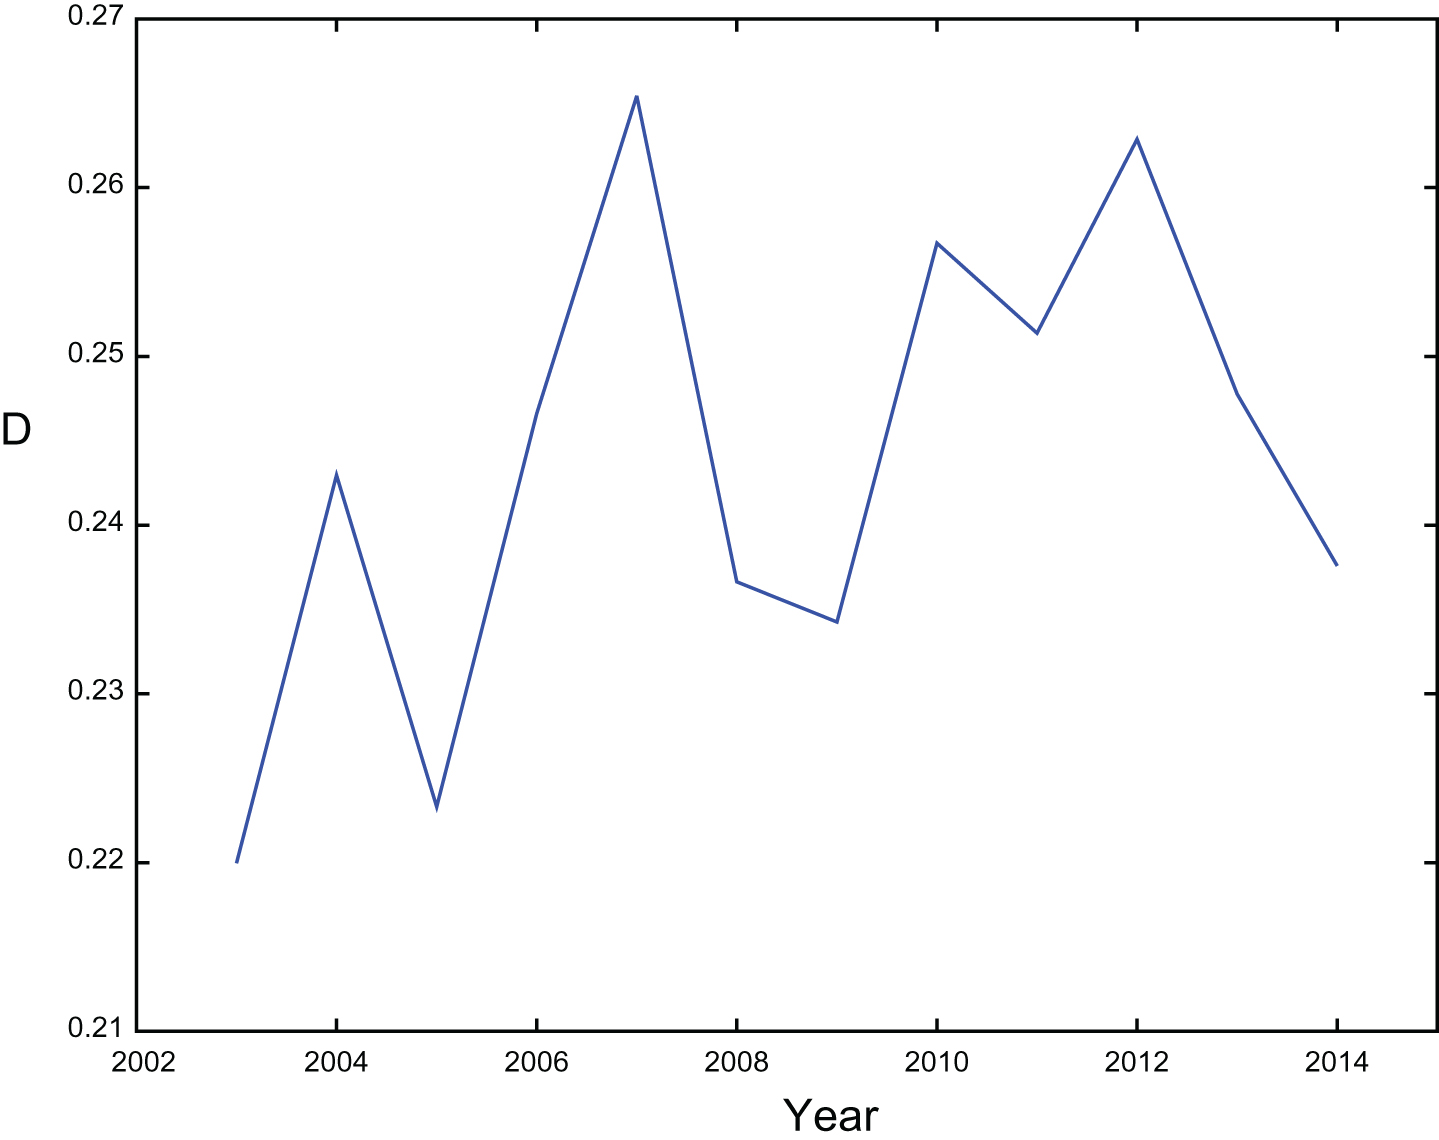
Team defense will also affect EH because infielders with greater range will turn more ground balls into outs. We define the infield defense D for a plate appearance as the ratio of ground ball hits allowed to total ground balls allowed by the team in the field during that year after removing all plate appearances that involve the current pitcher. The plate appearances involving the current pitcher are removed to reduce the dependence of D on characteristics of the pitcher that may affect EH but which are captured by other variables in the model. The variable D is not computed separately for each platoon configuration due to the limited number of samples that are available for some team/configuration combinations. As an example, figure 7 plots D for each year from 2003 to 2014 for plate appearances involving left-handed pitcher Mark Buehrle. We see that D can change significantly from year-to-year.
Fig.7
Mark Buehrle ground ball defense by year
4.2Qualified Batters Experiment
Logistic regression can be applied to the set of ground ball observations for a platoon configuration to recover a logit model for EH using the model variables described in section 4.1. The Qualified Batters Experiment considers all ground balls hit between 2003 and 2014 in a matchup where both the batter and pitcher rates are reliable. As in section 3.2, we use 150 adjusted plate appearances for a year and platoon configuration as a threshold for the batter and pitcher rates to be considered reliable and we exclude bunts and matchups involving pitchers as batters. We also exclude matchups where the batter is a pinch-hitter since we cannot assign the batter position to these matchups which is necessary to use the positional speed (S) descriptor defined in section 4.1.2. We note that pinch-hitters are a relatively rare occurrence and accounted for only about three percent of major league plate appearances in 2015. Table 14 gives the total number of ground ball observations for each platoon configuration that satisfy these criteria.
Table 14
Number of ground ball observations with qualified batters for each platoon configuration over the years 2003 to 2014
| LHP vs LHB | LHP vs RHB | RHP vs LHB | RHP vs RHB |
| 8951 | 42443 | 144253 | 161498 |
We evaluated models for EH that included various combinations of the variables described in section 4.1. The most general resulting model based on the number of significant variables is given by
(7)
where LAo = LA/(1 - LA) is the odds ratio of the league ground ball batting average LA defined in section 4.1.1 for the year and platoon configuration.
(8)
where S and D are defined in sections 4.1.2 and 4.1.3 and
(9)
for the year and platoon configuration.
Tables 15–18 present the results of the logistic regression for the four platoon configurations. Each table contains the coefficients, standard errors,z-statistics, and p-values for the model that uses all of the variables in (7) that are significant with a p-value below 0.05 for the configuration. We see that, as expected, the number of significant variables increases as the number of observations for a configuration increases. The only significant variable that depends on a rate descriptor for the batter is the centered batter strikeout rate
Table 15
Binary logit output, LHP versus LHB, 8951 observations
| Variable | Description | Coefficient | Std. Error | z-Statistic | p-value |
| ln(LAo) | log odds league GB average | 1.011717 | 0.023203 | 43.60235 | 0.0000 |
|
| centered batter speed | 4.994375 | 2.011967 | 2.482334 | 0.0131 |
|
| centered batter strikeout rate | -0.873913 | 0.406389 | -2.150433 | 0.0315 |
Table 16
Binary logit output, LHP versus RHB, 42443 observations
| Variable | Description | Coefficient | Std. Error | z-Statistic | p-value |
| ln(LAo) | log odds league GB average | 0.970296 | 0.010219 | 94.94786 | 0.0000 |
|
| centered GB defense | 2.414325 | 0.707462 | 3.412654 | 0.0006 |
|
| centered pitcher GB rate | -0.791124 | 0.214093 | -3.695229 | 0.0002 |
|
| centered pitcher strikeout rate | -0.691896 | 0.258133 | -2.680388 | 0.0074 |
Table 17
Binary logit output, RHP versus LHB, 144253 observations
| Variable | Description | Coefficient | Std. Error | z-Statistic | p-value |
| ln(LAo) | log odds league GB average | 1.004087 | 0.005598 | 179.3627 | 0.0000 |
|
| centered GB defense | 2.681578 | 0.408219 | 6.568965 | 0.0000 |
|
| centered batter speed | 3.412765 | 0.512611 | 6.657618 | 0.0000 |
|
| centered pitcher GB rate | -0.845047 | 0.096329 | -8.772530 | 0.0000 |
|
| centered batter strikeout rate | -0.558533 | 0.117567 | -4.750779 | 0.0000 |
Table 18
Binary logit output, RHP versus RHB, 161498 observations
| Variable | Description | Coefficient | Std. Error | z-Statistic | p-value |
| ln(LAo) | log odds league GB average | 0.995082 | 0.005887 | 169.0257 | 0.0000 |
|
| centered GB defense | 2.609964 | 0.380299 | 6.862924 | 0.0000 |
|
| centered batter speed | 4.335826 | 0.513569 | 8.442541 | 0.0000 |
|
| centered pitcher GB rate | -0.812320 | 0.089557 | -9.070471 | 0.0000 |
|
| centered pitcher strikeout rate | -0.521551 | 0.126566 | -4.120796 | 0.0000 |
|
| centered batter strikeout rate | 0.209660 | 0.105096 | 1.994950 | 0.0460 |
|
| (pitcher GB rate)*(pitcher SO rate) | -2.851151 | 1.339279 | -2.128870 | 0.0333 |
4.3All Batters Experiment
Since the regression results in section 4.2 are limited by sample size, we considered an All Batters Experiment that removes
(10)
Since this model does not depend on a batter rate descriptor, we can remove the restriction that batter rates are reliable for a matchup. This provides more observations to study the role of the other variables in models for EH . Thus, we repeated the experiment described in section 4.2 with the model of (10) by using the threshold of 150 adjusted plate appearances for the pitcher in a matchup, but by otherwise considering all ground balls after excluding bunts, pitchers as batters, and pinch-hitters. Table 19 gives the total number of ground ball observations for each platoon configuration that satisfy the criteria. We note that the number of observations for each platoon configuration is larger than for the Qualified Batters Experiment as presented in Table 14. The LHP versus LHB configuration, however, still has a relatively small number of observations which limits its utility for analysis.
Table 19
Number of ground ball observations with all batters for each platoon configuration over the years 2003 to 2014
| LHP vs LHB | LHP vs RHB | RHP vs LHB | RHP vs RHB |
| 16198 | 106988 | 159807 | 183505 |
The results of the logistic regression for the All Batters Experiment are presented in Tables 20–23. For each platoon configuration, the model is given that uses all of the variables in (10) that have ap-value below 0.05. In contrast to the Qualified Batters Experiment, each of the first five variables in (10) is significant for each platoon configuration except LHP versus LHB. In addition, the
Table 20
Binary logit output, LHP versus LHB, 16198 observations
| Variable | Description | Coefficient | Std. Error | z-Statistic | p-value |
| ln(LAo) | log odds league GB average | 1.029265 | 0.017349 | 59.32596 | 0.0000 |
|
| centered batter speed | 7.222611 | 1.476478 | 4.891785 | 0.0000 |
|
| centered pitcher GB rate | -0.735898 | 0.306736 | -2.399122 | 0.0164 |
Table 21
Binary logit output, LHP versus RHB, 106988 observations
| Variable | Description | Coefficient | Std. Error | z-Statistic | p-value |
| ln(LAo) | log odds league GB average | 1.003524 | 0.006521 | 153.8952 | 0.0000 |
|
| centered GB defense | 1.950666 | 0.451082 | 4.324414 | 0.0000 |
|
| centered batter speed | 2.865308 | 0.611616 | 4.684818 | 0.0000 |
|
| centered pitcher GB rate | -0.831282 | 0.135617 | -6.129606 | 0.0000 |
|
| centered pitcher strikeout rate | -0.466355 | 0.162944 | -2.862065 | 0.0042 |
Table 22
Binary logit output, RHP versus LHB, 159807 observations
| Variable | Description | Coefficient | Std. Error | z-Statistic | p-value |
| ln(LAo) | log odds league GB average | 1.008563 | 0.005203 | 193.8450 | 0.0000 |
|
| centered GB defense | 2.522635 | 0.389756 | 6.472349 | 0.0000 |
|
| centered batter speed | 3.444431 | 0.487936 | 7.059191 | 0.0000 |
|
| centered pitcher GB rate | -0.910908 | 0.103393 | -8.810120 | 0.0000 |
|
| centered pitcher strikeout rate | -0.274027 | 0.136418 | -2.008722 | 0.0446 |
Table 23
Binary logit output, RHP versus RHB, 183505 observations
| Variable | Description | Coefficient | Std. Error | z-Statistic | p-value |
| ln(LAo) | log odds league GB average | 1.010208 | 0.005436 | 185.8355 | 0.0000 |
|
| centered GB defense | 2.721076 | 0.358477 | 7.590666 | 0.0000 |
|
| centered batter speed | 4.588845 | 0.469654 | 9.770689 | 0.0000 |
|
| centered pitcher GB rate | -0.893469 | 0.084441 | -10.58101 | 0.0000 |
|
| centered pitcher strikeout rate | -0.581187 | 0.119329 | -4.870471 | 0.0000 |
|
| (pitcher GB rate)*(pitcher SO rate) | -3.714297 | 1.256525 | -2.956007 | 0.0031 |
If we set the batter’s running speed S and the pitcher’s infield defense D to the league average
Fig.8
EH surface for RHP versus LHB, 2014, (
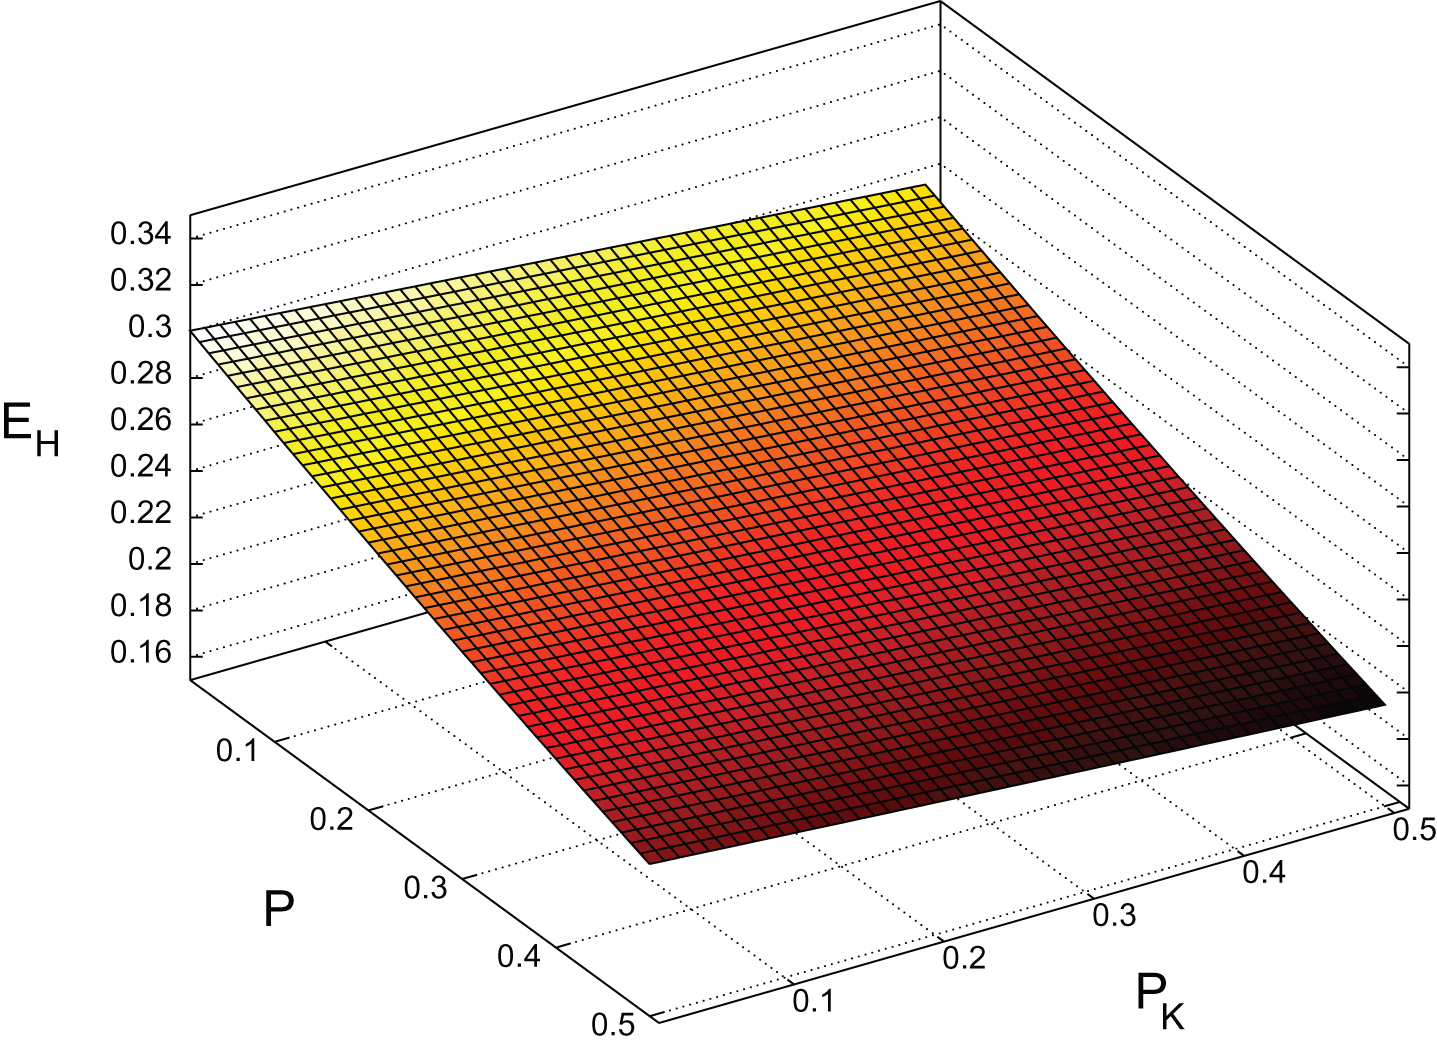
Fig.9
EH surface for RHP versus RHB, 2014, (
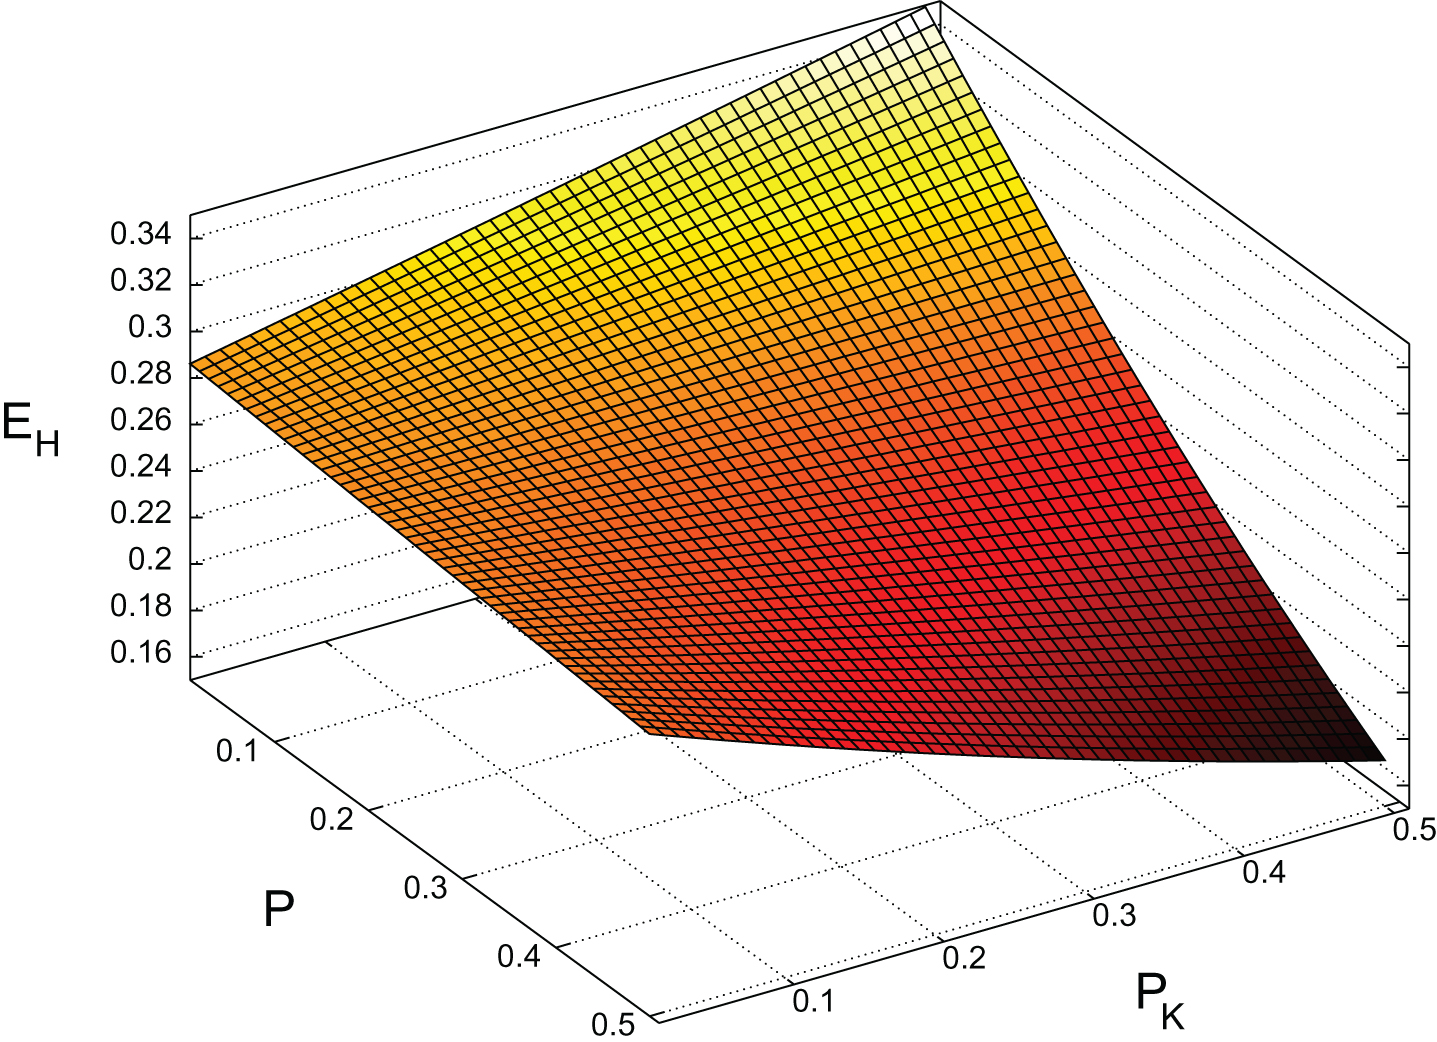
We can further examine the dependence of EH on pitcher characteristics by setting
Table 24
Differences Between EH and LA
| Pit_Hand | Bat_Hand | Pitcher Instances | Mean(|C|) | Min(C) | Max(C) |
| Left | Right | 834 | 0.007055 | -0.030735 | 0.029030 |
| Right | Left | 1587 | 0.007820 | -0.033752 | 0.033010 |
| Right | Right | 1988 | 0.008661 | -0.042953 | 0.042676 |
Table 25
Pitchers With Large Differences Between EH and LA
| Pit_Hand | Bat_Hand | Pitcher | Year | P | PK | C | GB Avg. |
| Left | Right | Jonny Venters | 2011 | 0.484252 | 0.228346 | -0.030735 | 0.203 |
| Left | Right | Brad Hand | 2011 | 0.151832 | 0.141361 | 0.029030 | 0.276 |
| Right | Left | Roy Halladay | 2005 | 0.534965 | 0.174825 | -0.033752 | 0.163 |
| Right | Left | Chris Young | 2008 | 0.116402 | 0.169312 | 0.033010 | 0.318 |
| Right | Right | Brandon Webb | 2006 | 0.528708 | 0.212919 | -0.042953 | 0.186 |
| Right | Right | Brad Lidge | 2004 | 0.132948 | 0.514451 | 0.042676 | 0.304 |
4.4Utility for Out-of-Sample Prediction
We also assessed the model developed in section 4.3 for the prediction of out-of-sample data. Using the model in equation (10), we considered the prediction of ground ball hit probabilities for 2015 data using the league rate LA and the individual pitcher rates
Table 26 compares the log-likelihood for the predictive models. We see that using the speed measure
Table 26
Log-likelihood for out-of-sample prediction for three models
| Pit_Hand | Bat_Hand | Observations | Average LA | LA + speed S | LA + S + pitcher GB rate + pitcher SO rate |
| Left | Left | 702 | -363.5 | -362.5 | -361.4 |
| Left | Right | 4211 | -2391.6 | -2389.2 | -2386.7 |
| Right | Left | 6744 | -3575.8 | -3572.7 | -3568.3 |
| Right | Right | 7119 | -4066.1 | -4065.9 | -4064.5 |
4.5Physical Justification
The result that pitchers with high ground ball rates tend to allow a lower batting average on ground balls is consistent with physical intuition. Cartwright (2012) used HITf/x data to examine this phenomenon in detail by considering the distribution of vertical angles of batted balls allowed by a pitcher where a vertical angle of -90° is straight down and a vertical angle of +90° is straight up. He showed that as pitchers achieve a higher ground ball rate the full distribution of opponent batted balls shifts to smaller vertical angles. This shift tends to make ground balls easier to field because they are hit more directly into the ground with a smaller velocity component in the plane of the playing field. For balls in the air, however, this shift in the distribution turns pop-ups with large vertical angles into fly balls and line drives with smaller vertical angles that are more difficult to field. As a result, pitchers with high ground ball rates tend to achieve the best results on ground balls, but typically allow higher batting averages on balls hit in the air (Swartz, 2010b). Murphy (2015) analyzes some of the tradeoffs related to a pitcher’s ground ball versus fly ball tendencies and explores strategies that pitchers with high ground ball rates can employ to improve their results on balls hit inthe air.
5Conclusion
We have shown that the probability of a ground ball for a matchup can be predicted using batter and pitcher descriptors that can be estimated reliably from small samples. The resulting predictive model is a generalization of the log5 formula which is based on the batter and pitcher ground ball rates, but the new model also captures the interaction between batter and pitcher strikeout rates. This interaction leads to matched and mismatched Krate configurations which represent sets of matchups for which the batter or pitcher is favored with respect to both ground balls and strikeouts compared to the log5 prediction. We introduced the Aoki/Kershaw/Diamond example to illustrate the principle of matched and mismatched Krate configurations and to demonstrate how ground ball probability is affected for matchups within these configurations. We also tested the model on out-of-sample data.
The outcome of the ground balls hit or allowed by a team can have a large effect on the team’s performance. Log5 is not useful for predicting the probability that a ground ball results in a hit due to the difficulty of obtaining reliable estimates for the component explanatory variables. Instead, we have employed a logit model to show that the probability of a ground ball hit depends on the platoon configuration and a set of alternative variables that separate the influence of the batter, pitcher, and defense. In order to address sample size issues, we defined an All Batters experiment that focuses on variables that depend on the pitcher, his infield defense, and the batter’s running speed. We showed that the probability of a ground ball becoming a hit depends on both the pitcher’s ground ball and strikeout rates. We also showed that the role of the different explanatory variables depends on the platoon configuration. The model was assessed for the prediction of ground ball hit probability on out-of-sample data.
Descriptors that characterize the distribution of batted ball speeds and launch angles for a batter or pitcher could be used to improve the model, but the data required to generate these descriptors is not publicly available at this time. Additional player descriptors, however, can easily be incorporated into the model as they become available. We provide a physical justification for the dependence of ground ball hit probability on a pitcher’s ground ball rate and also give several examples of pitchers that illustrate properties of the model.
Acknowledgment
The data used in this study was obtained from www.retrosheet.org. I thank Tom Tango for his help with this work.
References
1 | Bradbury J.C., (2005) . Another look at DIPS [Online]. Available: www.hardballtimes.com/another-look-at-dips1. |
2 | Carleton R., (2009) . If you’re happy and you know it, get on base [Online]. Available: www.hardballtimes.com/tht-live/if-youre-happy-and-you-know-it-get-on-base. |
3 | Carleton R., (2012) . It’s a small sample size after all [Online]. Available: www.baseball.prospectus.com/article.php?articleid=17659. |
4 | Carleton R., (2013) . Should I worry about my favorite pitcher? [Online]. www.baseballprospectus.com/article.php?articleid=20516. |
5 | Cartwright B., (2011) . What ground balls can tell us about fly balls. In Distelheim J., Simons G., Hale C., editors, The Hardball Times Baseball Annual, 2012, pages 249–254. ACTA Sports, Chicago. |
6 | Fast M., (2011) a. Who controls how hard the ball is hit? [Online]. Available: www.baseballprospectus.com/article.php?articleid=15532. |
7 | Fast M., (2011) b. How does quality of contact relate to BABIP? [Online]. Available: www.baseballprospectus.com/article.php?articleid=15562. |
8 | Fox D., (2005) . Tony LaRussa and the search for significance [Online]. Available: www.hardballtimes.com/tony-larussa-and-the-search-for-significance. |
9 | Fox D., (2005) . A short digression into log5 [Online]. Available: www.hardballtimes.com/a-short-digression-into-log5. |
10 | Hammond C., Johnson W., & Miller S., (2015) . The James function. Mathematics Magazine, 88: , 54–71. |
11 | Healey G., (2015) . Modeling the probability of a strikeout for a batter/pitcher matchup. IEEE Transactions on Knowledge and Data Engineering, 27: (9), 2415–2423. |
12 | James B., (1983) . The Bill James Baseball Abstract 1983. Ballantine Books, New York, NY. |
13 | James B., (1987) . The Bill James Baseball Abstract 1987. Ballantine Books, New York. |
14 | JamesB., (2014) . The Bill James Handbook 2015. ACTA Sports, Chicago. |
15 | Jensen P., (2009) . Using HITf/x to measure skill [Online]. Available: www.hardballtimes.com/using-hitf-x-to-measure-skill. |
16 | Koo A., (2013) . More moneyball: Oakland’s other platoon advantage [Online]. Available: www.baseballprospectus.com/article.php?articleid=22435. |
17 | Lederer R., (2009) . BABIP: slicing and dicing groundball out rates [Online]. Available: baseballanalysts.com/archives/2009/01/babip_slicing_a.php. |
18 | Lependorf D., (2013) . Where do ground balls come from? [Online]. Available: www.hardballtimes.com/where-do-ground-balls-come-from. |
19 | Levitt D., (1999) . The batter/pitcher match up [Online]. Available: baseball-thinkfactory.org/btf/scholars/levitt/articles/batter-pitcher-matchup.htm. |
20 | Lichtman M., (2004) . DIPS revisited [Online]. Available: www.baseballthinkfactory.org/primate_studies/discussion/lichtman_2004-02-29_0. |
21 | McCracken V., (2001) . Pitching and defense: How much control do hurlers have? [Online]. Available: www.baseballprospectus.com/article.php?articleid=878. |
22 | Morey L. and Cohen M., (2015) . Bias in the log5 estimation of outcome of batter/pitcher matchups, and an alternative. Journal of Sports Analytics, 1: (1), 65–76. |
23 | Murphy M., (2015) . Are groundball pitchers overrated [Online]. Available: www.hardballtimes.com/are-groundball-pitchers-overrated. |
24 | Stern H., & Sugano A., (2007) . Inference about batter-pitcher matchups in baseball from small samples. In Albert J. and Koning R., editors, Statistical Thinking in Sports, pages 153–165. Chapman and Hall/CRC. |
25 | Swartz M., (2010) a. Why SIERA doesn’t throw BABIP out with the bath water [Online]. Available: www.baseballprospectus.com/article.php?articleid=10281. |
26 | Swartz M., (2010) b. Ground-ballers: better than you think [Online].Available: www.baseballprospectus.com/article.php?articleid=12581. |
27 | Tango T., Lichtman M., & Dolphin A., (2007) . The Book: Playing the Percentages in Baseball. Potomac Books, Dulles, Virgina. |
28 | Tippett T., (2003) . Can pitchers prevent hits on balls in play? [Online]. Available: 207.56.97.150/articles/ipavg2.htm. |
29 | Wooldridge J., (2013) . Introductory Econometrics: A Modern Approach. South-Western, Cengage Learning, Mason, OH, 5th edition. |


