
Bias in the log5 estimation of outcome of batter/pitcher matchups, and an alternative
Abstract
Although originally developed to estimate the probability of winning percentage when two teams from the same league are matched, the log5 formula suggested by Bill James has often been applied to evaluate probabilities of events resulting from specific batter/pitcher matchups in baseball. However, this odds-ratio based formula may have biases of estimation that become apparent as event probabilities differ increasingly from.500. A series of Monte Carlo simulations across all plausible combinations of batter, pitcher, and league average characteristics demonstrates that the log5 formula yields estimates that are increasingly skewed at more asymmetrical probabilities and that this skew will likely result in overestimates of proportions, particularly among the statistical leaders in various categories. In addition, testing this hypothesis in the prior 18 seasons of Major League Baseball revealed that log5 estimates of home run results among predictive matchups of positive outlier batters and pitchers resulted in overestimated HR% for all 18 seasons. An alternative estimation procedure, named the Morey-Z formula, is proposed that estimates outcomes from the same inputs as the log5 procedure, but yields estimates that demonstrate greater accuracy in estimating outcomes of low probability events in outlier matchups.
1Introduction
In his 1981 Baseball Abstract, Bill James (1981) developed a system to determine the probability that a team with a given won-loss percentage would defeat a second team, given that second team’s won-loss percentage. James called this method the “log5” method (although it is based upon the Bradley-Terry, 1952, model for pairwise comparison) and described it as “a weighted comparison of each team to a.500 team”. That formula was as follows:
(1)
P A ·B = the probability that team A defeats B in a single game
P A = the winning percentage of team A
P B = the winning percentage of team B
The log5 formula has become popular in a variety of different applications, such as attempting to predict winners of the NCAA basketball tournament (Pomeroy, 2013) or exploring the impact of adding additional tiers to professional sports playoffs (Boronico, 1999), and there is solid evidence of the formula’s empirical accuracy when used in this context (James, 1983). However, the focus of this paper is upon one specific extension of the log5 formula beyond determining probability of winning in a matchup between two particular teams. James (1983), in conjunction with Dallas Adams, extended the method from predicting win-lossrecords in specific team matchups to attempting to predict the outcome of specific batter/pitcher matchups in baseball. This method has become a popular means of simulating results of such matchup. For example, Rudelius (2012) recently used the log5 formula as the basis for Monte Carlo simulations of the 2010 Major League Baseball playoffs, simulating individual batter/pitcher matchups to derive results. The log5 formula has also become the basis of the statistical engine for batter/pitcher matchups in commercially available computer simulation programs, such as Strategic Baseball Simulator version 4.91 (Schmidt, 2009) or Digital Diamond Baseball 3.0 (Curiosity Computing, 2013). When applied in this fashion, the log5 formula is shownbelow:
(2)
1 P B ·P = Probability of an event for a specificbatter/pitcher matchup
2 P B = Probability of an event for the specific batter
3 P P = Probability of an event for the specific pitcher
4 P L = League average for the probability of the event
It is important to recognize that the log5 formula reflects a particular application of the odds ratio that can be represented as a logit model (Stern & Sugano, 2008). Although the extended version includes a parameter intended to adjust estimates against underlying league averages that depart from.500, the log5 model may still be more conducive to estimation of won-loss percentages within a given league than to batter/pitcher matchup comparisons. Specifically, this particular odds-ratio estimation strategy may be most effective when the true mean proportion of observed probabilities is.500 (the “5” in log5 is actually in reference to the.500 mean proportion), and when the relevant variables to be estimated are normally distributed around that mean. Because in any given league the true mean proportion of wins must be.500 (because there is always a winner and a loser), and because the winning percentages of teams over the course of baseball history is roughly normally distributed, the won-loss application of the log5 formula meets the assumptions nicely. However, when the method is extended to estimate various outcomes of specific batter/pitcher matchups, it is obvious that outcomes such as the probability of hits, home runs, or many other statistics in any given plate appearance may never approach.500. Furthermore, such probabilities may not vary normally around their mean, and predictive estimates of such probabilities are likely to regress to a mean significantly below 500.
Given the possibility that log5 estimation might tend to yield biased results in evaluating batter/pitcher matchups, an alternative approach to estimation developed by the first author (and hence named Morey-Z here) uses a fundamentally different strategy. This approach considers each outcome as a binomial probability, a potential approach to predicting matchup outcomes discussed by Stern and Sugano (2008). However, this approach scales these binomial probabilities using a Z-score or standard score metric (mean = 0, SD = 1). These binomial probability Z-scores are then aggregated for the batter and the pitcher, and this aggregate is rescaled into the expected league average distribution (i.e., the league mean and standard deviation) using a linear T-score transformation (McCall, 1922) that, relative to log5, should better retain the distributional properties of the underlying parameters. The formula capitalizes upon the variance of the binomial probability estimated as p * (1–p), and it is important to recognize that this value represents the variance of the binomial event, rather than the variance of the league as whole. As such, the Morey-Z formula provides an estimate using the exact same parameters as the log5 parameters, but combined in a different manner. Using the same notation as provided in Equation (2) for log5, the Morey-Z formula is as follows:
(3)
The aim of the current study was to explore whether the use of log5 estimation in the context of the batter/pitcher matchup might lead to biases in estimation, as the underlying distributions depart from assumptions of a.500 mean probability. First, Monte Carlo distributional simulations were constructed to explore whether hit probability (which typically has a league-wide mean value below.300) and home run probability (which typically has a league-wide mean value below.030) to determine if log5 estimates (relative to Morey-Z estimates) show significant indications of skew toward a.500 value in simulations under a wide variety of plausible matchup probabilities. Then, thehypothesis that log5 estimates may be biased or skewed toward a.500 probability (leading in some cases to substantial overestimates) was tested in actual baseball season data by focusing upon home run percentage (HR%). The use of HR% is particularly instructivebecause it has mean values that are particularly discrepant from.500. The predictive HR% estimates provided by log5 and Morey-Z are compared to actual HR% of batter-pitcher matchups obtained in succeeding seasons, across several different seasons. Finally, both of these conceptual matchup estimation strategies (log5 and Morey-Z) are compared to purely empirical estimates derived from logistic regression functions optimized upon a particular season and applied to the subsequent season, another approach to modeling these matchups suggested by Stern and Sugano(2008). It is hypothesized that log5 HR% estimates are likely to be positively skewed relative to both Morey-Z as well as logistic regression estimates, with the Morey-Z having an advantage over logistic regression in that the formula is generally applicable to any baseball season, rather than being optimized for a particular season.
2Method
2.1Monte Carlo simulation of log5 and Morey-Z estimate distributions
As noted in Formula (2), the log5 formula requires three input parameters to estimate outcomes (P B ·P) from a specific matchup, these being P B (probability of an event for the batter), P P (probability of an event for the pitcher) and P L (the league average for the probability of the event). The aim of the Monte Carlo simulation study was to describe the properties of log5 estimates across the full range of plausible values for two important baseball events— the probability of getting a hit, or batting average (BA), and the probability of hitting a home run, or home run percentage (HR%). These two variables provide an important test of the effects of varying distributional properties, because both have underlying mean proportions that depart appreciably from.500, but one (HR%) departs much more from.500 and is much less normally distributed that the other (BA). To generate random (but representative) BA and HR% values for the Monte Carlo simulation, plausible ranges of these values were determined using modern baseball history (since 1920). Thus, the extremes of batting average between 1920 and 2014 ranged from.424 (Rogers Hornsby, 1924) to.179 (Rob Deer, 1991) among players with at least 3.1 plate appearances per scheduled games (mean = .282, SD = .030, skewness = 0.380). For pitchers, opposing batting averages ranged from.379 (Les Sweetland, 1930) to.167 (Pedro Martinez, 2000) among pitchers with at least 1 IP per scheduled game (mean = .254, SD = .024, skewness = –.058). The relevant range for league batting averages reflected numbers ranging from the lowest league batting average in modern baseball history (.230, the 1968 American League) to the highest league average (.303, the 1930 National League). Thus, for example, one of these randomly generated matchups might have matched a hypothetical hitter with a.260 BA against a hypothetical pitcher with a.320 OBA in a hypothetical season with a.240 league average BA.
Home run percentage has a distribution with a mean value well below.500, is lower than batting average means, and is also less likely to be distributed normally. The range of values for HR% in modern baseball history ranges from.15336 (Barry Bonds, 2001) to.00000 (e.g., Scott Podsednik, 2005 among others) among players with at least 3.1 plate appearances per scheduled game (mean = .025, SD = .017, skewness = .672). For pitchers, Jose Lima holds the NL record for home runs allowed (HRA) and posted a.05985 HR/AB percentage, appreciably higher than AL record-holder Bert Blyleven (mean = .020, SD = .008, skewness = 0.395). The other end of the range for pitchers HRA% is.00000 (e.g., Slim Harriss, 1926). League HR% values have ranged from.02799 (1996 AL) to.00556 (1920 NL).
Within the ranges of proportions defined by these extreme values, 20 samples of 1000 combinations of hitter, pitcher, and league average BA and HR% values were generated using a uniform random number distribution. Uniform random numbers were used rather than some other distribution function because the goal was to sample across all plausible combinations of batter BA/HR% , pitcher BA/HR% , and league average BA/HR% to detect potential biases in estimation across the full range, rather than to weight these factors according to the frequency by which they have been observed in baseball history. In doing so, these simulations sampled all plausible combinations of batter ability, pitcher ability, and league averages, working within the ranges of these values as observed across baseball history. Thus, the Monte Carlo data were generated to test the hypothesis that across the full range of application of these statistics, the log5 estimation of outcome in batter/pitcher matchups becomes increasingly biased, relative to Morey-Z estimates, as mean values of the statistic to be estimated depart significantly from.500.
2.2Predictive accuracy of log5, Morey-Z, and logistic regression estimates of HR%
As an empirical test of the hypothesis of overestimation of low percentage events, actual batter-pitcher HR% matchup data were examined for 18 major league baseball seasons from 1996 (which followed strike-shortened seasons in 1994 and 1995) to 2013 (the most recent possible observation with follow-up). Batter-pitcher matchup data was derived from the regular season Major League Baseball event files that are freely available from Retrosheet (2015). All batter-pitcher matchups were extracted from the Retrosheet event files and inserted into the Lahman Baseball Database (Lahman, 2015). The database was then queried using the Structured Query Language and a custom Java program was written to produce data files for analysis.
These analyses focused upon positive outliers, as it is in these matchups where log5 estimates would be anticipated to show the greatest skew— log5 would tend to model these outlier observations as “regressing” to a value of.500, while Morey-Z would model these outlier observations as regressing to the league mean. In each season, HR% was calculated for all qualifiers (i.e., 502 plate appearances for batter, 162 innings pitched for pitchers), and a subset of batters (highest HR% hit) and pitchers (highest HR% allowed) were identified as positive outliers whose HR% fell at least one SD above the mean for qualifying players. HR% statistics were pooled for these players, and the pooled batter HR% and pooled pitcher HR% , and total league HR% for that season were entered into the formulas for log5 and for Morey-Z. As a further benchmark, a logistic regression function to predict HR outcomes, based upon batter HR% and pitcher HR% , was calculated for each season using all plate appearances in the given season. This logistic regression formula would presumably provide a HR% estimation function that was optimized for the season in question. Then, to test the predictive accuracy of these estimates under conditions of uncertainty, batter-pitcher matchup data from the following season were obtained to represent all predictive matchups from these outlier batters and pitchers, and compared to HR% predictions from the three formulas generated using the pooled subset percentages from the prior season.
3Results
3.1Results of Monte Carlo simulations of log5 and Morey-Z estimate distributions
The results for the estimated probabilities, as derived from the log5 and Morey-Z formulas, for 20 trials of 1,000 possible batter/pitcher/league average combinations for batting average and home run percentage are presented in Tables 1 and 2, respectively. The first three columns provide the average of the 1,000 generated matchups within the previously determined ranges specified for batters, for pitchers, and for league averages. There is relatively little variability in these mean values across the 20 trials, with these means corresponding roughly to the midpoint of the designated ranges, as expected given the uniform random sampling distribution used. The second set of three columns provides skewness estimates of the distributions of these three probabilities across the 1,000 generated matchups. Again as expected, these distributions show little skew because of the uniform random distribution procedure. The next two columns in these tables provide the mean values and skewness values for the 1,000 observations of the log5 probability estimate that resulted from each of the 1,000 different combinations of the batter, pitcher, and league average values. Comparing these values to the batter, pitcher, and league average numbers is informative to the hypothesis of biased estimation results from the log5 formula. First, consider Table 1, reflecting a total of 20,000 different comparisons of batter, pitcher, and league average batting average (BA). In every one of the 20 trials, application of the log5 formula resulted in an estimated BA that was higher than any of the three parameters used to calculate it— batter, pitcher, or league average. With Rogers Hornsby setting the upper bound, the mean batter batting average tended to be high, roughly around.300, but in every instance the log5 formula predicts a higher mean BA. A paired-differences t-test revealed that the log5 estimation of batting average was significantly higher than the mean batter’s BA (t(19) = 14.06, p < 0.001), with a very large effect size (Cohen, 1988) of the difference of d = 2.54 standard deviations. Such a result might seem counter-intuitive, because when a batter faces a league-average pitcher, the log5 formula simplifies directly to the batter’s own batting average— so why might this log5 mean be higher across thousands of possible combinations? The potential answer to this question may be found in the adjoining column, which represents the skewness values for the log5 distribution of batting average estimates. In every one of the 20 observations of batting average, the log5 estimation demonstrated a clear positive skew (mean = .296), while the distributions of the parameters from which log5 is calculated demonstrated no such skew, because of the generated uniform distribution. Once again, comparing the generated batter BA skew to log5 BA estimate skew across the 20 samples demonstrates that the mean skewness for log5 estimates was significantly higher (t(19) = 19.97, p < 0.001) with a very large d = 5.18 SD effect size. This tendency for positive skew in log5 estimates suggests that larger batting average values— those of positive outliers in the sample—tend to be exaggerated by the log5 formula, resulting in the significant increase in mean batting average.
It is important to consider whether the Morey-Z formula provides estimates that share some of the aforementioned problems with log5. Thus, Tables 1 and 2 also provide estimates of the mean matchup probability for BA and for HR% (respectively), as computed by the Morey-Z formula across the same 20 trials; as well as the skewness values for the distribution of Morey-Z estimates in these trials. Finally, the correlations in these trials between log5 and Morey-Z matchup estimates are provided in the last column. Beginning with Table 1, we see that the log5 and Morey-Z numbers for estimated BA are highly correlated, with every value in excess of +.989. A positive correlation would certainly be anticipated because the two formulas are based upon the same three parameters. However, simply because the estimates are correlated does not mean that they are identical, and comparing the mean and skewness values for Morey-Z vs. log5 bear this out. For example, in contrast to log5 results, the Morey-Z BA estimates were significantly lower than the mean batter BA (t(19) = 16.77, p < 0.001; effect size d = 2.54). This should be anticipated because, on average, these batters would be facing pitchers with a lower opponent BA as well as playing in leagues with lower average BA. Notably, the Morey-Z BA matchup estimates were appreciably larger than the average pitcher OBA or the league average BA, because the batter estimates tended to be higher than either. Of potentially greater significance, however, there was virtually no difference in skewness between the Morey-Z estimates and the generated batter BA (t(19) = 0.03, n.s.; effect size d = 0.01). As anticipated, the Morey-Z formula derived estimates that essentially retained the shape of the underlying distribution of the randomly generated parameters, in contrast to the distortions introduced by the log5 approach.
Table 2 provides further data with which to evaluate the hypothesis that this apparent bias in estimation will be even larger when considering metrics that depart even more from a.500 base rate. Thanks to Rogers Hornsby and a very few other talented players, it is possible for batting average to approach the.500 base rate. However, other proportions, such as home run percentage (HR%), will never approach this mean rate, with distributions demonstrating much lower frequencies and tending to be much more skewed. Thus, if these departures from.500 probability indeed influence log5 estimation efficiency, we would anticipate that the tendencies observed with BA should be even more dramatic with a proportion such as HR% . Table 2 confirms this expectation. The mean HR% derived from the log5 estimation was well above the mean HR% of the generated batters (t(19) = 61.46, p < 0.001; effect size d = 17.55), and this mean increase apparently resulted from marked positive skew in the log5 HR% estimations that far exceeded that observed in the batter HR% distributions (t(19) = 82.41, p < 0.001; effect size d = 23.45). The relative advantages of the Morey-Z formula over log5 become even more apparent when considering the HR% results presented in Table 2. The correlation between Morey-Z and log5 estimates remains considerable, but the values are not as large as those observed with batting average, being in the vicinity of +.78. Once again, the Morey-Z formula yields mean HR% values that are lower than those of the generated batter HR% (t(19)−71.79, p < 0.001; d = 8.66), which might be expected when those batters are facing pitchers with generally lower home run tendencies, but the Morey-Z estimates are still higher than the means of the pitchers HRA% or league average HR% . Furthermore, the marked positive skew in HR% imparted by the log5 formula was not evident in the Morey-Z estimates (t(19) = 0.62, n.s.; effect size d = 0.11).
A close examination of the data further reveals that the bias in log5 estimation becomes most apparent when a particular batter, or pitcher, or both, has a proportion that far exceeds league averages— the log5 skewness tendency further magnifies this tendency, often with unrealistic and unlikely results, as log5 estimates for these positive outliers tend to regress to an estimate of.500 rather than towards the league mean, as in Morey-Z. To graphically demonstrate the core difference in estimation tendencies for the two statistics, Fig. 1 provides scatterplots of formula estimates as a function of the differences between batter proportion and league average proportion, for log5 and Morey-Z estimates, respectively, using data from one of the 20 simulation trials for HR% (all trials yielded essentially the same results). The log5 estimates show marked departures from batter HR% as the difference between it and league average gets larger. As an example, some HR% values for such “outlier” home run hitters approach or exceed.60, meaning that log5 might estimate that Barry Bonds could be expected to hit 300 home runs in 500 AB if placed in a league resembling the 1920 NL with respect to HR% . In contrast, the estimates derived from the Morey-Z formula are much more consistently dispersed across the hitter-league differential (with estimates of roughly 75 HR for Bonds in the above example), and the estimated values demonstrate the anticipated linear relationship with batter HR% that might be expected when aggregated across various combinations of pitchers and league averages.
In summary, the data provided from 20,000 combinations suggest that log5 estimates of outcome probability are significantly biased in that they tend to yield results with clear positive skew, and that these tendencies become more pronounced as the mean probability of the underlying statistic departs further from.500, and as matchups of “positive outlier” players (i.e., those well above league averages) are considered. The next step in extending these results was to investigate these tendencies in actual baseball matchup data.
3.2Estimating actual batter-pitcher matchup results among positive outliers for a low-probability outcome
To further explore these indications of potential log5 overestimation of low percentage events in positive outlier matchups, the predictive accuracy of log5, Morey-Z, and logistic regression estimates of HR% were compared to actual batter-pitcher HR% matchup data obtained for 18 major league baseball seasons from 1996 to 2013. Data from these analyses are presented in Table 3. Matchup data from positive outliers (i.e., those displaying HR% >1 SD above the mean) for each season were pooled and the resulting estimates compared to actual matchup results from these same players in the following season. Predictive matchup data from these pooled players provided sample sizes of matchups ranging from 343 to 673 plate appearances across different seasons. To compare the accuracy of three predictive metrics (log5, Morey-Z, and logistic regression), the absolute value of the deviation between the actual observed HR% and the predicted HR% from the metrics was computed for each season, with smaller deviations for a given season meaning that an estimate was more accurate. A repeated measures analysis of variance indicated that the estimates differed significantly in accuracy (Wilks Lambda = 0.075, F(2,16) = 98.9, p < 0.001), and post-hoc paired difference t-tests confirmed that the absolute value of the deviations from actual values across seasons was smaller (i.e., more accurate) for Morey-Z than for log5 (t(17) = 4.58, p < 0.001, d = 1.63), and the logistic regression estimates were also more accurate than log5 (t(17) = 13.34, p < 0.001, d = 0.65). Impressively, the deviations were also significantly smaller for Morey-Z than for the logistic regression estimates (t(17) = 2.10, p < 0.05, d = 0.74). The superiority of the Morey-Z estimate relative to the logistic regression values are of particular interest. The logistic regression approach reflects an empirically derived function with regression weights derived from a specific season, whereas both log5 and Morey-z are theoretical (not empirical) formulas. Thus, these latter two formulas can be applied to any season of baseball, whereas the logistic formula generates function weights specific to some season, and these weights vary across different seasons. The logistic regression approach tested here, using weights derived from the immediately adjacent season, almost certainly provides the best chance of good predictive performance with this empirical approach. In fact, unlike Morey-Z or log5 estimates that derive from formulas that are consistent across seasons, the performance of estimates derived from logistic regression deteriorated appreciably when attempting to predict outcomes that were more distal from the season from which the parameters were derived. For example, attempting to predict 2001 matchup outcomes from the logistic regression equation derived from the 2013 season resulted in an estimated HR% of.1120, a dramatic overestimate relative to the actual value of.0615, and considerably higher than the estimate of 0.0630 predicted by Morey-Z for the same season.
4Discussion
The results presented here demonstrate that the use of the log5 estimation of the outcome of batter/pitcher matchup can yield unrealistic estimates when applied to baseball metrics that deviate substantially from a conceptual mean probability of.500. In particular, across repeated observations of all plausible combinations of batter, pitcher, and league average metrics, the log5 formula appears to skew estimation toward a conceptual underlying mean probability of.500— a tendency which has been shown to work well for estimating wins and losses in a particular league (James, 1983), but which can significantly distort the distributions of statistics with much lower (and presumably much higher) base rate probabilities. This distortion becomes particularly marked in instances where either the batter or the pitcher demonstrate an observed probability that markedly exceeds the league average— most notably in “outlier” observations, such as Babe Ruth in 1921 or Barry Bonds in 2001. However, the skewing effect is apparent even with less pronounced outliers, and is measureable across thousands of different potential combinations of batter, pitcher, and league average proportions. In fact, when applied to the past 18 seasons worth of “positive outlier” matchup observations for HR% as represented by players who were at least 1 standard deviation above the league mean, the log5 estimate overpredicted actual home run performance insubsequent matchups between these players in every one of these 18 seasons. Furthermore, these 18 seasons demonstrated HR% distributions with generally lower positive skew (ranging from.088 in 2008 to.720 in 2001) than has been observed throughout the history of baseball (e.g., skewness of 4.427 in Ruth-dominated 1920). In seasons with high positive skew with more extreme positive outliers, the overestimation bias of log5 would be expected to be even larger.
Although this bias in log5 is measurable, it is important to point out that to our knowledge the tendency has not been remarked upon in the 30 years since it was first introduced as a strategy for matchup estimation—despite having been incorporated into various baseball simulation programs and having provided the basis for a number of Monte Carlo investigations of such matchups, such as the recent study by Rudelius (2012). Why would this bias not have been apparent in such simulation efforts? The answer probably lies in that the log5 bias is most marked among the outlier observations, and in any simulation effort it is anticipated that outliers will be particularly difficult to simulate. Thus, observed deviations between simulation and reality at the extreme positive end of a distribution are likely to be ascribed to chance factors associated with the recognized unreliability of modeling such observations. Indeed, this factor poses a challenge to any modeling effort— but the bias introduced by the log5 formula is systematic and independent of such factors. In fact, the bias operates in the opposite direction of the effects of typical actuarial estimation of outlier observations, which would lead to “regression to the mean”— at the extremes, the log5 estimates move increasingly away from the mean. For baseball statistics that approach a.500 conceptual mean probability and are roughly normally distributed (such as, say, on-base percentage), the effects of log5 bias would likely be subtle and difficult to identify in the simulation of a particular season. However, in statistics such as HR% that have typical probabilities well below.500, log5 demonstrates a strong tendency to overestimate outcomes among the positive outliers in any sample.
This paper also introduces an alternative estimation strategy, the Morey-Z formula, that represents a composite Z-score derived from batter and pitcher binomial event probabilities that are then linearly transformed back into the league distribution metric based upon league distribution properties. Although derived from the same three parameters that underlie the log5 formula, the estimates resulting from an application of the Morey-Z formula do not show the characteristic skewing tendency of log5 (see Table 1 and Table 2), even in estimating probabilities that deviate markedly from.500 (see Fig. 1).
It should also be noted that the Morey-Z formula can be used in a generalized form to provide reasonable estimates of outcomes for batters and pitchers sampled from different leagues or from different seasons. This generalized form can be represented as follows:
(4)
P LB = Batter’s league average for event proportion for batter’s season
P LP = Pitcher’s league average for proportion for pitcher’s season
This formula standardizes batters and pitchers separately with respect to their own league average, and then provides a final estimate scaled against a composite of the two league averages and standard deviations. To work through a specific example, consider 1921 Babe Ruth facing 2009 Johan Santana. Ruth (59 HR in 693 plate appearances = .0851) far exceeded his league average (1921 AL 477 HR in 48,698 PA = .0098) in the probability of hitting a home run. Santana (20 HRA in 701 batters faced = .0285) was slightly worse than the average 2009 NL pitcher in this respect (2,548 HR in 99,649 BF = .0256). Ruth had a standardized binomial event probability that was.7644 SD above the league mean; Santana’s rate was only.0184 SD above his league mean. Aggregating these two estimates and dividing by SQRT(2), reflecting the estimate of the SD of two combined Z-scores (e.g., Medina-Pastor et al., 2010), yields a composite Z-score of.5535. Computing a composite league SD and composite league mean for the 1921 AL and the 2009 NL yields values of SD = 0.1316 and M = 0.0177. The final step involves multiplying the composite Z-score of.5535 by.1316, then adding.0177 to that product, resulting in a Morey-Z estimate for this matchup of.0906. By way of comparison, the log5 estimate (using the same composite for league average) for this matchup is.1315, a notable difference but one that might be difficult to detect in a single simulated season. It should also be noted that Santana’s HRA% was close to the league average; as shown in Fig. 1, the log5 bias becomes more pronounced as values deviate from league averages. Thus, if we were to replace Santana with 2009 HRA leader Braden Looper (39 HR in 866 BF = 0.045 HRA%), the matchup Morey-Z estimate HR% rises to.1027, but the log5 estimate climbs appreciably more, to.1957. As a result, in a season of plate appearances against Looper, log5 would predict Ruth would hit roughly 135 home runs— a prediction that clearly runs counter to any expected regression to the mean resulting from estimation.
It must be noted that the modeling of anticipated outcomes in specific batter/pitcher matchups is imprecise at best, and that even when pooling players from a season as was used here, there are limited samples of real observations from players that truly reflect outlier observations, such as Babe Ruth during his prime. Even so, the results presented here suggest that the log5 formula for batter/pitcher matchup outcome estimation introduces significant biases that are unlikely to accurately predict results for positive outliers under conditions of uncertainty. The markedly skewed relationship between log5 estimates of outcome and batter performance as shown in Fig. 1 suggest that log5 provides estimates that contrast with the conclusions of the most comprehensive previous study of this topic to date, that by Stern and Sugano(2008), who concluded “there is in fact much less variation in batting performance across different pitchers than would be suggested by looking at the results of small samples.” (Stern & Sugano, 2008, p. 164). That conclusion is borne out by the predictive data presented here, where subsequent matchups with high HRA% pitchers did not lead to a HR% that was appreciably different from the batter’s typical HR% .
Given the overestimation issues with log5, this paper proposes an alternative combination of the same parameters, the Morey-Z formula, that appears to provide estimates that better reflect the underlying properties of the parameters used to derive the estimates, and that yields estimates that better align with observed data and with Stern and Sugano’s previous conclusions. Thus, for example, any baseball team attempting to understand the effect of a particular batter-pitcher matchup is likely to overestimate the probability of many outcomes if using the log5 estimate, especially when applied to positive outlier players, and the results presented in this paper suggest that Morey-Z would be a better tool for such applications.
Nonetheless, it should be emphasized that this observation of biases in log5 estimation is not directed at the original function of the log5 formula, which was to estimate the probability of winning between two teams selected from the same league (James, 1981). For that application, the log5 formula is quite well suited and it appears to be empirically accurate. However, researchers, baseball executives, game developers, and other individuals interested in predicting outcomes of specific batter/pitcher matchups should be aware of the limitations of the log5 formula for this application, and of alternative methods such as the Morey-Z formula presented here.
References
1 | Boronico JS(1999) Multi-tiered playoffs and their impact on professional baseballThe American Statistician53: 5661 |
2 | Bradley RA, Terry ME(1952) Rank analysis of incomplete block designs, I. the method of paired comparisonsBiometrika39: 324345 |
3 | Cohen J(1992) A power primerPsychological Bulletin112: 155159 |
4 | Curiosity Computing (2013). Digital Diamond Baseball (Version 3.0). Retrieved May 2, 2013 http://www.digitaldiamondbaseball.com |
5 | James B(1981) The Bill James baseball abstract1981New YorkBallantine Books |
6 | James B(1983) The Bill James baseball abstract1983New YorkBallantine Books |
7 | Lahman, S. (2015). Lahman Baseball Database. Retrieved April 16, http://www.seanlahman.com/baseball-archive/statistics/ |
8 | Medina-Pastor P, Mezcua M, Rodriguea-Torreblanca C, Fernandez-Alba AR(2010) Laboratory assessment by combined z score values in proficiency testsAnalytical and Bioanalytical Chemistry397: 30613070 |
9 | McCall WA(1922) How to measure in education1922New YorkMacmillan |
10 | Pomeroy, K. (2013). 2013 NCAA tournament log5. Retrieved 697 May 2, 2013, http://www.kenpom.com/blog/index.php/weblog/entry/2013_ncaa_tournament_log5 |
11 | Retrosheet (2015). Retrosheet Event Files. Retrieved April 16, 2015, http://www.retrosheet.org/game.htm |
12 | Rudelius TW(2012) Did the best team win? Analysis of the 2010 Major League Baseball postseason using Monte Carlo simulationJournal of Quantitative Analysis in Sports134410.1515/1559-0410.1344Manuscript |
13 | Schmidt, D.B. (2009). Strategic Baseball Simulator (Version 4.9.1). Retrieved May 2, 2013 http://sbs.baseball.com/sbs491.pdf |
14 | Stern HS, Sugano A(2008) Inference about batter-pitcher matchups in baseball from small samplesAlbert J, Koning RHStatistical Thinking in Sports153165Boca RatonChapman and Hall/CRC |
Figures and Tables
Fig.1
Scatterplot of log5 and Morey-Z HR% estimates as a function of Batter –League HR% differential.
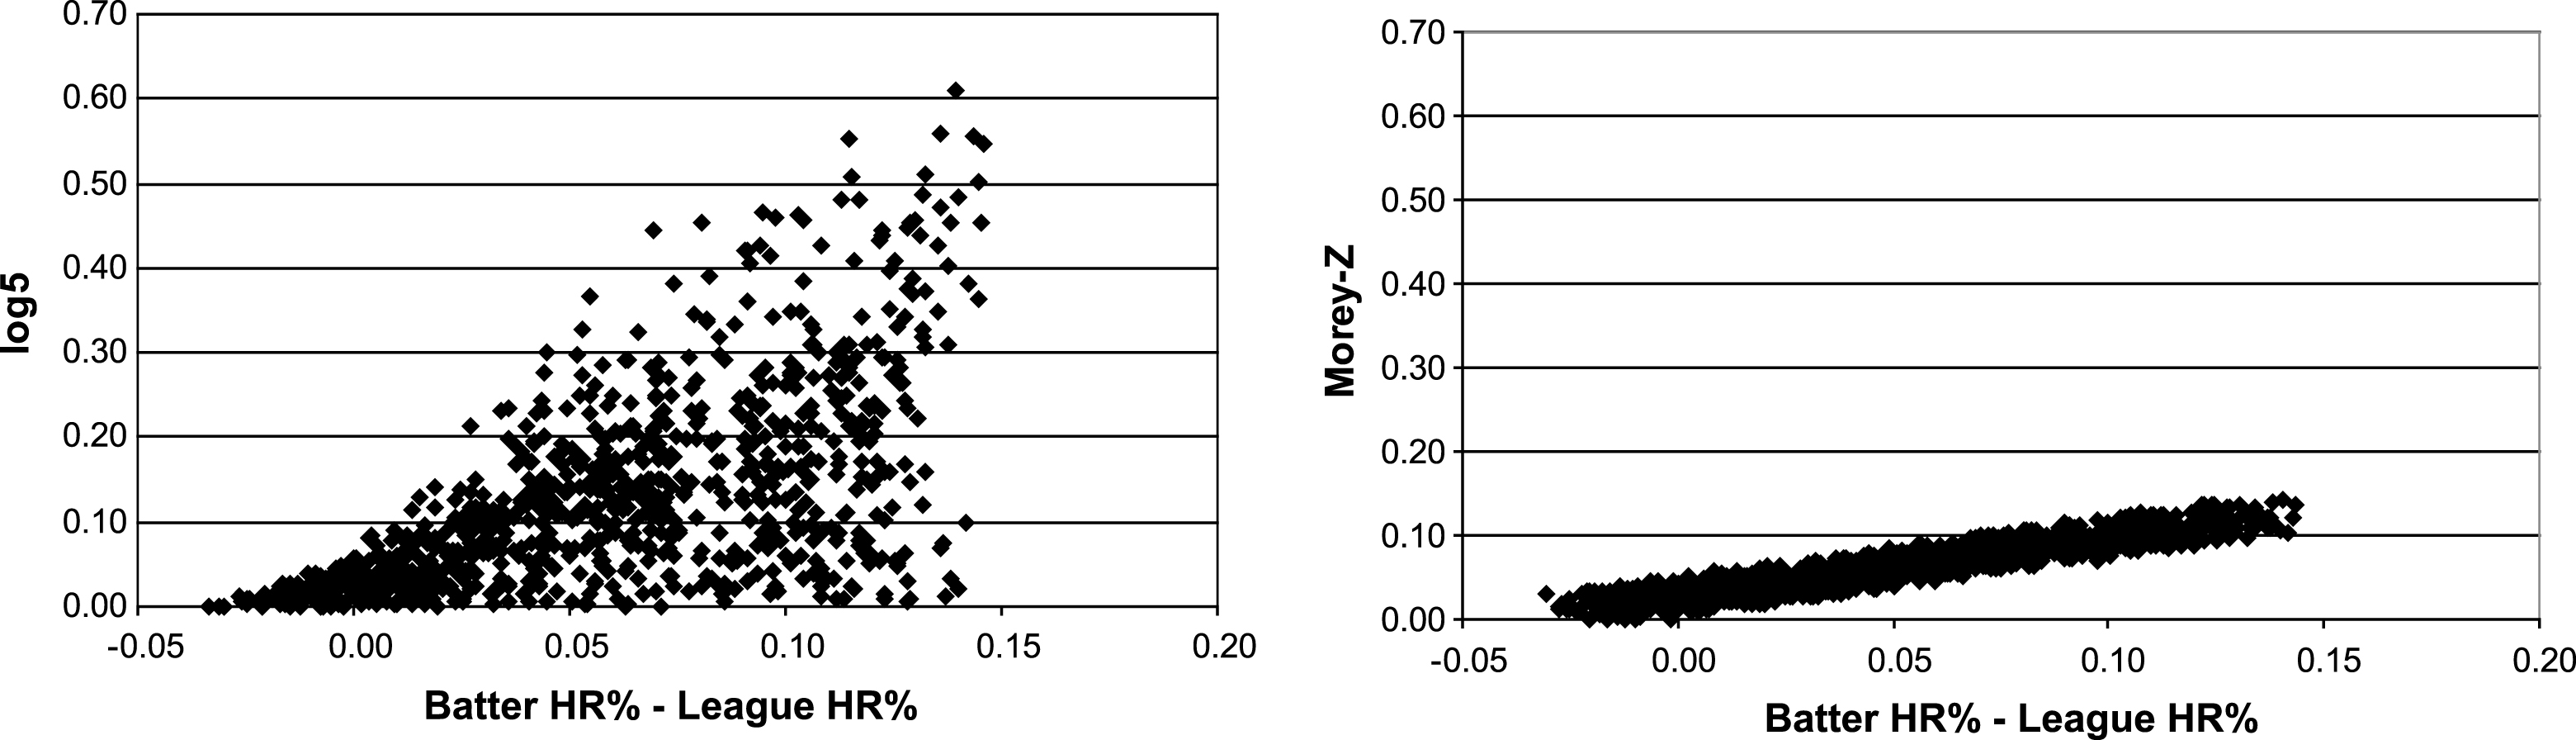
Table 1
Mean and skewness values for 20 samples of 1000 combinations of batter/pitcher matchup parameters, and resulting estimates of batting average
| Sample | Batters- | Pitchers- | League | Batters- | Pitchers- | Lg Mean | log5- | log5- | Morey-Z | Morey-Z | Correlation |
| Mean | Mean | Mean | Skew | Skew | Skew | Mean | Skew | Mean | Skew | ||
| 1 | 0.30465 | 0.27113 | 0.26737 | –0.02449 | 0.05040 | –0.02872 | 0.30886 | 0.22485 | 0.29639 | –0.04253 | 0.99044 |
| 2 | 0.29925 | 0.27469 | 0.26583 | 0.02933 | –0.05760 | 0.00598 | 0.30879 | 0.27480 | 0.29573 | 0.00636 | 0.99048 |
| 3 | 0.30070 | 0.27314 | 0.26710 | 0.02527 | 0.02646 | –0.04386 | 0.30696 | 0.24378 | 0.29513 | –0.01503 | 0.99011 |
| 4 | 0.30271 | 0.27179 | 0.26759 | 0.00444 | 0.03617 | –0.07957 | 0.30760 | 0.28282 | 0.29539 | 0.01636 | 0.99069 |
| 5 | 0.30185 | 0.27107 | 0.26602 | –0.01316 | 0.08818 | 0.05544 | 0.30693 | 0.27281 | 0.29493 | 0.00322 | 0.98966 |
| 6 | 0.30004 | 0.27438 | 0.26649 | 0.00594 | –0.01862 | –0.05298 | 0.30906 | 0.24942 | 0.29579 | –0.03103 | 0.99075 |
| 7 | 0.30081 | 0.27381 | 0.26564 | –0.01842 | –0.01691 | 0.06267 | 0.30923 | 0.29884 | 0.29628 | 0.03193 | 0.98986 |
| 8 | 0.30322 | 0.27431 | 0.26574 | –0.03007 | –0.09734 | 0.05291 | 0.31197 | 0.23206 | 0.29830 | –0.05064 | 0.98943 |
| 9 | 0.30592 | 0.27274 | 0.26564 | –0.07925 | 0.00441 | 0.06982 | 0.31337 | 0.21258 | 0.29914 | –0.03744 | 0.98978 |
| 10 | 0.30044 | 0.27446 | 0.26664 | 0.00030 | –0.02879 | –0.01147 | 0.30869 | 0.21649 | 0.29607 | –0.04848 | 0.99058 |
| 11 | 0.30283 | 0.27261 | 0.26774 | –0.07048 | 0.02141 | –0.04559 | 0.30809 | 0.26002 | 0.29600 | –0.01743 | 0.98981 |
| 12 | 0.30204 | 0.27727 | 0.26695 | –0.01503 | –0.06766 | –0.01494 | 0.31302 | 0.19519 | 0.29906 | –0.05114 | 0.99005 |
| 13 | 0.30342 | 0.27349 | 0.26588 | –0.02657 | –0.00083 | 0.10220 | 0.31133 | 0.25963 | 0.29781 | 0.00192 | 0.99036 |
| 14 | 0.30129 | 0.27534 | 0.26735 | 0.04703 | –0.04874 | –0.07164 | 0.31027 | 0.23771 | 0.29700 | –0.00794 | 0.99074 |
| 15 | 0.30151 | 0.26943 | 0.26721 | –0.02297 | 0.05512 | –0.05058 | 0.30392 | 0.32871 | 0.29303 | 0.03371 | 0.98993 |
| 16 | 0.29935 | 0.27295 | 0.26674 | 0.02044 | –0.02585 | –0.00534 | 0.30581 | 0.26967 | 0.29419 | –0.00222 | 0.98971 |
| 17 | 0.30114 | 0.27428 | 0.26650 | –0.02020 | –0.01787 | –0.00098 | 0.30926 | 0.41788 | 0.29650 | 0.17874 | 0.99083 |
| 18 | 0.30084 | 0.27307 | 0.26678 | 0.00095 | –0.01193 | 0.00240 | 0.30735 | 0.24942 | 0.29531 | –0.03376 | 0.99021 |
| 19 | 0.29528 | 0.26961 | 0.26641 | 0.13317 | 0.06155 | 0.05131 | 0.29876 | 0.38752 | 0.28909 | 0.09295 | 0.98959 |
| 20 | 0.30230 | 0.27241 | 0.26602 | –0.00557 | 0.01215 | 0.04149 | 0.30922 | 0.17486 | 0.29619 | –0.09394 | 0.98986 |
| Mean | 0.30148 | 0.27310 | 0.26658 | –0.00297 | –0.00181 | 0.00193 | 0.30843 | 0.26445 | 0.29587 | –0.00332 | 0.99014 |
| SD | 0.00222 | 0.00189 | 0.00068 | 0.04407 | 0.04704 | 0.05205 | 0.00324 | 0.05921 | 0.00220 | 0.05854 | 0.00044 |
Table 2
Average and skewness values for 20 samples of 1000 combinations of batter/pitcher matchup parameters, and resulting estimates of home run percentage
| Sample | Batters- | Pitchers- | League | Batters- | Pitchers- | Lg Mean | log5- | log5- | Morey-Z | Morey-Z | Correlation |
| Mean | Mean | Mean | Skew | Skew | Skew | Mean | Skew | Mean | Skew | ||
| 1 | 0.07853 | 0.02976 | 0.02037 | –0.06741 | 0.04638 | –0.00139 | 0.12219 | 1.24845 | 0.06813 | –0.02312 | 0.78582 |
| 2 | 0.07788 | 0.03091 | 0.02020 | –0.06064 | –0.07622 | 0.02742 | 0.12706 | 1.11389 | 0.06856 | –0.06038 | 0.77665 |
| 3 | 0.07838 | 0.02920 | 0.02066 | –0.05628 | 0.06453 | –0.03439 | 0.11797 | 1.23540 | 0.06751 | –0.07096 | 0.77023 |
| 4 | 0.07913 | 0.02930 | 0.02041 | –0.05488 | 0.09948 | –0.02233 | 0.11935 | 1.30961 | 0.06821 | –0.03155 | 0.77985 |
| 5 | 0.07607 | 0.03060 | 0.02040 | 0.01694 | –0.01482 | –0.02557 | 0.11897 | 1.26516 | 0.06697 | –0.03429 | 0.76142 |
| 6 | 0.07903 | 0.02886 | 0.02043 | 0.00151 | 0.05795 | –0.01310 | 0.11681 | 1.35709 | 0.06783 | –0.00895 | 0.75049 |
| 7 | 0.07688 | 0.02910 | 0.02038 | 0.00250 | 0.08486 | 0.02814 | 0.11888 | 1.34182 | 0.06650 | –0.00885 | 0.78218 |
| 8 | 0.07734 | 0.02988 | 0.02049 | –0.04087 | 0.01522 | 0.02808 | 0.11890 | 1.26582 | 0.06733 | –0.05503 | 0.78233 |
| 9 | 0.07962 | 0.02948 | 0.02048 | –0.03205 | 0.02227 | 0.02727 | 0.12136 | 1.20873 | 0.06866 | –0.01272 | 0.77164 |
| 10 | 0.07631 | 0.02930 | 0.02055 | 0.01793 | –0.01104 | –0.04394 | 0.11683 | 1.27227 | 0.06617 | 0.00914 | 0.77978 |
| 11 | 0.07834 | 0.03023 | 0.02022 | –0.05051 | –0.00255 | 0.07932 | 0.12373 | 1.27654 | 0.06840 | –0.03896 | 0.78285 |
| 12 | 0.07739 | 0.02947 | 0.02028 | –0.02756 | 0.02018 | 0.03538 | 0.11926 | 1.27889 | 0.06716 | –0.00493 | 0.77388 |
| 13 | 0.07799 | 0.03013 | 0.02075 | –0.02836 | 0.00148 | –0.05748 | 0.12254 | 1.24639 | 0.06786 | –0.01998 | 0.79094 |
| 14 | 0.07581 | 0.03002 | 0.02098 | 0.03594 | 0.01392 | –0.03287 | 0.11644 | 1.17758 | 0.06614 | –0.00984 | 0.78650 |
| 15 | 0.07551 | 0.03021 | 0.02081 | 0.04231 | 0.00437 | –0.05511 | 0.11454 | 1.29869 | 0.06613 | 0.06292 | 0.78749 |
| 16 | 0.07498 | 0.03055 | 0.02061 | 0.02813 | –0.02346 | –0.05050 | 0.11944 | 1.26962 | 0.06608 | 0.02350 | 0.78794 |
| 17 | 0.07791 | 0.03000 | 0.02006 | 0.00476 | –0.03239 | 0.02330 | 0.12634 | 1.38961 | 0.06800 | –0.04939 | 0.77372 |
| 18 | 0.07905 | 0.03007 | 0.02028 | –0.07445 | –0.01929 | 0.05490 | 0.12436 | 1.19847 | 0.06875 | –0.05324 | 0.78540 |
| 19 | 0.07593 | 0.02961 | 0.02009 | –0.03088 | 0.03525 | 0.05125 | 0.12072 | 1.19223 | 0.06631 | –0.06515 | 0.77650 |
| 20 | 0.07859 | 0.02990 | 0.01998 | –0.02736 | –0.01256 | 0.02475 | 0.12601 | 1.10969 | 0.06844 | –0.02406 | 0.78154 |
| Mean | 0.07753 | 0.02983 | 0.02042 | –0.02006 | 0.01368 | 0.00216 | 0.12059 | 1.25280 | 0.06746 | –0.02379 | 0.77836 |
| SD | 0.00137 | 0.00054 | 0.00026 | 0.03622 | 0.04225 | 0.04087 | 0.00354 | 0.07234 | 0.00096 | 0.03256 | 0.00971 |
Table 3
Predicted HR% from log5, Morey-Z, and logistic regression for subsequent season matchups of positive outlier batters and pitchers
| Season | League HR% | +1SD BHR% | +1SD PHR% | Year+1 | n | Estimated HR% | ||
| Matchup HR% | ||||||||
| log5 | M-Z | Logistic Regression | ||||||
| 2013 | 0.0246 | 0.0528 | 0.0356 | 0.0378 | 450 | 0.0756 | 0.0523 | 0.0655 |
| 2012 | 0.0261 | 0.0565 | 0.0390 | 0.0466 | 343 | 0.0830 | 0.0567 | 0.0759 |
| 2011 | 0.0241 | 0.0533 | 0.0365 | 0.0521 | 365 | 0.0796 | 0.0535 | 0.0714 |
| 2010 | 0.0242 | 0.0551 | 0.0344 | 0.0577 | 416 | 0.0772 | 0.0532 | 0.0706 |
| 2009 | 0.0263 | 0.0576 | 0.0367 | 0.0488 | 389 | 0.0793 | 0.0558 | 0.0737 |
| 2008 | 0.0254 | 0.0552 | 0.0379 | 0.0718 | 418 | 0.0809 | 0.0553 | 0.0721 |
| 2007 | 0.0257 | 0.0544 | 0.0349 | 0.0545 | 532 | 0.0730 | 0.0525 | 0.0618 |
| 2006 | 0.0280 | 0.0632 | 0.0383 | 0.0382 | 445 | 0.0852 | 0.0601 | 0.0780 |
| 2005 | 0.0263 | 0.0596 | 0.0387 | 0.0714 | 434 | 0.0862 | 0.0586 | 0.0775 |
| 2004 | 0.0283 | 0.0604 | 0.0424 | 0.0798 | 426 | 0.0891 | 0.0610 | 0.0866 |
| 2003 | 0.0271 | 0.0589 | 0.0376 | 0.0533 | 507 | 0.0807 | 0.0570 | 0.0725 |
| 2002 | 0.0266 | 0.0607 | 0.0373 | 0.0423 | 355 | 0.0842 | 0.0583 | 0.0808 |
| 2001 | 0.0285 | 0.0672 | 0.0386 | 0.0615 | 520 | 0.0898 | 0.0630 | 0.0789 |
| 2000 | 0.0292 | 0.0635 | 0.0417 | 0.0789 | 545 | 0.0892 | 0.0623 | 0.0791 |
| 1999 | 0.0284 | 0.0663 | 0.0386 | 0.0716 | 545 | 0.0890 | 0.0624 | 0.0818 |
| 1998 | 0.0263 | 0.0648 | 0.0379 | 0.0788 | 673 | 0.0918 | 0.0617 | 0.0773 |
| 1997 | 0.0257 | 0.0605 | 0.0366 | 0.0504 | 456 | 0.0849 | 0.0580 | 0.0765 |
| 1996 | 0.0270 | 0.0646 | 0.0373 | 0.0552 | 507 | 0.0878 | 0.0609 | 0.0819 |


