
The gender effects of the new Boston Marathon qualification standards
Abstract
In 2011, the Boston Athletic Association tightened the standards to qualify for the Boston Marathon from 2013 onwards. By simply deducting five minutes and eliminating grace periods, the BAA failed to address differences between female and male qualifying times. Given public outcry and claims of unfairness, our paper tests whether the new standards had unequal gender effects on qualification. Using data on 1.42 million finishers over six years, we find that male qualifying decreased by 5% under the new standards while female qualifying only decreased by 2% , though these effects vary across age divisions.
1Introduction
By many accounts, the annual Boston Marathon organized by the Boston Athletic Association (BAA) each April is one of the most prestigious events on the annual racing calendar. In an effort to maintain both the elite character and overall size of the race, the BAA announced on February 15, 2011 that is was tightening the Boston Marathon qualification standards (BQ) starting in 2013. In broad terms, the BAA deducted five minutes from the qualifying times for all age groups, eliminated the 59 second grace period (i.e., a runner with a 3:10:00 (hours:minutes:seconds) qualifying standard could no longer run 3:10:59 and still qualify), and continued a rolling enrollment system, introduced the previous year, which allowed the fastest participants relative to their qualifying time to register first. However, the new standards did not address changes across gender, so females of all ages still had qualifying times 30 minutes slower than males of the same age. This 30-minute gender gap was identical to the old qualification standards. The window for the 2013 Boston Marathon, and the new standards, opened on September 23, 2011 so all athletes running a qualifying marathon on or after that day had to run under the new standards to qualify. The old and new qualifying standards are summarized in Table 1
Despite the BAA’s assertion that the changes were made to “recognize athletic performance above all else," the adjustment was met with considerable outcry from runners who deemed the changes unfair. Specifically, many felt that the new standards imposed stricter requirements on male runners as compared to those for their female counterparts. This paper is the first to examine this heated topic by exploring whether or not the changes to the rules have had a differential impact on the qualifying outcomes for men and women. Using data on over 1.42 million marathon finishers, we find that the new qualification standards for the Boston Marathon decreased male qualification by 5% overall, while decreasing female qualification by only 2% . We also find that the proportion of female athletes who qualify for the Boston Marathon is larger than male qualification for younger runners, but this trend is reversed for older runners. Thus, the new standards do appear to have disproportional impacts with respect to both gender and age.
The announcement by the BAA provided the full details of the new qualification standards, but failed to explain why those specific standards were chosen as compared to other possibilities. In contrast, the qualification changes announced for the 2016 New York City Marathon explicitly acknowledged unequal effects across age groups by stating:
“In reviewing entries from nearly a decade of New York City Marathon history, we found that the percentage of time qualifiers has been inconsistent across the different age categories; qualifying by time was tougher for runners in certain age groups. We intend for our new standards to offer equal access to our most competitive applicants across all age categories and to allow the highest possible percentage of runners from each category to earn guaranteed entry into the TCS New York City Marathon.” (New York Road Runners, 2015)
The only statement BAA made about the process leading to the new Boston qualifying standards was that they were the culmination of “more than three months of analysis, including input from the running industry,” and were designed to allow runners more time to register (i.e., decrease the number of registrants and give runners a longer window to register) while being “a more systematic, performance-based process” for qualifying and registering. (Boston Athletic Association, 2011)
While the new standards for the Boston Marathon were clear, the lack of transparency of the process that generated the standards led to public discussion immediately after the announcement. This discussion was characterized by angst, confusion, and frustration over the possible impact across participation on gender and age groups. This discourse is apparent in the following comments that appeared in public forums such as Runners World Magazine and LetsRun.com since the changes were announced:
1 “No, the women’s standards are way too easy. My wife is 30 minutes under her standard and she is 41. Why do women get an extra 30 minutes (over 1 min per mile slower)?”
2 “...there are more male runners than female runners in races. So, if the Boston marathon organization wants to attract as many males and females, it has to be more elitist for men.”
3 “Since the decreases aren’t proportional, but are just fixed minute amounts, the cuts will only increase the bias toward older, female runners. I guess they must buy more merchandise?”
4 “This is worst news for younger runners. It is much harder to cut 15 minutes off a 3:10 time than off a 3:45 time, for example.”
5 “It sounds like the race will be even more skewed towards the age groups that already have it a bit proportionally easier than others.”
6 “I’m not sure the BAA cares about the whining and complaining that the qualified-but-not-accepted do.”
Issues of gender equity are not new by any means, and were the root of actions such as the formulation of Title IX legislation (e.g., Heckman, 1992), but the Boston Marathon is one of few events in which men and women compete at the same time for a limited number of slots. Regardless of being in different divisions and pools, the prestige of participating in the event combined with the relative scarcity of slots added to the fervor of perceptions of unfairness and inconsistency in the new qualification rules and procedures (e.g., Mannes, 2011).
The perception of gender bias in the Boston Marathon does have some empirical warrant. Wainer, Njue and Palmer (2000) show that elite females have improved faster than elite males in competitive running and swimming since the 1970s. Frick (2011) supports this view using data from ultramarathons. However, while the gender gap in running has declined in absolute terms, Kovalchik (2012) demonstrates that the gender gap in relative terms has held steady for several years at around 10%, or females run around 10% slower times than males. This steady 10% gender gap for elite athletes can be seen in Figure 1. It contains different elite marathon times by year since 1972, the first year females were allowed to legally participate in the Boston Marathon. The figure contains winning Boston Marathon times, marathon times for the fastest marathon run in that year (worldwide), and the recognized marathon World Record time. The scale is female time relative to male time (i.e., a 1.13 represents the female time was 13% slower than the male time in that year). All three measurements of elite level performance support the narrative that the absolute gap has closed since the 1970s while the relative gap has held constant since the early 1980s at around 1.10.
Elite athletes, however, need not worry about qualifying for the Boston Marathon since they are competing for prize money and will often be invited to Boston. A more representative sample for those who train to qualify for Boston would be the average marathoner. Figure 2 displays average female marathon finishing time (all finishers) relative to average male finishing time. The figure is calculated using the average for all female finishers and the average for all male finishers by year for U.S. marathons. It clearly shows that the average female has been improving over the average male since 2002; in 2002 the average gender gap was approximately 14% , but by 2011 it is much closer to 10% . Average runners have just recently reached the same gender gap that elite runners achieved in the 1980s.
Figures 1 and 2 give some insight into how the Boston Marathon qualifying standards could have been changed for female and male marathoners. Based on elite athletes, female qualification times could have been adjusted to be 10% slower than male qualification times. Furthermore, if the BAA was concerned about the majority of qualifiers (non-elite), those females runners have improved more than male runners in recent years. Either way, the BAA did not adjust their qualifying times accordingly. Figure 3 shows the female qualifying times relative to male qualifying times, or presents the qualifying times in Table 1 in a relative scale. By analyzing the qualification times in Figure 3, it does indeed appear that the new qualification standards may be less restrictive for females as compared to males. Even though all runners must run faster under the new system, females across all age divisions can run slower relative to men under the new standards implemented by the BAA as compared to the old standards.
Figure 3 lends some credence and foundation to public outcry that the new qualification standards were more restrictive on males than they were on females. However, Figure 3 also indicates that age also plays an important role in the gender gap; young female runners can qualify with a slower time relative to men whereas older female runners need to run a time more compatible to men to qualify. This narrative is supported by Burfoot (2009), who suggests the usage of World Master Association (WMA) age grading to set qualification standards. This age grading is a way to compare times for runners of different ages. Using a set 65% age graded time Burfoot (2009), suggests that young females should have qualifying times only 19 minutes behind young men instead of 30 minutes, but older women should have qualifying times more than 2 hours behind men of similar age. Age graded times give credibility to public perception that 30 minute gender gaps, regardless of age, is not necessarily a fair one-size-fits-all approach.
To recap, changes to the qualifying standards for the Boston Marathon were met with confusion and frustration due to perceived differential treatment across sex and age. Data demonstrating that the gender gap is constant in relative terms, but not absolute terms, support public charges that the changes may not have been optimal. We next turn to our empirical analysis to examine whether there were indeed unequal gender effects in the implementation of the new standards. The results of our findings are then outlined, and finally we give some concluding remarks.
2Empirical methodology and data
Our estimation works as follows: we capture the overall pre and post qualifying time change with a dummy variable equal to 1 if the marathon was run after the new standards were in place and zero if it were run under the old standards. A dummy variable equal to 1 if the division is a female division and zero if it is a male division estimates how females compare to males overall in qualifying for the Boston Marathon. An interaction term of the time change and the gender division captures how females responded to the new standards as compared to males. More formally, we estimate:
where Q dit is the percentage of participants in age division d that qualified for the Boston Marathon in marathon i at time t, F d is a gender dummy variable equal to 1 for female divisions and 0 for male divisions, and NS it is a dummy variable equal for the new qualifying standards. Also included are marathon fixed effects, MAR i , age division fixed effects, DIV d , and weather variables for each marathon, X it .
In this estimation, we are implicitly assuming that females are the treatment group and males are the control group because our gender variable is equal to 1 for females. However, if males were assigned to the treatment group instead of females, β 1 and β 3 would simply switch signs but magnitude and significance would remain unchanged. This is not a true difference-in-difference per se, but the interaction term is capturing gender qualifying differences post qualifying standards change nonetheless. We expect the sign of β 2 to be negative, or the stricter qualifying standards lowered overall qualifying percentages for all divisions. Furthermore, public perception was that females would have an easier time qualifying under the new time standards; the overall effect of the new standards would be less severe for females than for males. We, therefore, predict β 3 to be positive
Data on marathon finishers come from http://www.marathonguide.com/index.cfm, which has tracked records of individual finishers for most marathons since 2000. A list of 33 marathons that qualified the most individuals for the 2013 marathon (as announced by the BAA) was chosen for our subsample. See Boston Athletic Association (2012) for this list, though it is updated to reflect the current Boston Marathon and maybe slightly different than marathons used in this paper as a result. From this list, we obtained 30 marathons. The three marathons not included were the Berlin Marathon, the Rock N Roll San Diego Marathon, and the Toronto Waterfront Marathon due to unavailability of finisher data at MarathonGuide.com. Table 2 contains the names of these marathons listed by year with the total percentage of runners whose times qualified to register for Boston. Note that the BAA qualifying season runs on an annual basis beginning at the end of September (i.e., the window for the 2010 Boston Marathon was September 2008 to September 2009). Cells containing a dash represent races that were canceled due to weather or for which no data were available.
We gathered data from these events for six Boston Marathon qualifying years, 2010–2015. These years include three before the new standards were implemented, and three under the new standards. This dataset includes 174 marathons total, 89 before the qualification change, and 85 after. Furthermore, we discarded individual finishers whose gender, age, or finish time information were incomplete. Last, we aggregate each race to age division, using percentages of Boston qualifiers in each race-division to be the dependent variable. Our final dataset contains 3326 race-divisions in total.
To control for variance in runner performance due to environmental conditions, we collected specific city weather data for each of the 174 marathons from http://www.wunderground.com. Data included in the estimation are temperature at 8 am, temperature at 8 am squared, the temperature difference between 8 am and 11 am, the dew point at 8 am (which accounts for both temperature and humidity), and a dummy variable for precipitation at 8 am. Most of the time, weather data were not available at exactly 8 am and 11 am and we collected data from the time nearest these two (always within ten minutes). We expect the coefficient for temperature 8 am to be positive, temperature squared to be negative, temperature climb to be negative, dew point to be negative, and precipitation to benegative.
Our data contain finishing times for 1,424,378 finishers in total, 595,593 (41.81%) of which were female, and 187,347 (13.15%) qualified for the Boston Marathon in their respective year. Table 3 presents the data by Boston age division. It separates finishers under the old standards (OS) and new standards (NS) for each age division and by gender. It presents the number of finishers for each division, the average, standard deviation, minimum, and maximum of finishing times, and the percentage that qualified for the BostonMarathon.
3Empirical results
The estimation results are presented in Table 4. The first column has results for a simple pooled regression without any fixed effects. The second column includes division fixed effects only. The third column has both division and race fixed effects, and the final column has additional year fixed effects (2010 and 2015 dummy variables were dropped as to avoid perfect collinearity). Across all the columns the coefficient on the female dummy variable is significantly negative and ranges from −1.48 to −1.95, or females qualified by about 1.5% less than males in the same age division before the standards were updated. However, after the new standards were implemented, females qualify in slightly higher percentages than males. Furthermore, the coefficient for new standards is negative and significant in all regressions. This signifies that male qualifying decreased close to 5% when the new standards were implemented. Finally, the interaction term is positive and significant in all regressions. These results suggest that the new qualifying standards affected females around 3% less than males of the same age, or female qualifying percentages only fell 2% under the new standards compared to the 5% decline for males. The descriptive statistics in Table 3 make it appear that the new standards had equal impacts on both males and females (see the bottom of Table 3). However, those results are overall averages that do not account for differences in age divisions, weather on the day of the marathon, nor marathon difficulty, factors for which our regressions explicitly control. Therefore, holding age division, weather, and marathon course constant, the new standards were more lenient on females as compared to males as is seen by the interaction term in Table 4.
Coefficients on weather variables are all signed as expected. We favor the third regression (division and race fixed effects) as time fixed effects hardly add any predicting power to the model, as is seen by the slight increase in the R-squared. Furthermore, race fixed effects are picking up any variation in the course such as the presence of large elevation changes, distance and number of water stations, or tiered starts. All of these may affect qualifying and need to be included. While we present only the heteroskedastic-robust standard errors, the results for the new standards and the interaction term remain significant at the 95% confidence level for all regressions in the table when clustering individual races (e.g. the Chicago Marathon or the Boston Marathon). However, the female dummy variable loses significance for all four regressions. All three terms remain significant when clustering by race-year (e.g. the 2010 Chicago Marathon or the 2011 Chicago Marathon). We have also ran all regressions with wind speed at 8am, but since this may be a headwind, tailwind, or crosswind, this variable, unsurprisingly, is insignificant in all regressions and the remaining coefficients are minimally affected by its inclusion.
The results in Table 4 include all qualifying years from 2010 to 2015. However, it may be the case that the years directly around the qualifying change are different than years further away from the standards change. More specifically, the announcement for the updated standards occurred during the 2012 qualifying year changed immediately for the 2013 qualifying year. People who raced to qualify for the Boston marathon may have jumped into a 2012 qualifying year race to avoid the new standards. Furthermore, there may have been an adjustment period during the 2013 qualifying year for runners to become accustomed to the new standards. With these thoughts in mind, we have excluded various years from the regression in Table 5. The first column excludes 2012 and 2013 qualifying years (2010-2011 and 2014-2015 are included), the next three columns only include one year under each set of standards; 2010 and 2015 in the second column, 2011 and 2014 in the third column, and 2012 and 2013 in the final column.
The first two columns (excluding 2012-2013 and 2010 and 2015 only) are remarkably similar to the results of Table 4 where the coefficients on female and new standards are negative and significant while the interaction term is positive and significant. However, the last two columns only have the new standards dummy variable being significant, while female and the interaction term are not. As discussed above, this is not surprising for the last column which only includes the 2012 and 2013 qualifying years, however the 2011 and 2014 years only regression in the third column may be due to the Boston Marathon bombing ingredient of 2013. Because of the bombing in 2013, in which a large number of runners failed to finish as a result of the course being closed to safety concerns, the BAA announced an expanded field in the 2014 marathon. Our data has 21,554 finishers for the 2012 Boston Marathon, 17,580 for the 2013 Marathon (the year of the bombings), and 31,805 for the 2014 Marathon. That is over a 10,000 increase in finishers from 2012 to 2014 due to the expanded field and this large increase may lead to abnormally different coefficients due to the large rise in runners attempting to qualify for the 2014 Marathon.
Finally, the narrative addressed in the introduction also suggests that gender qualifying times are nonlinear with respect to age. A constant age graded percentage for marathon times across all ages shows that females and males should run more similar marathon times while younger, and that female times slow much more rapidly than male times as age increases. This is highly suggestive that females should qualify in higher percentages than males while young, but this trend should reverse as age increases. The estimation results by age division are contained in Table 6. It only lists the estimated parameters for female, new standards, and the interaction term, though weather data and race fixed effects are also included in each regression. First, going down the column of the female coefficients, there does indeed seem to be substantial evidence that females qualify in larger numbers while younger, as the positive and significant coefficients for the 35-39, 40-44, and 45-49 age divisions signify. The female coefficient is insignificant for the 50-54 age division, and then negative and significant for divisions 55-59, 60-64, 65-69, and 70-74. Furthermore, the interaction term is insignificant in all divisions except the 55-59 and 70-74 age divisions, where it is positive and significant. This reflects that the new standards may have equal impacts on both males and females even though a constant 30-minute gap theoretically impacts gender differently as age varies. The last point from Table 6 is that the new standards coefficient is negatively significant for all age divisions except for the 75-79, but increasing in magnitude as age increases; suggesting that the new standards, regardless of gender, had a greater impact on elder runners, and had less of an effect on younger runners.
4Conclusion
Inspired by the issues raised in public outcry that followed modifications to qualifying procedures for the Boston Marathon, this paper has examined whether or not the changes have had differential effects across age and gender. Our findings, based on observations of 1.42 million runners over six years, indicate that the simple deduction of five minutes off of qualifying times used by the BAA has resulted in distortions between younger and older runners and between male and female runners. Overall, the new qualification standards adopted for the 2013 Boston Marathon decreased male qualification by 5% , while females only experienced a 2% reduction overall. We also find that young females qualify significantly more than young males, but this trend is reversed for older runners. Were it feasible, we would expand this study to track individual runners across time and limit the dataset to those runners explicitly attempting to qualify for the Boston Marathon. The data would then also allow us to track how age affects individuals over the course of their running careers instead of comparing age across different cohorts.
This paper is the first to analyze the effects of the change in the qualification standards of the Boston Marathon, but it is by no means a full and comprehensive study into either Boston Marathon itself or marathon running as a whole. The Boston Marathon, while perhaps the most beloved and popular amongst most runners, is not the only marathon in which standards have changed. As cited earlier, the New York City Marathon also recently changed the running standards for a guaranteed entry. Perhaps these types of changes had different gender impacts than the Boston Marathon and could be utilized in a more comprehensive study. Another avenue for additional work, with the right dataset, would be a counterfactual study, conducted to examine how different standards would have impacted entry for the Boston Marathon or other marathons that have undergone a similar structural change.
Central to our considerations at the outset was the issue of differential treatment by gender. We see that there was a material impact on many runners; this supports some of the tongue and cheek comments aimed at the BAA in regards to the new standards. More importantly, however, organizations that govern sport can clearly handle situations more deftly to avoid potential negative reaction. We could posit that an adjustable scale (rather than constant 30 minute gender gap), and allowing corrections to decisions during the first years of implementation, could have mitigated the reticence among those whose comments we cited in the introduction. The BAA could also have thwarted criticism by being more transparent as to why the standards were changed as opposed to simply changing the standards. As organizations that manage large events consider rule changes, statements should be made to address issues from the outset to provide insight into how changes were formulated and implemented, even if this means acknowledging potential biases, both in fairness to the athletes and in the interest of maintaining public support for any given organization and itsevent.
References
1 | Boston Athletic Association, 2011. ‘New qualifying times in effect for the 2013 Boston Marathon’. http://www.baa.org/news-and-press/news-listing/2011/february/boston-athletic-association-announces-new-registration-process.aspx |
2 | Boston Athletic Association, 2012. ‘Top qualifying races’. http://www.baa.org/races/boston-marathon/participant-information/qualifying/top-qualifying-races.aspx |
3 | Burfoot, A., 2009. “All in the timing”, Runner’s World.http://www.runnersworld.com/boston-marathon/all-timing?page=single |
4 | Frick B(2011) Gender differences in competitive orientations: Empirical evidence from ultramarathon runningJournal of Sports Economics12: 317340 |
5 | Heckman D(1992) “Women & athletics: A twenty year retrospective on Title IX”, University of Miami Entertainment & Sports Law ReviewHeinOnline9: |
6 | Kovalchik S(2012) “Men’s records and women’s: are the women better already?”, Significance9: 1823 |
7 | Mannes, G., 2011. “B.Q. or Die”, Runner’s World.http://www.runnersworld.com/boston-marathon/bq-or-die?page=single |
8 | New York Road Runners, 2015. ‘2016 time-qualifying standards’. http://www.tcsnycmarathon.org/plan-your-race/getting-in/2016-time-qualifying-standards |
9 | Wainer H, Njue C, Palmer S(2000) Assessing time trends in sex differences in swimming and runningChance13: 1015 |
Figures and Tables
Fig.1
Boston Marathon Winning Time, Fastest Marathon Time in World, and Marathon World Record Time by Year (Females Relative to Males). Source: Boston Athletic Association and MarathonGuide.com.
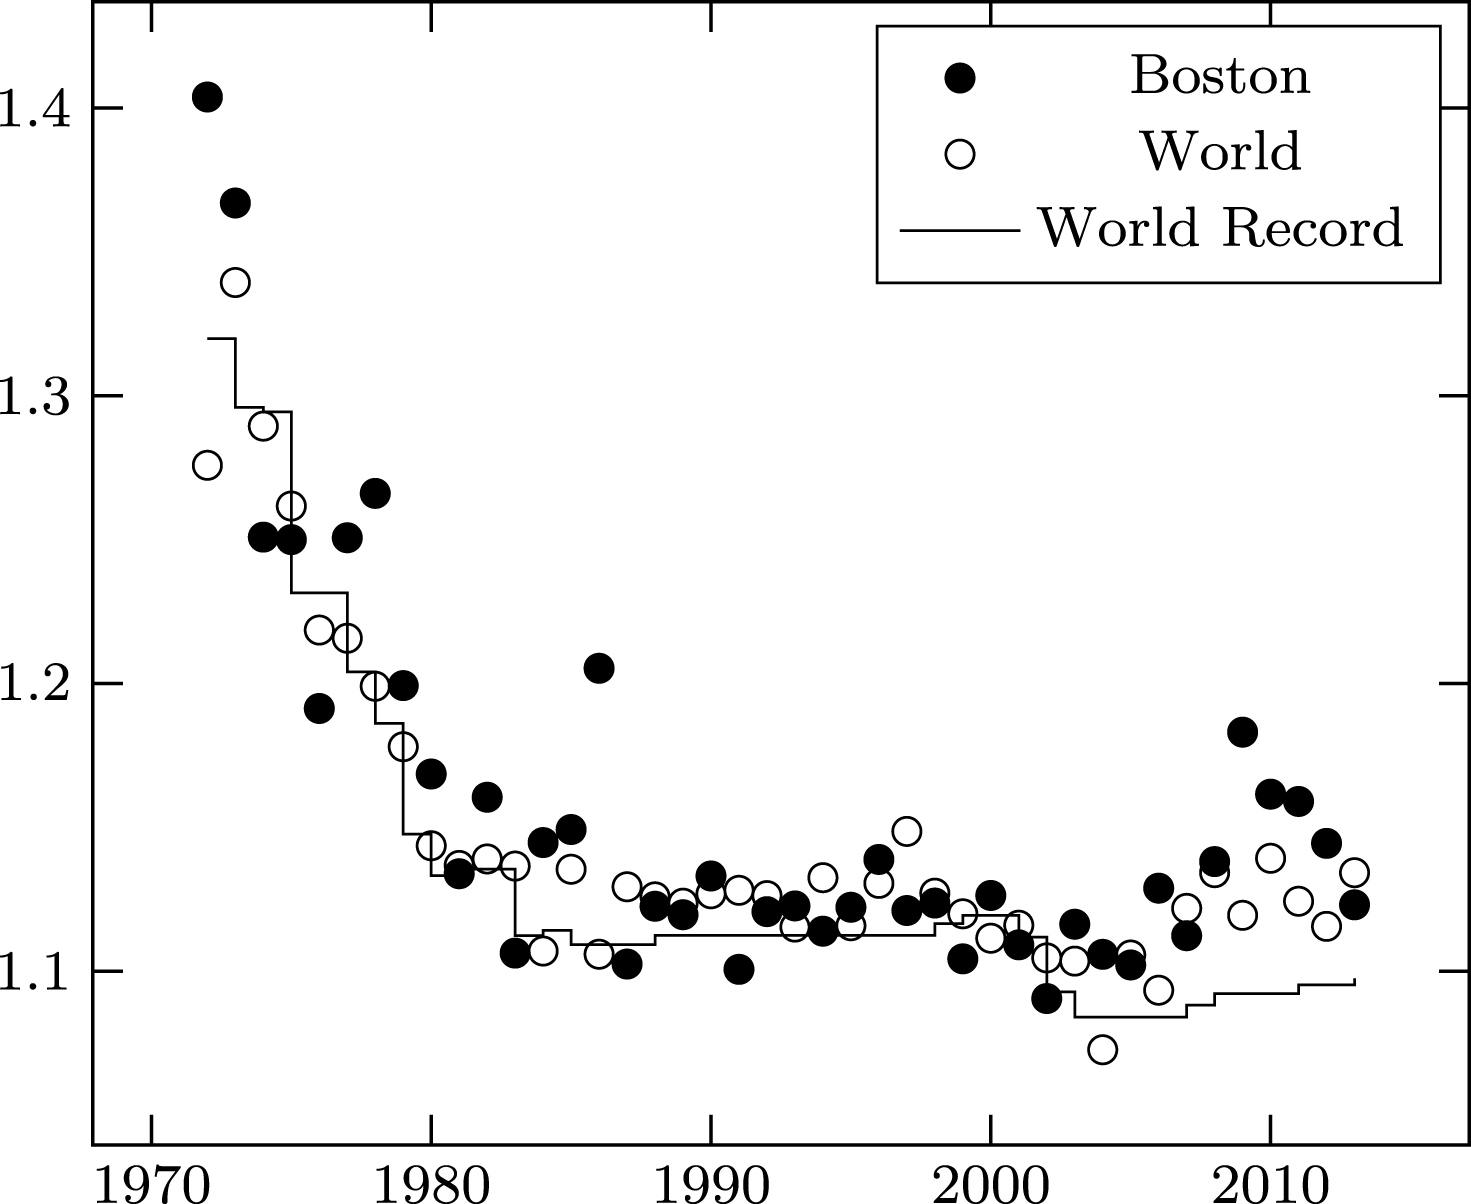
Fig.2
Average Female Finish Time Relative to Average Male Finish Time. Source: MarathonGuide.com.
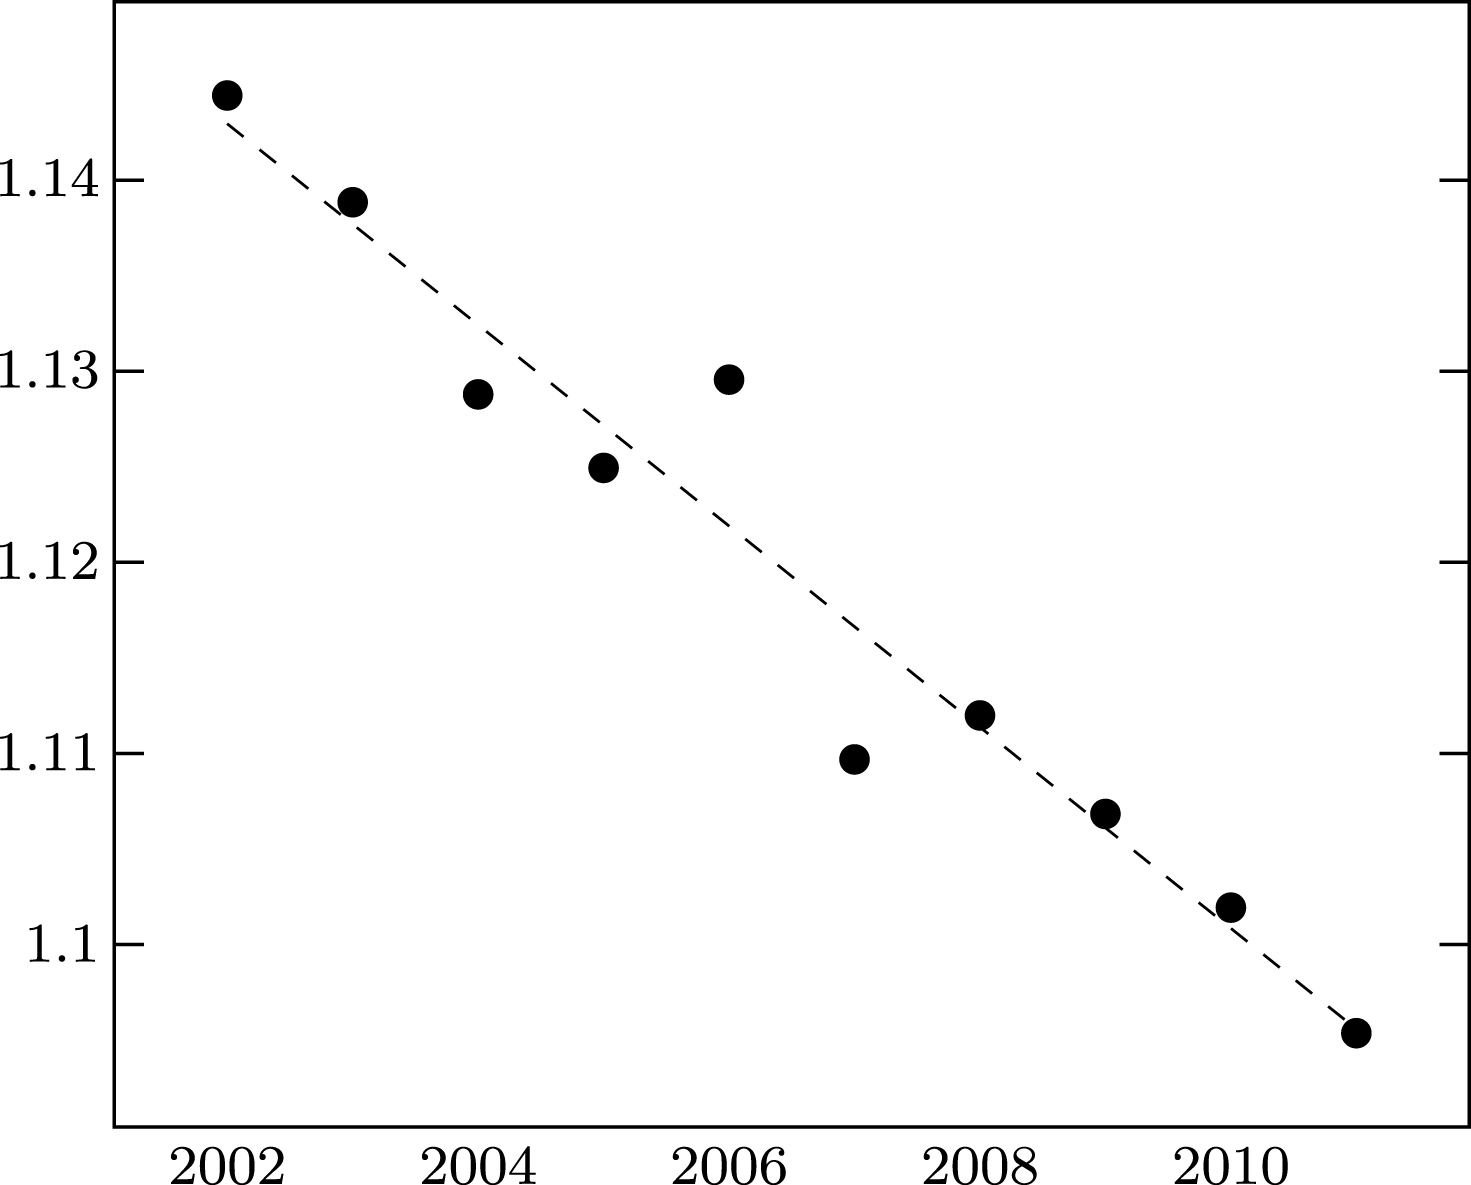
Fig.3
Female Qualification Times Relative to Male by Division Source: Boston Athletic Association.
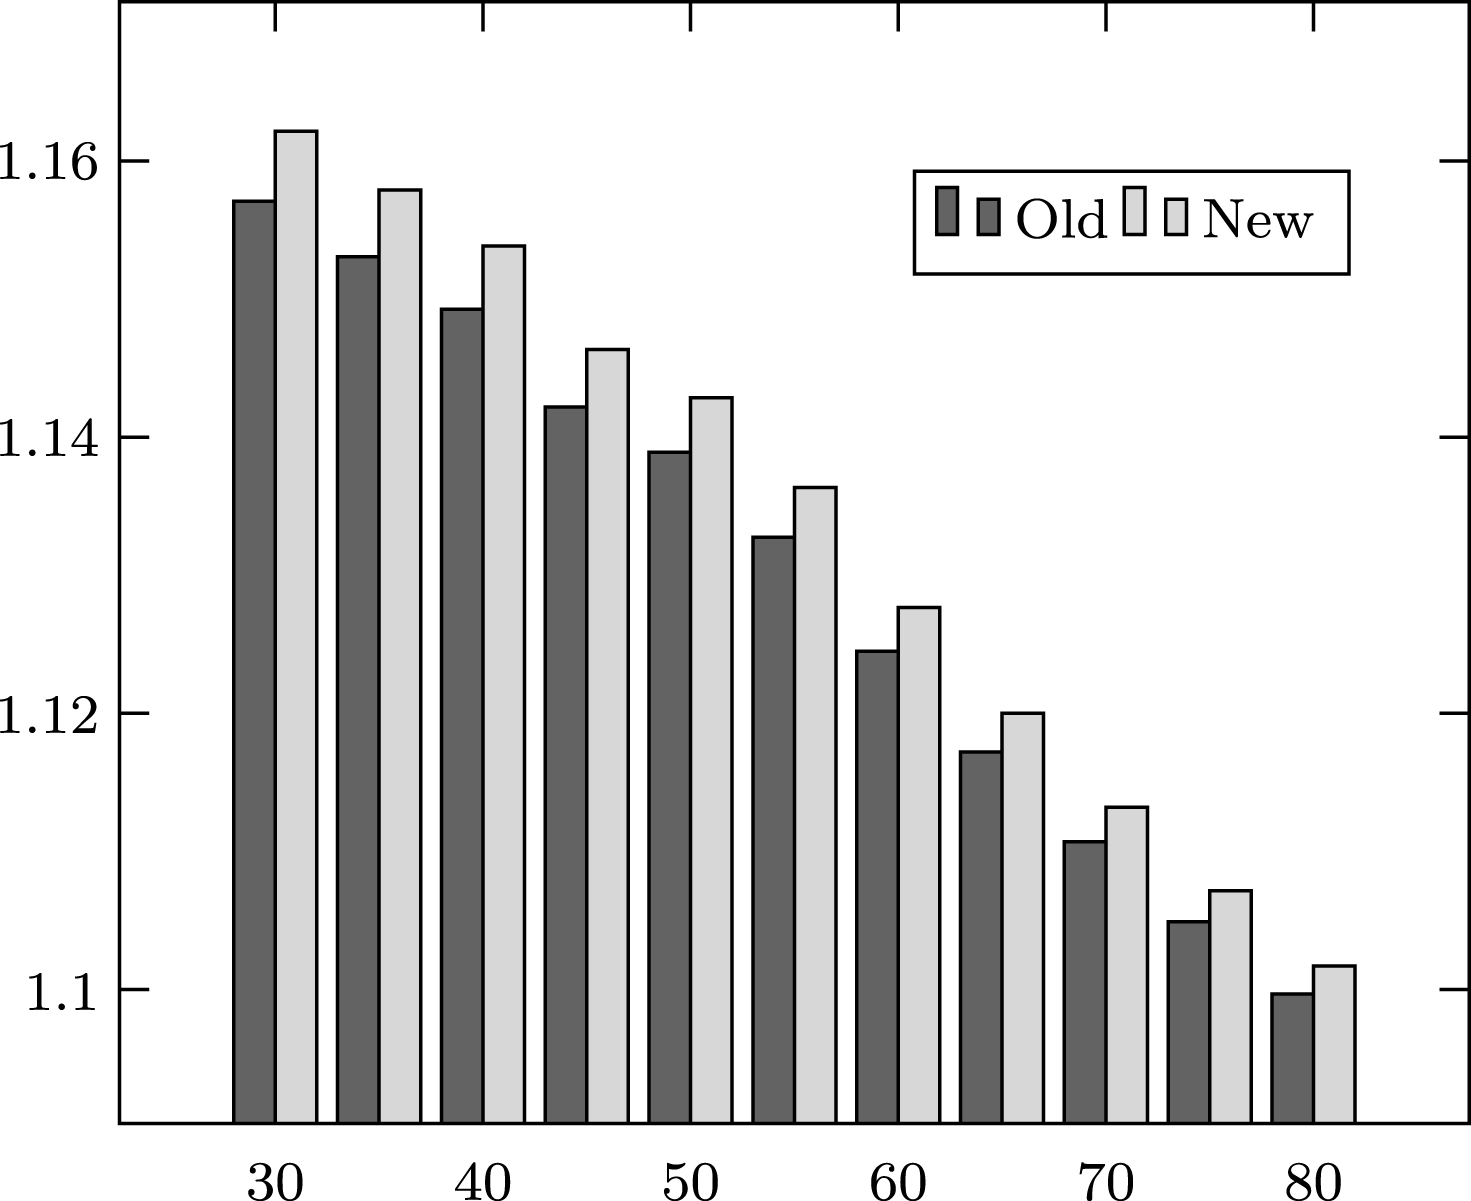
Table 1
Old and new Boston qualification standards by age division
| Age Division | Male | Female | ||
| Old * | New | Old * | New | |
| 18–34 | 3:10:59 | 3:05:00 | 3:40:59 | 3:35:00 |
| 35–39 | 3:15:59 | 3:10:00 | 3:45:59 | 3:40:00 |
| 40–44 | 3:20:59 | 3:15:00 | 3:50:59 | 3:45:00 |
| 45–49 | 3:30:59 | 3:25:00 | 4:00:50 | 3:55:00 |
| 50–54 | 3:35:59 | 3:30:00 | 4:05:59 | 4:00:00 |
| 55–59 | 3:45:59 | 3:40:00 | 4:15:59 | 4:10:00 |
| 60–64 | 4:00:59 | 3:55:00 | 4:30:59 | 4:25:00 |
| 65–69 | 4:15:59 | 4:10:00 | 4:45:59 | 4:40:00 |
| 70–74 | 4:30:59 | 4:25:00 | 5:00:59 | 4:55:00 |
| 76–79 | 4:45:59 | 4:40:00 | 5:15:59 | 5:10:00 |
| 80+ | 5:00:59 | 4:55:00 | 5:30:59 | 5:25:00 |
*59 second grace period included. Source: Boston Athletic Association.
Table 2
Percentage of Boston qualifiers in Marathons used in study
| Marathon | 2010 | 2011 | 2012 | 2013 | 2014 | 2015 |
| Baystate | 37.92% | 33.50% | 37.24% | 19.18% | 23.36% | 23.04% |
| Boston | 43.08% | 43.90% | 43.44% | 11.08% | 55.72% | 34.75% |
| Cal International | 27.96% | 26.43% | 20.64% | 20.03% | 15.27% | 20.66% |
| Chicago | 6.75% | 12.78% | 8.55% | 6.47% | 9.07% | 9.12% |
| Columbus | 21.77% | 20.08% | 18.20% | 11.23% | 11.55% | 11.08% |
| Cox Providence | 14.17% | 12.13% | 13.96% | 18.15% | 12.39% | 10.12% |
| Eugene | 21.18% | 22.73% | 24.13% | 17.59% | 20.46% | – |
| Grandmas | 6.68% | 11.56% | 18.14% | 11.00% | 17.30% | 17.94% |
| Hartford | 18.92% | 14.86% | 15.19% | 10.53% | 12.80% | 10.37% |
| Houston | 11.34% | 11.72% | 8.31% | 12.26% | 9.30% | 9.95% |
| Indianapolis Monumental | 17.94% | 12.47% | 19.43% | 12.27% | 15.17% | 14.75% |
| Lakefront | – | 18.52% | 19.52% | 13.24% | 14.92% | 13.21% |
| Los Angeles | 3.52% | 4.20% | 4.38% | 3.43% | 3.69% | 2.83% |
| Marine Corps | 6.36% | 6.30% | 5.92% | 4.38% | 3.79% | 5.01% |
| Mohawk Hudson | 31.78% | 34.85% | 30.45% | 16.08% | 18.09% | 18.61% |
| New Jersey | 13.37% | 3.71% | 10.76% | 10.17% | 11.60% | 8.94% |
| New York City | 13.26% | 12.93% | 12.07% | 10.34% | - | 7.93% |
| Ottawa | 16.13% | 18.50% | 17.01% | 14.11% | 16.61% | 14.95% |
| Philadelphia | 17.35% | 17.52% | 16.80% | 10.79% | 13.13% | 12.38% |
| Portland | 10.31% | 11.49% | 10.07% | 6.22% | 7.54% | 7.27% |
| Richmond | 8.16% | 14.23% | 13.43% | 9.17% | 11.46% | 9.13% |
| Road 2 Hope | 31.04% | 33.71% | 30.82% | 23.22% | 31.34% | 26.10% |
| Rock ‘n’ Roll Arizona | 12.08% | 14.08% | 13.87% | – | – | 8.27% |
| Santa Rosa | 21.84% | 12.64% | 33.91% | 31.32% | 23.47% | – |
| St. George | 20.15% | 23.64% | 17.70% | 13.28% | 16.88% | 20.84% |
| Steamtown | 27.96% | 27.65% | 28.92% | 15.35% | 19.13% | 17.48% |
| Twin Cities | 13.63% | 15.50% | 15.63% | 10.14% | 11.59% | 11.48% |
| Vancouver | 14.38% | 14.94% | 13.80% | 10.49% | 9.27% | 11.31% |
| Walt Disney World | 4.00% | 3.43% | 4.72% | 3.11% | 1.72% | 1.74% |
| Wineglass | 27.84% | 26.69% | 29.34% | 16.25% | 17.54% | 11.85% |
| Average | 14.70% | 15.34% | 14.80% | 9.12% | 13.33% | 12.00% |
Table 3
Finish results by age division (Separated by Old Standards and New Standards)
| Division | Standards | Obs. | Avg. Time | Std. Dev. | Min. | Max. | % BQ |
| 18–34M | OS | 132469 | 256.12 | 56.40 | 123.03 | 802.58 | 11.37% |
| NS | 131917 | 256.99 | 57.85 | 123.75 | 614.23 | 9.16% | |
| 18–34F | OS | 130253 | 281.99 | 55.10 | 140.42 | 664.23 | 12.32% |
| NS | 137192 | 283.45 | 56.03 | 138.33 | 604.55 | 9.10% | |
| 35–39M | OS | 67627 | 254.79 | 52.80 | 130.42 | 594.12 | 11.89% |
| NS | 64299 | 256.05 | 54.49 | 128.43 | 675.48 | 9.18% | |
| 35–39F | OS | 46983 | 282.26 | 55.32 | 143.83 | 720.10 | 14.57% |
| NS | 51318 | 282.79 | 55.91 | 142.77 | 599.15 | 11.19% | |
| 40–44M | OS | 68572 | 253.66 | 51.27 | 133.75 | 588.87 | 14.12% |
| NS | 69574 | 257.02 | 53.53 | 131.95 | 563.53 | 10.06% | |
| 40–44F | OS | 43014 | 282.32 | 55.54 | 145.72 | 696.62 | 17.77% |
| NS | 47925 | 285.22 | 55.55 | 151.33 | 613.00 | 12.07% | |
| 45–49M | OS | 57525 | 255.64 | 51.32 | 135.40 | 676.70 | 19.98% |
| NS | 56545 | 258.66 | 52.67 | 140.33 | 677.62 | 14.07% | |
| 45–49F | OS | 32242 | 288.60 | 56.96 | 152.60 | 663.85 | 21.93% |
| NS | 34348 | 288.47 | 55.22 | 159.37 | 601.83 | 16.92% | |
| 50–54M | OS | 43187 | 263.23 | 52.93 | 150.87 | 627.40 | 18.66% |
| NS | 44061 | 264.26 | 53.09 | 152.88 | 689.55 | 14.14% | |
| 50–54F | OS | 19158 | 303.15 | 60.50 | 167.83 | 600.12 | 17.84% |
| NS | 22234 | 299.40 | 57.66 | 162.37 | 598.00 | 15.29% | |
| 55–59M | OS | 24262 | 275.32 | 54.32 | 162.45 | 581.30 | 18.40% |
| NS | 26041 | 275.51 | 55.10 | 154.95 | 577.00 | 15.00% | |
| 55–59F | OS | 8748 | 318.45 | 63.33 | 171.67 | 685.57 | 16.31% |
| NS | 10544 | 312.75 | 59.88 | 170.48 | 621.00 | 14.86% | |
| 60–64M | OS | 13250 | 289.86 | 57.60 | 159.52 | 620.18 | 22.13% |
| NS | 14392 | 290.40 | 57.02 | 164.80 | 605.15 | 17.36% | |
| 60–64F | OS | 3787 | 333.81 | 65.66 | 190.73 | 668.55 | 18.06% |
| NS | 4346 | 327.48 | 60.80 | 190.45 | 600.17 | 15.51% | |
| 65–69M | OS | 4756 | 309.14 | 61.61 | 165.03 | 661.38 | 21.91% |
| NS | 5529 | 307.64 | 60.07 | 179.17 | 578.32 | 17.87% | |
| 65–69F | OS | 1184 | 353.34 | 68.18 | 185.73 | 631.27 | 15.96% |
| NS | 1460 | 345.64 | 62.22 | 206.53 | 621.00 | 15.07% | |
| 70–74M | OS | 1706 | 327.01 | 65.28 | 196.83 | 608.03 | 22.33% |
| NS | 1834 | 330.89 | 64.36 | 170.67 | 607.90 | 16.68% | |
| 70–74F | OS | 287 | 374.98 | 66.15 | 250.73 | 663.40 | 13.94% |
| NS | 370 | 369.51 | 65.62 | 228.95 | 569.20 | 13.78% | |
| 75–79M | OS | 461 | 348.95 | 61.04 | 213.92 | 575.23 | 14.97% |
| NS | 507 | 350.18 | 65.81 | 210.75 | 551.73 | 15.78% | |
| 75–79F | OS | 68 | 381.77 | 65.03 | 237.43 | 556.58 | 19.12% |
| NS | 79 | 398.48 | 67.34 | 253.08 | 573.32 | 11.39% | |
| 80+M | OS | 134 | 382.82 | 72.56 | 212.53 | 539.53 | 17.16% |
| NS | 137 | 390.79 | 71.54 | 233.90 | 603.47 | 9.49% | |
| 80+F | OS | 34 | 401.41 | 67.67 | 281.28 | 556.27 | 17.65% |
| NS | 19 | 404.48 | 72.05 | 252.53 | 506.50 | 15.79% | |
| Total M | OS | 413,949 | 259.42 | 55.09 | 123.03 | 802.58 | 14.80% |
| NS | 414,836 | 261.33 | 56.41 | 123.75 | 689.55 | 11.32% | |
| Total F | OS | 285,758 | 286.48 | 57.38 | 140.42 | 720.10 | 15.18% |
| NS | 309,835 | 287.36 | 57.05 | 138.33 | 621.00 | 11.54% | |
| Overall | 1,424,378 | 271.48 | 57.87 | 123.03 | 802.58 | 13.15% |
OS denotes old qualifying standards (Years 2010–2012). NS denotes new qualifying standards (Years 2013–2015).
Table 4
Results using yearly data
| Regression | (1) | (2) | (3) | (4) |
| Female | −1.872** | −1.766** | −1.431** | −1.435** |
| (0.807) | (0.786) | (0.652) | (0.652) | |
| NS | −4.928*** | −4.928*** | −5.238*** | −5.291*** |
| (0.746) | (0.726) | (0.621) | (0.928) | |
| Female*NS | 3.057*** | 2.985*** | 2.780*** | 2.795*** |
| (1.126) | (1.11) | (0.948) | (0.948) | |
| Temp 8 am | 0.886*** | 0.898*** | 0.910*** | 0.943*** |
| (0.244) | (0.239) | (0.246) | (0.253) | |
| Temp2 | −0.014*** | −0.014*** | −0.012*** | −0.012*** |
| (0.002) | (0.002) | (0.002) | (0.002) | |
| 11 am−8 am | −0.370*** | −0.374*** | −0.110** | −0.102* |
| (0.053) | (0.052) | (0.054) | (0.054) | |
| Dew Point | −0.010 | −0.011 | −0.085* | −0.087* |
| (0.041) | (0.040) | (0.047) | (0.048) | |
| Precip | −4.965*** | −5.026*** | 0.201 | −0.090 |
| (0.862) | (0.857) | (0.875) | (0.930) | |
| R-Squared | 0.083 | 0.115 | 0.360 | 0.361 |
| Age Division FE? | No | Yes | Yes | Yes |
| Race FE? | No | No | Yes | Yes |
| Year FE? | No | No | No | Yes |
Obs.=3326, 174 Races, 6 Qualifying Years. Heteroskedastic-robust standard errors in parenthesis. ***p < 0.01 ; **p < 0.05 ; *p < 0.10.
Table 5
Results dropping certain years
| Qualifying Years | Excludes 2012-2013 | 2010,2015 | 2011,2014 | 2012,2013 |
| Female | −1.818** | −3.286*** | −0.469 | −0.692 |
| (0.803) | (1.196) | (1.085) | (1.101) | |
| NS | −4.967*** | −6.741*** | −3.632*** | −4.627*** |
| (0.757) | (1.118) | (1.073) | (1.156) | |
| Female*NS | 3.513*** | 5.645*** | 1.498 | 1.440 |
| (1.138) | (1.683) | (1.483) | (1.625) | |
| Temp 8 am | 0.711** | 1.047* | −0.769 | 1.326* |
| (0.288) | (0.615) | (0.499) | (0.727) | |
| Temp2 | −0.009*** | −0.013** | 0.004 | −0.020*** |
| (0.003) | (0.006) | (0.004) | (0.007) | |
| 11 am−8 am | −0.147** | −0.137 | 0.008 | −0.028 |
| (0.069) | (0.151) | (0.095) | (0.146) | |
| Dew Point | −0.100* | −0.088 | 0.181 | −0.164 |
| (0.054) | (0.107) | (0.174) | (0.129) | |
| Precip | 1.407 | 4.117 | 3.315* | −1.214 |
| (1.143) | (2.979) | (1.744) | (2.034) | |
| R-Squared | 0.403 | 0.363 | 0.503 | 0.355 |
| Obs. | 2197 | 1100 | 1097 | 1129 |
Age Division and Race Fixed Effects Included. Heteroskedastic-robust standard errors in parenthesis. ***p < 0.01 ; **p < 0.05 ; .
Table 6
Results by Age Division
| Division | Female | NS | Female*NS | Obs. | R-squared |
| 18–34 | 0.717 | −3.498*** | −0.331 | 348 | 0.799 |
| (0.637) | (0.598) | (0.907) | |||
| 35–39 | 2.426*** | −4.249*** | 0.098 | 348 | 0.799 |
| (0.691) | (0.563) | (0.930) | |||
| 40–44 | 3.595*** | −4.599*** | −0.813 | 348 | 0.772 |
| (0.729) | (0.563) | (1.061) | |||
| 45–49 | 1.858** | −6.885*** | 1.376 | 348 | 0.779 |
| (0.797) | (0.791) | (1.186) | |||
| 50–54 | 0.699 | −4.626*** | 1.316 | 348 | 0.663 |
| (0.949) | (0.802) | (1.438) | |||
| 55–59 | −2.664* | −5.035*** | 5.345*** | 347 | 0.533 |
| (1.378) | (1.173) | (1.909) | |||
| 60–64 | −4.095** | −5.851*** | 2.515 | 348 | 0.527 |
| (1.751) | (1.203) | (2.381) | |||
| 65–69 | −5.625* | −5.413*** | 4.589 | 334 | 0.353 |
| (2.958) | (2.052) | (4.036) | |||
| 70–74 | −12.25*** | −6.555* | 16.20** | 250 | 0.341 |
| (3.778) | (3.607) | (6.344) | |||
| 75–79 | 2.999 | −1.529 | −3.779 | 199 | 0.339 |
| (6.339) | (4.256) | (8.002) | |||
| 80+ | −10.04 | −14.59** | 10.49 | 108 | 0.538 |
| (8.758) | (6.694) | (14.02) |
Heteroskedastic-robust standard errors in parenthesis. ***p < 0.01 ; **p < 0.05 ; *p < 0.10.


