
Electrodermal activity: A continuous monitor of well-being
Abstract
A smart society should not only support the efficiency and effectiveness of processes, they should also have the ability to comprehend and support its inhabitants well-being. To enable this, we need continuous information on individual’s well-being. As a first step, we suggest to evaluate people’s long term stress level, as it sheds light on their well-being. We propose using the biosignal Electrodermal Activity (EDA), a proven measure of people’s arousal or stress. Moreover, EDA can be measured continuously, in real-time, and unobtrusively via wearables. To assess this idea’s feasibility, the CASE, CEAP-360VR, and K-EmoCon datasets, including both continuous EDA recordings and continuous subjective self-reported arousal, were analyzed. With CASE and CEAP-360VR, a multilevel analysis unveiled that the frequency and amplitude of EDA’s non-specific skin conductance responses significantly correlated with the self-reported arousal. With K-EmoCon, this correlation was absent, which can be explained by the low arousal condition of this dataset. The latter also signals a main limitation: the lack of sensitivity of the proposed signal. Nevertheless, the results are promising as they show potential for EDA as a continuous stress monitor. Therefore, we are optimistic that a future smart society can be enabled to monitor and improve their inhabitant’s well-being.
1.Introduction
A smart society, society 5.0, envisions an iterative cycle which gathers data, analyzes it, and turns it into actionable insights, aiming for a human-centered society that balances economic progress and social problems, all while merging cyberspace with the physical world [18]. In other words, smartness is considered more than efficiency and effectiveness, and includes human understanding such as the ability to determine the psychological states of individuals [25]. A smart society can than adapt and support the individual if they require this. Through the understanding of psychological states, we can intervene accordingly and ultimately enhance individual well-being, creating flourishing societies [1]. Well-being is defined as a construct divided in two branches: hedonic (i.e., positive and negative affect) and eudaimonic (i.e., overall fulfillment) [10,29]. An example how smart society can help is signifying stressors and using positive cognitive reappraisal which can moderate the negative outcomes, improving hedonic state [27].
In this study, our particular interest lies in the assessment of prolonged stress levels experienced by individuals, which negatively influences well-being. One way in which this prolonged stress level can be expressed is through arousal (i.e. level of physiological activity) [1]. The comprehension of individual states can be achieved through diverse information channels, where we focus on biosignals. A biosignal refers to a measurable physiological or biological signal that conveys information about the functioning of specific physiological processes [7,33]. More specifically, our interest lies in Electrodermal Activity (EDA), which measures the skin conductance as a result of sweat gland activity [5]. Despite recent advances in the integration of biosignal data into smart environments, substantial challenges persist related to (1) the effect of wearable biosensors on smart societies at large, (2) the real-time discrepancies between subjective arousal reports and EDA signals, and (3) the extended time window of EDA signals and its consequential impact.
Existing research has shown the possibilities of continuous measuring of biosignals in the health domain [4,13,20]. However, most of this work uses biosensors in clinical or lab settings, with a few exceptions [15,36,37,41]. This contrasts the growing interest in monitoring stress and well-being in everyday life [1]. Over the last two decades, researchers have been investigating the development of unobtrusive biosensors: wearables. Wearable sensors can be used to monitor one’s physiology and behavior continuously without causing discomfort to the wearer [7]. As such, users of wearable sensors are still able to interact with their environment intuitively and naturally, while also gaining valuable insights into their health and well-being. Recent advances in wearable technology made sensors smaller, lighter, and more wearable [19,21]. Consequently, they are gaining popularity.
Incorporating wearable biosensors in things like smart homes or Intelligent Environments (IE) can allow for appropriate adaptation and early intervention, ultimately aiding in improving well-being. IE is defined as any space in our surroundings in which different aspects of the environment are controlled and adapted by intelligent agents, enhancing individuals’ experiences [3]. Here, we propose using Electrodermal Activity (EDA) signals as an enabler of early detection of long-term stress. As a biosignal, EDA allows for unbiased, real-time monitoring. Since EDA was first measured, psycho-physiological research has studied the relationship between emotional states and EDA on both a subjective (i.e. mental) and objective (i.e. physiological) level [7,34]. Together with the recent advances in wearable devices, EDA is presumed to be a measure that offers invaluable insights into the intricate interplay between the mind and body.
For more than a century, Electrodermal Activity (EDA) has been studied as a psycho-physiological measure for arousal and stress [5,33]. Consequently, there exists a comprehensive understanding of the EDA signal (for a detailed description of EDA and its features, we refer to Box 1). Empirical research has consistently shown that stress inducing situations are related to an increase in the EDA signal. To reach these conclusions, researchers have employed different methods to annotate the EDA signals. When self-reporting is utilized for annotation, it is typically conducted retrospectively. Hence, self-reported annotations and EDA signals often work on different temporal scales. Retrospective self-report relies on individuals to report their own feelings, where accurate recall difficulties is one major limitation [7,24,26]. The primary objective of this paper is to contribute to our understanding of the relationship between EDA and our subjective experience of arousal. We achieve this by evaluating EDA signals and continuous real-time self-reported arousal. Consequently, validity of EDA as a real-time stress-indicator is assessed.
The association between an increase in arousal and the corresponding elevation of EDA is often validated in short time windows, typically spanning mere seconds [39]. However, the objective of this study is to evaluate the relation between subjective arousal and EDA on larger time windows, specifically on the order of minutes. This approach holds interest as it can allow us to evaluate subjective arousal responses against EDA signals on a more detailed temporal scale while also providing valuable insights into prolonged stress exposure. Extended periods of stress can negatively influence our well-being, like experienced in bad moods [35,38]. Consequently, this study can show the potential role of EDA as a monitor of well-being.
In order to assess the viability of Electrodermal Activity (EDA) as a monitoring tool, three distinct datasets have been identified, each containing continuous EDA signals alongside continuous self-reports. When conducting an analysis that encompasses multiple datasets, some important factors need to be considered. These datasets contain recordings from diverse individuals, various contexts, and different recording devices, including both laboratory sensors and wearable technologies such as the Empatica E4. We propose a standardized methodology applicable across all datasets, aiming to aid in standardization within intelligent environments. While the inherent variability stemming from these individual differences in physiology and subjective experiences introduces complexity to the interpretation of our analyses, it also provides us the valuable opportunity to examine the robustness of our findings. This enables us to evaluate and ensure the accuracy of EDA measurements against subjective arousal.
First, we present the methodological framework in Section 2, followed by the presentation of the results in Section 3. Finally, in Section 4, we engage in a discussion of the results, their implications, and future research directions.
Box 1.
Electrodermal Activity (EDA), which refers to changes in skin conductance, reflects the activity of the autonomic nervous system, particularly the sympathetic branch [7]. As stress and arousal levels increase, so does the electrical conductance (
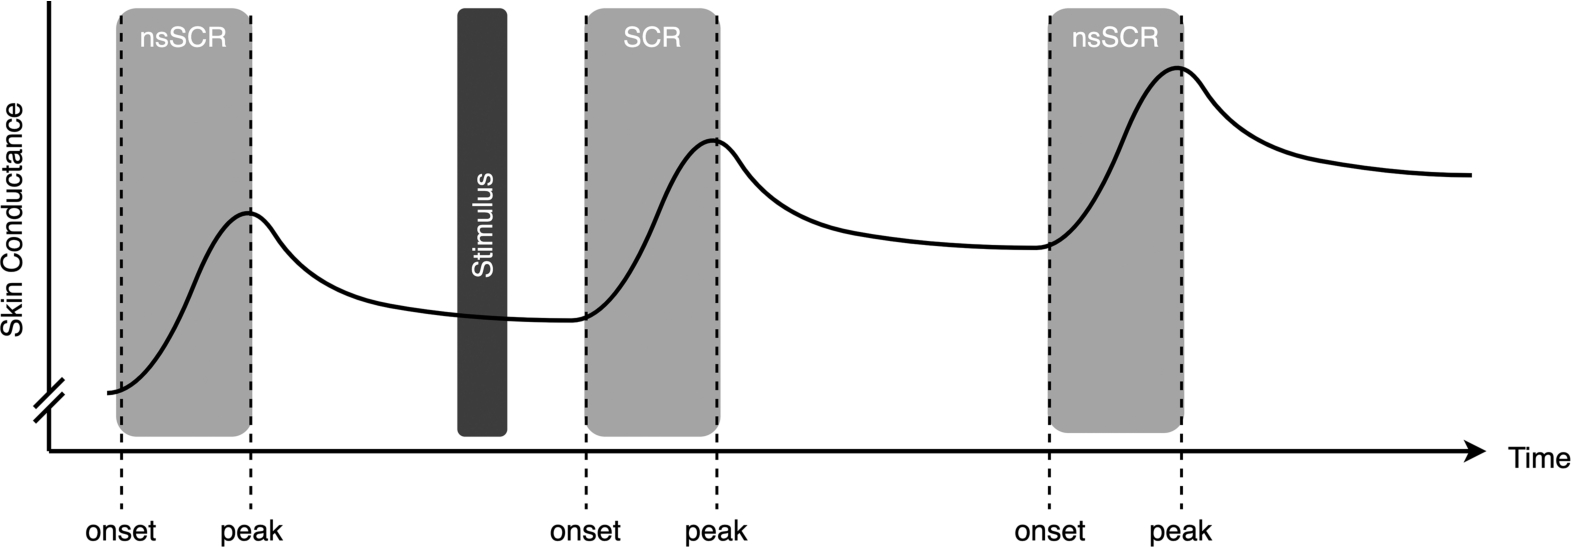
EDA signals are generally understood to comprise two primary components: tonic activity and phasic activity. Tonic activity signifies the gradual variations observed in EDA which is also referred to as Skin Conductance Level (SCL), whereas phasic activity encompasses rapid responses known as Skin Conductance Responses (SCRs). SCRs are categorized as either specific, when linked to particular stimulus, or ‘non-specific’ SCRs (nsSCRs) when not directly associated with a specific event [7]. The frequency of nsSCR is also mentioned as a valuable measure of tonic activity, even deemed superior to SCL for within-subject changes considering lab and wearable sensors [40]. In this research, we analyse nsSCRs over extended time windows as a measure of experienced stress. Figure 1 provides an idealistic depiction of an EDA signal featuring one SCR, which is a response to the stimulus before, and two nsSCRs that can not be linked to that stimulus. For each response, it is possible to calculate both its amplitude, defined as the absolute change in
Fig. 1.
An idealistic electrodermal activity signal, containing three responses. Two non-specific Skin Conductance Responses (nsSCRs) and one Skin Conductance Response (SCR) as a result of the stimulus.
2.Methodology
In this study, we build upon the authors’ prior research, which involved the assessment of two Electrodermal Activity (EDA) features and self-reported arousal on a continuous scale [22]. The earlier findings were encouraging, revealing significant correlation coefficients in high-arousal scenarios. Here, we extend our study to two additional datasets to assess the generalizability of the results. Furthermore, we propose a new processing pipeline that enables us to deal with the different datasets and their different characteristics while implementing one single methodology.
2.1.Data
To assess EDA as a continuous arousal indicator, we have chosen three recently published datasets that are either publicly available or accessible upon request. The selection of these datasets is based on two key criteria: (1) the presence of a high-quality continuous EDA signal, and (2) the availability of a continuous record of self-reported arousal. The inclusion of continuous arousal annotations in the datasets enables us to investigate the dynamic relationship between physiological stress and the subjective internal state. Through the analysis of these continuous arousal annotations and the EDA signals, we aim to explore the efficacy of EDA as a dependable measure for continuous arousal. The datasets that fulfill these criteria are summarized in Table 1. It’s worth noting that the list of datasets is not lengthy, which is primarily due to the infrequent implementation of the second requirement in the study designs. The following sections provide a brief description of key features for each dataset.
Table 1
Available data sets that measure continuous ElectroDermal Activity (EDA) and affective annotations
| Name | Stimuli | Arousal conditions | Duration | #Sub | |
| [32] | CASE | Movie clips | Low, mid/high | 180 seconds | 30 |
| [42] | CEAP-360VR | 360-VR videos | Low, high | 60 seconds | 32 |
| [23] | K-EmoCon | Semi-structured turn taking debate | Neutral | 10 minutes | 32 |
2.1.1.CASE
The Continuously Annotated Signals of Emotion (CASE) dataset contains data entries derived from 30 participants. The experimental set-up used a within-subject design, where participants were subjected to a sequence of eight distinct movie clips with an average duration of 180 seconds, each inducing varying effects on valence and arousal. Specifically focusing on the arousal dimension, the stimuli have been categorized into two discrete types: low arousal and mid to high arousal effects, as indicated by Sharma et al. [31,32].
Over the course of the experiment, a total of 6 biosignals were captured, including Electrodermal Activity (EDA). Concurrent with the presentation of stimuli, participants provided continuous annotations regarding their affective responses on the valence and arousal domain [28], using a joystick. For more details on the experimental set up, we refer to the work by Sharma et al. [32].
2.1.2.CEAP-360VR
The dataset Continuous Physiological and Behavioral Emotion Annotation Dataset for 360∘Videos (CEAP-360VR) encompasses data records originating from 32 participants. They adhered to a within-subject design, wherein participants were exposed to a sequence of eight distinct movie clips within a 360-VR environment with a duration of 60 seconds. These stimuli have been categorized into two distinct types, based on their arousal attributes: low arousal and high arousal, as classified by Xue et al. [42].
Throughout the experiment, participants wore Empatica E4 wristbands, which facilitated the measurement of several physiological parameters including EDA. Additionally, participants were equipped with a Joy-Con controller, allowing them to provide continuous annotations concerning their affective states across the valence and arousal domain [28]. For a more comprehensive insight into the experimental set up we refer to the work by Xue et al. [42].
2.1.3.K-EmoCon
The K-EmoCon dataset encompasses data records from a total of 32 participants. However, data from 6 of these participants (specifically, P2, P3, P6, P7, P17, and P20) were excluded due to either device malfunctions or poor data quality, as specified in the work of Park et al. [23]. The experimental setup facilitated one-on-one debates on a social issue involving each participant, thus rendering a single experimental condition. It is important to emphasize that the design of the study deliberately aimed to elicit naturalistic affective states, rather than intensively arousing affective states.
Throughout the course of the experiment, participants were wearing the Empatica E4 wristband, which recorded EDA. Subsequent to the debate interaction, participants provided annotations of their affective state, encompassing both the valence and arousal dimensions. They did so by viewing videos of themselves recorded during the experiment. Each five seconds annotations were given on a Likert scale spanning five points. For a more comprehensive description of the experimental framework, we refer to the publication by Park et al. [23].
2.2.Data processing
Within each dataset, two recordings are stored, self-reported arousal and an Electrodermal Activity (EDA) signal. These signals undergo discrete processing procedures, as illustrated in Fig. 2. The process ultimately leads to the computation of a correlation coefficient using both processed signals, followed by an assessment for statistical significance.
Fig. 2.
The processing pipeline for the 3 datasets. The processing of the annotation data and Electrodermal Activity (EDA) data is separated.
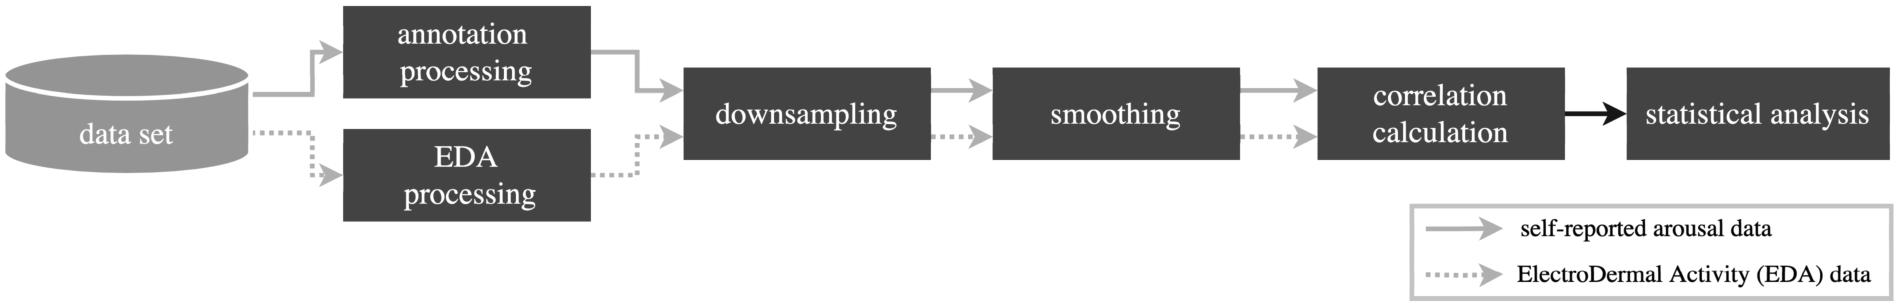
Table 2 provides an overview of the signal characteristics of the different datasets. It is important to note these differences because they impact signal characteristics and ultimately processing decisions. We have applied a similar method in previous work on the CASE dataset which used lab grade biosignal sensors [22]. Interestingly, the additional datasets in this work have biosignals recordings measured with the Empatica E4 wristband. These signals are inherently different because placement of the Empatica E4 EDA sensors is on the wrist, whereas the EDA sensor used for the CASE dataset was placed on the palm of the hand. It has been shown that the skin conductance on the wrist is less evident, which is clearly reflected in the range of
If we review the annotation signals in Table 2 we can observe that the recordings in the CASE and CEAP-360VR datasets are, even though distinct, rather similar. However, the K-EmoCon datasets applied a completely different method and reported continuous self-report using a method with a far lower sampling rate and resolution. These, together with the fact that recording of self-report is in retrospect, are important notes to consider when processing and interpreting the results.
Table 2
Details on the Electrodermal Activity (EDA) and arousal annotation signals and their difference across datasets
| Name | EDA recording device | Sample rate EDA (Hz) | Range EDA ( | Annotation recording device | Sample rate annotation (Hz) | Range annotation | |
| [32] | CASE | Thought technology, GSR sensor | 1000 | 0–40 | Joystick | 20 | 0.5–9.5 |
| [42] | CEAP-360VR | Empatica E4 | 4 | 0–1.5 | Joy-Con controller | 10 | 1–9 |
| [23] | K-EmoCon | Empatica E4 | 4 | 0–4 | Likert Scale | 0.2 | 1–5 |
2.2.1.Annotation processing
In the CASE and CEAP-360VR datasets, the recorded annotations are outcomes of a Cartesian-based annotation process, wherein the valence and arousal dimensions are respectively represented along the x and y axes. In the present context, only the arousal component (i.e., the y-position) is considered.
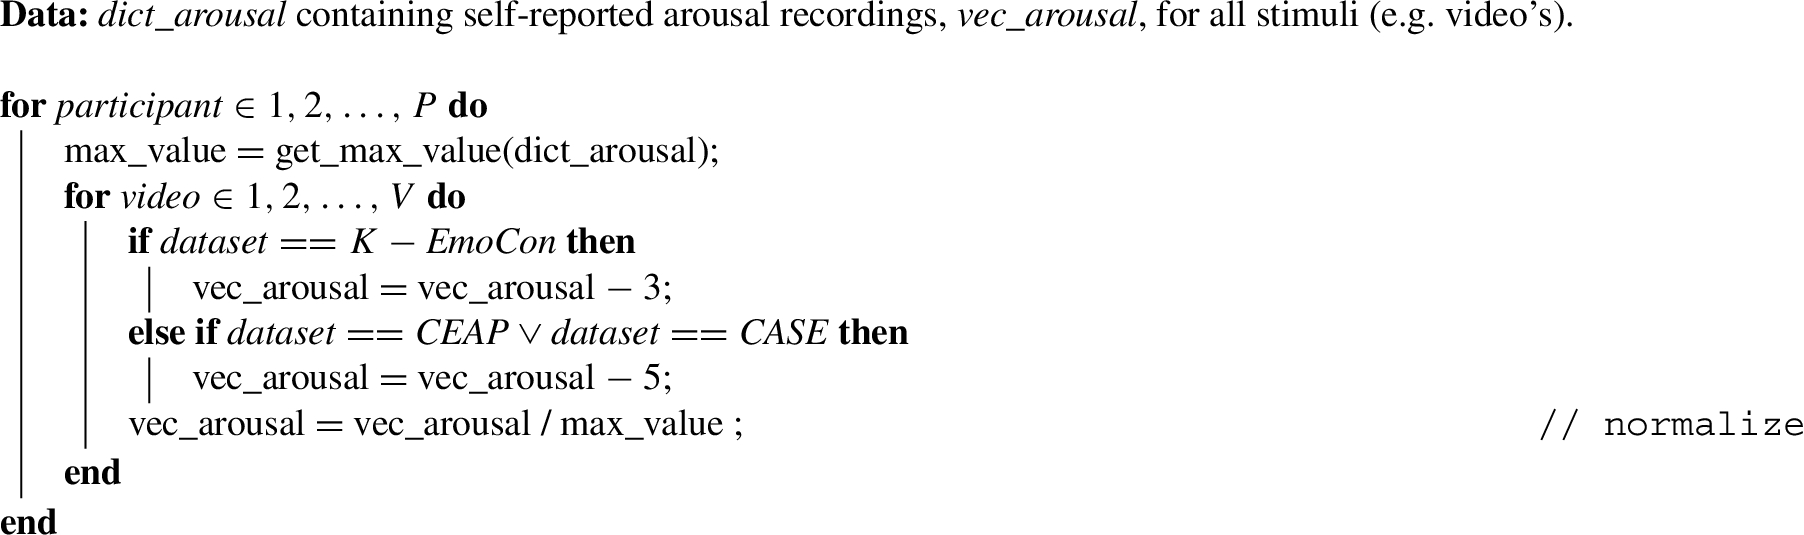
Within each dataset, distinct scales are employed to signify arousal levels. To illustrate, within the CASE dataset, the range for arousal annotation spans from 0.5 to 9.5, whereas the K-EmoCon dataset adopts a range of 1 to 5 for the same purpose, see Table 2. To normalize these ranges consistently across datasets, an adjustment is implemented, effectively rendering a neutral state of arousal ascribed to the value 0. This procedure is outlined in Algorithm 1. Subsequently, the signal is subjected to a normalization process, which corrects for interpersonal differences among participants. This entails division by the maximum arousal annotation recorded across all stimuli. This normalization approach is chosen for its ability to retain positive arousal values within the interval of [0, 1], while concurrently mapping negative arousal values onto the interval of [−1, 0] [34].
Algorithm 1:
Self-reported arousal processing
2.2.2.Electrodermal activity processing
As explained in Box 1, Electrodermal Activity (EDA) signals are typically divided into tonic activity and phasic actvity. In our study, our focus is specifically on the phasic activity, more precisely the ‘non-specific’ SCRs (nsSCRs). An nsSCR denotes any emerging SCR that lacks a direct connection to internal or external stimuli. The frequency of these nsSCRs is widely employed as a measure, particularly in contexts involving arousal, stress, and emotions [5,40]. It is even considered a more effective and valid measure compared to skin conductance level when employing both palm and wrist based EDA measures [40]. Although less frequently employed, the sum amplitude of nsSCRs also serves as a valuable measure, enabling the quantification of total ‘non-specific’ changes in EDA [5].
A challenge emerged during the analysis of EDA signals from diverse datasets. The records showed significant disparities, including variations in range, likely attributed to differences in recording devices and sensor placement. The CEAP-360VR and K-EmoCon datasets utilized the Empatica E4 wristband to measure EDA, while CASE used a sensor positioned on the index and ring finger, a common site for EDA measurement related to affective states [12]. Consequently, the EDA data within the CEAP-360VR and K-EmoCon datasets feature smaller ranges, sometimes even up to 30 times smaller compared to the CASE dataset. This discrepancy significantly impacts EDA analysis. Traditionally, a static threshold has been set for nsSCR detection, allowing for a minimum value typically between 0.01 and 0.05. However, due to the range disparities present in the raw Empatica E4 data, this conventional static threshold proved ineffective. Consequently, we propose a procedure for nsSCR detection that is independent of the recording device used.
Algorithm 2:
Electrodermal Activity (EDA) processing
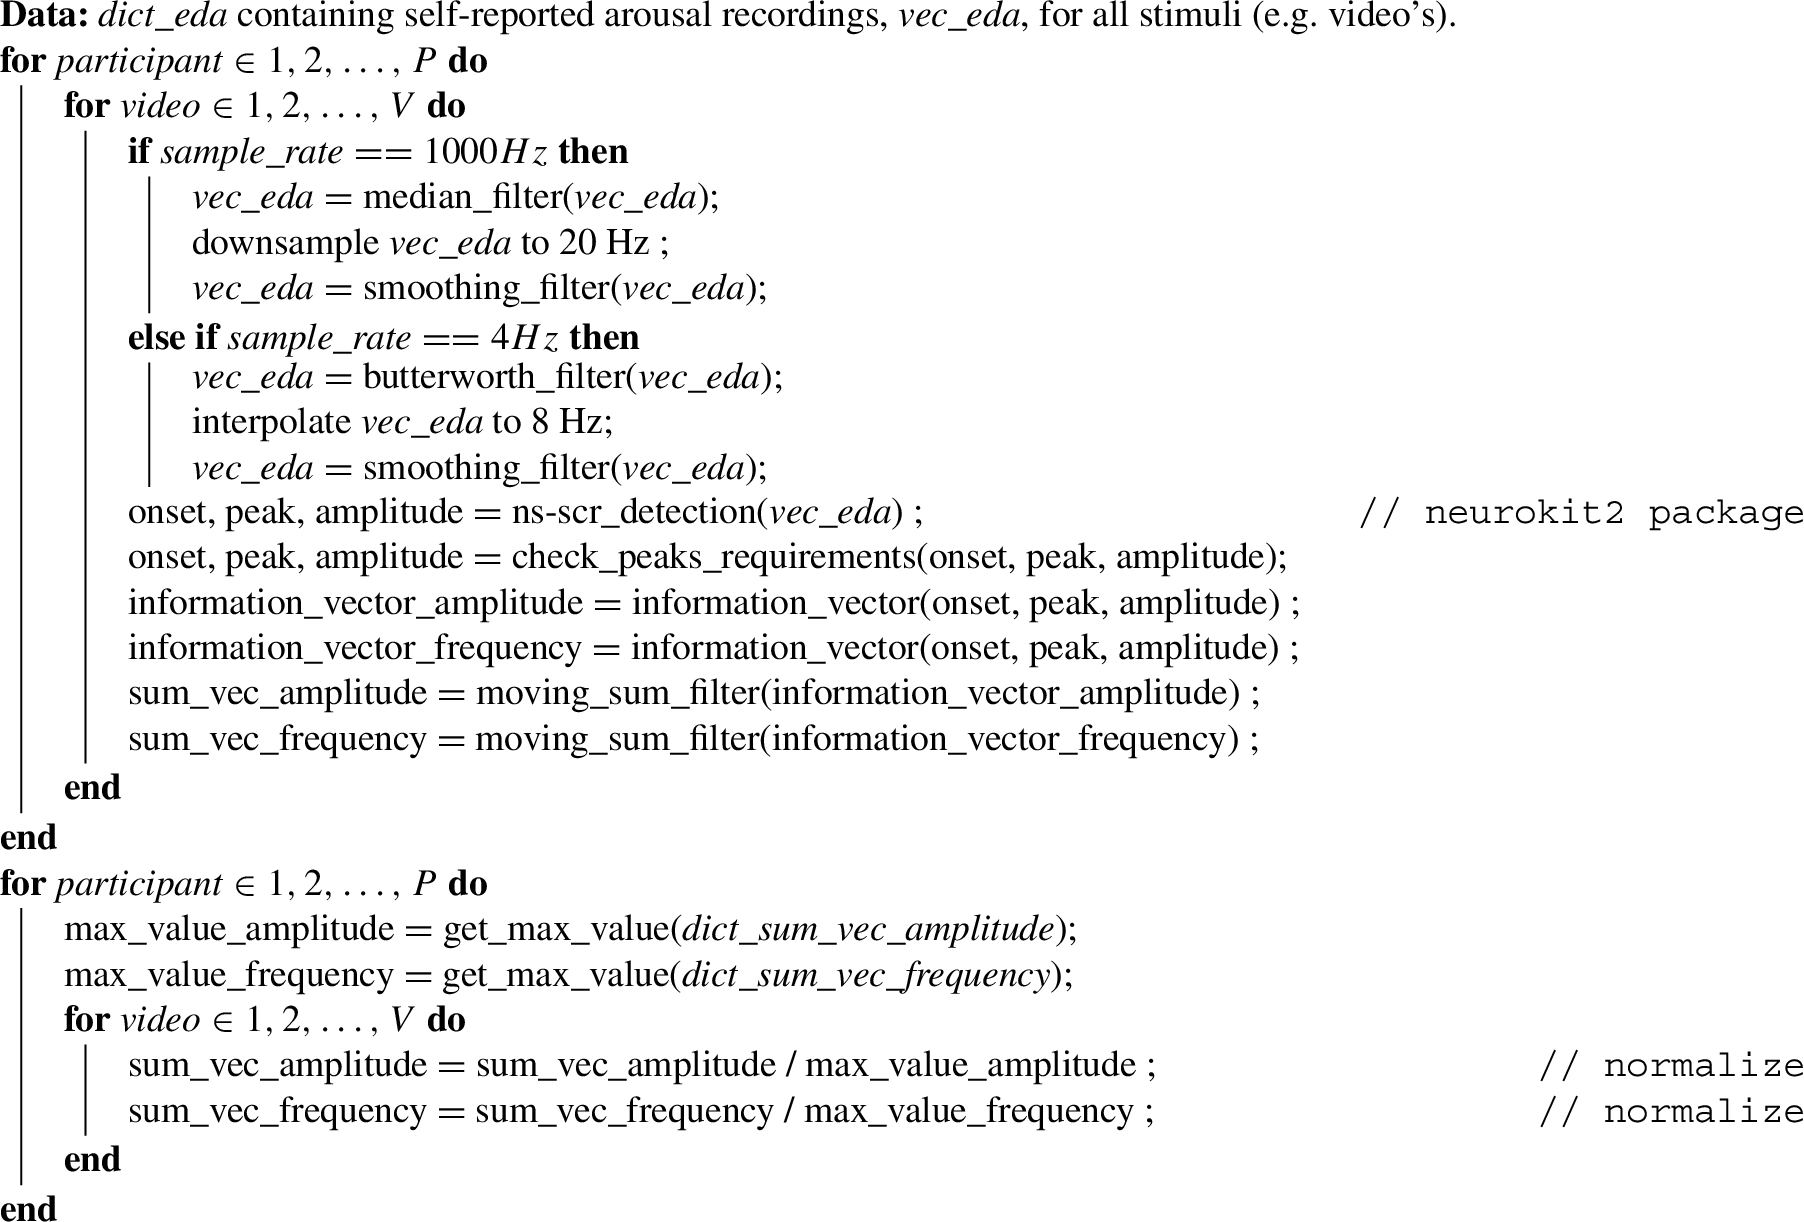
Algorithm 2 provides an overview of the EDA processing. For the peak detection we made use of the neurokit2 package, which contains functions for biosignals processing. Here, we used eda_phasic() with the ‘highpass’ argument to extract the phasic activity of the signal, the highpass filter had a cutoff frequency of 0.05. The eda_phasic() function returns the phasic activity present in the signal (i.e. the skin conductance responses). To ensure that all EDA data from the different datasets can be analysed accordingly, we normalize this phasic activity. This normalized phasic signal is then passed in the eda_peaks() function which detects the nsSCRs and returns the onset, peak, and amplitude. A threshold of 0.01 μS was set for the nsSCRs amplitude, which represents the minimum EDA change to count as an elicited nsSCR [7].
Based on the location and amplitude of the nsSCRs we can create two information vectors where (1) contains a 1 where a peak is detected, and (2) contains the amplitude value at the same peak location. A moving sum filter of 20 seconds is then applied over the two information vectors, resulting in two vectors, (1) contains the nsSCRs frequency per 20 seconds and (2) contains the total nsSCRs amplitude per 20 seconds. Finally, both vectors are normalized by dividing by the maximum value recorded across all stimuli of the corresponding nsSCRs feature, see Algorithm 2.
2.2.3.Correlation and testing
Prior to performing a correlation analysis, it is essential to ensure uniform sample frequencies for both signals (i.e. the self-report signal and EDA feature signal). For all datasets, with the exception of CASE, this meant down-sampling either the self-reported arousal or the EDA signal, dependent upon which of the two has the lower sample rate. Following down-sampling, a smoothing filter is applied to both signals, employing a window size of 15 seconds.
Subsequent to these preparatory steps, the data is ready for correlation testing. The Pearson’s correlation coefficient was computed for each recording, corresponding to each participant and stimulus combination. When no nsSCRs were present in the signal, both the nsSCR frequency and amplitude signal is zero, hence no correlation value can be computed, which results in missing values. We hypothesise a positive Pearson’s correlation coefficient between the continuously self-reported arousal and nsSCRs’ frequency and amplitude. In other words, we expect an real-time increase in nsSCRs’ frequency and amplitude when self-reported arousal is increased.
We then performed statistical tests to assess the statistical significance of the correlation values. For our CASE and CEAP-360VR datasets we encountered 8 distinct conditions, corresponding to 8 distinct videos. Consequently, we obtained on average 8 observations per participant per nsSCR feature, although it is noteworthy that some participants had missing correlation measures. Hence, for the CASE and CEAP-360VR datasets we conducted a multilevel (ML) analysis, also known as a mixed-effects or mixed linear model [16]. ML analysis is capable of handling such missing data. More details on ML analysis is given in the following section. Note that correlation results for K-EmoCon do not contain repeated measures and thus no ML modeling is applied, we have just one data point (i.e. correlation value) per participant. Hence, we test the correlations on their statistical significance against the null hypothesis by employing an one-sampled t-test.
2.2.4.Multilevel analysis
We employ multilevel (ML) analysis because of the nested structure of our observations within participants. This choice becomes particularly relevant when considering the potential influence of individual differences in biosignals data. Individual participants inherently possess unique physiological and psychological traits, contributing to variations in their biosignals, including Electrodermal Activity (EDA). For instance, the number of sweat glances on the skin differs from one individual to another [7]. These differences are expected to have implications for the monitoring and analysis of affective states through biosignals. In addition to these physiological variations, we anticipate that individuals possess differing abilities to interpret their psychological states and, consequently, may annotate their experiences differently. For instance, people can differ in their tendency to adhere to socially desirable responding [24]. More generally, the interpretation of arousal (and valence) differs across persons and circumstances [17]. Hence, we present our multilevel model, defined as
3.Results
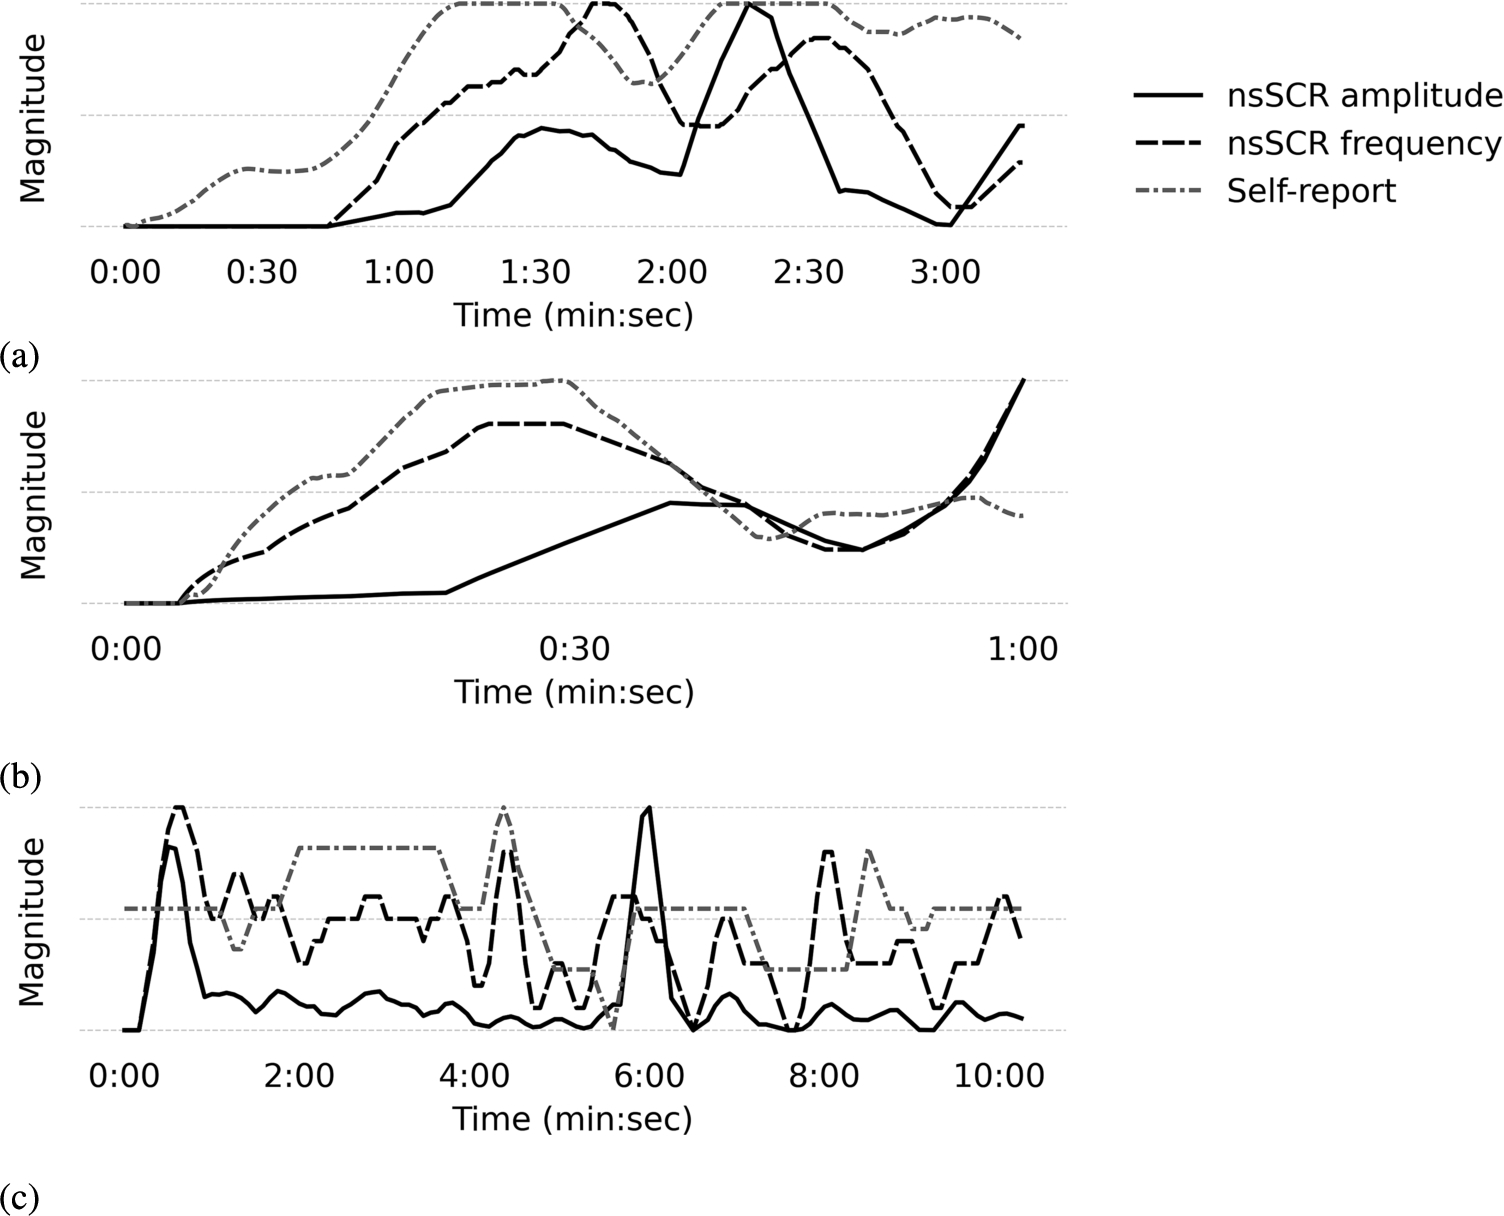
Illustrated in Fig. 3 are three representative examples showcasing the relation between self-reported annotations and Electrodermal Activity (EDA) features within the context of a high arousal video. These instances are drawn from discrete datasets, and notably, the examples 3a and 3b affirm the hypothesis. Nonetheless, it is essential to underscore that these examples have a limited scope as they show participants which were exposed to stimuli eliciting heightened arousal, except for Fig. 3c.
Fig. 3.
Example of the processed self-reported arousal against the processed ‘non-specific’ Skin Conductance Response’s (nsSCR) frequency and amplitude, given over the duration of one video with a high arousal context, extracted from the (A) CASE, (B) CEAP-360VR, and (C) K-EmoCon dataset.
First we calculated the Pearson correlation coefficients, which in rare cases resulted in a missing value. This is due to the absence of a nsSCR, hence one of the vectors has a constant value of zero. With the CASE dataset 5% of correlation coefficients was missing. The CEAP-360VR correlation coefficients contained 1.5% missing values. Finally, the correlation coefficient calculated from the K-EmoCon dataset contained no missing values.
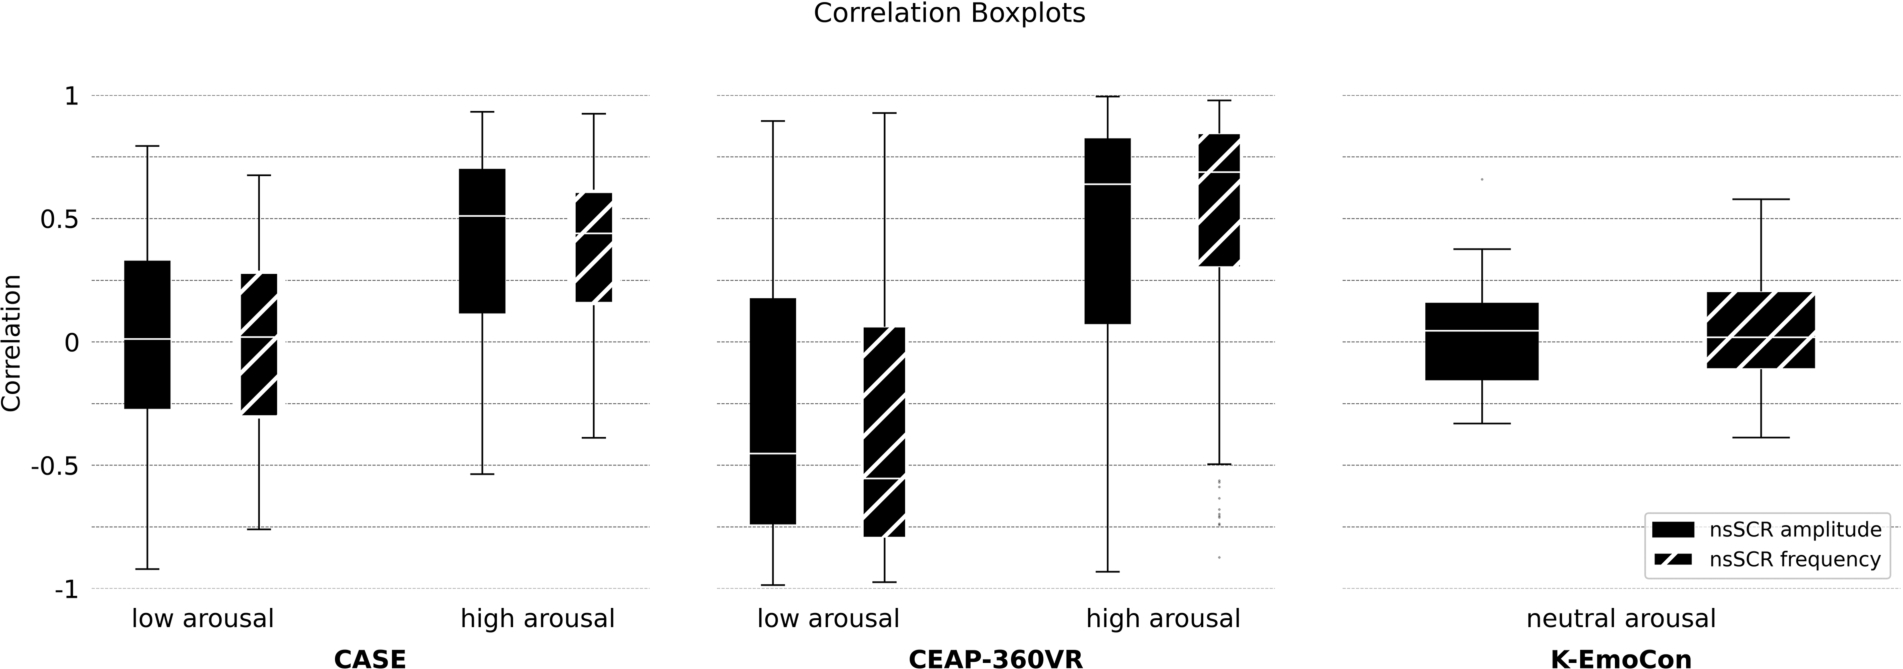
Figure 4 presents the calculated correlation coefficients for different arousal contexts, across datasets. Notably is the congruence between the findings from the CASE dataset in previously established research [22], while here we used a different nsSCRS detection method. Furthermore, Fig. 4 showcases similar results for the CASE and CEAP-360VR datasets. Despite the distinct differences between the datasets, encompassing different participants, contextual variables, and instrumentation, it is noteworthy that for both the correlation coefficients show elevations in instances of heightened arousal. Table 3 provides an overview of the exact median values across the datasets and arousal conditions.
Fig. 4.
Distribution of correlation coefficients for frequency and amplitude of ‘non-specific’ Skin Conductance Responses (nsSCRs) with self-reported arousal. It shows the results of all three datasets and accordingly on the different arousal conditions present in the datasets.
3.1.Statistical analysis
The correlation outcomes derived from K-EmoCon do not confirm our initial hypothesis, denoting a median correlation coefficient approximating zero. We evaluated this outcome with an one-sampled t-test, testing if the correlations significantly differ from zero. Applying a Bonferroni correction for the multiple tests (i.e. 2 tests, for amplitude against self-report and frequency against self-report), we can conclude that there is no significant Pearson correlation coefficient; t(25) = 0.666,
Table 3
The median correlation values for the difference level of arousal, given for both electrodermal activity features (“non-specific” Skin Conductance Responses (nsSCR) their frequency and amplitude) against self-report
| Dataset | Condition | nsSCR frequency | nsSCR amplitude |
| CASE | Low arousal | 0.019 | 0.012 |
| High arousal | 0.440 | 0.510 | |
| CEAP-360VR | Low arousal | −0.553 | −0.453 |
| High arousal | 0.689 | 0.639 | |
| K-Emocon | Neutral arousal | 0.019 | 0.046 |
3.1.1.Multilevel analysis
In our analysis of the CASE dataset (see Table 4), we consider the two key features: amplitude and frequency. First, the baseline model M0 shows that, on average across all participants, there is a significant difference from zero for both amplitude and frequency; 0.221 (
Similarly, in our analysis of the CEAP-360VR dataset (see Table 5), we examine both amplitude and frequency features. The baseline model M0 reveals that, on average across all participants, there is no significant difference from zero, with estimates of 0.065 (
The results of the M1 models, for both CASE (Table 4) and CEAP-360VR (Table 5), show that adding information on the context arousal (i.e. stimulus) significantly improved the fit of the ML model. We can observe this by looking at the drop in deviance of the models. Moreover, we can derive from this that an increase in arousal context results in a substantial positive upswing in the correlation coefficient for both amplitude and frequency. Subsequently, we examined whether introducing variable slope terms with the predictor variable would further improve model fit in both datasets. The deviance of this model M2, either remained unchanged or exhibited a slight decrease, yielding no statistically significant improvements.
Table 4
Details on the multilevel models created with the CASE dataset, for correlations on self-report against both electrodermal activity features: amplitude and frequency of ‘non-specific’ skin conductance responses
| Amplitude | Frequency | |||||
| Model: | M0: intercept only | M1: with predictor | M2: with random slope arousal | M0: Intercept only | M1: with predictor | M2: with random slope arousal |
| Fixed part | Coef. (s.e.) | Coef. (s.e.) | Coef. (s.e.) | Coef. (s.e.) | Coef. (s.e.) | Coef. (s.e.) |
| Intercept | 0.221 (0.028) | 0.022 (0.037) | 0.022 (0.037) | 0.190 (0.027) | −0.010 (0.034) | −0.009 (0.0376) |
| Arousal | 0.379 (0.051) | 0.379 (0.051) | 0.382 (0.048) | 0.380 (0.049) | ||
| Random part | ||||||
| 0.0000 | 0.0000 | 0.000 | 0.000 | 0.000 | 0.008 | |
| 0.183 | 0.148 | 0.148 | 0.164 | 0.128 | 0.124 | |
| 0.000 | 0.007 | |||||
| Deviance | 257.35 | 207.68 | 207.68 | 232.54 | 175.19 | 174.89 |
Table 5
Details on the multilevel models created with the CEAP-360VR dataset, for correlations on self-report against both electrodermal activity features: amplitude and frequency of ‘non-specific’ skin conductance responses
| Amplitude | Frequency | |||||
| Model: | M0: Intercept only | M1: with predictor | M2: with random slope arousal | M0: intercept only | M1: with predictor | M2: with random slope arousal |
| Fixed part | Coef. (s.e.) | Coef. (s.e.) | Coef. (s.e.) | Coef. (s.e.) | Coef. (s.e.) | Coef. (s.e.) |
| Intercept | 0.085 (0.040) | −0.274 (0.049) | −0.274 (0.058) | 0.085 (0.042) | −0.336 (0.051) | −0.336 (0.061) |
| Arousal | 0.706 (0.066) | 0.706 (0.072) | 0.829 (0.064) | 0.828 (0.073) | ||
| Random part | ||||||
| 0.000 | 0.008 | 0.040 | 0.000 | 0.018 | 0.054 | |
| 0.402 | 0.271 | 0.259 | 0.449 | 0.260 | 0.248 | |
| 0.036 | 0.044 | |||||
| Deviance | 484.58 | 390.21 | 387.54 | 512.4 | 387.7 | 384.57 |
4.Discussion
To create a truly smart society, we believe that next to efficiency and effectiveness, there is great value in being able to ‘sense’ an individual’s health and well-being [18]. Having a human understanding allows for appropriate adaptation of the environment, creating a loop of information gathering and action, adding to a smart society. An example of this is the ability to identify affective states of hospitalized children, providing appropriate adjusted surroundings such as offering soothing stimuli to relieve the child’s anxiety. Or, adaptive lighting of the room based on affective state of the inhabitant. This personalized and responsive approach to environments showcases the potential of integrating sensory technologies into our society.
Pro-longed experience of stress is reflected in bad moods and a decrease in performance and well-being [14,35]. Being able to detect these stress levels can allow for appropriate intervening through smart environments and support individuals, functioning as a first step in supporting the complex construct well-being [9]. Recent advances in wearable biosensors introduce new directions to monitor these states. One particular biosignal that can be measured trough wearable devices is Electrodermal Activity (EDA). We assessed EDA’s potential as a real-time indicator of stress levels. We did so by conducting an analysis on three datasets (i.e. CASE [32], CEAP-360VR [42], and K-EmoCon [23]) containing both continuous EDA signals and continuous self-reported arousal. We calculated the correlation between EDA features, namely non-specific Skin Conductance Response (nsSCR) amplitude and frequency, and self-reported arousal. In the CASE and CEAP-360VR datasets, our analysis revealed significant positive correlations, where in the K-EmoCon dataset these were absent. Next, we will consider these results along the following discussion points: (1) EDA as a real-time indicator, (2) extended time windows, and (3) the ecological validity. Subsequently, we present the limitations of the study and end with a conclusion.
The results showcase that EDA is capable of functioning as a real-time measure for arousal. The positive correlations in high arousal situations, obtained from CASE and CEAP-360VR, underscore that as subjective arousal increases, EDA features also exhibit increase across a continuous temporal scale. For over a century different theories have been developed in relation to the subjective experience and physiological states. One of these theories is the James–Lange theory which states that our affective experiences, such as emotions, are a result of perceiving to physiological changes in our body, for example we feel fear or joy after we notice our heart rate increases or our palms sweat [11]. An alternative theory is the Schachter and Singer’s two-factor theory of emotion, which states that affective states are determined by a combination of both physiological responses and the cognitive appraisal of the situation. This means that the same physiological state can lead to different experiences, depending on the cognitive interpretation [30]. Although our research is not able to validate either of such theories, which is very complex as pointed out by Cacioppo and Tassinary [6], it is interesting that the results of two datasets suggest the mapping between physiological changes and subjective experience is there, on a continuous scale, indicating the two are indeed interconnected. Note that this mapping is complex and not universal (i.e. the same across individuals) nor constant (i.e., the same at different instances for a given person) [14]. It is regulated by our cognitive processes of evaluation, which may be one the reason our third dataset, K-EmoCon, does not show this mapping.
In contrast to traditional practices in EDA validation studies, which often focus on time windows no longer than a few seconds [39], our study employed extended time windows (i.e., minutes). This approach enables us to look at the EDA signal differently and extract different features. Instead of looking at acute responses, we are interested in prolonged diffused responses. As a results we look at different features of the signal. Our decision to look at the nsSCR as our measure is one of them, which has been validated in other work [40]. The extended time windows and different features also means we can examine different psychological constructs, including moods, prolonged stress, and, ultimately, well-being. Summarizing, we are not using EDA traditionally as for acute stress responses, but rather as underlying continuous stress indicator. The presence of positive and significant correlation coefficients in high arousal scenarios underscores the potential for gaining insight into stress dynamics and implementing timely interventions, particularly when high arousal persists over extended duration.
The CEAP-360VR and the K-EmoCon datasets featured EDA measurements obtained via a wearable device, specifically the Empatica E4. In contrast, EDA measures for the CASE dataset were recorded in controlled lab environments using laboratory sensors. This means that EDA recordings in the CASE dataset are significantly different from the CEAP-360VR and K-EmoCon dataset. For one, wearable devices measure EDA on the wrist, whereas laboratory sensors measure on the palm of the hand, which is recommended [12]. It is knows that the phasic signals originating from the wrist may be less pronounced compared to those originating from the fingers or the palmar surface [40]. Overall, the signal quality of wearable devices tends to be lower compared to lab-grade devices, partly due to the use of dry sensors [2]. Despite these important differences, it is noteworthy that both the CASE and CEAP-360VR datasets yielded similar outcomes in cases of high arousal, suggesting applicability of Empatica E4 in this context. This finding bears particular significance concerning a smart society, which cannot rely on laboratory sensors but must incorporate wearable devices. Consequently, the results from our study advocate for the integration of wearable devices into our living environments to provide individual support. This integration can assist in timely interventions when stress levels escalate, ultimately contributing to improved well-being. Note that K-EmoCon dataset does not show the same results while employing an Empatica E4, and thus not support the argument given. We believe there are several factors that can explain this deviance, provided in the following paragraph which present the first of several limitations that warrant consideration: (1) the challenge of generalization, (2) constraints related to low arousal states, and (3) individual variations in self-report.
Firstly, while the different datasets facilitated an extensive examination of arousal within varied contexts, both in controlled laboratory settings and more realistic scenarios, it is essential to acknowledge that they may not fully capture the intricacies of real-world situations. This complexity poses challenges in translating our findings into practical real-world applications and generalizing them effectively. One step towards real-world applications is the use of wearable devices to measure Electrodermal Activity (EDA). Two datasets, namely CEAP-360VR and K-EmoCon, did employ such wearable devices. Consequently, the outcomes derived from these datasets hold significant relevance concerning their potential applicability to real-world monitoring scenarios. However, both datasets yielded diverse results, making it hard to draw definitive conclusions from these findings. The results from K-EmoCon did not support our hypothesis. It is noteworthy that this dataset is designed to minimize intense emotional responses. Additionally, self-report data in this dataset suffered from retrospective reporting and poor resolution. Prior research has highlighted the limitations associated with such retrospective annotations and the time gap it introduces between the actual affective state and its annotation [24]. This may explain the deviance with our hypothesis in the K-EmoCon dataset. Overall, to support our findings, future research should be focused on expanding the variety of datasets and contexts in which data is gathered. Furthermore, long-term studies would be beneficial for the assessment of EDA in real-world application for smart societies.
Secondly, our study consistently identified significant effects between EDA features and self-reported arousal in instances of heightened arousal. Notably, as arousal levels diminished, correlation coefficients exhibited a corresponding decrease. Consequently, our findings do not offer comprehensive insights into states of low arousal, which is also limiting their direct applicability in real-world contexts. It suggests the existence of a threshold, beyond which physiological indicators directly reflect arousal levels. As such, accounting for the anticipated level of arousal is crucial when utilizing nsSCR frequency and amplitude as indicators. Future research should aim to precisely determine this threshold.
Finally, an examination of the spread of correlation coefficients, even in high arousal scenarios, reveals notable variance. This variance may be attributed to individual differences in reflective abilities, such as an individuals’ capability for annotating and articulating their physiological states. It is possible that not all individuals possess the same degree of competence. There are issues to consider in self-report such as socially desirable responding (SDR), acquiescent responding (AR), and extreme responding (ER) [24]. People can differ in their tendency to adhere to SDR and present self-report that reflects what they think the researches expect from the stimuli, rather than reflect what they are feeling. This tendency can be linked to personality, but since we do not have personality information on the participants in the datasets, we were not able to test for this. AR, which is a term used for people who tend to agree, can be viewed as an individual difference linked to conformity and impulsiveness [24]. Again, we lack the information on personality to check for this effect. ER, which has been validated as a consistent individual difference, where ambiguity, emotional arousal, and rapid responding induce temporary increases in extreme responding [24]. This makes ER also a likely factor to consider. With normalization we try to control for this factors, but in cases where someone is experiencing little arousal yet annotates extremely over all stimuli, the normalization does not suffice. Finally, people simply do not have an infinite ability to recall and reflect all relevant information [24]. They can be overwhelmed with information, in this case rapid changes in stimuli. This can make the task of annotation difficult, for some more than for others.
Collecting physiological data and using it in a smart society brings a responsibility regarding safety and privacy of this sensitive information. For one, users of wearable devices should have ownership of their data. Additional concerns are re-identification and linkage risks resulting from routine activities and regular movements recorded through the device. A potential solution involves implementing anonymous user IDs to communicate across devices. Furthermore, incorporating local real-time processing on the device (i.e. federated learning) can address privacy and safety concerns. Users should be notified of any policy changes to ensure transparency and user awareness [8]. Finally, it’s also important to acknowledge that self-tracking, while beneficial, can escalate into an obsession, potentially causing more harm than good. Further research is needed to determine how to maintain a balanced approach to wearable devices integrated in our society [8].
In conclusion, our findings reveal a significant correlation between EDA features and self-reported arousal within contexts characterized by high arousal levels. This consistency in results holds across two distinct datasets (i.e., CASE and CEAP-360VR), with the third dataset (i.e., K-EmoCon) deviating. This divergence can arguably be attributed to inherent differences from the other datasets, such as the retrospective annotation as well as the frequency and resolution of the self-report. Our research underscores the possibilities of continuous monitoring of EDA signals, particularly in real-time reflection of subjective arousal under high arousal conditions. The results highlight the potential of EDA monitoring through wearable devices as a promising avenue for real-world stress and arousal detection. Overall, this study contributes to our understanding and monitoring of physiological responses, adding to the larger vision of creating a smart society that can adapt to individual needs. As such, smart societies may one day be able to be truly smart and support individuals in their pursuit of well-being.
Acknowledgements
We thank our partners, members from the HONDA project between the Honda Research Institute in Japan and Utrecht University in the Netherlands for making this research possible. Lukas P.A. Arts and Egon L. van den Broek have received funding for this work from the European Union’s Horizon 2020 research and innovation program under grant agreement No. 952095, the IM-TWIN project. The funders had no role in study design, data collection and analysis, decision to publish or preparation of the manuscript.
Conflict of interest
The authors have no conflict of interest to report.
References
[1] | R. Alhejaili and A. Alomainy, The use of wearable technology in providing assistive solutions for mental well-being, Sensors 23: (17) ((2023) ). doi:10.3390/s23177378. |
[2] | L.P.A. Arts and E.L. van den Broek, Biosignal quality control in real-world intelligent environments, in: Workshop Proceedings of the 19th International Conference on Intelligent Environments (IE2023), G. Bekaroo, S.B. Allouch and M. Mecella, eds, Ambient Intelligence and Smart Environments, Vol. 32: , IOS Press BV, Amsterdam, The Netherlands, Flic en Flac, Mauritius, (2023) , pp. 24–33. ISBN 978-1-64368-404-8. doi:10.3233/AISE230006. |
[3] | J.C. Augusto, V. Callaghan, D. Cook, A. Kameas and I. Satoh, Intelligent environments: A manifesto, Human-centric Computing and Information Sciences 3: (12) ((2013) ). doi:10.1186/2192-1962-3-12. |
[4] | V. Bellandi, P. Ceravolo, E. Damiani, S. Maghool, M. Cesari, I. Basdekis, E. Iliadou and M.D. Marzan, A methodology to engineering continuous monitoring of intrinsic capacity for elderly people, Complex & Intelligent Systems 8: ((2022) ), 3953–3971. doi:10.1007/s40747-022-00775-w. |
[5] | W. Boucsein, Electrodermal Activity, 2nd edn, Springer, New York, NY, (2012) . doi:10.1007/978-1-4614-1126-0. |
[6] | J. Cacioppo and L. Tassinary, Inferring psychological significance from physiological signals, The American Psychologist 45: (1) ((1990) ), 16–28. doi:10.1037/0003-066X.45.1.16. |
[7] | J.T. Cacioppo, L.G. Tassinary and G.G. Berntson (eds), Handbook of Psychophysiology, 4th edn, Cambridge University Press, (2016) . doi:10.1017/9781107415782. |
[8] | P. Datta, A.S. Namin and M. Chatterjee, A survey of privacy concerns in wearable devices, in: 2018 IEEE International Conference on Big Data (Big Data), IEEE, (2018) , pp. 4549–4553. doi:10.1109/BigData.2018.8622110. |
[9] | E. Diener, Assessing Well-Being: The Collected Works of Ed Diener, Social Indicators Research Series, Springer, Dordrecht, (2009) . doi:10.1007/978-90-481-2354-4. |
[10] | C.M. DuPont, T.M. Weis, S.B. Manuck, A.L. Marsland, K.A. Matthews and P.J. Gianaros, Does well-being associate with stress physiology? A systematic review and meta-analysis, Health Psychology 39: (10) ((2020) ), 879–890. doi:10.1037/hea0000979. |
[11] | L. Feldman Barret, M. Lewis and J.M. Haviland-Jones, Handbook of Emotions, 4th edn, The Guilford Press, New York, NY, (2016) . ISBN 978-1-4625-2534-8. |
[12] | D.C. Fowles, M.J. Christie, R. Edelberg, W.W. Grings, D.T. Lykken and P.H. Venables, Publication recommendations for electrodermal measurements, Psychophysiology 18: (3) ((1981) ), 232–239. doi:10.1111/j.1469-8986.1981.tb03024.x. |
[13] | S.S. Gambhir, T.J. Ge, O. Vermesh, R. Spitler and G.E. Gold, Continuous health monitoring: An opportunity for precision health, Science Translational Medicine 13: (597) ((2021) ), 1–6. doi:10.1126/scitranslmed.abe5383. |
[14] | G. Giannakakis, D. Grigoriadis, K. Giannakaki, O. Simantiraki, A. Roniotis and M. Tsiknakis, Review on psychological stress detection using biosignals, IEEE Transactions on Affective Computing 13: (1) ((2022) ), 440–460. doi:10.1109/TAFFC.2019.2927337. |
[15] | J.A. Healey and R.W. Picard, Detecting stress during real-world driving tasks using physiological sensors, IEEE Transactions on Intelligent Transportation Systems 6: (2) ((2005) ), 156–166. doi:10.1109/TITS.2005.848368. |
[16] | J. Hox, M. Moerbeek and R. Van de Schoot, Multilevel Analysis: Techniques and Applications, Routledge, New York, NY, (2018) . ISBN 9781138121362. |
[17] | P. Kuppens, F. Tuerlinckx, J.A. Russell and L.F. Barrett, The relation between valence and arousal in subjective experience, Psychological Bulletin 139: (4) ((2013) ), 917–940. doi:10.1037/a0030811. |
[18] | H.-U.L.-U. Lab (ed.), Society 5.0: A People-Centric Super-Smart Society, Springer, Singapore, (2020) . doi:10.1007/978-981-15-2989-4. |
[19] | G.-H. Lee, Y.R. Lee, H. Kim, D.A. Kwon, H. Kim, C. Yang, S.Q. Choi, S. Park, J.-W. Jeong and S. Park, Rapid meniscus-guided printing of stable semi-solid-state liquid metal microgranular-particle for soft electronics, Nature Communications 13: (2643) ((2022) ), 1–10. doi:10.1038/s41467-022-30427-z. |
[20] | J.P.L. Leenen, C. Leerentveld, J.D. van Dijk, H.L. van Westreenen, L. Schoonhoven and G.A. Patijn, Current evidence for continuous vital signs monitoring by wearable wireless devices in hospitalized adults: Systematic review, Journal of Medical Internet Research 22: (6) ((2020) ), e18636. doi:10.2196/18636. |
[21] | R. Lin, H.-J. Kim, S. Achavananthadith, Z. Xiong, J.K. Lee, Y.L. Kong and J.S. Ho, Digitally-embroidered liquid metal electronic textiles for wearable wireless systems, Nature Communications 13: (2190) ((2022) ), 1–10. doi:10.1038/s41467-022-29859-4. |
[22] | A.L. Meijer, L.P.A. Arts, R. Gomez and E.L. van den Broek, Towards continuous monitoring of well-being, in: Workshop Proceedings of the 19th International Conference on Intelligent Environments (IE2023), G. Bekaroo, S.B. Allouch and M. Mecella, eds, Ambient Intelligence and Smart Environments, Vol. 32: , IOS Press BV, Amsterdam, The Netherlands, Flic en Flac, Mauritius, (2023) , pp. 196–205. ISBN 978-1-64368-404-8. doi:10.3233/AISE230032. |
[23] | C.Y. Park, N. Cha, S. Kang, A. Kim, A.H. Khandoker, L. Hadjileontiadis, A. Oh, Y. Jeong and U. Lee, K-EmoCon, a multimodal sensor dataset for continuous emotion recognition in naturalistic conversations, Scientific Data 7: (293) ((2020) ). doi:10.1038/s41597-020-00630-y. |
[24] | D.L. Paulhus and S. Vazire, The self-report method, in: Handbook of Research Methods in Personality Psychology, R.W. Robins, R.C. Fraley and R.F. Krueger, eds, The Guilford Press, New York, NY, (2007) , pp. 224–239. ISBN 987-1-59385-111-8. |
[25] | R.W. Picard, E. Vyzas and J. Healey, Toward machine emotional intelligence: Analysis of affective physiological state, IEEE Transactions on Pattern Analysis and Machine Intelligence 23: (10) ((2001) ), 1175–1191. doi:10.1109/34.954607. |
[26] | S.A. Prince, K.B. Adamo, M.E. Hamel, J. Hardt, S.C. Gorber and M. Tremblay, A comparison of direct versus self-report measures for assessing physical activity in adults: A systematic review, International Journal of Behavioral Nutrition and Physical Activity 5: (56) ((2008) ), 1–24. doi:10.1186/1479-5868-5-56. |
[27] | A. Riepenhausen, C. Wackerhagen, Z.C. Reppmann, H.-C. Deter, R. Kalisch, I.M. Veer and H. Walter, Positive cognitive reappraisal in stress resilience, mental health, and well-being: A comprehensive systematic review, Emotion Review 14: (4) ((2022) ), 310–331. doi:10.1177/17540739221114642. |
[28] | J.A. Russell, A circumplex model of affect, Journal of personality and social psychology 39: (6) ((1980) ), 1161–1178. doi:10.1037/h0077714. |
[29] | R.M. Ryan and E.L. Deci, On happiness and human potentials: A review of research on hedonic and eudaimonic well-being, Annual Review of Psychology 52: (1) ((2001) ), 141–166. doi:10.1146/annurev.psych.52.1.141. |
[30] | S. Schachter and J.E. Singer, Cognitive, social, and physiological determinants of emotional state, Psychological Review 69: (5) ((1962) ), 379–399. doi:10.1037/h0046234. |
[31] | K. Sharma, C. Castellini, F. Stulp and E.L. van den Broek, Continuous, real-time emotion annotation: A novel joystick-based analysis framework, IEEE Transactions on Affective Computing 11: (1) ((2020) ), 78–84. doi:10.1109/TAFFC.2017.2772882. |
[32] | K. Sharma, C. Castellini, E.L. van den Broek, A. Albu-Schaeffer and F. Schwenker, A dataset of continuous affect annotations and physiological signals for emotion analysis, Scientific Data 6: (196) ((2019) ), 1–13. doi:10.1038/s41597-019-0209-0. |
[33] | R.M. Stern, W.J. Ray and K.S. Quigley, Psychophysiological Recording, 2nd edn, Oxford University Press, New York, NY, (2001) . ISBN 9780195113594. |
[34] | E.L. van den Broek, Affective Signal Processing (ASP): Unraveling the mystery of emotions, PhD thesis, Human Media Interaction (HMI), Faculty of Electrical Engineering, Mathematics, and Computer Science, University of Twente, Enschede, The Netherlands, (2011) . doi:10.3990/1.9789036532433. |
[35] | E.L. van den Broek, Monitoring technology: The 21st century’s pursuit of well-being?, (2017) , EU-OSHA Discussion paper, European Agency for Safety and Health at Work (EUOSHA), Bilbao, Spain. |
[36] | E.L. van den Broek, J.H. Janssen and J.H.D.M. Westerink, Autonomous closed-loop biofeedback: An introduction and a melodious application, in: The Oxford Handbook of Affective Computing, R.A. Calvo, S.K. D’Mello, J. Gratch and A. Kappas, eds, Oxford University Press, Inc., New York, NY, USA, (2015) , pp. 472–482, Chapter 35. doi:10.1093/oxfordhb/9780199942237.013.035. |
[37] | E.L. van den Broek, M.H. Schut, J.H.D.M. Westerink and K. Tuinenbreijer, Unobtrusive Sensing of Emotions (USE), Journal of Ambient Intelligence and Smart Environments 1: (3) ((2009) ), 287–299. doi:10.3233/AIS-2009-0034. |
[38] | E.L. van den Broek, F. van der Sluis and T. Dijkstra, Telling the story and re-living the past: How speech analysis can reveal emotions in post-traumatic stress disorder (PTSD) patients, in: Sensing Emotions: The Impact of Context on Experience Measurements, J.H.D.M. Westerink, M. Krans and M. Ouwerkerk, eds, Philips Research Book Series, Vol. 12: , Springer Science+Business Media B.V., Dordrecht, The Netherlands, (2011) , pp. 153–180, Chapter 10. doi:10.1007/978-90-481-3258-4_10. |
[39] | E.L. van den Broek and J.H.D.M. Westerink, Considerations for emotion-aware consumer products, Applied Ergonomics 40: ((2009) ), 1055–1064. doi:10.1016/j.apergo.2009.04.012. |
[40] | D.J. Van Der Mee, M.J. Gevonden, J.H.D.M. Westerink and E.J.C. De Geus, Validity of electrodermal activity-based measures of sympathetic nervous system activity from a wrist-worn device, International Journal of Psychophysiology 168: ((2021) ), 52–64. doi:10.1016/j.ijpsycho.2021.08.003. |
[41] | D.J. van der Mee, M.J. Gevonden, J.H.D.M. Westerink and E.J.C. de Geus, Cardiorespiratory fitness, regular physical activity, and autonomic nervous system reactivity to laboratory and daily life stress, Psychophysiology 60: (4) ((2023) ), e14212. doi:10.1111/psyp.14212. |
[42] | T. Xue, A. El Ali, T. Zhang, G. Ding and P. Cesar, CEAP-360VR: A continuous physiological and behavioral emotion annotation dataset for 360 VR videos, IEEE Transactions on Multimedia 25: ((2021) ), 243–255. doi:10.1109/TMM.2021.3124080. |


