
In-clinic event related potentials after sports concussion: A 4-year study
Abstract
PURPOSE:
Electrophysiological event-related potentials (ERP’s) have been reported to change after concussion. The objective of this study is to use a simple 2-tone auditory P300 ERP in routine clinical settings to measure changes from baseline after concussion and to determine if these changes persist at return to play when other standard measures have normalized.
METHODS:
Three-hundred sixty-four (364) student athletes, aged 17–23 years, participating in contact sports were tracked over consecutive years. In this blinded study P300, plus physical reaction times and Trail Making tests, were collected alongside standard clinical evaluations. Changes in these measures after concussion were compared to clinical outcomes over various stages of post-injury recovery.
RESULTS:
Concussed players experienced significant reaction time and/or P300 amplitude changes compared to pre-concussion baseline measurements (p< 0.005). P300 changes persisted in 38% of the players after standard measures, including reaction times, had cleared. Many of those players slow to normalize were part of the sub-concussive symptom group and/or appeared more prone to repeat concussions.
CONCLUSION:
These data suggest significant P300 amplitude changes after concussion that are quantifiable and consistent. These changes often normalized slower than other standard assessments. More data are needed to determine if slow normalization relates to sub-concussive or repeated events.
1.Introduction
Concussion is a major source of sports injury. Because of the nature of the injury, often defined as a complex pathophysiological process, there currently exist no definitive tests for the condition [1, 2, 3, 4]. While symptoms often resolve within a few weeks after the event, around 10–15% of patients report lingering symptoms and cognitive deficits [5, 6, 7, 8, 9]. To complicate matters for clinicians making return-to-play decisions, symptom resolution may not be indicative of injury resolution, adding additional risk of injury if players return prematurely [10].
Neuropsychological assessment is one of the main clinical evaluation tools following concussion, though sometimes return to pre-concussion testing performance can take place when the subjects are still symptomatic and vice versa [11, 12, 13]. Studies have also demonstrated that some concussed players who passed clinical tests still displayed electrophysiological deficits, suggesting brain-network compensation to achieve normal functioning [14]. Numerous other studies have also demonstrated the persistence of altered brain activity following concussion using various electroencephalogram (EEG) and magnetic resonance imaging methods [15, 16, 17, 18].
To address these clinical issues, and to study the effects of concussion on cognitive brain processing, event-related potentials (ERPs) have been used to assess cerebral activity following mild brain injuries (mTBI). ERPs are a measurement of signals from an EEG time-locked to the onset of a given stimulus. ERP’s are typically labeled by their polarity (P for positive or N for negative) and their time of occurrence after the stimulus in milliseconds (e.g., P300). Numerous studies have reported ERP-related differences between mTBI and control groups, even as some of these found no differences using neuropsychological measures [19, 20, 21, 22, 23, 24, 25, 26, 27, 28, 29].
Because variations in ERP protocols and corresponding hardware modifications are numerous, standard procedures are needed for these techniques to become clinically viable. This study, therefore, investigates one of the simplest techniques involving P300 during an audio oddball task. This technique is readily standardizable and can be implemented on a large scale, including for baseline screening.
The P300 parameters most commonly considered to be diagnostic include amplitude (voltage) and latency (detection time after stimulus). The amplitude is often described as a measure of attentional resources and latency a measure of classification speed [30, 31, 32, 33, 34]. While there is disagreement over the specific cognitive processes involved, larger P300 amplitudes and shorter latencies have been associated with superior information processing [35, 36, 37]. Between-person variances and the influence of physical attributes such as skull shape or thickness make P300 amplitudes most appropriate when used for longitudinal tracking [37, 38]. Along with mTBI, P300 changes have also been reported for aging, dementia, and depressive disorders, among many others [39]. Because an increase in the P300 latency and a decrease in the P300 peak amplitude are observed in various diseases accompanied by cognitive impairment these measurements are considered nonspecific.
The objective here is to include a two-tone P300 protocol to student-athlete physical evaluations at baseline and various intervals after a concussion to determine if P300 measures significantly change from baseline after concussion and if these changes persist at the beginning of return-to- play protocols when other standard measures have normalized.
2.Methods
The general goal of this study is to measure the impact of concussion on the cortical auditory P300 in comparison to the performance measures of physical reaction time, Trail Making [40], and other standard concussion-related measures discussed below. For those athletes who sustained a concussive event, pre-contact baseline assessments were compared to assessments post trauma. The stability of baseline P300 measures were evaluated by comparing seasonal pre- and post-season assessments in a subset of subjects without injury.
2.1Subjects
The study followed 364 individuals aged 17–23 over the course of up to 4 sports seasons at 4 different sites. These subjects were participants in NCAA Div. 1 men’s football (172 players, representing all players from a single team), NCAA Div. 1 woman’s soccer (29 players, representing all players from a single team), men’s high school football (142 players, representing all seniors from a single team), and Junior A men’s ice hockey (20 players, representing all players from a single team).
The study was approved by the Solutions Institutional Review Board and written informed consent was obtained from the participants or their guardians before study intake.
2.1.1Reference subjects
A 2-tone audio P300 protocol was administered by sports medicine staff during the course of other pre-contact clinical evaluations. The protocol included physical reaction times and Trail Making tests parts A and B. Physical reaction times, also known to decline with concussion [41], were measured by asking the participant to click the mouse upon hearing the rare tone, which represents a different process than P300 latency.
To follow the objectives of this study, which involves clinical settings, and because the primary marker being studied is nonspecific, we have kept the exclusion criteria minimal. The baseline reference group, therefore, comprised baseline measures from all players participating on these teams and exclusions were limited to the 8 players who fell asleep during the first-year test (which was longer in duration as discussed later), leaving a total of 348 players in this baseline group (labeled BASE, Table 1).
Table 1
Assessments and mean timing of re-assessments
| Group | # assessments | Timing of re-assessments (± SD) |
|---|---|---|
| BASE (initial pre-contact assessment upon enrollment into study) | 348 | – |
| ALL (all repeat assessments of non-injured players) | 70 | 310 (227) days after BASE |
| REF (subgroup of ALL taken within season, medication exclusions) | 31 | 146 (110) days after BASE |
| CN (initial assessment after qualified concussion event) | 33 | 1.6 (1.2) days after event |
| NCN (initial assessment after non-qualified event) | 12 | 1.1 (0.4) days after event |
| CRTP (CN group at beginning of return to play) | 32 | 10 (5) days after event |
| CEND (CN group at postseason) | 24 | 94 (35) days after event |
| NEXT (CN group at following preseason) | 12 | 287 (86) days after event |
To compare P300 changes in the non-concussed to the concussed population, 2 groups of test-retest samples were collected which we labeled REF and ALL. The REF group comprised a convenience sample of retests performed over a single season on first-year players 1–2 weeks after the initial baseline and at postseason. Exclusion criteria were again minimal; 4 tests with known changes in ADHD medication or condition (e.g. drowsiness) were excluded from the variance extraction. The ALL reference group comprised the single-season tests above with no exclusions, all following year baselines where available, and a convenience sample of post-career tests. While these samples provide a reasonable real-life example of what to expect over the course of a season, or a college career, they also include multiple tests for single players so statistical caution is needed when group comparisons are made. Also, note that we have not separated out gender or age because there were not enough statistics to detect any differences between these categories and as such that is outside the scope of this study.
2.1.2Concussion subjects
Of the 364 players tracked, 56 events occurred where a player was removed from a game or practice by a trainer, physician, or the participant for a suspected concussion. Of these, 45 were later confirmed concussions, yielding a rate consistent with the expected concussion rates for these sports [42, 43]. Concussion included single events as well as repeated sub-acute events with resultant symptoms. Concussed players were ideally tested at baseline, 24–48 hours after a qualified concussion event (CN group), during graded return-to-play protocols (CRTP), at post season (CEND) several months removed from the event, and at pre-contact for the following season when possible (NEXT). We use the word “ideally” here because one objective of this study is to perform these tests in real-life training room settings and so the ideal timeline could not always be followed. For example, 7 pre-contact baseline measurements were not made, leaving test-retest variability to be inferred either from post-season or the following season. Also, when the event occurred toward the end of the season there was no return to play, leaving only post-season tests in these instances.
Establishing concussion criteria is important because relying on self-reported symptoms alone is not sufficient. For example, motivations among players vary as some players can mask symptoms hoping to get back into a game while others may do the opposite. Furthermore, conditions such as jaw or neck pain can also present with similar symptoms as concussion. A qualified event for this study, then, was defined as a potential event followed by a clinical diagnosis of concussion made by a medical provider trained in the evaluation and management of concussion. These evaluations typically included deficits in one of the Sport Concussion Assessment Tool (SCAT) assessments such as balance or delayed recall [44]. Team physicians for the NCAA teams also followed an assessment and management system from the International Symposia on Concussion in Sport to evaluate return to play after concussion [2, 3, 4]. This included a performance-related psychometric exam, the Immediate Post-Concussion Assessment and Cognitive Test (ImPACTTM) [45], administered both at baseline and post-symptom resolution. Table 1 summarizes the number of tests performed for each category. In this table, non-qualified concussion events are labeled NCN. These players were also tracked at return and end of season but were not included in the CRTP, CEND, and CNEXT groups.
For the purposes of this study, the attending physicians and players were blinded from the results so that only current standards of care, and not the P300, were used in determining return.
2.2Procedure
After completing a short 1-page intake form, participants were given an EEG test that included the oddball audio P300 component. Reaction times were also measured by asking the participant to click the track pad or mouse upon hearing the oddball tone. Touch screen Trail Making Tests A and B were added in the second year.
2.3EEG acquisition and preprocessing
The EEG was recorded using the WAViTM Research Platform (WAVi Research, Boulder, CO, USA) sampled at 250 Hz and bandpass filtered between 0.5–30 Hz. The electrodes were placed according to the International 10–20 system using caps with 19 tin electrodes (both with the WAVi Headset and Electro-cap International Inc., Eaton, OH, USA). Linked reference electrodes were placed at the earlobes.
The test administrators were instructed to keep the electrode impedances below 20 kOhm for ground-to-EEG locations and below 10 kOhm for the ground-to-ear locations where possible. These targets are well below the 1 GOhm input impedance of the WAVi amplifiers, are practical regarding preparation time in the sports setting (including certain “sport-related” hairstyles) and produced sufficient yield [46].
To be consistent with the goal of testing a simplified platform, a continuous 4 minute 2-tone audio oddball eyes- closed P300 protocol was used. Here, 200 common tones (1000 Hz) and 40 rare tones (2777 Hz) were delivered in random order over the span of 4 minutes, creating a 0.95 s interstimulus interval with a 50 ms tone length. The tones were delivered using SkullcandyTM over the ear headphones, at 65 dB.
2.3.1First season testing
For the first season, in order to collect other qEEG parameters in addition to the P300, an 18-min test was administered. Here three 20/100 rare/common tests were administered in succession, each separated by 3 min of eyes-closed resting and 3 min eyes-open focused. The eyes-closed qEEG data collected can be compared to those same parameters extracted during the eyes-closed P300 paradigm for further studies, including post-concussion qEEG spectral analysis. As discussed above, documented sleeping portions of the test were discarded. For the following seasons, the testing was reduced to a single 4 min test using a 40/200 paradigm. All new and returning players were scheduled for a baseline in the second year using the shorter 4-min protocol. No difference was seen in any of the P300 parameters between the first year 18-min baseline protocol and the 4-min baseline protocol.
Table 2
Changes from first baseline for non-concussed groups
| Indicator | Change from baseline (± SD) | % Change from baseline (± SD) |
|---|---|---|
| P300V test-retest variation REF | 0 (4) μV | 2 (20)% |
| P300V test-retest variation ALL | 0 (4) μV | 1 (26)% |
| P300T test-retest variation REF | 9 (29) ms | 3 (10)% |
| Reaction Time test-retest variation REF | 37 (69) ms | 13 (24)% |
| Trail A Time test-retest variation REF | -1 (13) s | -2 (30)% |
| Trail B Time test-retest variation REF | 6 (30) s | 8 (38)% |
2.4EEG extraction
While many methods exist for removing movement and other artifacts, we have chosen a technique of automatic artifacting that helps minimize test-retest variance in subjects to achieve better reliability. Here EEG segments with excessive amplitude and/or frequency activities in any of the 4 common EEG frequency bands (delta, theta, alpha, and beta) were automatically excluded from analysis on a channel-by-channel basis. Data were then visually inspected for noise to verify the accuracy of the automated artifacting.
ERP features can also be quantified by a variety of methods, including the extraction of P300 parameters at the extremum, taking voltage differences between common and rare at the extremum, and calculating areas under curves. Here, again to be consistent with our goal of investigating the simplest approaches that produce acceptable test-retest variance, we report P300 components measured by identifying the positive extremum in the latency range of 240–500 ms. The depth (P300V) is then extracted from the mean amplitude of all stimuli and the latency (P300T) is the delay recorded for that depth. These independent ERP epochs were baseline-corrected using the 100ms pre-stimulus period.
P300 parameters are typically extracted from the Cz, or Pz, or the average of various sites. Here we report a P300 μV that is the highest amplitude from the 6 C-P scalp sites (C3, Cz, C4, P3, Pz, P4), and the fastest P300 time (smallest latency) from these same 6 C-P sites. These sites both produce an acceptable test-retest variance but have also been noted as the most useful for mTBI identification in previous studies [23].
2.5Statistics
Categorical group comparisons were analyzed using unpaired sample t-tests for these sufficiently normal distributions. While most studies suggest that P300 amplitude should decrease after trauma, amplitudes may increase in some cases. Because the direction is unclear, we use a 2-tailed t-test to compare injured and non-injured groups. We set our p value cutoff to a more stringent alpha of 0.005, a value recommended in a recent study to address an apparent lack of reproducibility in some medical studies [47].
Successful group comparisons do not necessarily result in clinical utility and so we also constructed receiver operator characteristic (ROC) curves as a function of percent change from baseline between concussed and non-concussed groups for both reaction time and P300 amplitude.
Caution is needed when attempting to create a diagnostic marker for concussion, however, because concussion itself is defined clinically and not physiologically (or electro-physically) and must therefore rely on expert diagnosis as a standard. Furthermore, the P300, as with most concussion assessments, is itself a non-specific marker. While we do report sensitivities and specificities here, the goal of the study is not to simply develop another concussion diagnostic, but also to test the utility of a quantitative method of documenting post-injury electrophysiological change. One of these targets is to investigate changes in P300 parameters at return to play, comparing how individual P300 amplitudes normalize with respect to reaction times, neuropsychological results, and symptoms.
3.Results
3.1Reference group test-retest variability
Changes in P300 after an event form the basis of this study and so variations in a non-concussed reference group from the same population need to be understood. We can conceptualize variance in P300 metrics as a combination of trait (stable characteristics of a person) and of state (representing aspects of a subject’s psychological or physiologic state, such as concussion). To separate these traits from states (i.e., is there a concussion?) and for longitudinal tracking it’s therefore important to determine the within-person variance in routine clinical settings. Table 2 shows changes from baseline for the reference groups as a standard deviation (SD, or 1σ), into which 68% of the players fell. This creates a “normal” expectation. The variation in P300 parameters here is consistent with previous studies for a normal population [37, 38, 48]. Variations in reaction and Trail Making times of Table 2 are larger than P300 variations as they include systematic errors from variations in posture, in computer interfaces (e.g., track pad vs mouse), and practice effects.
Table 3
Coefficients of variance (CV) for P300 (REF group) and other assays
| Indicator | CV |
|---|---|
| P300V | 15 |
| P300T | 8 |
| Glucose | 26 |
| HDL | 24 |
| Cholesterol | 14 |
| Glucose | 26 |
In order to provide context to compare P300 to other methods of physiologic assay such as HDL or cholesterol, it’s useful to investigate P300 variance as coefficients of variation (CV), calculated as 100*SD/Average for each person and then averaged over each group. Table 3 shows the CV values of this study (which are comparable to previous P300 studies) to be lower than other common clinical assays, suggesting the clinical utility of longitudinal tracking [48, 49]. It also suggests that the P300 extraction methods of this study produce sufficient yield.
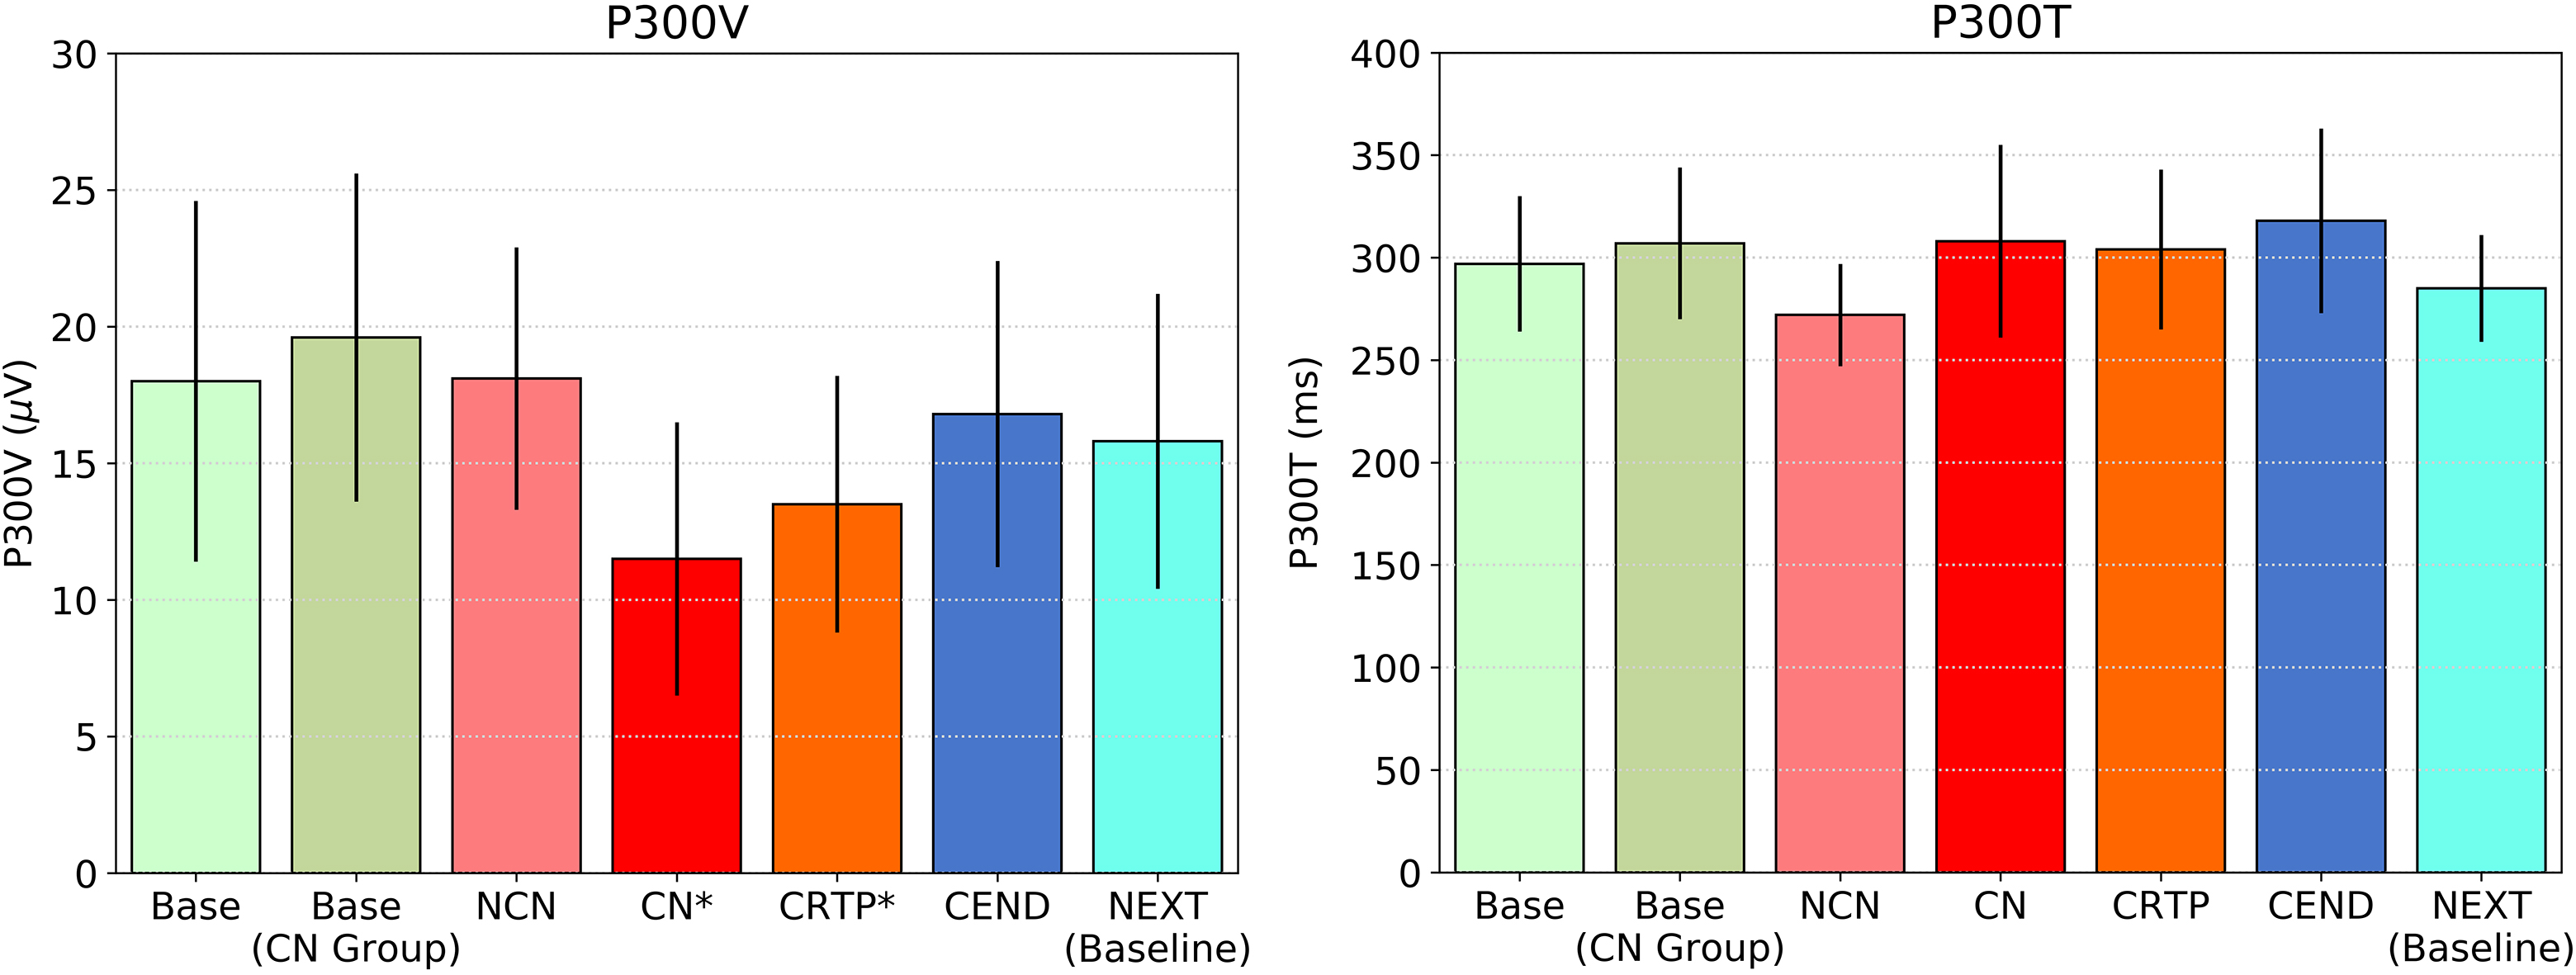
Figure 1.
P300 voltage and latency for various groups, including BASE and NCN for the non-concussed players, and BASE, CN, CRTP, CEND, and NEXT for the players who had a qualified concussion. Significant differences in P300V exist between BASE and CN/CRTP (P*< 0.001) with no significant differences in P300 latency for any group.
It should finally be noted that measuring change as a percentage change from baseline is one of many methods that can be employed. Other methods include investigating the voltage change themselves. Using a Bland-Altman method, a change of approximately ± 7 μV covers a 95% limit [50, 51]. This method doesn’t change the results of this paper except that information from the lowest baselines is lost.
3.2Between group results
To investigate the general performance of P300 in relation to concussion, Fig. 1 shows average P300 values for non-injured groups (BASE and BASE for those who later became part of the CN group) and the injured group (NCN, CN, CRTP, CEND, and NEXT). Here, significant P300 voltage differences from BASE are seen after the event for both CN and CRTP groups (P< 0.001, effect size Cohen’s d= 1.1/0.8 respectively). No differences from BASE are seen for the NCN group, and latency differences are not significant in any group (Fig. 1). The values for the NCN group at return to play were also not altered in a significant way from baseline, which otherwise would beg an interesting question regarding a different category of concussion.
Figure 2 plots P300 amplitude changes from initial baseline alongside performance measures for the various groups. These between-group statistics show significant P300 voltage, reaction time, and Trail A time changes after concussion (P< 0.001, effect sizes Cohen’s d> 1.1 for all of these measures) with only P300 voltage changes remaining significant at the beginning of return to play (P< 0.001, d= 1.3) where reaction time and Trail Making had returned to baseline. This shows a clear trend with P300 amplitude normalizing at a slower rate than performance measures, which is consistent with the above-mentioned studies demonstrating the persistence of altered brain activity following concussion.
Figure 2.
Changes in P300 voltage and performance parameters from initial baseline for various groups. Significant changes between baseline and CN are seen for all parameters (P*< 0.001) except for Trail B. Only P300 changes remain significantly different at CRTP.
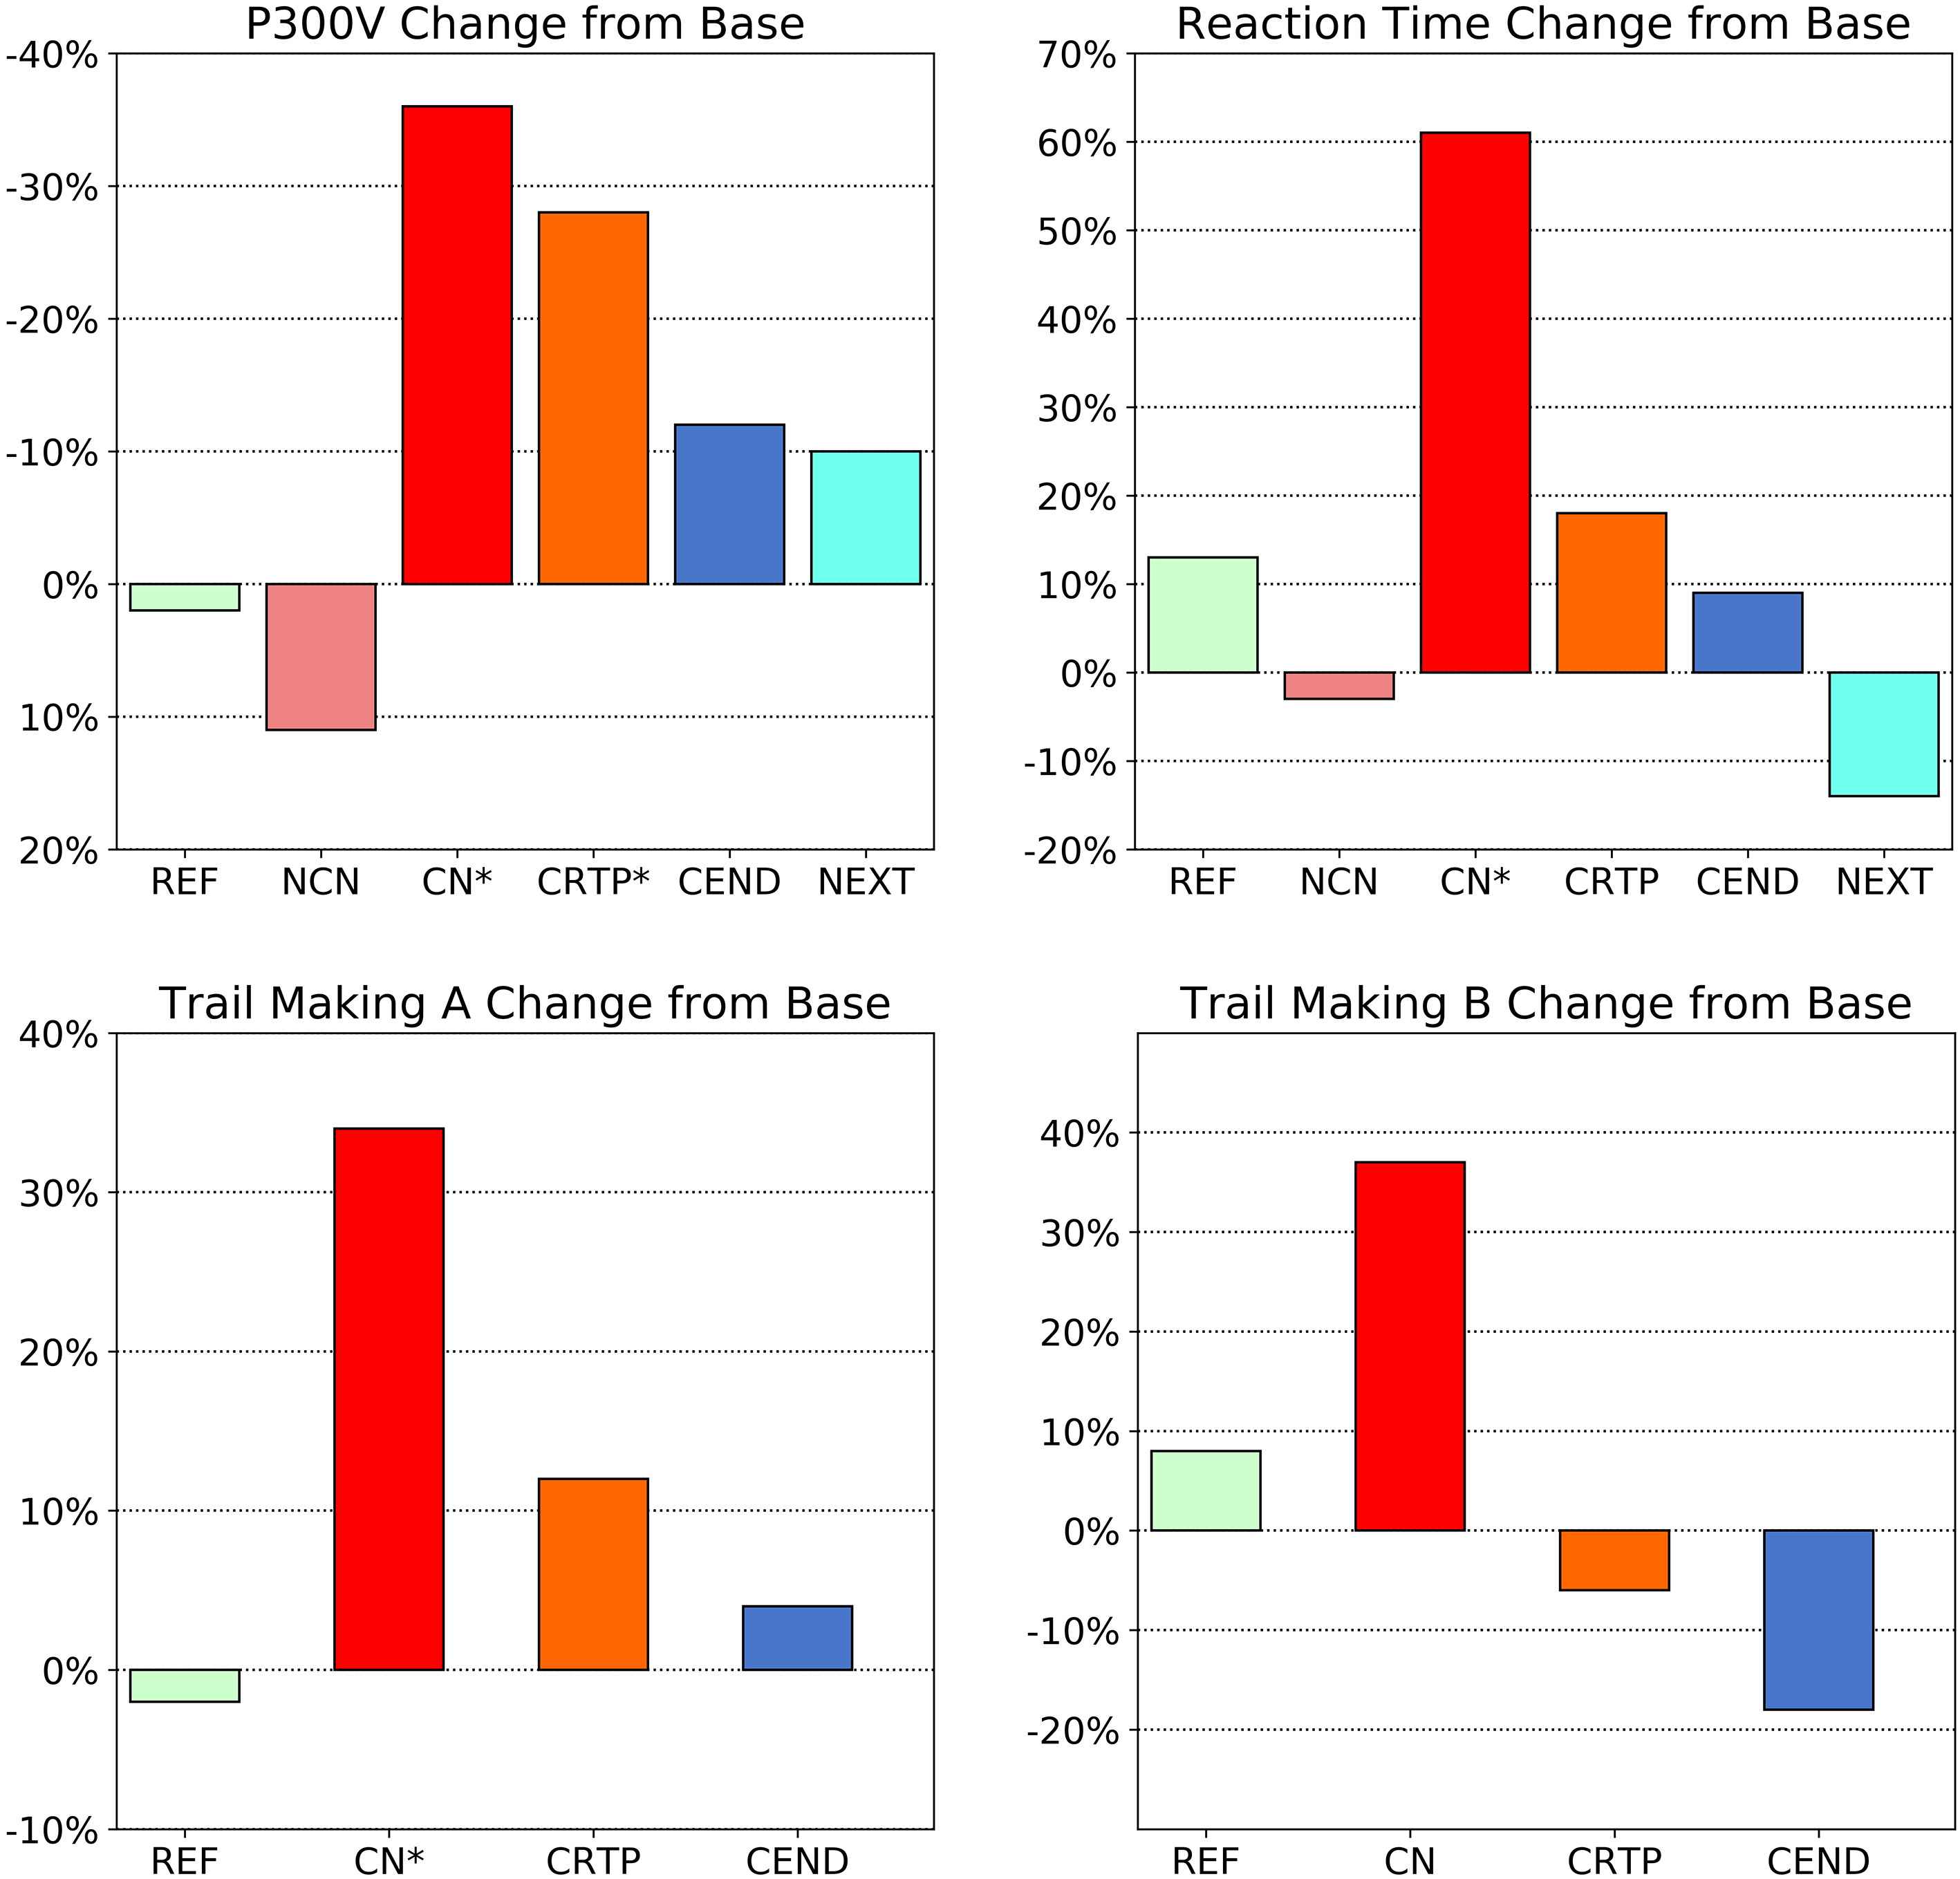
Note that the large change in the CN group with Trail B is not significant at the P< 0.005 level (P< 0.05 d= 0.6) partially due to the larger within-person variation for this test coupled with the fact that Trails were added in the second year, reducing the number of test subjects.
3.3Test-retest results on concussed individuals
The significant group differences seen between baseline and concussion normalize for all markers for the CRTP group except for P300V. The next question is how these translate on an individual basis. We explore this question below for the 2 strongest parameters: reaction time and voltage.
Figure 3.
ROC curves comparing reaction time and/or P300 voltage changes from baseline for concussed group versus non-concussed reference group.
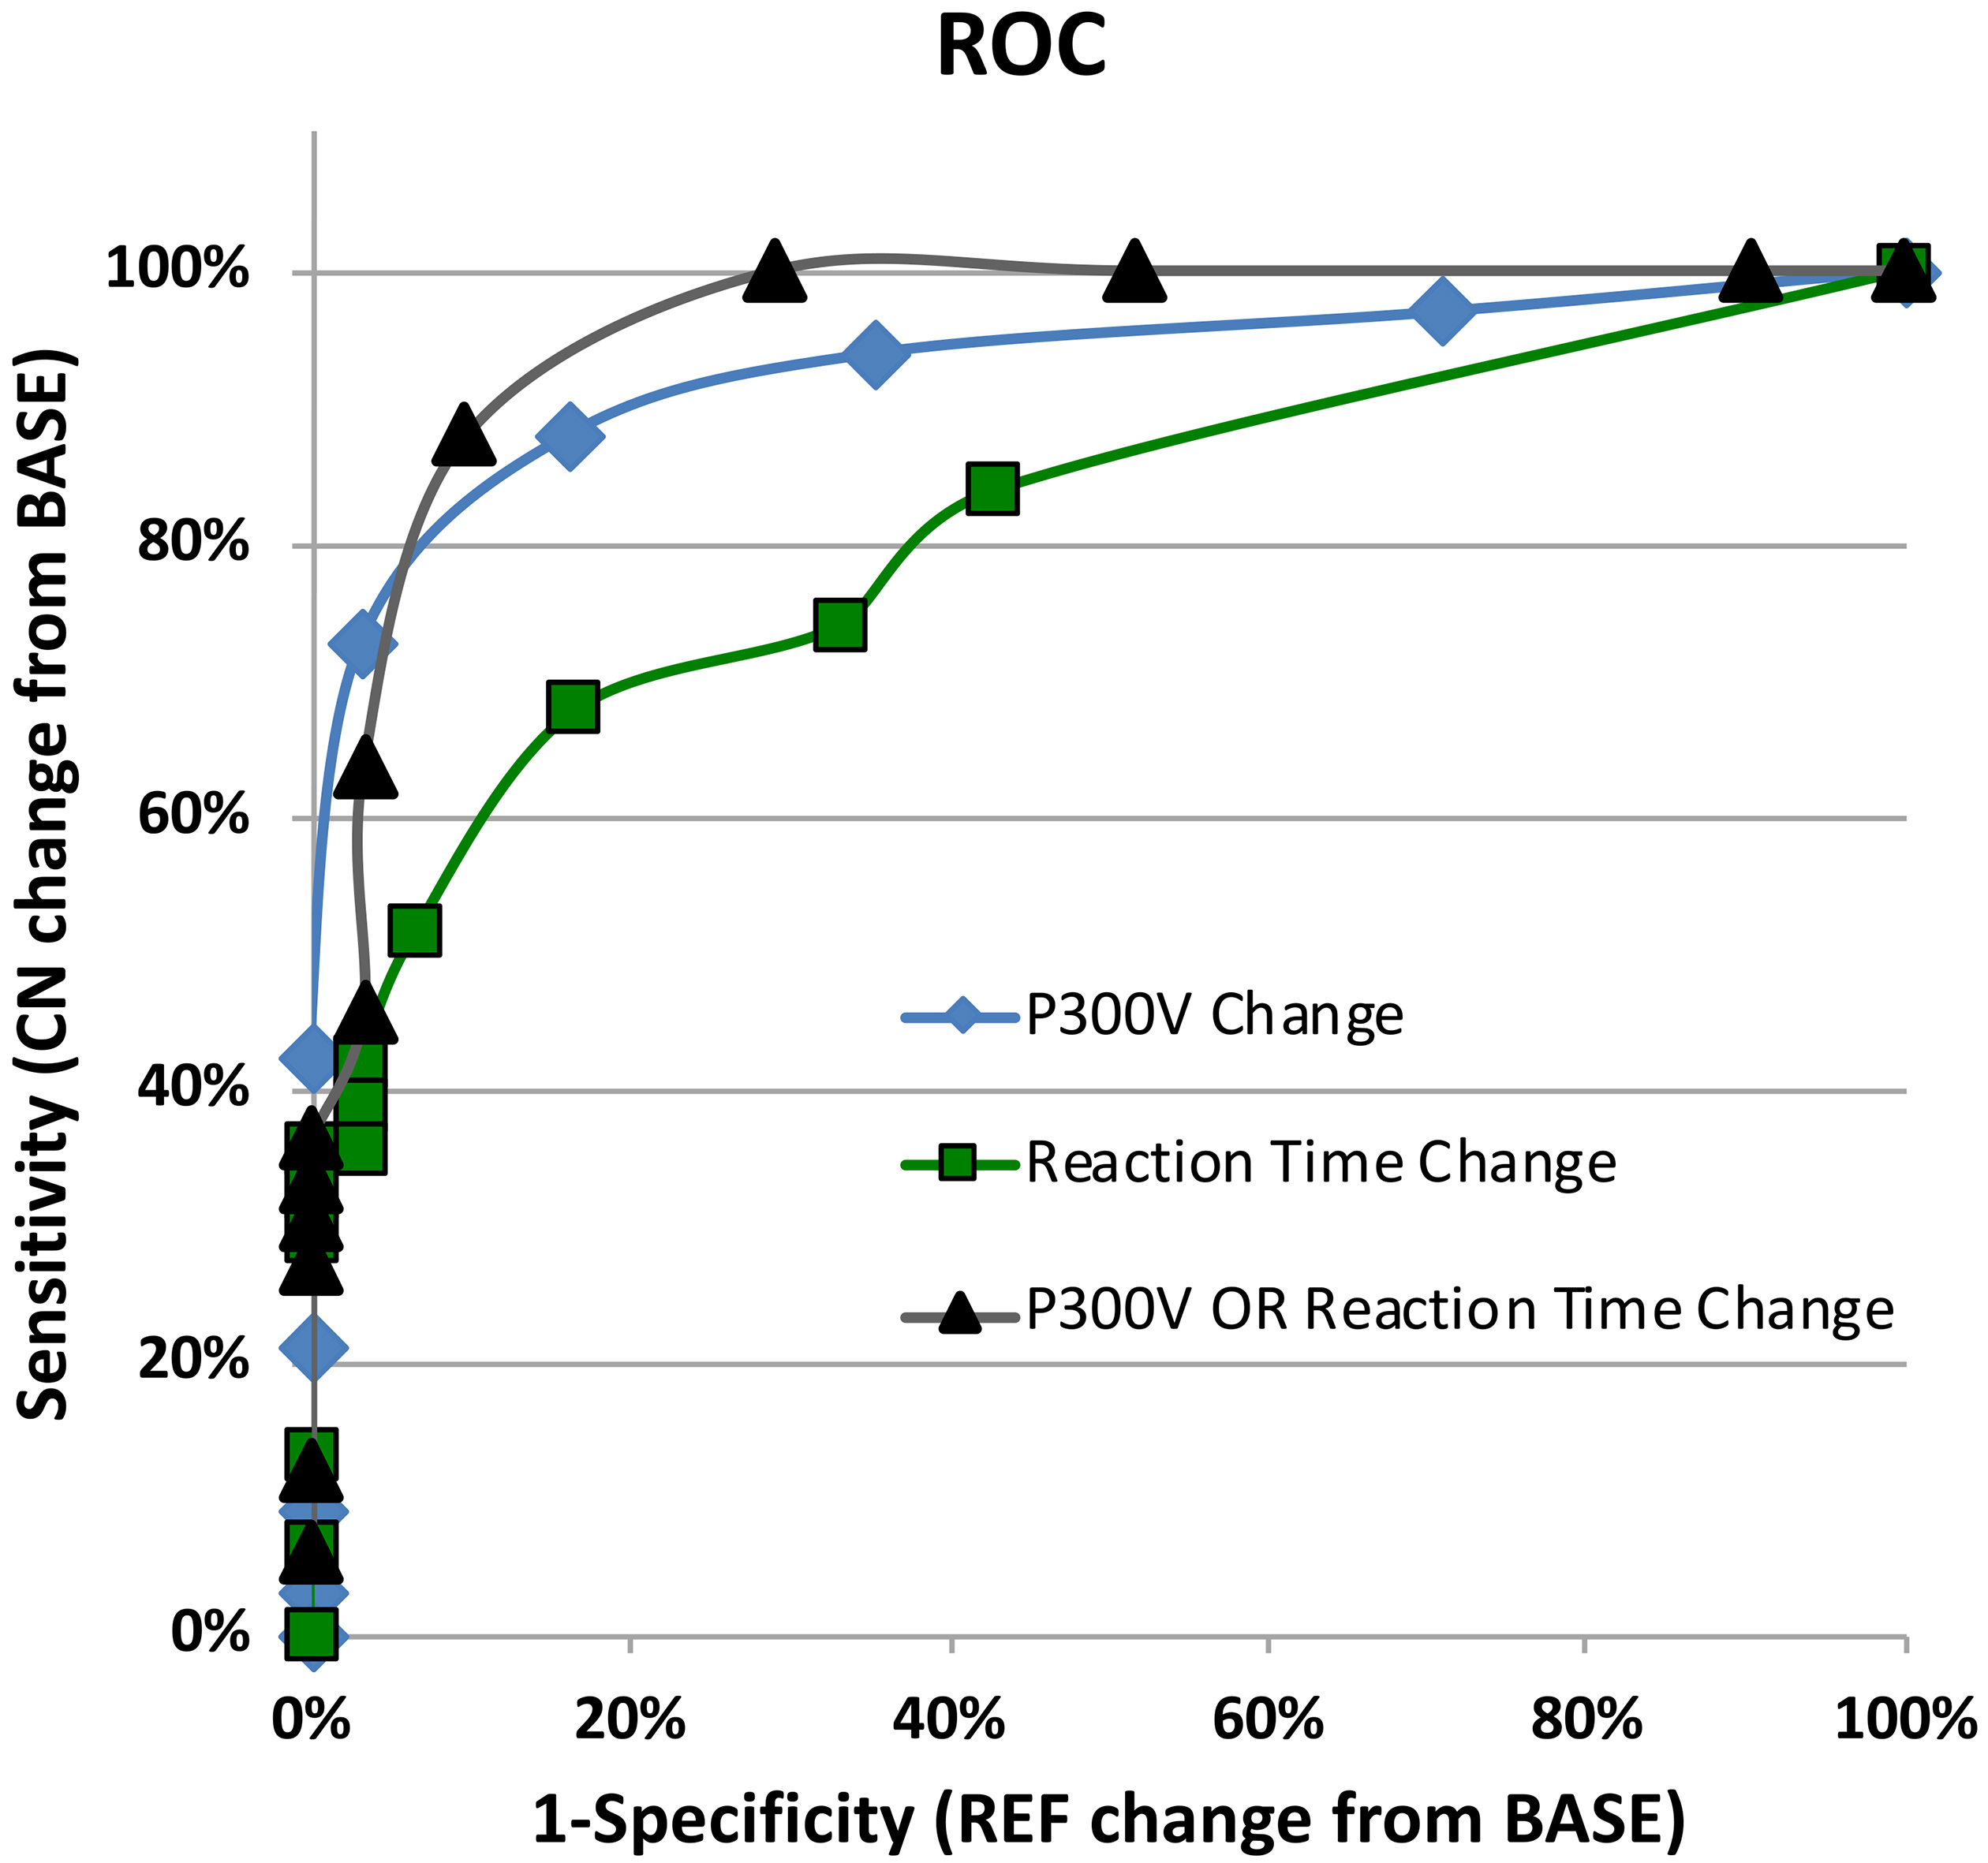
Figure 3 shows the ROC curve for the following conditions: (i) reaction time changes from baseline for REF versus CN groups in bins of +12% change from baseline (AUC = 0.80); (ii) P300 voltage changes from baseline for REF versus CN in bins of 10% change from baseline (AUC = 0.92); (iii) a combined P300 voltage OR reaction time change from baseline for REF versus CN (AUC = 0.95).
For reaction time, 68% of the concussed players slowed by more than 1.5σ compared to 23% in the non-concussed reference group. The resulting sensitivities and specificities are similar to those reported previously for reaction time, where the trading of a higher specificity for higher sensitivity was deemed appropriate for concussion screening [40]. Note that the 23% in the reference is higher than expectation because of a skew introduced by systematic errors associated with in-clinic use, (e.g., a group of administrators choosing the track pad over the mouse even though the mouse was the suggested method).
Regarding P300 voltage, 88% of the concussed players showed a greater than 1.5σ change, compared to 16% in the reference group which followed normal expectation. Adding reaction time with P300, we see that 100% of the players had either a 1.5σ change in voltage OR reaction time at concussion, compared to 29% in the reference group, dropping to 88% true and 10% false at the 2σ level. If the clinician thinks the tradeoff of higher sensitivity is indeed appropriate in concussion screening, for example in youth sports, these markers can all provide screening information.
3.4Injury progression
While this study shows significant P300V and reaction time changes after concussion, as hypothesized, an objective of this study is to test these parameters at the beginning of return-to-play protocols where clinical standards are less clear, particularly for the general practitioner often tasked with making these decisions.
Figure 4.
Number of players showing greater than ±40% P300 voltage change from baseline for CN, CRTP, and non-concussed REF groups. Figure shows lingering P300 changes at CRTP.
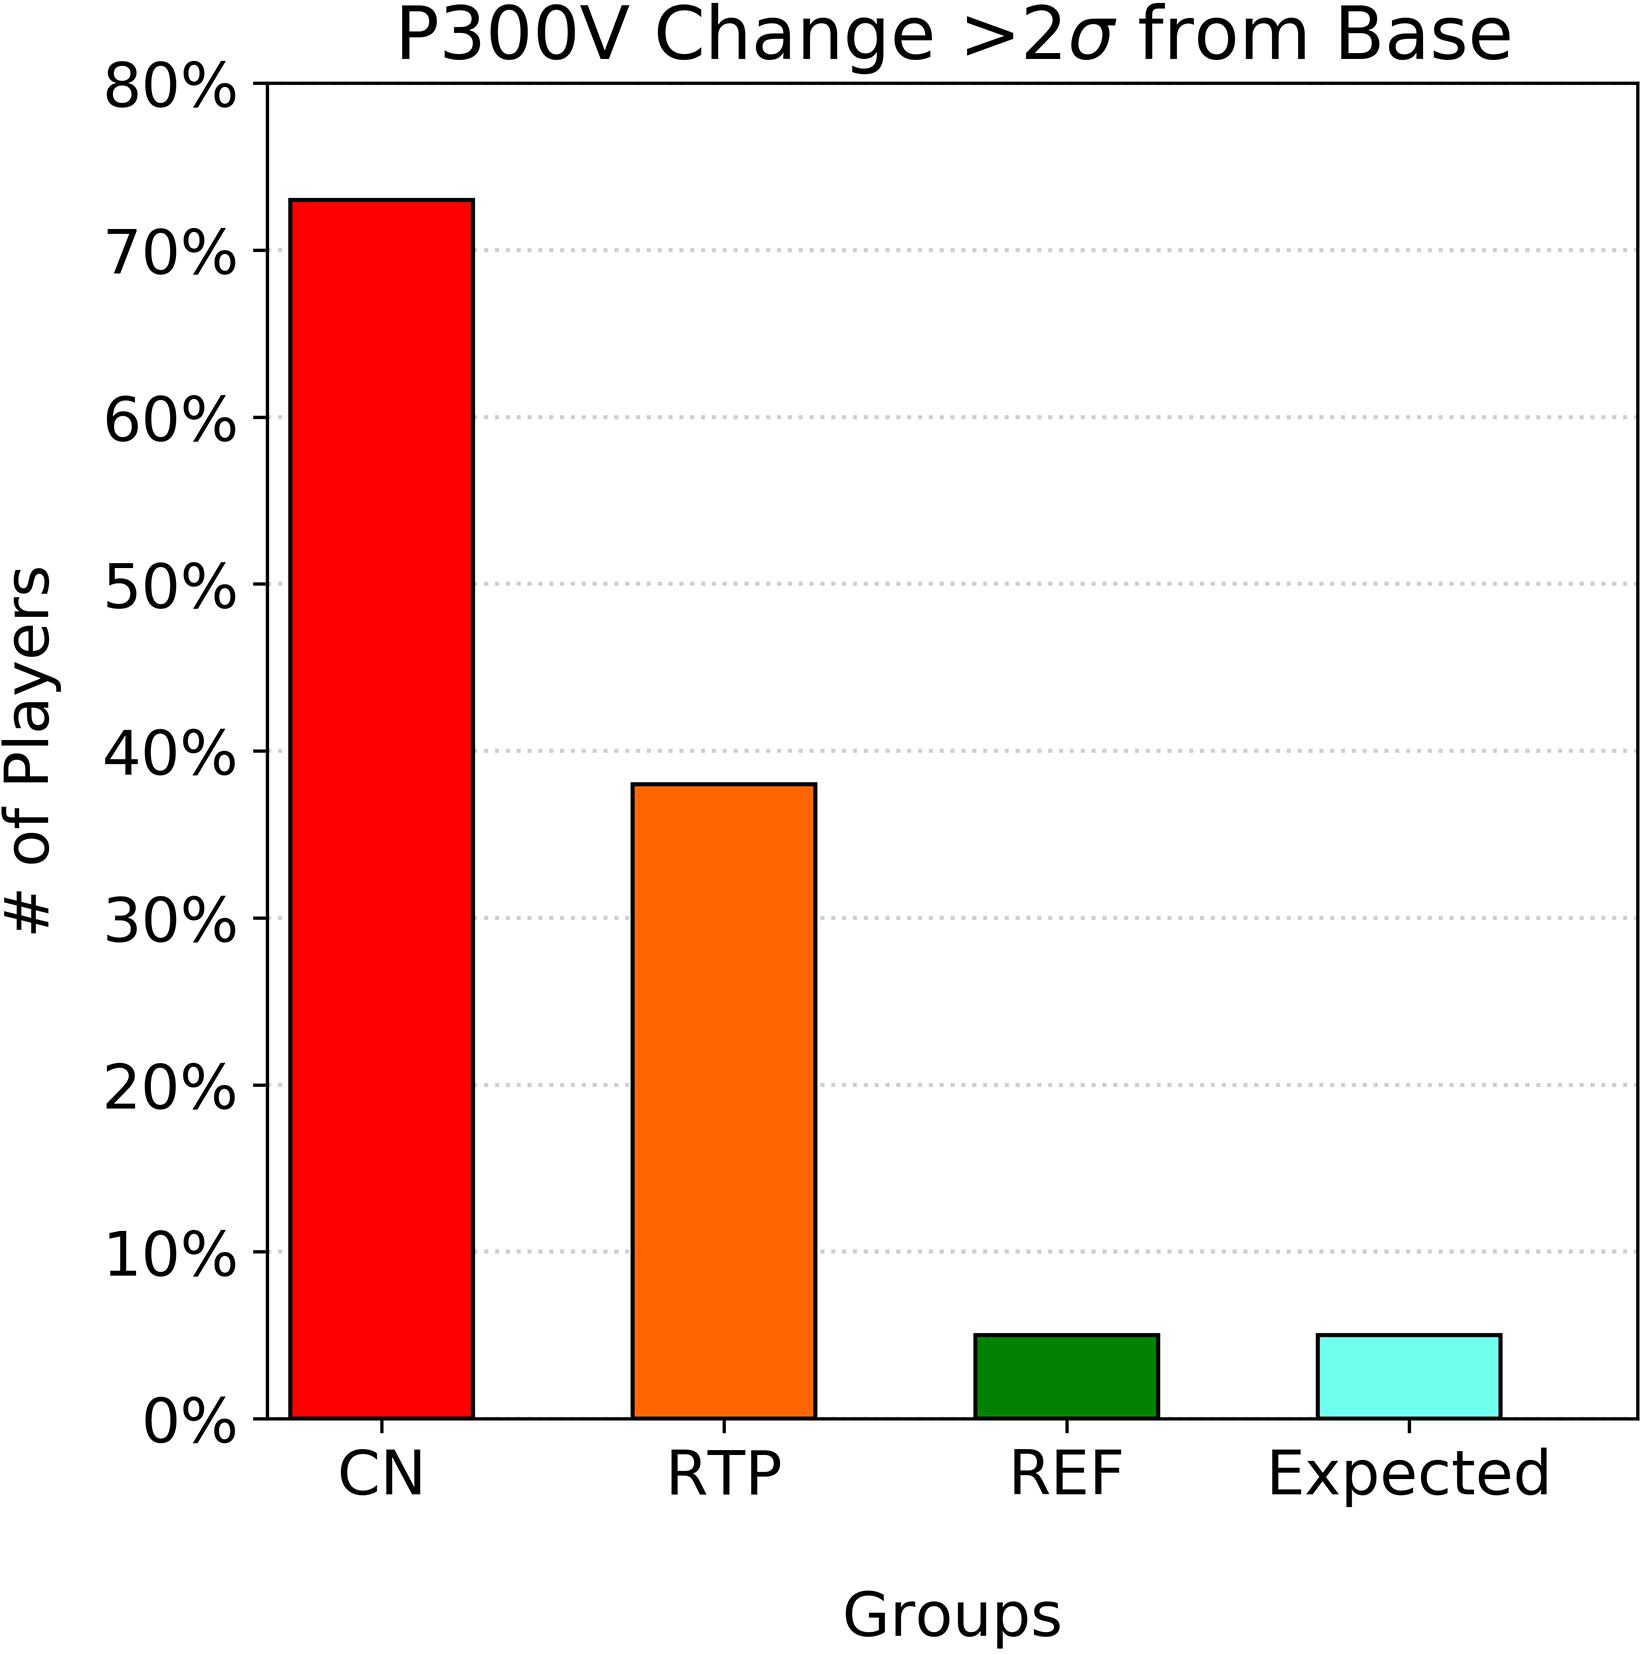
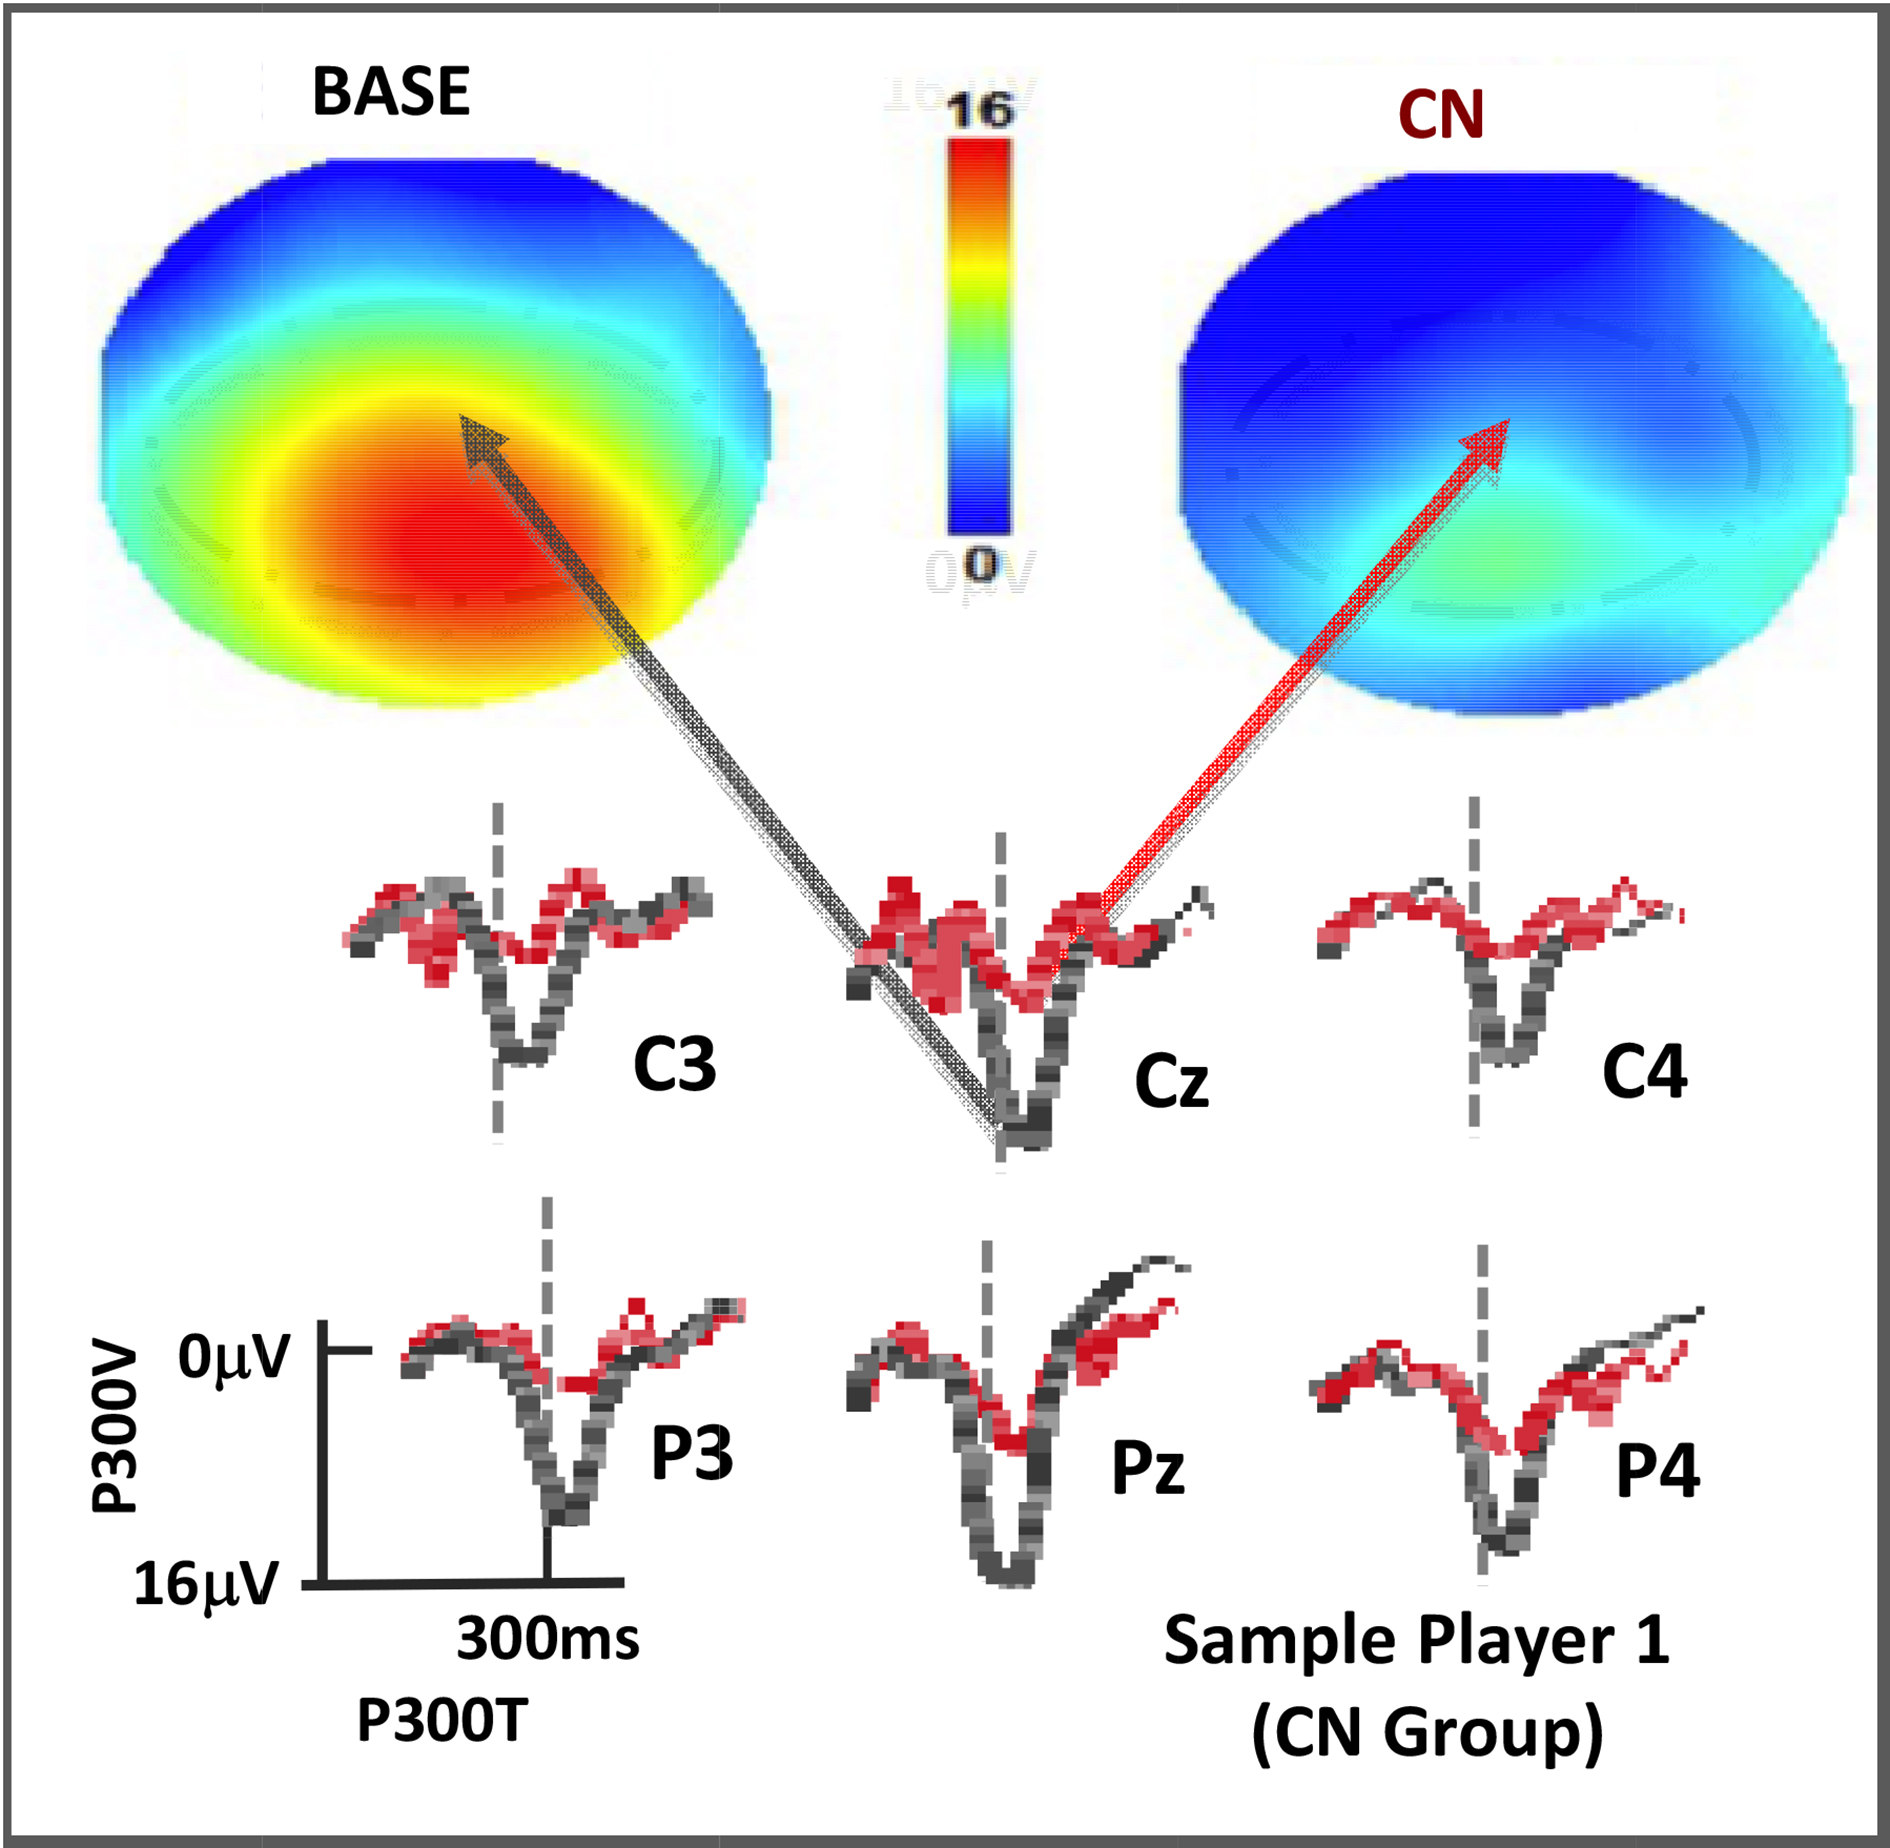
Figure 5.
P300 rare tone depths for a player at BASE and CN displayed as topographs (top, with color scale as shown) and as voltage plots for the C-P region of interest (below, with black at BASE and red at CN). Vertical dotted lines are at 300msec post stimulus.
As with the group statistics, Fig. 4 clearly shows slower P300V recovery than for standard symptom- and performance-based return-to-play assessments in some players, confirming expectations that electro-physical changes can linger after symptom resolution. It should be noted that of the players who had yet to normalize at return to play, roughly one half of those were from a subgroup whose symptoms were not attributed to a single event but rather to a series of sub-acute events such as those experienced by the offensive line in football. These players also seemed more prone to multiple year concussions, though more statistics would be needed to confirm this result.
4.Case studies
As shown, the addition of a 4-min P300 protocol that includes reaction time adds unique information to the existing protocols currently utilized in sports medicine. Topographic reports are a common way of heuristically reporting P300 amplitudes and are described in Fig. 5. Here the P300 depth values (μV) are plotted in color values ranging from blue to red as given. This figure represents a player at baseline and then again after a qualified event. The raw voltage plots from which the topographic maps are derived are also shown.
Figure 6.
Sample P300 depth reports showing changes over the course of an NCAA football career for 3 players. Player 2 played a non-contact position, Player 3 was in the CN group, and Player 4 was in the NCN group.
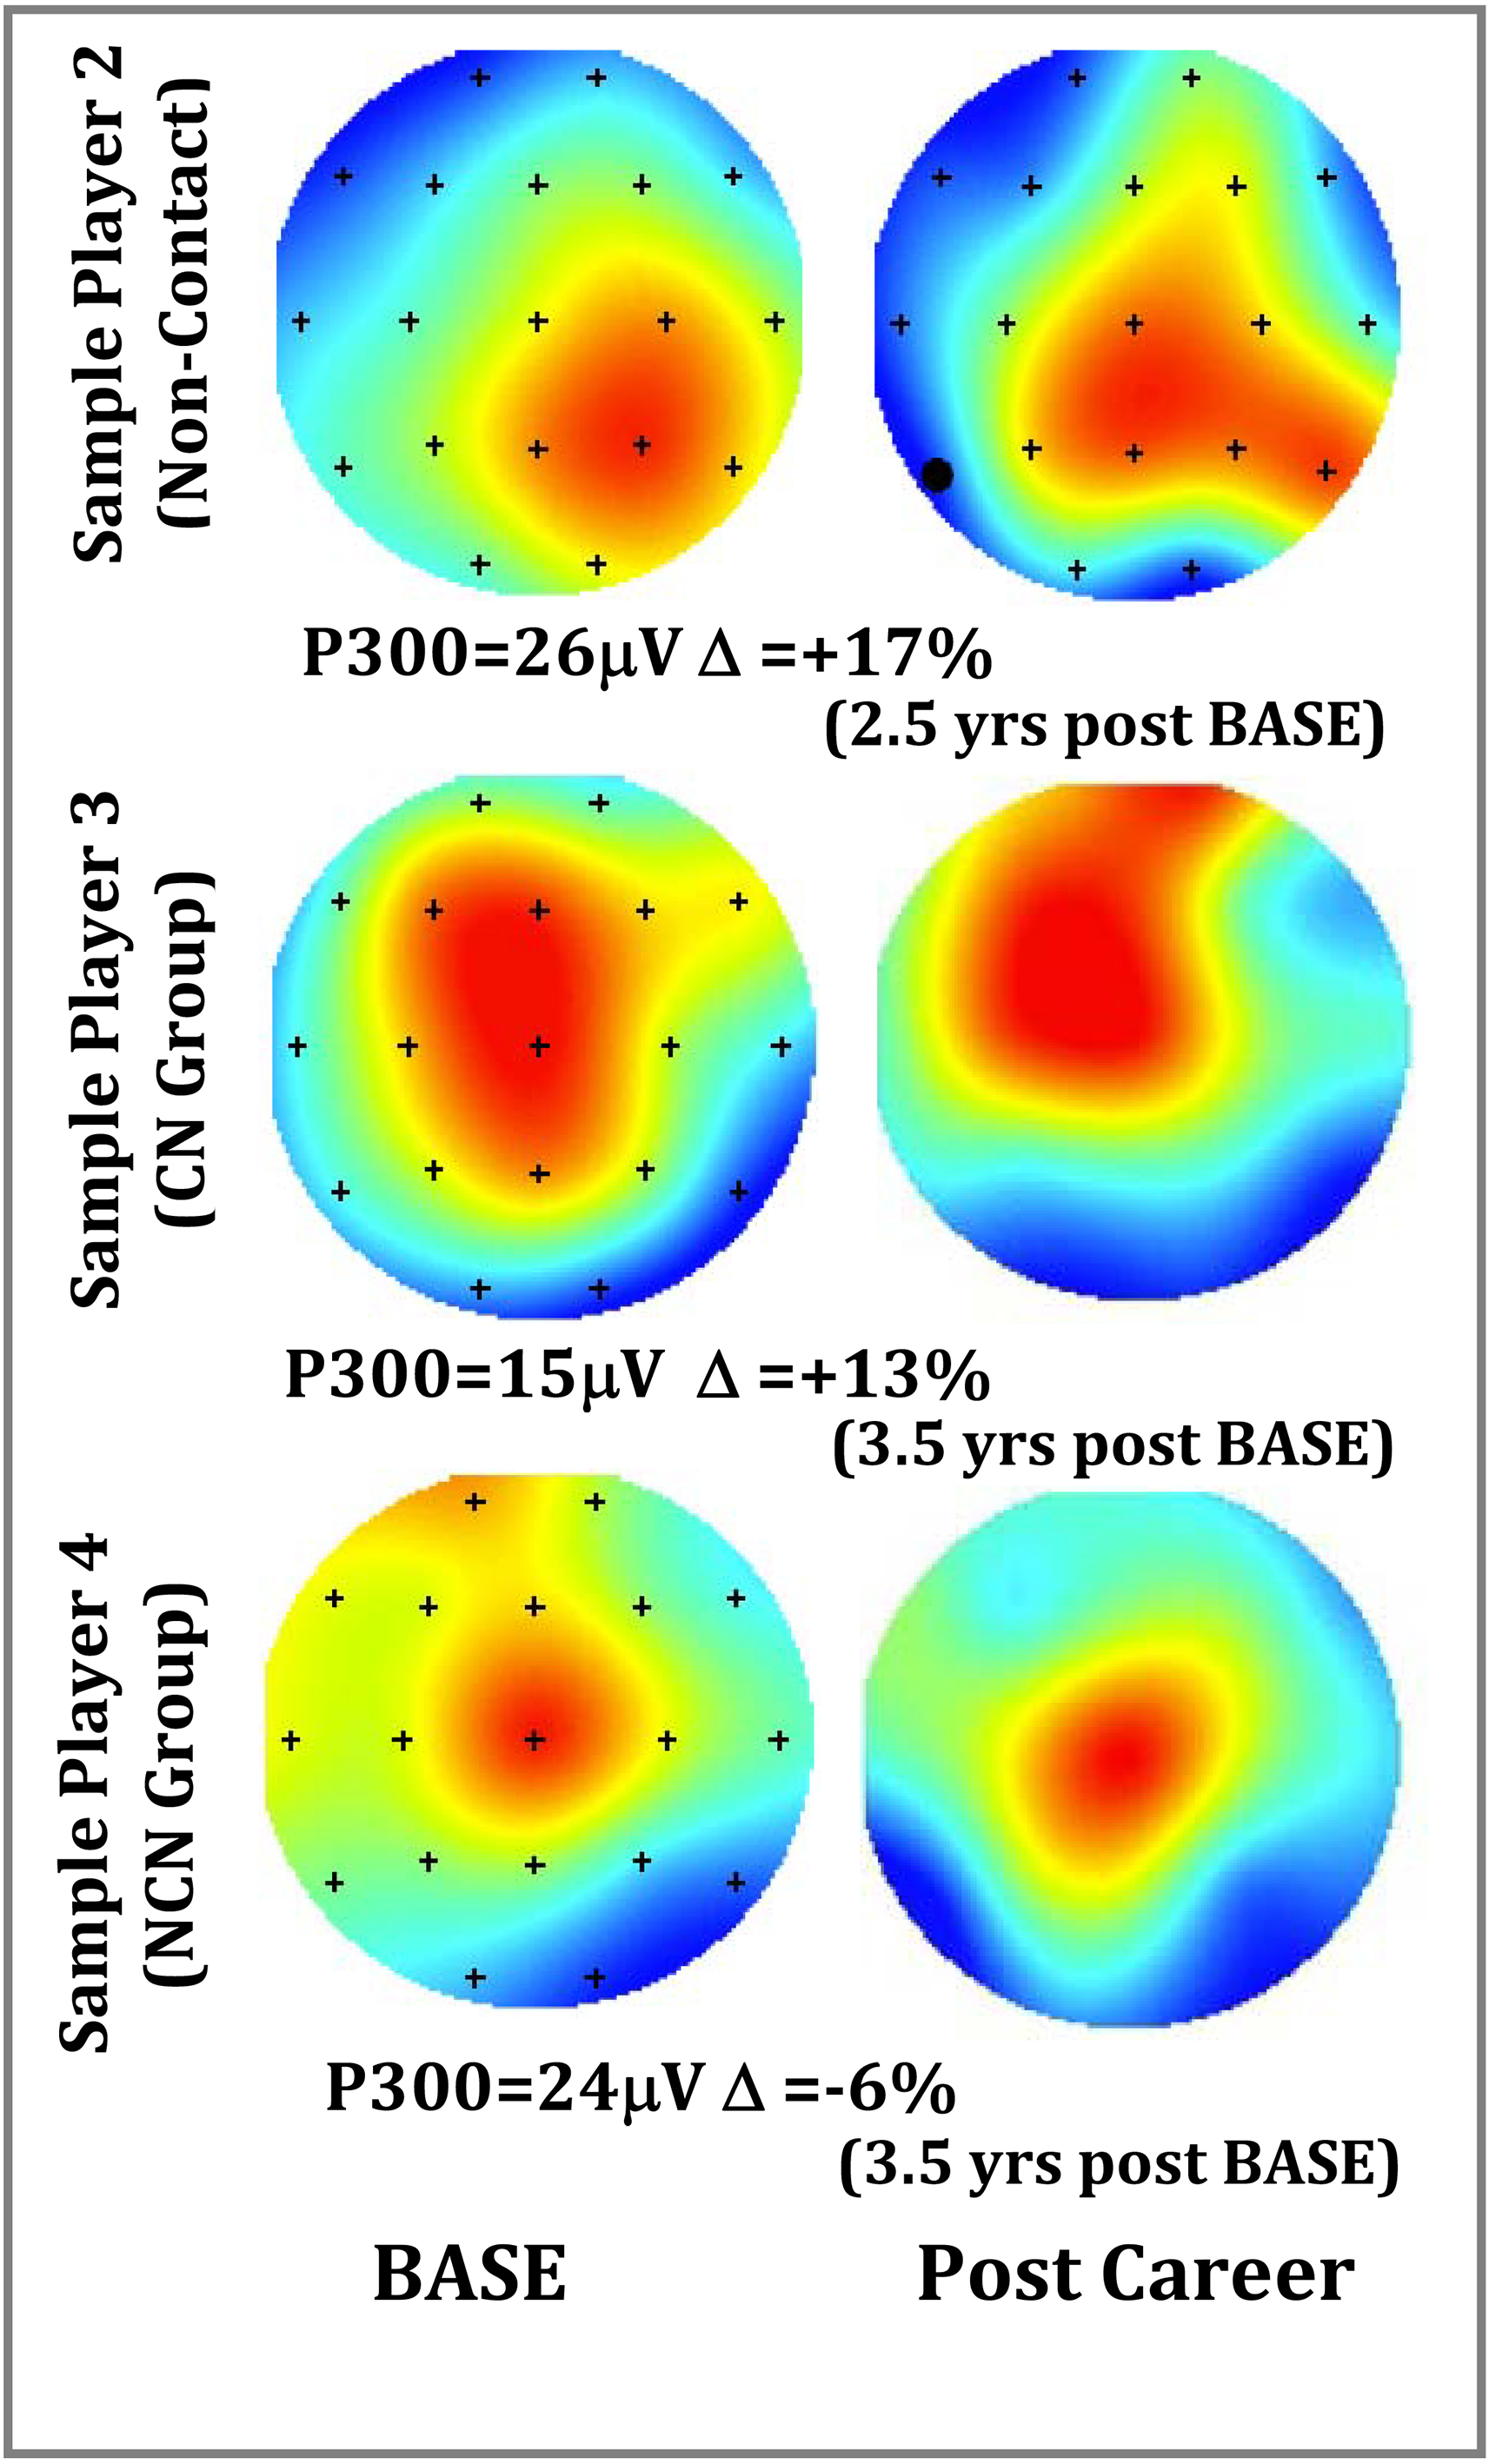
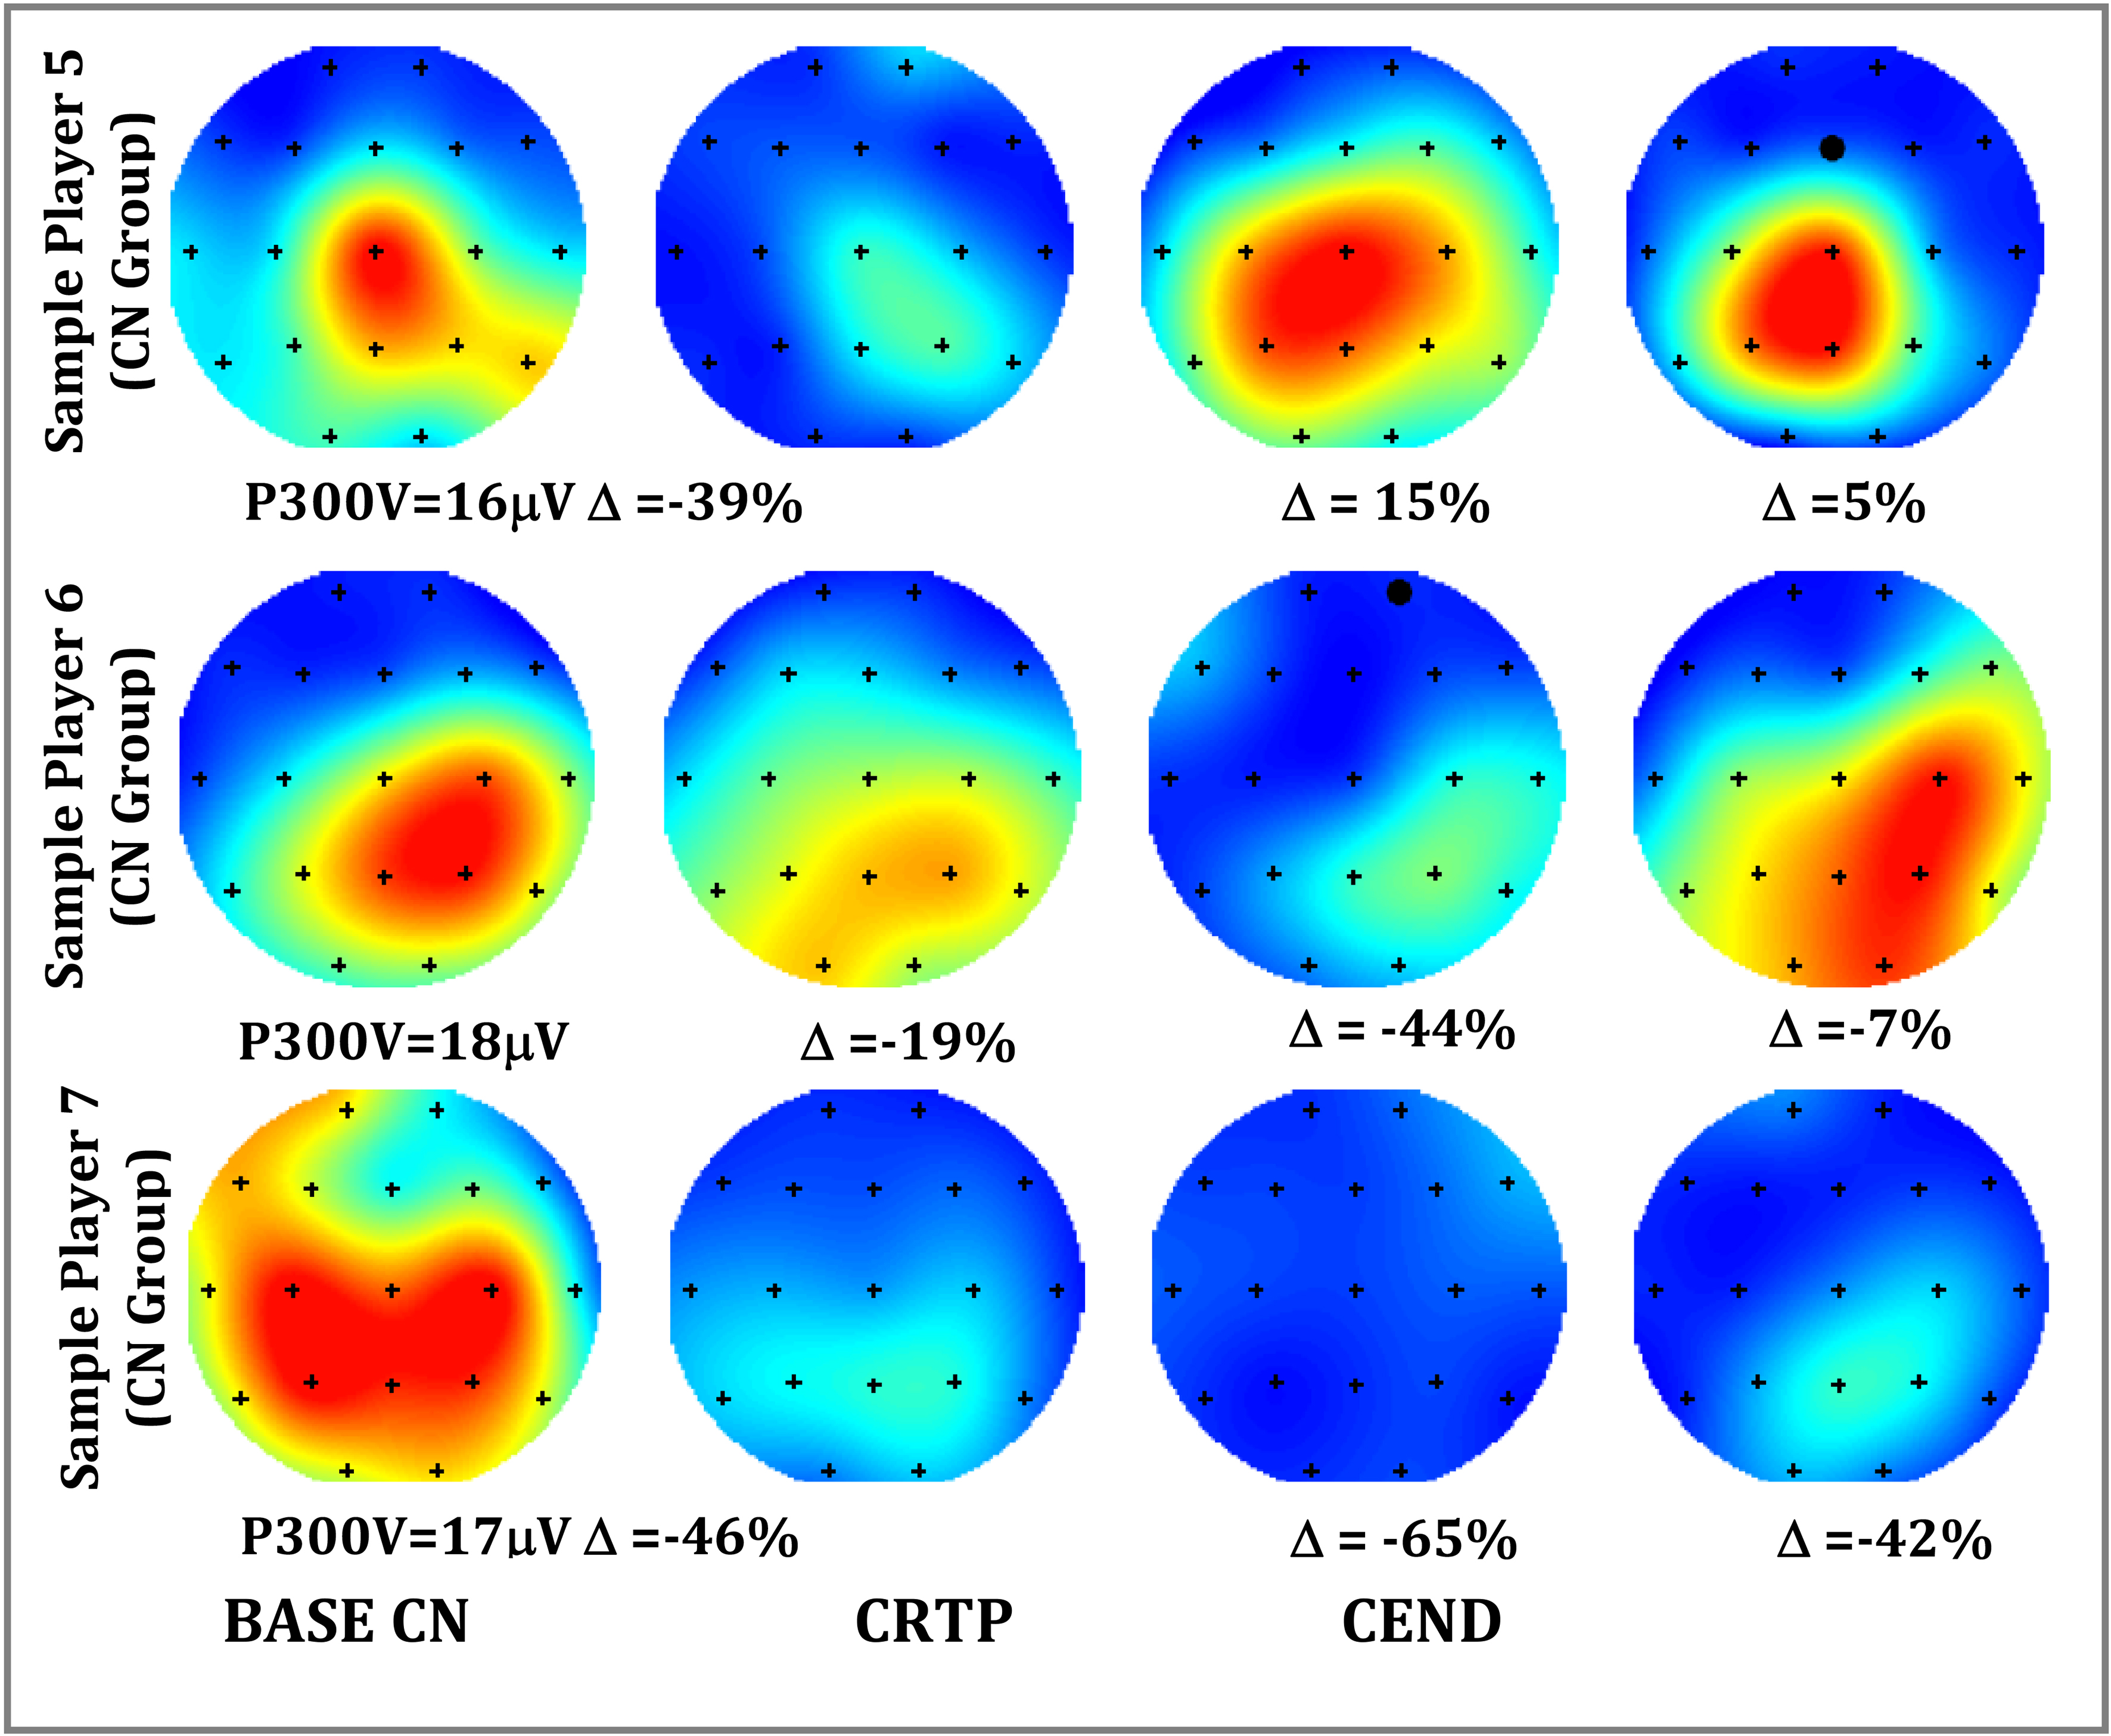
Figure 7.
P300 depth reports for 3 sample players. Player 5 normalized at CRTP, Player 6 did not normalize until post season (CEND), and Player 7 never fully normalized. Note: Player 7 had concussion events in 3 successive years.
4.1Sample test-retest reports
The topographs of Fig. 6 illustrate a range of changes to be expected over the course of an NCAA football career for 3 players measured at BASE (pre-career) and post-career. These players were from three groups including one from a non-contact position, one from the CN group, and one from the NCN group. While the magnitude of the highest P300 voltage may vary, it appears that people retain the same general pattern (left-right or front-back) over time, particularly in the central-parietal region of interest. This finding reflects those of previous studies where a person’s specific P300 morphology (waveforms of Fig. 5) shows little variation over recording sessions or experiments [37].
4.2Sample injury progression reports
The topographs of Fig. 7 illustrate a range of changes seen after a concussion event for 3 players: one whose P300 voltage recovery matched that of the standard return protocols (symptom and performance), one whose P300 voltage recovery was delayed but normalized by post season, and one whose voltage never returned to baseline. This latter player was a part of the sub-acute group, had concussions in three consecutive seasons, and never returned to initial baseline in any of those seasons.
The recovery pattern seen in player a of Fig. 7 was common, with clear P300 changes at CN that had normalized to within 1.5σ by the time the graded return-to-play protocol began. Roughly 40% of the players, however, showed patterns of players b or c who were clinically cleared by existing standards of care but still had lingering P300 deficits. Roughly 20% of these were clinically cleared with P300 anomalies that were still > 3σ reduced from initial baseline. Finally, there were six players who had CN events repeated in consecutive seasons, and four of these failed to return to less than 2σ of the P300 voltage baseline the season before.
5.Discussion
Group comparisons showed significant changes from baseline in both the P300 depth, reaction time, and Trail Making times following concussion versus reference retests. By the beginning of return-to-play protocols only the changes in P300 depth remained significant. Individual test- retest comparison, furthermore, showed all players at concussion had either a significant change in reaction time or P300 depth, where almost one half of those had P300 depths that had yet to recover at initiation of a graded return to play protocol. While previous studies showed attenuated P300 measures for previously concussed versus non-concussed groups, this study however is unique by adding baseline comparisons as well as being limited strictly to a younger age range (17–23 yrs).
From these results, we can construct diagnostic measures with 100% sensitivities, but caution is needed. As is typical of concussion studies, these values are dependent on expert clinical opinions. For example, the physicians and trainers of this study knew the players well, both physically and sociologically. This greatly aided in determining what other factors were involved, for example poor game performance, a history of jaw pain, etc. While we have good reason therefore to have excluded the NCN group, they were still removed from participation, albeit temporarily in most cases. Specificity claims may be even more problematic, given the multifaceted understanding of concussion. This is clearly illustrated in the SCAT where cognitive, balance, and neck tension assessments are included in the same test. Such are the problems associated with creating sensitivities and specificities on ill-defined ailments. For this reason, ERP’s may prove most useful in tracking injury progression.
Another area for consideration is that clinical correlates of P300 amplitude attenuation after concussion are not clear. For example, if a player is deemed clinically ready for return to play but still has a P300 amplitude that is 3σ below baseline, does that mean that they may be more susceptible to further injury (i.e., not yet fully recovered)? If subsequently injured, would their symptoms be more severe and longer lasting? Or, should they be held back from contact until ERP amplitudes are more normalized? Perhaps a measure of ERP such as P300 at last stage of graded return-to-play could be a next step before making the subsequent assertion of returning or holding out. Caution is in order regarding such procedures, however, because there may be other risks associated with keeping young athletes out of play and the long-term effects of playing with a reduced a P300 amplitude post symptom resolution have not been determined [52].
While the association between concussive traumatic events, ERP amplitudes and behavioral changes has yet to be clarified, these data lend strong support for those relationships. The value here likely will come from consideration of these data as an adjunct to good clinical histories and exams when making return to play decisions. Other diagnoses, clinical or recreational drug use, etc. can have an impact on the P300. In the end, the P300 may be most useful not in simply identifying a concussion, even though the predictive value is high, but rather in helping determine if a player’s cognitive resources may still be altered even after other measures have normalized.
On a methodological note, this study was designed to test the P300 method in real-life clinical settings and this in-vivo data collection comes with necessary limitations. For example, the protocol was reduced from 18 to 4 min to better fit into busy schedules and keep players from falling asleep during baseline tests. Measurements at return to play were sometimes not performed if the concussion occurred at end of the season when students were dismissed, and a few players failed to show up for their pre-contact baseline. Furthermore, the concussion assessment and management tools were limited to those practice standards and so these results may lack the granularity that may be achieved in a different type of study, for example a granularity that would allow focus on questions such as injury severity. Finally, this study was also not granular enough to explore differences between genders and between sports.
While this dataset is structured for other analysis methods that include spectral or machine-learning techniques [53], this analysis only focused on the P300 component. For that reason, access to these data can be requested by qualified researchers engaging in independent scientific research and will be provided following review and approval of a research proposal and statistical analysis plan and execution of a Data Sharing Agreement. For more information or to submit a request please contact the corresponding author.
6.Conclusions
The variability of P300 event-related potentials collected at baseline (without injury) appear to remain stable enough to serve as a reference against which post-concussion changes can be compared. Using a simple protocol, our data show significant post-injury changes in P300 amplitude that tended to normalize back to baseline at a rate slower than that observed for other standard clinical and performance measures. Our data corroborate previous results suggesting that concussions cause measurable changes in the electrophysiological markers of brain activity; that concussed participants often pass clinical tests while still displaying electrophysiological deficits; and that ERPs may constitute a useful adjunct in determining return to play for injured athletes thereby helping prevent early return that may prove to correlate with prolonged post-concussive symptomology.
Acknowledgments
We thank Michael Keating of Impact Sports Performance, Justin Landers M. Ed LAT, Russell Sadberry M. Ed ATC/LAT, Sarah Roberson ATC/LAT, and Tony Sdao for their assistance. This project was self-funded. Data collection was provided by the University of Colorado athletic department and the above-mentioned people; clinical evaluation was provided by University of Colorado School of Medicine in conjunction with the athletic trainers; the equipment was provided by WAVi Co.; and data analysis and manuscript preparation was provided by all parties including Children’s Hospital Colorado.
Conflict of interest
Joffe, Oakley and Palermo are paid consultants for WAVi Co. which provided the EEG technology used in the study. Clayton, Davis, Holliday, Poddar, and Rueda have no conflicts to report.
References
[1] | USGAO. Mild Traumatic Brain Injury Screening and Evaluation Implemented for OEF/OIF Veterans, but Challenges Remain. Highlights of GAO-08-276, a report to congressional requesters. February (2008) ; 1-35. |
[2] | Harmon KG, Clugston JR, Dec K, Hainline B, Herring S, Kane SF, et al. American Medical Society for Sports Medicine position statement on concussion in sport. British Journal of Sports Medicine. (2019) ; 53: : 213-225. |
[3] | McCrory P, Meeuwisse W, Dvorak J, Aubry M, Bailes, J, Broglio S, et al. Consensus statement on concussion in sport-the 5(th) international conference on concussion in sport held in Berlin, October 2016. British Journal of Sports Medicine. (2016) ; 51: : 838-847. |
[4] | McCrory P, Meeuwisse W, Johnston K, Dvorak J, Aubry M, Molloy M, et al. Consensus statement on concussion in sport: the 3rd International Conference on Concussion in Sport held in Zurich November 2008. Journal of Athletic Training. (2009) ; 44: : 434-448. |
[5] | Makdissi M, Darby D, Maruff P, Ugoni A, Brukner P, McCrory PR. Natural history of concussion in sport: markers of severity and implications for management. The American Journal of Sports Medicine. (2010) ; 38: : 464-471. |
[6] | McCrea M, Guskiewicz KM, Marchall SW, Barr W, Randolph C, Cantu RC, et al. Acute effects and recovery time following concussion in collegiate football players: the NCAA Concussion Study. Jama. (2003) ; 290: : 2556-2563. |
[7] | Sosin DM, Sniezek JE, Thurman DJ. Incidence of mild and moderate brain injury in the United States, 1991. Brain Injury. (1996) ; 10: : 47-54. |
[8] | Thompson J, Sebastianelli W, Slobounov S. EEG and postural correlates of mild traumatic brain injury in athletes. Neurosci Lett. (2005) ; 377: : 158-163. |
[9] | Williams WH, Potter S, Ryland H. Mild traumatic brain injury and Postconcussion Syndrome: a neuropsychological perspective. Journal of Neurology, Neurosurgery, and Psychiatry. (2010) ; 81: : 1116-1122. |
[10] | Cantu RC. Second-impact syndrome. Clinics in Sports Medicine. (1998) ; 17: : 37-44. |
[11] | Bigler ED. Neuropsychology and clinical neuroscience of persistent post-concussive syndrome. Journal of the International Neuropsychological Society: JINS. (2008) ; 14: : 1-22. |
[12] | Collins MW, Grindel SH, Lovell MR, Dede DE, Moser DJ, Phalin BR, et al. Relationship between concussion and neuropsychological performance in college football players. Jama. (1999) ; 282: : 964-970. |
[13] | Maruta J, Lee SW, Jacobs EF, Ghajar J. A unified science of concussion. Annals of the New York Academy of Sciences. (2010) ; 1208: : 58-66. |
[14] | Teel EF, Ray WJ, Geronimo AM, Slobounov SM. Residual alterations of brain electrical activity in clinically asymptomatic concussed individuals: an EEG study. Clinical Neurophysiology: Official Journal of the International Federation of Clinical Neurophysiology. (2014) ; 125: : 703-707. |
[15] | Churchill NW, Hutchison MG, Richards D, Leung G, Graham SJ, Schweizer TA. Neuroimaging of sport concussion: persistent alterations in brain structure and function at medical clearance. Scientific Reports. (2017) ; 7: : 8297. |
[16] | Churchill NW, Caverzasi E, Graham SJ, Hutchison MG, Schweizer TA. White matter during concussion recovery: Comparing diffusion tensor imaging (DTI) and neurite orientation dispersion and density imaging (NODDI). Hum Brain Mapp. (2019) ; 40: : 1908-1918. |
[17] | Churchill NW, Hutchison MG, Graham SJ, Schweizer TA. Mapping brain recovery after concussion. Neurology. (2019) ; 93: : 1980-1992. |
[18] | Kamins J, Bigler E, Covassin T, Henry L, Kemp S, Leddy JJ, et al. What is the physiological time to recovery after concussion? A ystematic review. Br J Sports Med. (2017) ; 51: : 935-940. |
[19] | Andelinovic M, Titlic M, Andelinovic D. Functional Changes of P300 Values among Young Football Players as a Measure of a Cognitive Function. Collegium Antropologicum. (2015) ; 39: : 641-645. |
[20] | Baillargeon A, Lassonde M, Leclerc S, Ellemberg D. Neuropsychological and neurophysiological assessment of sport concussion in children, adolescents and adults. Brain Injury. (2012) ; 26: : 211-220. |
[21] | Broglio SP, Pontifex MB, O’Connor P, Hillman CH. The persistent effects of concussion on neuroelectric indices of attention. Journal of Neurotrauma. (2009) ; 26: : 1463-1470. |
[22] | De Beaumont L, Théoret H, Mongeon D, Messier J, Leclerc S, Tremblay S, et al. Brain function decline in healthy retired athletes who sustained their last sports concussion in early adulthood. Brain. (2009) ; 132: : 695-708. |
[23] | Dupuis F, Johnston KM, Lavoie M, Lepore F, Lassonde M. Concussions in athletes produce brain dysfunction as revealed by event-related potentials. Neuroreport. (2000) ; 11: : 4087-4092. |
[24] | Kraus N, Thompson EC, Krizman J, Cook K, White-Schwoch T, LaBella CR. Auditory biological marker of concussion in children. Scientific Reports. (2016) ; 6: : 39009. |
[25] | Muller A, Candrian G, Dall’Acqua P, Kompatsiari K, Baschera GM, Mica L, et al. Altered cognitive processes in the acute phase of mTBI: an analysis of independent components of event-related potentials. Neuroreport. (2015) ; 26: : 952-957. |
[26] | Rapp P, Keyser D, Albano A, Hernandez R, Gibson D, Zambon R, et al. Traumatic brain injury detection using electrophysiological methods. Frontiers in Human Neuroscience. (2015) ; 9: : 11. |
[27] | Reches A, Kutcher J, Elbin RJ, Or-Ly H, Sadeh B, Greer J, et al. Preliminary investigation of Brain Network Activation (BNA) and its clinical utility in sport-related concussion. Brain Injury. (2017) ; 31: : 237-246. |
[28] | Rousseff RT, Tzvetanov P, Atanassova PA, Volkov I, Hristova I. Correlation between cognitive P300 changes and the grade of closed head injury. Electromyography and Clinical Neurophysiology. (2006) ; 46: : 275-277. |
[29] | Witt ST, Lovejoy DW, Pearlson GD, Stevens MC. Decreased prefrontal cortex activity in mild traumatic brain injury during performance of an auditory oddball task. Brain Imaging Behav. (2010) ; 4: : 232-247. |
[30] | Kramer AF, Strayer DL. Assessing the development of automatic processing: an application of dual-task and event-related brain potential methodologies. Biological Psychology. (1988) ; 26: : 231-267. |
[31] | Kutas M, McCarthy G, Donchin E. Augmenting mental chronometry: the P300 as a measure of stimulus evaluation time. Science. (1977) ; 197: : 792-795. |
[32] | McCarthy G, Donchin EA. metric for thought: a comparison of P300 latency and reaction time. Science. (1981) ; 211: : 77-80. |
[33] | Polich J. Attention, probability, and task demands as determinants of P300 latency from auditory stimuli. Electroencephalography and Clinical Neurophysiology. (1986) ; 63: : 251-259. |
[34] | Wickens C, Kramer A, Vanasse L, Donchin E. Performance of concurrent tasks: a psychophysiological analysis of the reciprocity of information-processing resources. Science. (1983) ; 221: : 1080-1082. |
[35] | Polich J. Meta-analysis of P300 normative aging studies. Psychophysiology. (1996) ; 33: : 334-353. |
[36] | Polich J. Clinical application of the P300 event-related brain potential. Physical Medicine and Rehabilitation Clinics of North America. (2004) ; 15: : 133-161. |
[37] | van Dinteren R, Arns M, Jongsma ML, Kessels RP. P300 development across the lifespan: a systematic review and meta-analysis. PloS One. (2014) ; 9: : e87347. |
[38] | Williams LM, et al. The test-retest reliability of a standardized neurocognitive and neurophysiological test battery: “neuromarker”. The International Journal of Neuroscience. (2005) ; 115: : 1605-1630. |
[39] | Gordeev SA. The Use of Endogenous p300 event-related potentials of the brain for assessing cognitive functions in healthy subjects and in clinical practice. Human Physiology. (2007) ; 33: : 121-133. |
[40] | Tombaugh TN. Trail Making Test A and B: normative data stratified by age and education. Arch Clin Neuropsychol. (2004) ; 19: : 203-214. |
[41] | Eckner JT, Kutcher JS, Broglio SP, Richardson JK. Effect of sport-related concussion on clinically measured simple reaction time. British Journal of Sports Medicine. (2014) ; 48: : 112-118. |
[42] | Gosselin N, Saluja R, Chen JK, Bottari C, Johnston K, Ptito A. Brain functions after sports-related concussion: insights from event-related potentials and functional MRI. The Physician and Sportsmedicine. (2010) ; 38: : 27-37. |
[43] | Zuckerman S, Kerr Z, Yengo-Kahn A, Wasserman E, Covassin T, Solomon G. Epidemiology of Sports-Related Concussion in NCAA Athletes From 2009–2010 to 2013–2014: Incidence, Recurrence, and Mechanisms. The American Journal of Sports Medicine. (2015) ; 43: : 2654-2662. |
[44] | McCrory P, Meeuwisse W, Aubry M, Cantu B, Dvorak J, Echemendia R, et al. Consensus statement on concussion in sport: the 4th International Conference on Concussion in Sport, Zurich, November 2012. Journal of Athletic Training. (2012) ; 48: : 554-575. |
[45] | Iverson GL, Lovell, MR, Collins MW. Interpreting change on ImPACT following sport concussion. Clin Neuropsychol. (2003) ; 17: : 460-467. |
[46] | Kappenman ES, Luck SJ. The Effects of Electrode Impedance on Data Quality and Statistical Significance in ERP Recordings. Psychophysiology. (2010) ; 47: (5): 888-904. |
[47] | Berger J, Johannesson M, Nosek B, Wagenmakers EJ, Berk R, et al. Redefine Statistical significance. Nathumanbehav. (2018) ; 2: : 6-10. |
[48] | Polich J, Herbst KL. P300 as a clinical assay: rationale, evaluation, and findings. Int J Psychophysiol. (2000) ; 38: : 3-19. |
[49] | Dalebout S, Robey D. Comparison of the Intersubject and Intrasubject Variability of Exogenous and Endogenous Auditory Evoked Potentials. J Am Acad Audiol. (1997) ; 8: : 342-352. |
[50] | Altman D, Bland J. Measurement in Medicine: The Analysis of Method Comparison Studies. Journal of the Royal Statistical Society. Series D (The Statistician). (1983) ; 32: : 307-317. |
[51] | Giavarina D. Understanding Bland Altman analysis. Biochem Med (Zagreb). (2015) ; 25: : 141-151. |
[52] | Merkel, DL. Youth sport: positive and negative impact on young athletes. Open Access J Sports Med. (2013) ; 4: : 151-160. |
[53] | Rueda M, Jash A, Oakley DS. A Low Dimensional Parameterization of Electroencephalograms Towards the Detection of Mild Traumatic Brain Injury. Paper Presented at: Big Sky Athletic Training Sports Medicine Conference. (2011) ; Jan 31-Feb3; Big Sky MT USA. |

