
Which Gait Tasks Produce Reliable Outcome Measures of Freezing of Gait in Parkinson’s Disease?
Abstract
Background:
Measurement of freezing of gait (FOG) relies on the sensitivity and reliability of tasks to provoke FOG. It is currently unclear which tasks provide the best outcomes and how medication state plays into this.
Objective:
To establish the sensitivity and test-retest reliability of various FOG-provoking tasks for presence and severity of FOG, with (ON) and without (OFF) dopaminergic medication.
Methods:
FOG-presence and percentage time frozen (% TF) were derived from video annotations of a home-based FOG-provoking protocol performed in OFF and ON. This included: the four meter walk (4MW), Timed Up and Go (TUG) single (ST) and dual task (DT), 360° turns in ST and DT, a doorway condition, and a personalized condition. Sensitivity was tested at baseline in 63 definite freezers. Test-retest reliability was evaluated over 5 weeks in 26 freezers.
Results:
Sensitivity and test-retest reliability were highest for 360° turns and higher in OFF than ON. Test-retest intra-class correlation coefficients of % TF varied between 0.63–0.90 in OFF and 0.18–0.87 in ON, and minimal detectable changes (MDCs) were high. The optimal protocol included TUG ST, 360° turns ST, 360° turns DT and a doorway condition, provoking FOG in all freezers in OFF and 91.9% in ON and this could be done reliably in 95.8% (OFF) and 84.0% (ON) of the sample. Combining OFF and ON further improved outcomes.
Conclusions:
The highest sensitivity and reliability was achieved with a multi-trigger protocol performed in OFF + ON. However, the high MDCs for % TF underscore the need for further optimization of FOG measurement.
Plain Language Summary
Freezing of gait is a very burdensome and episodic symptom in Parkinson’s disease that is difficult to measure. Measurement of freezing is needed to determine whether someone has freezing and how severe this is, and relies on observation during a freezing-triggering protocol. However, it is unclear what protocol is sufficiently sensitive to trigger freezing in many freezers, and whether freezing can be triggered reliably at different timepoints. Here, we investigated 1) which tasks can trigger freezing-presence and freezing-severity sensitively and reliably, 2) how medication state influences this, and 3) what task combination was most reliable. Sixty-three patients with daily freezing performed several freezing-triggering tasks in their homes, both with (ON) and without (OFF) anti-Parkinsonian medication. In twenty-six patients, the measurement was repeated 5 weeks later to determine test-retest reliability. First, we found that performing 360° turns in place with a cognitive dual task was the most sensitive and reliable task to trigger FOG. Second, sensitivity and reliability were better in OFF than in ON. Third, the most reliable protocol included: the Timed-Up and Go, 360° turns in place with and without the dual task, and a doorway condition. This protocol triggered freezing in all patients in OFF and 91.9% in ON and did so reliably in 95.8% (OFF) and 84.0% (ON) of the sample. We recommend to measure freezing with this protocol in OFF + ON, which further improved reliability. However, the measurement error for freezing-severity was high, even for this optimal protocol, underscoring the need for further optimization of freezing measurement.
INTRODUCTION
Freezing of gait (FOG) is a common and disabling gait disturbance in Parkinson’s disease (PD) that can be defined as “a brief, episodic absence or marked reduction of forward progression of the feet despite the intention to walk”.1 FOG is strongly associated with falls and impaired physical and mental health-related quality of life.2–4 To date, FOG remains a poorly understood symptom that is difficult to measure, obstructing therapeuticdevelopment.5,6
Typically, freezer-status (freezer/non-freezer) and FOG-severity are assessed using self-reported measures such as the New Freezing of Gait Questionnaire (NFOG-Q).7 However, such accounts are prone to recall bias and poor awareness,5,8,9 inducing a high risk of false negative classifications (seen in9–13). For example, in a large cohort of de novo patient who claimed not to have FOG (non-freezers), neurologists still observed FOG in 5.7% during walking and performing a 180° turn.12 Moreover, recent work showed that the NFOG-Q cannot detect small effects reliably because it has a high Minimal Detectable Change (MDC) (35.5% of the total score), questioning its usefulness as a primary endpoint of FOG-severity.8 As such, the field is moving towards adopting behavioral measures of FOG by having patients perform standardized tasks that include frequent triggers of FOG in daily life, such as turning, navigating doorways, and performing a dual task (DT).5,14–18 Subsequently, clinical experts perform video annotations of the FOG episodes provoked by these tasks, and calculate the percentage time frozen (% TF).19–21 At present, there is no consensus on which FOG-provoking protocol should be used to obtain reliable FOG-measures.6 The most sensitive task appears to be performing 360° turns with alternating directions,14,15,18,22 even though 360° turns did not elicit FOG in all self-reported freezers.14,22–24 Taking advantage of multiple FOG-triggers can further improve sensitivity to elicit FOG,9 but it is currently unclear what task combination is optimal. As people with FOG often report a specific situation where they are likely to freeze more often,25,26 the question arises whether adding a personalized task to the protocol in the patient’s home would improve sensitivity.
Another crucial aspect that, so far, received little research attention is how reliable various tasks are in eliciting FOG over time.27 Only Scully et al. found excellent reliability of a clinically rated FOG-scale, but with the test-retest only 30 minutes apart in a small sample of mild freezers.11 An investigation of test-retest reliability over time scales typically used in intervention studies is lacking.27 Finally, as FOG occurs less frequently with dopaminergic medication (ON) than without (OFF),15,28 it is important to examine whether test-retest reliability is influenced by this factor.
To address these questions, we investigated whether FOG can be provoked sensitively and reliably in different conditions,29 focusing on FOG-presence (binary) and FOG-severity (% TF). As this was tested in a large group of definite freezers, the % of patients with FOG-presence reflected the sensitivity (% true positive) to identify freezer-status. Our first objective was to investigate which tasks were most sensitive to elicit FOG at baseline and provided the best test-retest reliability over a 5-week period. Our second objective was to investigate how sensitivity and reliability changed depending on medication state. Finally, we set out to define the most reliable protocol for % TF. Overall, we expected that the most sensitive condition (360° turns in OFF-state14,15,18,22) would also show a more reliable FOG-response and that combining tasks would further improve sensitivity and reliability.9
MATERIALS AND METHODS
Design
This study is a secondary analysis performed on the dataset of the DeFOG trial: a randomized controlled trial (RCT) registered at clinicaltrials.gov (NCT03978507) and described in more detail elsewhere.29,30 The study included a pre-intervention (T1) and post-intervention (T2) assessment, performed 5 weeks apart in the patients’ homes. OFF and ON assessments were performed on the same day. Here, we focus on data from T1 in both arms of the study before randomization for sensitivity (sensitivity cohort), and from T1 and T2 in the control group for test-retest reliability (reliability cohort). The control group only received advice on daily step counts during the intervention period, designed and shown not to influence FOG-severity.30 Patients in the control group and assessors of FOG-severity were blind to group allocation.
Participants
Recruitment was performed in Tel Aviv Sourasky Medical Center (TASMC) and KU Leuven (KUL). Sixty-three patients performed T1, and 26 patients in the control group performed both T1 and T2. The most important inclusion criteria were: 1) a clinical diagnosis of PD,31 2) a modified Hoehn and Yahr stage between I-IV in ON,32,33 3) an age of 40–90 years, 4) the ability to walk 5 minutes (walking aid allowed), 5) a score > 16 on the short Mini-Mental State Examination,34 6) a medication schedule not foreseen to change within 6 weeks, and 7) daily self-reported FOG. Most important exclusion criteria were: 1) >1 fall per day, 2) inability to perform OFF tests, 3) no observed FOG at T1 (during or outside the protocol).29 All patients signed the informed consent form prior to participation, and the protocol was approved by ethical committees at both sites, conforming to the declarationof Helsinki.
Assessments
Both measurements started with the OFF assessment in the early morning to allow for overnight withdrawal of dopaminergic medication for at least 12 hours. This included a FOG-provoking protocol and the Movement Disorders Society-Unified Parkinson’s Disease Rating Scale (MDS-UPDRS) part III.35 About 1 hour after intake of the regular morning medication, the FOG-provoking protocol and MDS-UPDRS part III were repeated. In-between OFF and ON assessments, several questionnaires and clinical scales were administered, including demographics, the New Freezing of Gait Questionnaire (NFOG-Q), Montreal Cognitive Assessment (MoCA), and other parts of the MDS-UPDRS.29
The FOG-provoking protocol consisted of 5 gait tasks performed in a fixed order,29 two of which were performed in both single task (ST) and dual task (DT) conditions. For pragmatic reasons, most conditions were performed once. Rest was allowed in-between tasks if needed. During DT, participants performed a serial-3 subtraction while completing the gait task, using different starting numbers. All gait tasks were standardized for T1 and T2 and included:
1. Four Meter Walk (4MW), performed back and forth with 180° turn in-between (total 2x 5 m, accounting 0.5 m for each acceleration and deceleration, based on the gait speed test of the Short Physical Performance Battery);36
2. Timed-Up and Go (TUG) of 3 m, performed 2x in ST and 2x in DT;
3. Four alternating 360° turns within a 40×40 cm square in ST and DT. The task was cut short if the patient was unable to turn > 180° or could not overcome a FOG episode within 1 minute;
4. “Hotspot door” included walking towards, opening and passing a door(way) and turning in a narrow space;
5. “Personalized hotspot” included moving in a self-reported FOG-provoking situation in the home environment.
FOG annotation
The start and stop times of each task and FOG episode were rated by experienced assessors at each site using the software Elan,20,37 according to prespecified definitions (see29 and Supplementary Material 1). Raters were clinical experts and could thus not be blinded for DT or medication state, but they were blinded for group allocation. At TASMC, a single rater performed all annotations. At KUL, four raters were involved but all annotations were checked by one rater. Interrater reliability for absolute agreement between centers on the total % TF based on the intraclass correlation coefficient (ICC) (2,1) was good to excellent (ICC (95% CI) = 0.94 (0.78; 0.99)).30 FOG episodes predominantly characterized by a cessation of stepping (akinetic FOG) or by high-frequency oscillations in the legs (trembling FOG), as well as episodic festination were annotated separately and combined for the total % TF.29 Episodes in which FOG could not be distinguished from a voluntary stop with certainty were rated as “movement interruptions”29 and excluded from the primary outcomes, but separately investigated using a sensitivity analysis.
Outcome measures
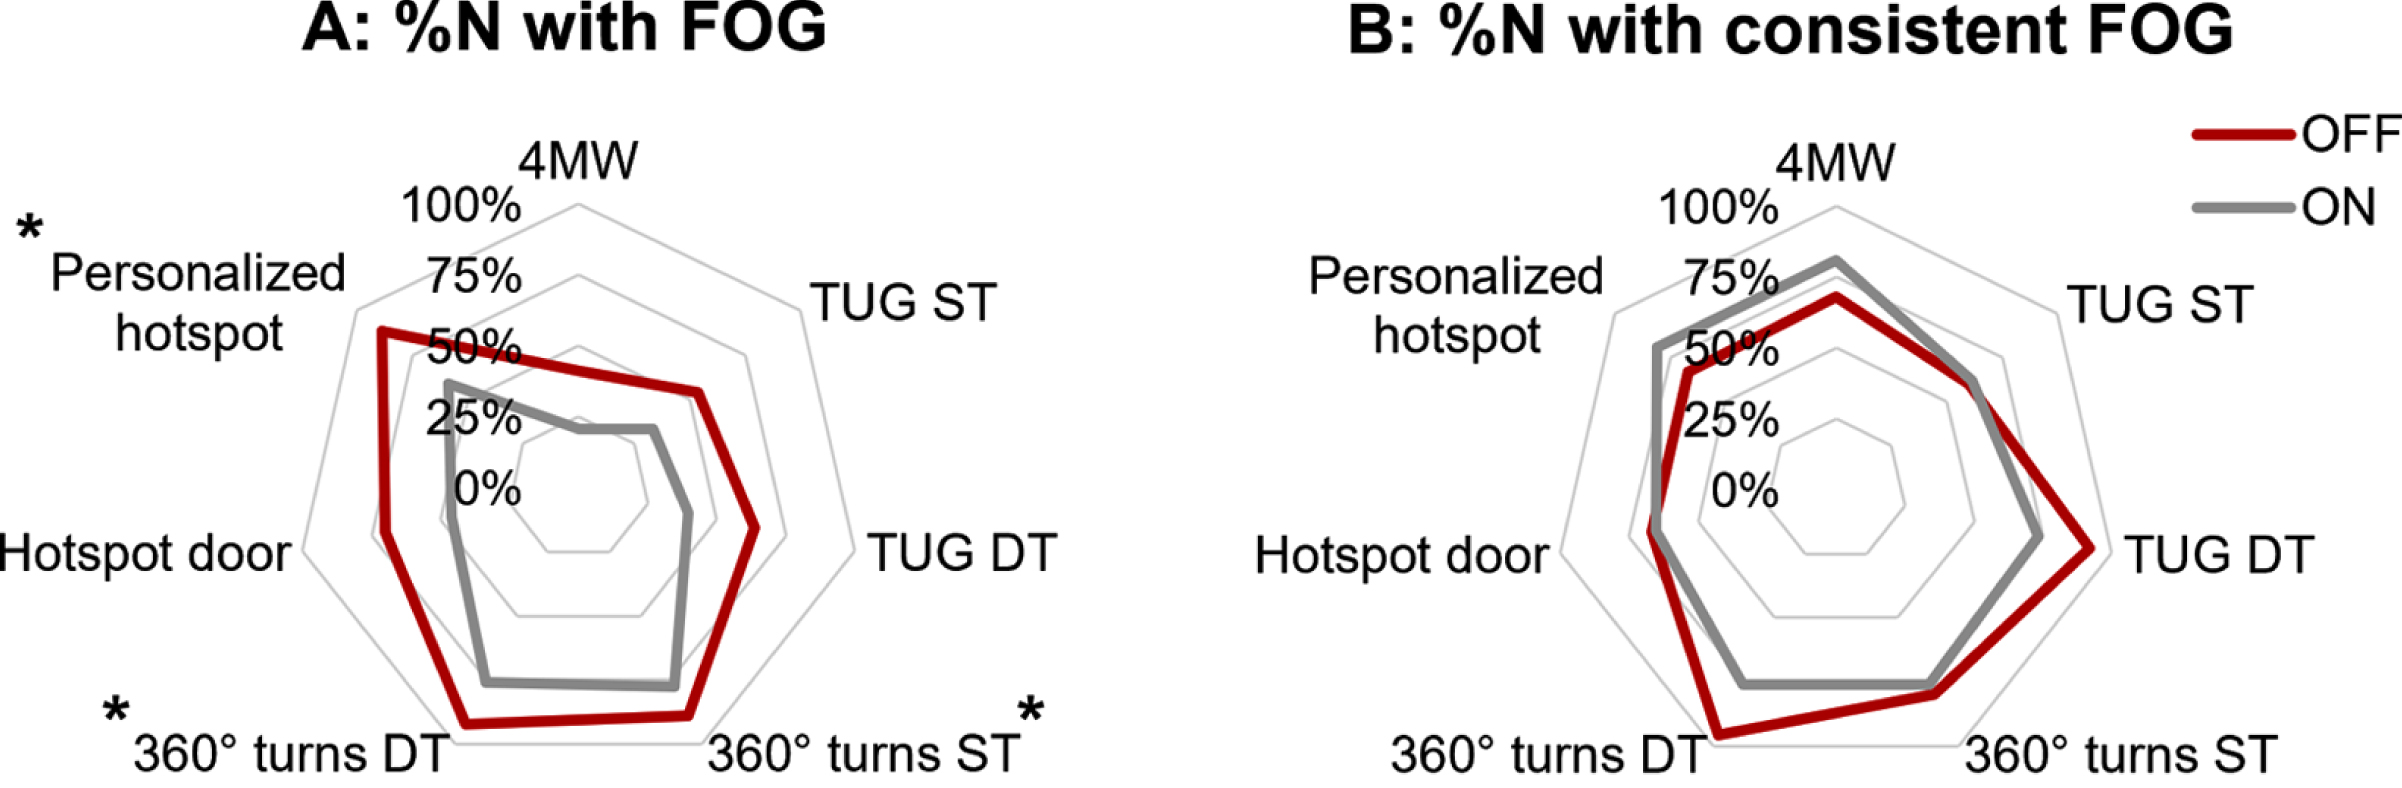
FOG-presence was a binarized metric based on the presence (= 1) or absence (= 0) of FOG in that task. We report this outcome as the percentage of freezers experiencing FOG during the condition (% N with FOG). FOG-severity for each task was calculated as % TF: the duration of FOG relative to the task duration expressed as a percentage. For investigating the reliability of these outcomes over time, we computed the binarized reliability of FOG-presence (0 if FOG-presence was unequal and 1 if it was equal at both timepoints) as well as the change in FOG-severity between timepoints (Δ % TF = % TFT2 - % TFT1). Reliability of FOG-presence is reported as the percentage of patients with consistent FOG between the two test sessions (% N with consistent FOG). We chose to include both positive and negative classes within this metric as a true measure of reliability.
Statistical analysis
Data processing was performed using Matlab, version R2020b (Mathworks, Natick, MA, USA). Statistical analyses were performed using Statistical Package for the Social Sciences, version 28 (IBM SPSS Statistics, Chicago, IL, USA) and SAS software, version 9.4 for Windows (SAS Institute Inc., Cary, NC, USA). Alpha was set at 0.05.
Comparison of tasks and medication states
Sensitivity (N = 63) and test-retest reliability (N = 26) of tasks were evaluated using Generalized Linear Mixed Models (GLMMs) for binary dependent variables (FOG-presence and reliability of FOG-presence) and with Linear Mixed Models (LMMs) for continuous variables (% TF and Δ% TF). Medication status, task, medication*task, and center were included as independent variables. For sensitivity of % TF, an inverse hyperbolic sine transformation was applied, which improved the distribution of the residuals. Model specification details are described in Supplementary Material 2. Models were fitted twice, once for OFF versus ON medication (primary), and once for OFF + ON versus OFF medication to evaluate the added value of testing in ON. Post-hoc tests were corrected with Tukey-Kramer adjustments, and absolute Cohen’s d effect sizes were calculated from the model F-tests and least square mean differences (d from t).38
We determined additional reliability outcomes for % TF (N = 26). First, two-way mixed model ICCs were calculated for % TF (T1 vs. T2) using absolute agreement and single measures. The ICC is considered a relative measure of agreement as it is a ratio of the within-subject and between-subject variability.39 As the ICC is known to be vulnerable to sample heterogeneity,39,40 we used absolute measures, such as Δ% TF, the standard error of measurement (SEM) and the minimal detectable change (MDC), to also describe the size of the individual errors.39 Bland-Altman plots were used to visualize Δ% TF in relation to % TF, and the SEM and MDC were determined using the following equations:
For interpretation of task comparisons, we computed a novel measure of the relative error to control for the fact that the absolute error is larger when the sensitivity is higher.40 The MDC index (N = 26) was calculated using the following equation: MDC index = (MDC % TF)/ (mean % TF). Values below 1 are preferred and show that the MDC is smaller than the mean % TF evoked by that task (i.e., suggesting more possibility to surpassthe MDC).
Task combinations
In order to define the most reliable as well as feasible protocol, we calculated the MDC index for all task combinations for up to four tasks. As multiple combinations might perform similarly, we evaluated how many times each task was included in the best 5% of task combinations, based on the lowest MDC index. Sensitivity and test-retest reliability were reported for the optimal task combination, and for all tasks combined. % TF of task combinations was determined by averaging % TF over the separate tasks. We also evaluated the reliability of the optimal task combination to detect medication effects on % TF (% TF OFF-ON) based on the MDC index.
RESULTS
Participants and baseline characteristics
Participant characteristics at T1 are shown in Table 1 for the sensitivity cohort (N = 63) and the reliability cohort (N = 26) separately. Typical for the freezer population, participants had a long disease duration (median (range) = 11 (2–30) years), marked severity of PD symptoms (mean (range) MDS-UPDRS part III, OFF = 44.4 (18–76), ON = 35.6 (10–62)), severe self-reported FOG (mean (range) NFOG-Q = 20.7 (11–28)), and many had mild cognitive impairment (median (range) MoCA = 25 (17–29)). At T1, the mean (SD) duration of the FOG-provoking protocol was 5.90 (3.04) minutes in OFF and 3.99 (2.01) minutes in ON (excluding breaks). Overall, the protocol elicited 1350 FOG episodes in OFF and 764 in ON. Three patients had worse FOG in ON than OFF (>10% increase in % TF total). Only one patient in the control group had a change in medication during the study period, and there was no change in the control group on the MDS-UPDRS (part III OFF and ON and total score) over time (ps > 0.4).
Table 1
Participant characteristics
| Descriptives | Sensitivity cohort | Reliability cohort |
| (N = 63) | (N = 26) | |
| Age (y) | 68.2 (7.61) | 68.3 (7.13) |
| Disease duration (y) * | 11.0 (9.00) | 13.0 (9.00) |
| Gender (Male/Female; %) | 44/19; 69.8% | 19/7; 73.1% |
| Presence of DBS (Yes/No; %) | 12/51; 19.0% | 5/21; 19.2% |
| MDS-UPDRS III, OFF (motor assessment; 0-132) | 44.4 (12.0) | 42.9 (10.1) |
| MDS-UPDRS III, ON (motor assessment; 0-132) | 35.6 (11.1) | 32.5 (10.6) |
| MDS-UPDRS total in ON (0 –260) | 76.2 (20.1) | 72.1 (20.0) |
| NFOG-Q (0-28) | 20.7 (3.94) | 21.3 (3.88) |
| LEDD (mg/day) * | 705 (625) | 800 (553) |
| MoCA (0 –30) * | 25.0 (4.00) | 25.5 (4.00) |
DBS, deep brain stimulator; MDS-UPDRS, Movement Disorders Society-Unified Parkinson’s disease Rating scale; OFF, >12 h withdrawal of dopaminergic medication; ON, 1 h after intake of dopaminergic medication; NFOG-Q, New Freezing of Gait Questionnaire; LEDD, Levodopa Equivalent Daily Dose; MoCA, Montreal Cognitive Assessment. Continuous values are presented as mean (SD); when marked by *: reported as median (interquartile range); Binary values are reported as frequencies and percentages.
Comparison of tasks and medication states
A complete overview of the main, interaction and post-hoc results of the models is provided in Supplementary Material 3.
FOG-presence
As shown in Table 2 and Fig. 1A, comparing OFF with ON, the % N with FOG varied from 20.6% to 92.1% across the tasks (d = 0.49, p < 0.001) and medication states (d = 0.70, p < 0.001; higher in OFF than ON). The % N with FOG was highest for 360° turns DT in OFF (92.1%), but not significantly different from 360° turns ST (88.9%) and the Personalized hotspot (88.7%) in OFF. Further, % N with FOG was similar between TUG ST, TUG DT and Hotspot door (54.0–69.8% in OFF), and was lowest for the 4MW (41.3% in OFF). More patients experienced FOG when pooling results for OFF + ON compared to OFF (d = 0.46, p < 0.001).
Table 2
Sensitivity and test-retest reliability for FOG-presence and FOG-severity, per condition
| 4MW | TUG ST | TUG DT | 360° turns ST | 360° turns DT | Hotspot door | Personalized | Optimal | All tasks | ||
| hotspot | protocol# | combined | ||||||||
| FOG-presence | ||||||||||
| % N with | OFF + ON | 44.4 | 60.3 | 66.7 | 95.2 | 95.2 | 82.5 | 95.2 | 100 | 100 |
| FOGa | OFF | 41.3 | 54.0 | 63.5 | 88.9 | 92.1 | 69.8 | 88.7 | 100 | 100 |
| ON | 20.6 | 33.3 | 39.7 | 77.4 | 75.8 | 46.0 | 58.7 | 91.9 | 93.5 | |
| % N with | OFF + ON | 72.0 | 68.0 | 92.0 | 87.5 | 95.7 | 66.7 | 75.0 | 95.7 | 95.7 |
| consistent | OFF | 68.0 | 60.0 | 92.0 | 80.0 | 95.8 | 66.7 | 66.7 | 95.8 | 95.8 |
| FOGb | ON | 80.8 | 61.5 | 73.1 | 76.0 | 76.0 | 65.4 | 80.8 | 84.0 | 88.0 |
| FOG-severity | ||||||||||
| % TFa, | OFF + ON | 4.96 (9.64) | 6.48 (9.76) | 9.78 (13.9) | 34.4 (28.6) | 38.6 (30.1) | 12.8 (13.6) | 12.9 (12.6) | 23.1 (17.6) | 16.6 (12.8) |
| mean (SD) | OFF | 6.83 (13.5) | 9.67 (15.2) | 14.8 (21.9) | 40.0 (34.1) | 46.2 (34.6) | 16.1 (17.8) | 19.2 (17.8) | 28.0 (20.8) | 21.4 (16.6) |
| ON | 3.09 (9.35) | 3.28 (6.89) | 4.71 (10.3) | 29.7 (31.1) | 31.8 (34.1) | 9.50 (15.9) | 6.67 (11.5) | 18.6 (19.3) | 12.7 (13.5) | |
| Δ % TFb, | OFF + ON | –1.29 (6.99) | 2.22 (7.31) | 1.43 (13.4) | –0.19 (13.0) | 0.90 (13.8) | –1.82 (11.4) | –0.83 (10.7) | 0.13 (5.84) | 0.09 (5.09) |
| mean (SD) | OFF | 1.30 (12.0) | 3.41 (10.2) | –0.90 (16.2) | –0.78 (17.9) | –0.78 (17.1) | –3.25 (20.1) | –1.93 (16.4) | –0.72 (8.26) | –0.44 (7.38) |
| ON | –3.72 (11.4) | 0.70 (9.10) | 3.75 (14.1) | 0.24 (17.4) | 1.14 (18.1) | –1.33 (8.08) | –0.11 (8.05) | 0.15 (8.23) | 0.07 (6.07) | |
| OFF + ON | 0.77 | 0.69 | 0.73 | 0.91 | 0.92 | 0.80 | 0.52 | 0.96 | 0.95 | |
| ICC % TFb, | (0.55; 0.89) | (0.41; 0.85) | (0.48; 0.87) | (0.80; 0.96) | (0.81; 0.96) | (0.59; 0.91) | (0.14; 0.76) | (0.90; 0.98) | (0.88; 0.98) | |
| Mean | OFF | 0.66 | 0.71 | 0.79 | 0.88 | 0.90 | 0.66 | 0.63 | 0.94 | 0.93 |
| (95% CI) | (0.36; 0.83) | (0.44; 0.86) | (0.58; 0.90) | (0.75; 0.95) | (0.78; 0.95) | (0.35; 0.84) | (0.32; 0.82) | (0.87; 0.97) | (0.84; 0.97) | |
| ON | 0.18 | 0.40 | 0.55 | 0.85 | 0.87 | 0.87 | 0.44 | 0.92 | 0.91 | |
| (-0.19; 0.51) | (0.02; 0.68) | (0.23; 0.77) | (0.68; 0.93) | (0.73; 0.94) | (0.73; 0.94) | (0.07; 0.71) | (0.82; 0.96) | (0.80; 0.96) | ||
| OFF + ON | 13.7 | 14.3 | 26.2 | 25.5 | 27.0 | 22.4 | 21.0 | 11.4 | 9.98 | |
| MDC % TFb | OFF | 23.6 | 20.0 | 31.8 | 35.0 | 33.5 | 39.4 | 32.1 | 16.2 | 14.5 |
| ON | 22.4 | 17.8 | 27.7 | 34.2 | 35.5 | 15.8 | 15.8 | 16.1 | 11.9 | |
| MDC index | OFF + ON | 2.25 | 2.35 | 2.53 | 0.73 | 0.69 | 1.52 | 1.80 | 0.48 | 0.57 |
| OFF | 3.04 | 2.20 | 1.92 | 0.81 | 0.68 | 1.97 | 1.75 | 0.53 | 0.62 | |
| ON | 5.06 | 5.73 | 6.66 | 1.18 | 1.18 | 1.68 | 3.12 | 0.90 | 0.97 |
4MW, Four meter walk; TUG, Timed-Up and Go; ST, single task; DT, dual task; FOG, freezing of gait; % N, percentage of people relative to the total; % TF, percentage time frozen; SD, standard deviation; OFF, >12 h withdrawal of dopaminergic medication; ON, 1 h after intake of dopaminergic medication; OFF + ON, average OFF and ON; Δ% TF, % TFT2 – % TFT1; ICC, intra-class correlation coefficient; CI, confidence interval; MDC, minimal detectable change; MDC index, MDC/mean % TF at T1. Outcomes are categorized as asingle timepoint (T1, N = 63), bcomparison between two timepoints (T1 vs. T2, N = 26). #optimal protocol (lowest MDC index) = TUG ST + 360° turns ST + 360° turns DT + Hotspot door.
Fig. 1
Sensitivity and test-retest reliability of FOG-presence. A: % N with FOG, and B: % N with consistent FOG, for different tasks in OFF (red) and ON (grey). A: 360° turns ST and DT and personalized hotspot elicited FOG in the highest percentage of definite freezers (p < 0.05, indicated by *) and OFF was more sensitive than ON medication state. B: DT conditions tended to be the most consistent tasks in OFF, but post-hoc tests were not significant after multiple-comparison correction. 4MW: 4 meter walk. TUG: Timed-Up and Go. ST: single task. DT: dual task. OFF: >12 h withdrawal of dopaminergic medication. ON: 1 h after intake of dopaminergic medication. % N: percentage of participants relative to the total.
Reliability of FOG-presence
The % N with consistent FOG varied from 60.0% to 95.8% between tasks in OFF (Table 2, Fig. 1B). Significant task differences were found (d = 0.12, p = 0.043), but there were no medication differences for OFF vs. ON (p = 0.317) or OFF + ON vs. OFF (p = 0.626). Post-hoc comparisons (model OFF vs. ON) showed that % N with consistent FOG at the two timepoints was higher in 360° turns DT and TUG DT compared to TUG ST and Hotspot door, but only without post-hoc correction (see Supplementary Table 5).
FOG-severity
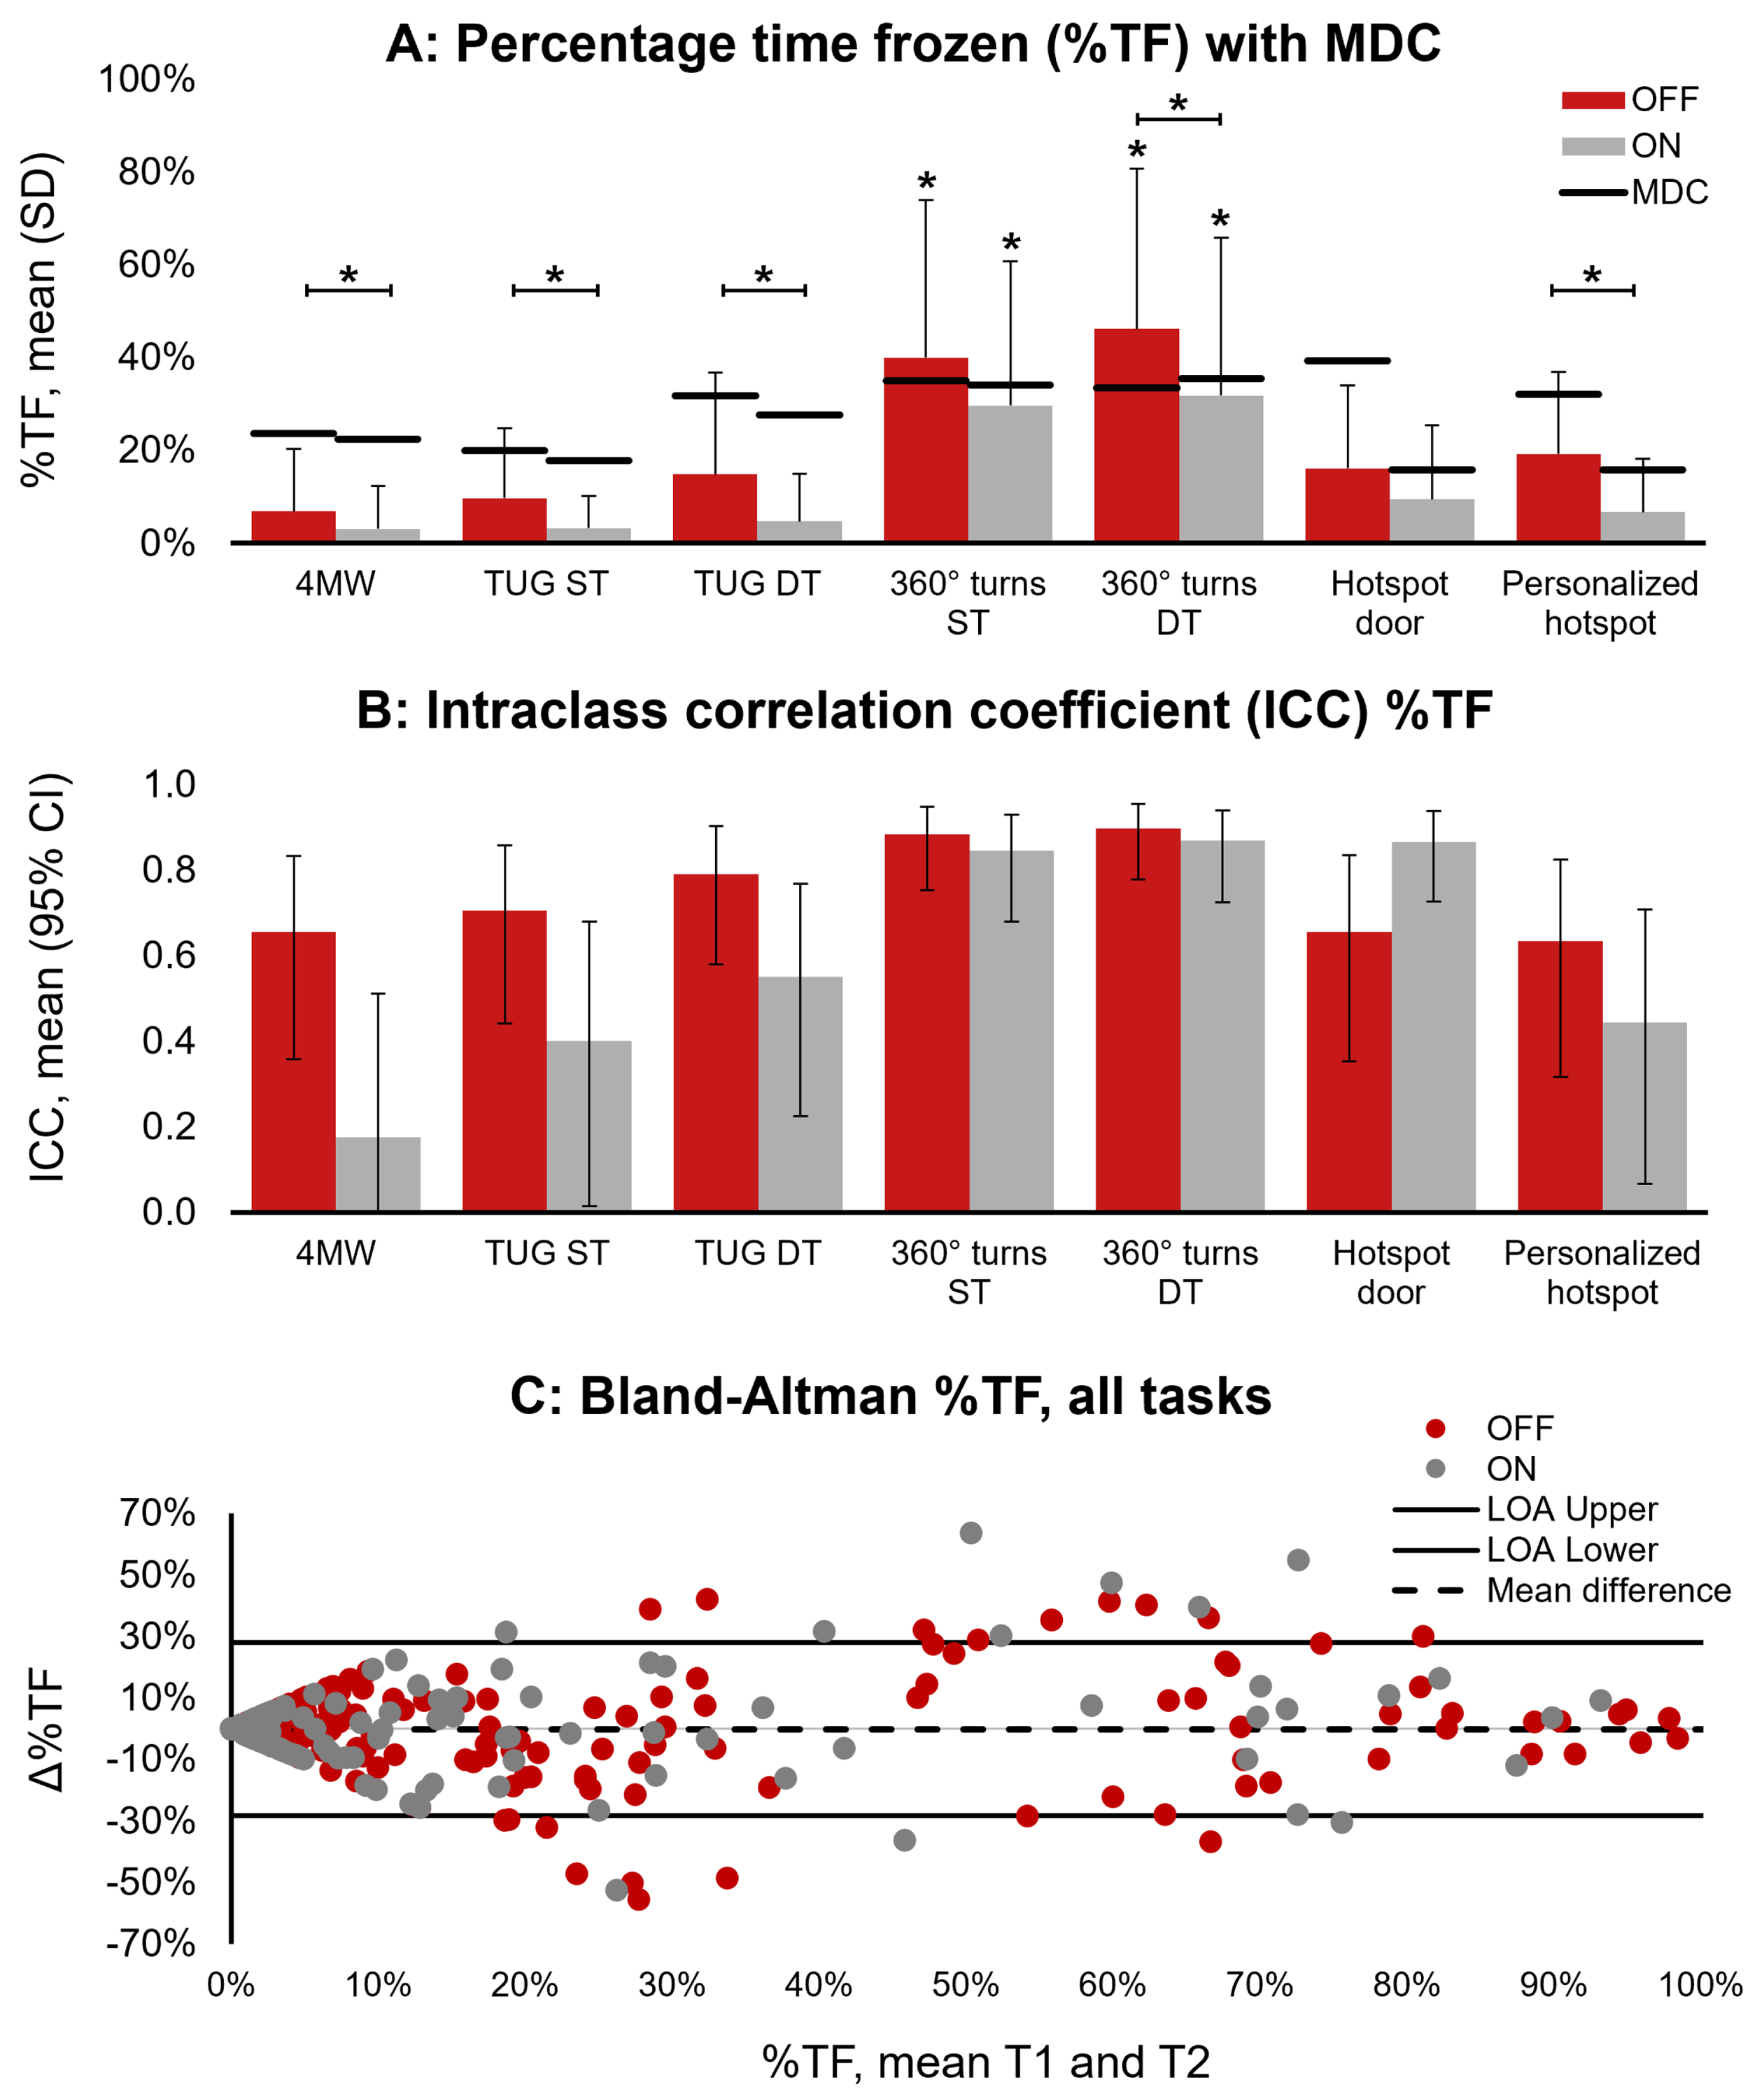
% TF is shown in Table 2 and Fig. 2A. Besides task (d = 0.67, p < 0.001) and medication effects (d = 0.74, p < 0.001), we found a medication*task effect (d = 0.20, p = 0.026). 360° turns ST and DT provoked the highest % TF in both OFF and ON (DT > ST, but not significant: p≥0.898). Both turning tasks were more sensitive than all other tasks, except that the Personalized hotspot was not significantly different from 360° turns ST in OFF (p = 0.286). Notably, there was no significant impact of medication on % TF for the Hotspot door (p = 0.111) and 360° turns ST (p = 0.632), which provoked moderate to severe FOG in both medication states. In contrast, medication improved % TF with a small effect size for the 4MW and 360° turns DT (ds < 0.5, ps≤0.032), and a medium effect size for the TUGs and Personalized hotspot (ds > 0.5, ps≤0.005). No differences were found in % TF between ST and DT, except for the TUG in OFF which was more sensitive in DT compared to ST when including movement interruptions (d = 0.47, p = 0.031). Overall, the impact of movement interruptions on % TF was very small (sensitivity analysis in Supplementary Material 4).
Fig. 2
Sensitivity and test-retest reliability of FOG-severity. A: % TF with MDC per task, B: ICC % TF per task, and C: Bland-Altman plot for % TF reliability over all tasks, in OFF (red) and ON (grey). A: 360° turns ST and DT in OFF and ON were significantly more sensitive than at least 4 other tasks (p < 0.05, indicated by *). Significant medication effects (p < 0.05, indicated by * with bar) were found for all tasks except 360° turns ST and Hotspot door. MDCs for all tasks were higher than the mean (reflecting MDC index), except for 360° turns ST and DT in OFF. B: ICCs varied across tasks and medication states. C: Bland-Altman plot for all tasks pooled (one dot per participant and task), showing higher reliability for the lowest and highest mean % TF. 4MW: 4 meter walk. TUG: Timed-Up and Go. ST: single task. DT: dual task. MDC: minimal detectable change. OFF: >12 h withdrawal of dopaminergic medication. ON: 1 h after intake of dopaminergic medication. CI: confidence interval. Δ% TF: % TFT2 – % TFT1. LOA: limit of agreement.
Reliability of FOG-severity
Δ% TF was close to zero on average but showed large between-subject variability. There were no differences between tasks (d = 0.20, p = 0.447) and medication states (d = 0.06, p = 0.782). In contrast, estimates of relative and absolute reliability varied widely depending on task and medication state. As for relative reliability, confidence limits of ICCs varied from poor (ICC < 0.5) to excellent (ICC > 0.9) (Table 2 and Fig. 2B). ICCs were generally higher in OFF than in ON, and in OFF + ON compared to OFF. Only 360° turns ST and DT had good ICCs in both OFF and ON. With regards to absolute reliability, the MDCs of % TF varied from 15.8% to 39.4% across tasks in OFF and ON. The MDC was lowest in OFF + ON, except for the hotspot conditions which had a lower MDC in ON. Notably, the MDC index was only below 1 for 360° turns ST (≤0.81) and DT (≤0.69) in OFF and OFF + ON (Table 2).
We present the Bland-Altman plot of % TF pooled for all tasks in Fig. 2C and plots of each task separately in Supplementary Material 5. Overall, the lower and upper limits of agreement (LOA) were –28.3% and 28.0%. Bland-Altman plots revealed no systematic error towards more FOG at one timepoint and showed the highest absolute reliability (smallest Δ% TF) for the very mild (% TF<20%) and very severe freezers (% TF>80%).
Task combinations
Combining multiple tasks improved (i.e., reduced) the MDC index, but the best combination varied per medication state (see Supplementary Material 6). The 4 tasks that were included most often in the top 5% combinations, were: TUG ST, 360° turns ST, 360° turns DT and Hotspot door, from now on together referred to as the “optimal protocol”. The mean (SD) duration of the optimal protocol was 3.48 (1.83) minutes in OFF and 2.48 (1.56) minutes in ON (excluding breaks, at T1). The optimal protocol elicited FOG in all freezers in OFF (consistently in 95.8%) and 91.9% of freezers in ON (consistently in 84.0%), as shown in Table 2. ICCs (95% CI) were good to excellent. The ICC and MDC index were even better in OFF + ON compared to both OFF and ON alone. In comparison to the optimal protocol, all tasks combined resulted in only a marginally higher % N with (consistent) FOG-presence, but worse MDC index values. For medication effects (% TF OFF-ON), the optimal protocol had an MDC index of 1.95 (for comparison of tasks and task combinations, see Supplementary Material 7).
DISCUSSION
In this study, we aimed to evaluate a behavioral protocol for measuring FOG delivered in a well-characterized group of 63 definite freezers in the home setting. We went beyond the state-of-the-art in investigating the sensitivity and test-retest reliability of various standardized FOG-provoking tasks OFF and ON medication. We assessed sensitivity and reliability for FOG-presence (% N with FOG or the % true positive classification of freezer-status) and for FOG-severity (% TF). First, our results corroborated previous work by showing that the 360° turns were the most FOG-provoking tasks.14,15,18 Additionally, the 360° turns under DT conditions had the highest sensitivity and relative reliability, supporting our hypothesis that the most sensitive conditions were also the most reliable. Second, while we found altogether a greater % N with FOG in OFF than in ON,15 we could also show for the first time that medication had a variable impact on FOG-severity depending on the task performed. Pooling the outcomes derived in OFF + ON improved several outcomes. Overall, we found poor MDCs for % TF for individual tasks. Therefore, for our third objective, we optimized the protocol and found that the optimal MDC index could be achieved when including the TUG ST, 360° turns ST, 360° turns DT and the Hotspot door.
We found that the choice of task impacted both the sensitivity and test-retest reliability for FOG-presence and FOG-severity. Only Δ% TF did not show task differences, possibly owing to a large within-subject variability across conditions. In line with previous work14 and our hypothesis, 360° turns DT showed the highest sensitivity and reliability. However, higher sensitivity did not always correspond to higher reliability. For instance, several tasks were consistent as they failed to elicit FOG at both timepoints (e.g., 4MW in ON) and Bland Altman plots showed highest reliability for very low as well as very high FOG-severity. Furthermore, the Personalized hotspot had high sensitivity yet a relatively low reliability for FOG-presence. Perhaps the selection of the FOG-hotspot was biased by recent experience or this task was more difficult to administer reliably. It is also plausible that patients had higher anticipation of FOG at their FOG-hotspot compared to other tasks and as a result had heightened attention and/or anxiety. This could have contributed to a more variable FOG response.41,42
Interestingly, the highest test-retest reliability of FOG-presence was found for TUG DT and 360° turns DT, and TUG DT also showed relatively good ICCs for % TF in OFF. We speculate that by focusing attention on the cognitive task, dual tasking counteracts the compensatory or interfering effects of attention,41,43 making the presence of FOG more consistent. However, differences between ST and DT were not significant. DT-effects might be larger when using a cognitive task that induces a more continuous cognitive load than the serial-3 subtraction task, such as the Auditory Stroop task.44 Significant DT-effects have previously been shown for sensitivity of FOG-severity14,45 but not yet for reliability.
Our second objective was to determine the impact of medication state on the outcomes and found that sensitivity was higher in OFF than in ON. As for test-retest reliability, we did not find medication effects on the % N with consistent FOG and Δ% TF, but ICCs and MDC index values were higher in OFF compared to ON. Combining OFF and ON improved sensitivity to evoke the presence of FOG compared to OFF, possibly due to the increase in the number of provocations or due to levodopa worsening FOG in some patients.9,46 Note that worse FOG-severity in ON compared to OFF was only found in 3 out of 63 patients (>10% increase in % TF for all tasks combined). Measuring in ON may also produce less valid outcomes, as a previous analysis on the same dataset (N = 28) showed positive associations of FOG-severity during free-living gait (sensor-based and self-report) with some FOG-provoking tasks in OFF but not in ON.47 These results highlight the need to test for FOG in OFF, and ideally in OFF + ON.
Furthermore, we found that the impact of medication on FOG-severity depended on the task. While medication intake reduced the % TF overall, TUG ST, TUG DT and Personalized hotspot were particularly responsive to medication. In contrast, 360° turns ST and Hotspot door were less responsive. Relatedly, the optimal protocol showed lower reliability to assess medication effects (see Supplementary Material 7). Therefore, studies aimed at determining patients’ responsiveness to medication46,48,49 may find stronger differences with a protocol optimized for that goal.
Overall, high sensitivity as well as high reliability for FOG-presence could be achieved by using only 1 task (360° turns DT in OFF or OFF + ON). However, results on test-retest reliability of FOG-severity were mixed. Mean Δ% TF was close to zero, reflecting no directional bias over time, but Bland-Altman plots showed wide limits of agreement. Further, relative and absolute reliability were differently impacted, as the most sensitive conditions (360° turns ST, 360° turns DT) showed better ICCs yet worse MDCs, and vice versa for the least sensitive conditions (4MW, TUG ST, TUG DT). Indeed, the MDC directly reflects the absolute within-subject error, which is expected to depend on the sensitivity40 (recall Fig. 2). Note that the ICC has been criticized for its dependence on the sample variance and limited generalizability.39,40 Therefore, we evaluated the MDC relative to sensitivity, which revealed that only 360° turns conditions in OFF and in OFF + ON had an MDC indexbelow 1.
Our third objective was to determine the optimal protocol, which in our sample comprised of TUG ST, 360° turns ST, 360° turns DT and Hotspot door. This optimal protocol had better outcomes compared to individual tasks and compared to all tasks combined, showing the importance of selecting appropriate tasks. The inclusion of TUG ST is rather surprising given that TUG DT had better sensitivity and reliability. We speculate that TUG DT may have provoked FOG in a similar way to 360° turns DT, thereby adding less unique information to the outcome compared to the TUG ST. Importantly, even for the optimal protocol, the MDC was still high, indicating that small-to-moderate intervention effects may not exceed the measurement error. However, it should be noted that we calculated the MDC based on the 95% CI, which some argue is too stringent.39,40
We emphasize the need for further optimization of FOG-measurement to improve the MDC and address the limitations of the current study. Generalizability of this study was limited by excluding freezers without daily FOG. Therefore, success of freezer-status identification likely reflected an overestimation compared to the general patient population. Test-retest reliability may have been affected by the limited sample size in the reliability cohort and the fixed order of conditions. For future reliability studies, we recommend using a counterbalanced or randomized order of conditions, also accounting for the possible effects of fatigue, and this in a large sample including both mild and severe freezers. Finally, our tasks did not include an anxiety or stress-provoking condition (limbic FOG-trigger).42
Future work should also examine sensitivity to change, either in response to an intervention or over a longer period of time to capture disease progression and to more fully assess the utility of these FOG-provoking tasks. One approach to reducing the variability in % TF over time may be to account for possible confounding factors such as disease progression, medication efficacy, sleep quality, cognition, anxiety, and fatigue, whether over shorter or longer timescales. Moreover, the clinically meaningful or important change of % TF is presently unknown and requires further investigation. This might not be evident from a patient perspective, which does not always correspond to clinician-ratings of change.50 Although a home protocol is likely to facilitate patient inclusion, reduce patient burden and limit dropout, our study raises the question whether performing these tasks in a lab environment would offer better reliability. Reliability of FOG might also be improved by implementing a fixed task duration. For example, the 360° turns used in this study consisted of 4 turns, which sometimes had a short duration for people with mild FOG, yet required a cut-off for feasibility in very severe freezers. Thus, using a 1-minute task could give mild freezers more opportunity to freeze, while eliminating the need for arbitrary cut-offs in severe freezers. Further, despite the excellent inter-rater reliability of % TF, some tasks and 360° turns in particular are very difficult and time-consuming to annotate. Work is currently ongoing to improve FOG-definitions,6,51 which may increase accuracy and possibly reliability of FOG-outcomes in future studies. Still, FOG-annotation is not straightforward to implement in clinical practice. Future studies may validate clinical rating scales based on this protocol against % TF, or take advantage of artificial intelligence to automatize FOG-annotation.52
Based on the present results, we recommend using TUG ST, 360° turns ST, 360° turns DT and Hotspot door as the optimal FOG-provoking protocol. Conducting measurement in OFF + ON is preferred as it provided the lowest MDC, despite adding burden to study resources and patients. This protocol was feasible in severe freezers when performed at home. Note that very mild freezers may not show FOG even during a highly sensitive protocol. Therefore, visual observation of FOG-presence during the FOG-provoking protocol is best utilized to increase specificity of self-reported freezer-status, rather than to replace it.53 In conclusion, we have taken an important step towards the improvement of FOG-assessment by determining the test-retest reliability of various FOG-provoking tasks in OFF and ON and providing specific recommendations. However, the high MDC underscores the need for further developments to achieve FOG outcomes that are sufficiently responsive to intervention effects.
ACKNOWLEDGMENTS
We would like to express our gratitude to the study participants.
FUNDING
This research was funded by the Michael J. Fox Foundation (Grant ID = 16347). The Michael J. Fox Foundation did not have a role in data collection, analyses, interpretation of the data, or in the decision to submit results. MG1 and ND receive a fellowship from the Research Foundation – Flanders (FWO), grant numbers 1SHEK24N and 12B1K24N respectively. JH, AN and PG are supported in part by the Mobilise-D project. The Mobilise-D project received funding from the Innovative Medicines Initiative 2 Joint Undertaking (JU) under grant agreement No. 820820. This JU receives support from the European Union’s Horizon 2020 research and innovation program and the European Federation of Pharmaceutical Industries and Associations (EFPIA). Content in this publication reflects the authors’ view and neither IMI nor the European Union, EFPIA, or any Associated Partners are responsible for any use that may be made of the information contained herein.
CONFLICT OF INTEREST
All authors declare that they have no competing interests. AN is an Editorial Board member of this journal, but was not involved in the peer-review process of this article nor had access to any information regarding its peer review.
DATA AVAILABILITY
The data supporting the findings of this study are available on request from the corresponding author.
SUPPLEMENTARY MATERIAL
[1] The supplementary material is available in the electronic version of this article: https://dx.doi.org/10.3233/JPD-240134.
REFERENCES
1. | Nutt JG , Bloem BR , Giladi N , et al. Freezing of gait: Moving forward on a mysterious clinical phenomenon. Lancet Neurol (2011) ; 10: : 734–744. |
2. | Okuma Y . Freezing of gait and falls in Parkinson’s disease. J Parkinsons Dis (2014) ; 4: : 255–260. |
3. | Tan DM , McGinley JL , Danoudis ME , et al. Freezing of gait and activity limitations in people with parkinson’s disease. Arch Phys Med Rehabil (2011) ; 92: : 1159–1165. |
4. | Walton CC , Shine JM , Hall JM , et al. The major impact of freezing of gait on quality of life in Parkinson’s disease. J Neurol (2015) ; 262: : 108–115. |
5. | Mancini M , Bloem BR , Horak FB , et al. Clinical and methodological challenges for assessing freezing of gait: Future perspectives. Mov Disord (2019) ; 34: : 783–790. |
6. | Lewis S , Factor S , Giladi N , et al. Stepping up to meet the challenge of freezing of gait in Parkinson’s disease. Transl Neurodegener (2022) ; 11: : 23. |
7. | Nieuwboer A , Rochester L , Herman T , et al. Reliability of the new freezing of gait questionnaire: Agreement between patients with Parkinson’s disease and their carers. Gait Posture (2009) ; 30: : 459–463. |
8. | Hulzinga F , Nieuwboer A , Dijkstra BW , et al. The new freezing of gait questionnaire: unsuitable as an outcome in clinical trials? Mov Disord Clin Pract (2020) ; 7: : 199–205. |
9. | Snijders AH , Haaxma CA , Hagen YJ , et al. Freezer or non-freezer: Clinical assessment of freezing of gait. Parkinsonism Relat Disord (2012) ; 18: : 149–154. |
10. | Mancini M , Hasegawa N , Peterson DS , et al. Digital measures of freezing of gait across the spectrum of normal, non-freezers, possible freezers and definite freezers. J Neurol (2023) ; 270: : 4309–4317. |
11. | Scully AE , Tan D , Oliveira BIR de , et al. Scoring festination and gait freezing in people with Parkinson’s: The freezing of gait severity tool-revised. Physiother Res Int (2023) ; 28: : e2016. |
12. | Kim R , Lee J , Kim Y , et al. Presynaptic striatal dopaminergic depletion predicts the later development of freezing of gait in de novo Parkinson’s disease: An analysis of the PPMI cohort. Parkinsonism Relat Disord (2018) ; 51: : 49–54. |
13. | Snijders AH , Weerdesteyn V , Hagen YJ , et al. Obstacle avoidance to elicit freezing of gait during treadmill walking. Mov Disord (2010) ; 25: : 57–63. |
14. | D’Cruz N , Seuthe J , De Somer C , et al. Dual task turning in place: a reliable, valid, and responsive outcome measure of freezing of gait. Mov Disord (2022) ; 37: : 269–278. |
15. | Schaafsma JD , Balash Y , Gurevich T , et al. Characterization of freezing of gait subtypes and the response of each to levodopa in Parkinson’s disease. Eur J Neurol (2003) ; 10: : 391–398. |
16. | Almeida QJ and Lebold CA . Freezing of gait in Parkinson’s disease: A perceptual cause for a motor impairment? J Neurol Neurosurg Psychiatry (2010) ; 81: : 513–518. |
17. | Ziegler K , Schroeteler F , Ceballos-Baumann AO , et al. A new rating instrument to assess festination and freezing gait in Parkinsonian patients. Mov Disord (2010) ; 25: : 1012–1018. |
18. | Conde CI , Lang C , Baumann CR , et al. Triggers for freezing of gait in individuals with Parkinson’s disease: a systematic review. Front Neurol (2023) ; 14: : 1326300. |
19. | Morris TR , Cho C , Dilda V , et al. A comparison of clinical and objective measures of freezing of gait in Parkinson’s disease. Parkinsonism Relat Disord (2012) ; 18: : 572–577. |
20. | Gilat M . How to annotate freezing of gait from video: a standardized method using open-source software. J Parkinsons Dis (2019) ; 9: : 821–824. |
21. | Shine JM , Moore ST , Bolitho SJ , et al. Assessing the utility of freezing of gait questionnaires in Parkinson’s disease. Parkinsonism Relat Disord (2012) ; 18: : 25–29. |
22. | Van Dijsseldonk K , Wang Y , Van Wezel R , et al. Provoking freezing of gait in clinical practice: Turning in place is more effective than stepping in place. J Parkinsons Dis (2018) ; 8: : 363–365. |
23. | Mancini M , Smulders K , Cohen RG , et al. The clinical significance of freezing while turning in Parkinson’s disease. Neuroscience (2017) ; 343: : 222–228. |
24. | Bertoli M , Croce U Della , Cereatti A , et al. Objective measures to investigate turning impairments and freezing of gait in people with Parkinson’s disease. Gait Posture (2019) ; 74: : 187–193. |
25. | Ehgoetz Martens KA , Shine JM , Walton CC , et al. Evidence for subtypes of freezing of gait in Parkinson’s disease. Mov Disord (2018) ; 33: : 1174–1178. |
26. | Rahman S , Griffin HJ , Quinn NP , et al. The factors that induce or overcome freezing of gait in Parkinson’s disease. Behav Neurol (2008) ; 19: : 127–136. |
27. | Scully AE , Hill KD , Tan D , et al. Measurement properties of assessments of freezing of gait severity in people with Parkinson disease: a COSMIN review. Phys Ther (2021) ; 101: : 1–12. |
28. | Nonnekes J , Snijders AH , Nutt JG , et al. Freezing of gait: A practical approach to management. Lancet Neurol (2015) ; 14: : 768–778. |
29. | Zoetewei D , Herman T , Brozgol M , et al. Protocol for the DeFOG trial: A randomized controlled trial on the effects of smartphone-based, on-demand cueing for freezing of gait in Parkinson’s disease. Contemp Clin Trials Commun (2021) ; 24: : 100817. |
30. | Zoetewei D , Herman T , Ginis P , et al. On-demand cueing for freezing of gait in Parkinson’s disease: a randomized controlled trial. Mov Disord (2024) ; 39: : 876–886. |
31. | Hughes AJ , Daniel SE , Kilford L , et al. Accuracy of clinical diagnosis of idiopathic Parkinson’s disease: A clinico-pathological study of 100 cases. J Neurol Neurosurg Psychiatry (1992) ; 55: : 181–184. |
32. | Hoehn MM and Yahr MD . Parkinsonism: onset, progression, and mortality. Neurology (1967) ; 17: : 427–442. |
33. | Jankovic J , McDermott M , Carter J , Gauthier S , Goetz C , Golbe L , Huber S , Koller W , Olanow C and Shoulson I . Variable expression of Parkinson’s disease: A base-line analysis of the DATATOP cohort. The Parkinson Study GrouNeurology (1990) ; 40: : 1529–1534. |
34. | Newkirk LA , Kim JM , Thompson JM , et al. Validation of a 26-point telephone version of the mini-mental state examination. J Geriatr Psychiatry Neurol (2004) ; 17: : 81–87. |
35. | Goetz CG , Tilley BC , Shaftman SR , et al. Movement Disorder Society-Sponsored Revision of the Unified Parkinson’s Disease Rating Scale (MDS-UPDRS): Scale presentation and clinimetric testing results. Mov Disord (2008) ; 23: : 2129–2170. |
36. | Guralnik JM , Simonsick EM , Ferrucci L , et al. A short physical performance battery assessing lower extremity function: association with self-reported disability and prediction of mortality and nursing home admission. J Gerontol (1994) ; 49: : M85–M94. |
37. | ELAN (version 5.5), https://archive.mpi.nl/tla/elan (2019). |
38. | Lakens D . Calculating and reporting effect sizes to facilitate cumulative science: A practical primer for t-tests and ANOVAs. Front Psychol (2013) ; 4: : 863. |
39. | Šerbetar I . Establishing some measures of absolute and relative reliability of a motor tests. Croat J Educ (2015) ; 17: : 37–48. |
40. | Hopkins WG . Measures of reliability in sports medicine and science. Sport Med (2000) ; 30: : 375–381. |
41. | Peterson DS , King LA , Cohen RG , et al. Cognitive contributions to freezing of gait in Parkinson disease: implications for physical rehabilitation. Phys Ther (2016) ; 96: : 659–670. |
42. | Ehgoetz Martens KA , Ellard CG and Almeida QJ . Does anxiety cause freezing of gait in Parkinson’s disease? PLoS One (2014) ; 9: : e106561. |
43. | Ehgoetz Martens KA , Peterson DS , Almeida QJ , et al. Behavioural manifestations and associated non-motor features of freezing of gait: A narrative review and theoretical framework. Neurosci Biobehav Rev (2020) ; 116: : 350–364. |
44. | Kestens K , Degeest S , Miatton M , et al. An auditory stroop test to implement in cognitive hearing sciences: Development and normative data. Int J Psychol Res (2021) ; 14: : 37–51. |
45. | Spildooren J , Vercruysse S , Desloovere K , et al. Freezing of gait in Parkinson’s disease: The impact of dual-tasking and turning. Mov Disord (2010) ; 25: : 2563–2570. |
46. | Espay AJ , Fasano A , Van Nuenen BFL , et al. ‘On’ state freezing of gait in Parkinson disease: A paradoxical levodopa-induced complication. Neurology (2012) ; 78: : 454–457. |
47. | Denk D , Herman T , Zoetewei D , et al. Daily-living freezing of gait as quantified using wearables in people with Parkinson disease: comparison with self-report and provocation tests. Phys Ther (2022) ; 102: : pzac129. |
48. | Amboni M , Stocchi F , Abbruzzese G , et al. Prevalence and associated features of self-reported freezing of gait in Parkinson disease: The DEEP FOG study. Parkinsonism Relat Disord (2015) ; 21: : 644–649. |
49. | Landes RD , Glover A , Pillai L , et al. Levodopa ONOFF-state freezing of gait: Defining the gait and non-motor phenotype. PLoS One (2022) ; 17: : e0269227. |
50. | Fietzek UM , Schulz SJ , Ziegler K , et al. The minimal clinically relevant change of the FOG score. J Parkinsons Dis (2020) ; 10: : 325–332. |
51. | Iansek R and Danoudis M . Freezing of gait in Parkinson’s disease: its pathophysiology and pragmatic approaches to management. Mov Disord Clin Pract (2017) ; 4: : 290–297. |
52. | Yang PK , Filtjens B , Ginis P , et al. Freezing of gait assessment with inertial measurement units and deep learning: effect of tasks, medication states, and stops. J Neuroeng Rehabil (2024) ; 21: : 24. |
53. | Mahabier SW , Snijders AH , Delval A , et al. Freezing of gait. In: Kompoliti K, Verhagen Metman L (eds) Encyclopedia of Movement Disorders. Oxford: Academic Press (2010) ;486–491. |


