
Prospective Study of Lung Function with Prodromal, Clinical Parkinson’s Disease, and Mortality
Abstract
Background:
The association of lung function with the risk of developing prodromal and clinical-diagnosed Parkinson’s disease (PD) and with the risk of mortality among individuals with PD remains unknown.
Objective:
To prospectively examine the associations of lung function with the risk of prodromal, clinical-diagnosed PD, and PD-related mortality in participants of the UK Biobank.
Methods:
Included were 452,518 participants free of PD at baseline. Baseline lung function, including forced expiratory volume in 1-s (FEV1), forced vital capacity (FVC), peak expiratory flow (PEF), and FEV1/FVC ratio, was assessed. Eight prodromal features were measured using self-reported diagnoses, hospital admission, and primary care data. Incident PD cases were identified using linkages with hospital admission, death register, and self-report. Vital status and date of death were provided by the UK National Health Service (NHS) and the NHS Central Register. We used Cox proportional hazard models to evaluate these associations.
Results:
Poor lung function was associated with higher risk of PD in a dose-response relationship: the adjusted hazard ratio comparing the lowest vs. the highest lung function quintile was 1.18 (95% CI, 1.02– 1.37) for FEV1, 1.14 (95% CI, 0.99– 1.29) for FVC, and 1.23 (95% CI, 1.08– 1.41) for PEF (p-trend <0.05 for all). Similar results were obtained for risk of prodromal PD and mortality among individuals with PD.
Conclusions:
The current study showed that individuals with poor lung function had a high future risk of prodromal and clinical PD and a higher rate of PD-related mortality.
INTRODUCTION
Parkinson’s disease (PD) is a progressive neurodegenerative disease, characterized by the presence of movement disorders, such as tremor, rigidity, and bradykinesia.1,2 Interestingly, individuals with PD have been observed to have high prevalence of respiratory abnormalities.3,4 A systematic review including 39 case-control studies summarized that strong evidence supported a restrictive pattern with inspiratory muscle weakness in PD compared with health controls.5 However, most previous studies mainly focused on the prevalence of respiratory abnormalities and the decline in lung function among individuals with PD. Whether poor lung function is associated with subsequent onset of prodromal and clinical PD remains needed to be studied in large– scale prospective studies. In addition, respiratory dysfunctions may be responsible for the mortality associated with PD.6 However, little is known regarding the long-term role of lung function in survival among individuals with PD.
Therefore, we prospectively examined the associations of lung function, as assessed by forced vital capacity (FVC), forced expiratory volume in 1 s (FEV1), peak expiratory flow (PEF), and FEV1/FVC ratio, with risk of prodromal and clinical PD among approximately 450,000 adults without PD at the baseline, and with risk of mortality among approximately 3,000 individuals with PD.
MATERIALS AND METHODS
Study population
The current analyses were based on a population– based prospective cohort study– the UK Biobank, which started from 2006 to 2010 with more than 500,000 participants aged 40– 69 years. Participants attended one of 22 assessment centers across England, Wales, and Scotland, where they completed a self-administered, touchscreen questionnaire, and face-to-face interview to collect information on their lifestyle, health characteristics, and socioeconomic characteristics, and trained research staff assessed their physical measurements and obtained blood samples. The UK Biobank obtained ethical approvals from the National Information Governance Board for Health and Social Care and National Health Service North West Multicenter Research Ethics Committee. All participants provided signed informed consent. Details of the UK Biobank were presented previously.7,8
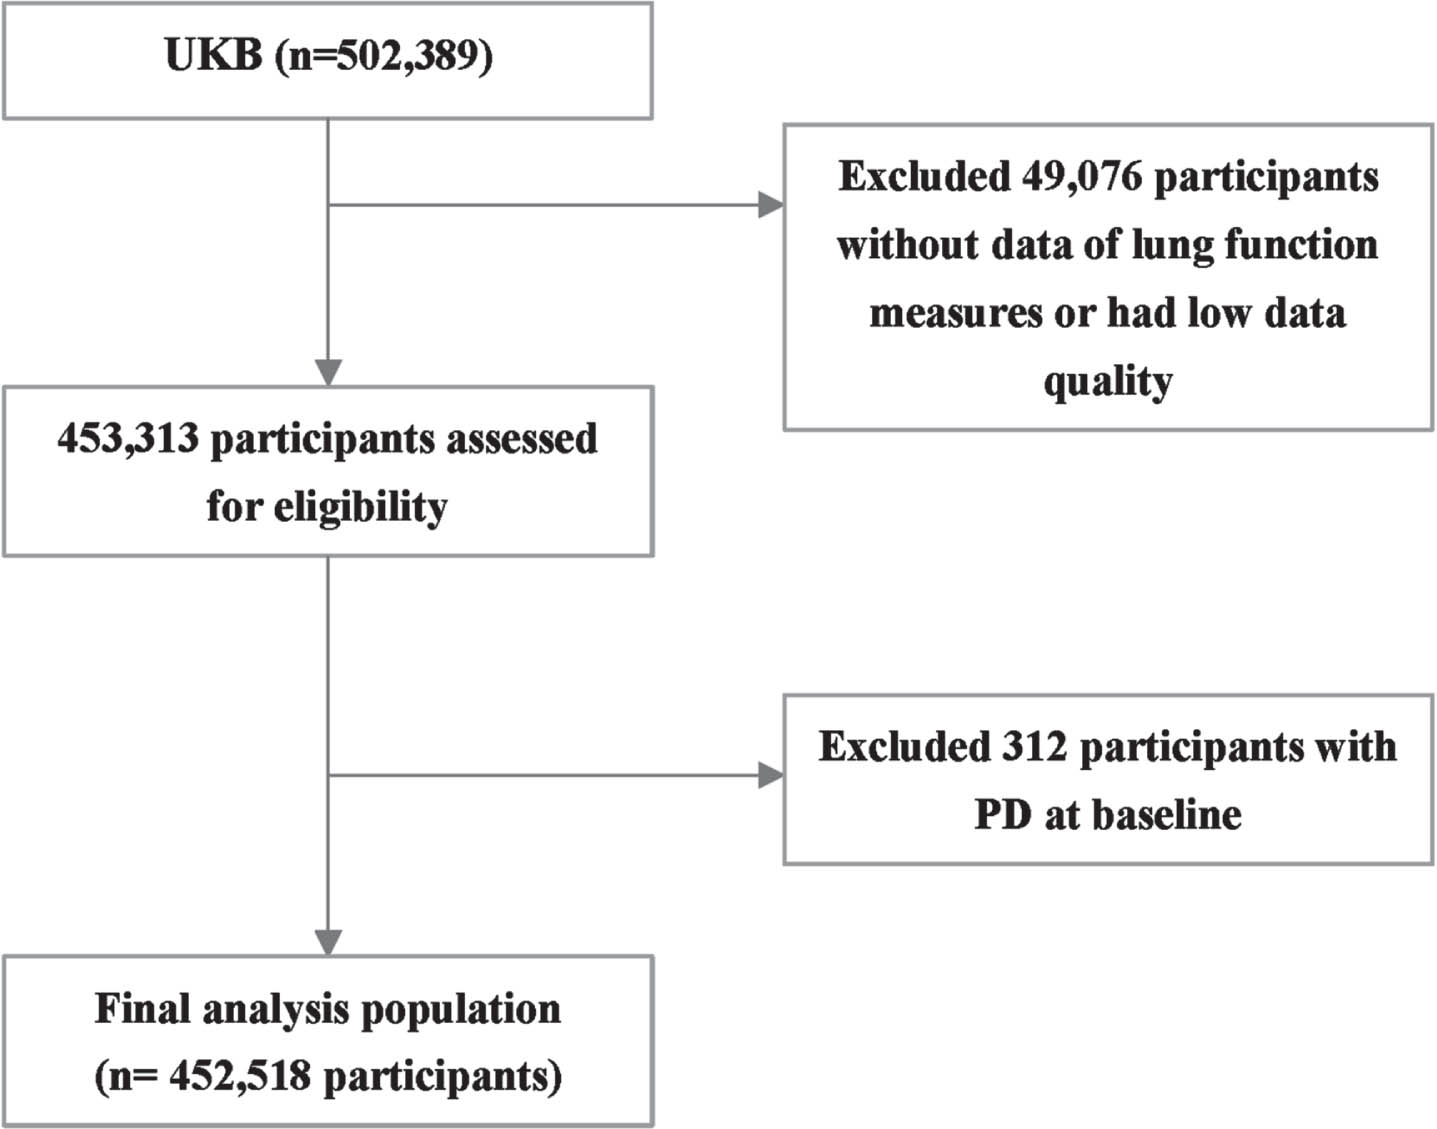
For this study, we first included 452,518 participants free of clinical PD and who received spirometry tests at baseline to assess the associations between lung function and risk of developing PD (Fig. 1). Moreover, we excluded 2,111 participants with ≥3 prodromal PD features at baseline to assess the association between lung function and risk of prodromal PD. Among participants who were newly diagnosed with clinical PD during the followed-up until October 31, 2022, in England, February 28, 2018, in Wales, and July 31, 2021, in Scotland, we further investigated the association between baseline lung function and mortality.
Fig. 1
Flow chart of the study population.
Assessment of lung function
Participants were asked to assess lung function by nurses or healthcare technicians trained in spirometry following a standard protocol and using a spirometer (Pneumotrac 6800; Vitalograph, Buckingham, UK).9,10 Participants did not perform spirometry if they answered “yes” to or were unsure of the following: chest infection in the last month (i.e., influenza, bronchitis, severe cold, or pneumonia); history of detached retina; heart attack or surgery to eyes, chest or abdomen in last three months; history of collapsed lung; pregnancy (first or third trimester); and currently on medication for tuberculosis.9 FEV1 (the volume of air exhaled with force for the first second following a maximal inhalation), FVC (the maximum amount of air that can be exhaled after a maximum inhalation), and PEF (the maximum speed of expiration) from two to three blows within a period of about six min were recorded.11 The spirometer software compared the acceptability of the first two blows and, if acceptable difference (defined as a ≤5% difference in FVC and FEV1), indicated to the fieldworkers that the third blow was not required.9 Preserved ratio impaired spirometry (PRISm), a newly accepted precursor of COPD, has been deemed to indicate the risk of progressive lung function abnormalities and death.12 The maximum FEV1 and FVC for each participant were selected and used to derive FEV1/FVC ratio.
Ascertainment of prodromal PD features
Based on the review of the relevant literature, eight prodromal features were included in the outcome assessment: depression, rapid eye movement (REM) sleep behavior disorder (RBD), urinary incontinence, erectile dysfunction (measured in men only), constipation, anxiety, orthostatic hypotension, and hyposmia.13–15 These features were derived from the International Classification of Diseases and Related Health Problems tenth revision (ICD-10) and ninth revision (ICD-9) in the hospital inpatient data (fields 41270 and 41271), self-reported medical conditions (field 20002), and primary care data including (field 42040) using read codes (version 2 and 3) respective to the ICD-10 codes as mapped through the TRUD NHS Read browser. These features reported before a PD diagnosis were defined as prodromal PD features. Details of the definition were presented in Supplementary Table 1.
Table 1
Baseline characteristics of participants in the UK Biobank study (n = 452,518)
| Total | Lung function | ||||||
| (n = 452,518) | FEV1 | FVC | PEF | ||||
| Q1 | Q5 | Q1 | Q5 | Q1 | Q5 | ||
| Sex (n, %) | |||||||
| Men | 204,435 (45.2%) | 40,716 (44.8%) | 40,908 (45.4%) | 40,600 (44.7%) | 41,009 (45.3%) | 41,134 (45.3%) | 41,097 (45.2%) |
| Age (y) (mean±SD) | 56.4 (±8.10) | 60.8 (±6.81) | 50.7 (±7.25) | 60.4 (±7.05) | 51.0 (±7.61) | 59.8 (±7.31) | 52.4 (±7.73) |
| Race (n, %) | |||||||
| White British | 399,223 (88.6%) | 73,902 (81.8%) | 82,230 (91.4%) | 72,696 (80.5%) | 82,570 (91.5%) | 76,688 (85.0%) | 81,369 (89.8%) |
| Non– white British | 51,647 (11.5%) | 16,466 (18.2%) | 7,707 (8.57%) | 17,586 (19.5%) | 7,672 (8.50%) | 13,566 (15.0%) | 9,278 (20.2%) |
| Missing | 1,648 | 491 | 220 | 507 | 228 | 462 | 272 |
| Education level (n, %) | |||||||
| High (college or university degree) | 148,169 (39.8%) | 20,669 (33.0%) | 38,594 (46.0%) | 20,983 (33.0%) | 38,044 (45.8%) | 21,325 (33.6%) | 37,567 (45.1%) |
| Intermediate (A/AS levels or equivalent, | 147,061 (39.5%) | 25,672 (41.0%) | 31,807 (37.9%) | 25,933 (40.8%) | 31,348 (37.8%) | 26,337 (41.5%) | 31,424 (37.7%) |
| O levels/GCSEs or equivalent) | |||||||
| Low (none of the aforementioned) | 77,291 (20.8%) | 16,229 (25.9%) | 13,500 (16.1%) | 16,658 (26.2%) | 13,602 (16.4%) | 15,808 (24.9%) | 14,323 (17.2%) |
| Missing | 79,997 | 28,289 | 6,256 | 27,215 | 7,476 | 27,246 | 7,605 |
| Socioeconomic status (n, %) | |||||||
| The least deprived | 90,384 (20.0%) | 14,727 (16.2%) | 19,404 (21.6%) | 14,987 (16.5%) | 19,327 (21.4%) | 14,751 (16.3%) | 20,029 (22.1%) |
| Smoking status (n, %) | |||||||
| Current | 46,030 (10.2%) | 13,088 (14.5%) | 7,695 (8.56%) | 10,783 (12.0%) | 8,807 (9.76%) | 14,043 (15.6%) | 7,202 (7.94%) |
| Past | 154,697 (34.4%) | 33,306 (37.0%) | 27,892 (31.0%) | 32,114 (35.7%) | 28,726 (31.8%) | 30,555 (34.0%) | 30,940 (34.1%) |
| Never | 249,589 (55.4%) | 43,614 (48.5%) | 54,325 (60.4%) | 47,071 (52.3%) | 52,682 (58.4%) | 45,370 (50.4%) | 52,519 (57.9%) |
| Missing | 2,202 | 851 | 245 | 821 | 255 | 748 | 258 |
| Alcohol use (n, %) | |||||||
| Never | 35,465 (7.85%) | 11,868 (13.3%) | 4,346 (4.83%) | 12145 (13.4%) | 4602 (5.09%) | 10661 (11.8%) | 4877 (5.37%) |
| Daily or almost daily | 91,932 (20.4%) | 17,014 (18.8%) | 18,081 (20.1%) | 15,848 (17.5%) | 18,769 (20.8%) | 17,404 (19.3%) | 18,672 (20.6%) |
| 3– 4 times a week | 105,119 (23.3%) | 16,654 (18.4%) | 24,139 (26.8%) | 16,413 (18.2%) | 24,178 (26.8%) | 17,571 (19.5%) | 23,729 (26.1%) |
| 1– 2 times a week | 117,193 (26.0%) | 21,363 (23.6%) | 25,161 (27.9%) | 21,743 (24.1%) | 24,759 (27.4%) | 22,199 (24.6%) | 24,451 (26.9%) |
| Less than one time a week | 101,872 (22.6%) | 23,511 (26.0%) | 18,337 (20.4%) | 24,214 (26.8%) | 18,062 (20.0%) | 22,472 (24.9%) | 19,105 (21.0%) |
| Missing | 937 | 449 | 93 | 426 | 100 | 409 | 85 |
| Regular physical activity† | |||||||
| Yes | 245,901 (58.0%) | 44,105 (53.8%) | 52,911 (61.1%) | 43,504 (54.0%) | 53,529 (61.7%) | 44,379 (54.2%) | 53,211 (61.0%) |
| BMI (kg/m2) (n, %) | |||||||
| <25.0 | 151,100 (33.5%) | 23,423 (26.3%) | 37,733 (42.0%) | 20,490 (23.1%) | 40,580 (45.4%) | 28,371 (31.8%) | 31,393 (35.0%) |
| 25– 29.9 | 189,730 (42.0%) | 36,854 (40.8%) | 37,125 (41.2%) | 36,918 (40.9%) | 36,576 (42.3%) | 36,347 (40.6%) | 39,184 (43.0%) |
| ≥30 | 110,676 (24.5%) | 30,077 (32.9%) | 15,227 (16.8%) | 32,874 (36.0%) | 13,251 (14.4%) | 25,504 (27.6%) | 20,259 (22.1%) |
| Missing | 1,012 | 505 | 72 | 507 | 63 | 494 | 83 |
| Sleep score (n, %) | |||||||
| Healthy sleep pattern | 141,267 (37.8%) | 24,700 (33.8%) | 32,121 (42.4%) | 24,423 (33.5%) | 32,206 (42.4%) | 25,335 (34.9%) | 31,431 (41.0%) |
| Intermediate sleep pattern | 216,393 (57.9%) | 44,177 (60.6%) | 41,237 (54.4%) | 44,269 (60.7%) | 41,274 (54.4%) | 43,468 (60.0%) | 42,515 (55.5%) |
| Poor sleep pattern | 16,002 (4.28%) | 4,064 (5.57%) | 2,400 (3.17%) | 4,193 (5.75%) | 2,417 (3.18%) | 3,771 (5.20%) | 2,681 (3.50%) |
| Missing | 78,856 | 17,918 | 14,399 | 17,904 | 14,573 | 18,142 | 14,292 |
| Hypertension (n, %) | |||||||
| Yes | 117,215 (25.9%) | 35,269 (38.8%) | 13,138 (14.6%) | 35,879 (39.5%) | 13,294 (14.7%) | 31,261 (34.5%) | 16,800 (18.5%) |
| Diabetes (n, %) | |||||||
| Yes | 22,272 (4.92%) | 9,065 (9.98%) | 1,558 (1.73%) | 9,522 (10.5%) | 1,538 (1.70%) | 7,319 (8.07%) | 2,528 (2.78%) |
| High cholesterol (n, %) | |||||||
| Yes | 65,249 (14.4%) | 21,046 (23.2%) | 5,877 (6.52%) | 21,354 (23.5%) | 6,093 (6.73%) | 18,083 (19.9%) | 8,147 (8.916%) |
| Pollutant exposures (μg/m3) (mean±SD) | |||||||
| PM2.5 | 6.42 (±0.90) | 6.47 (±0.91) | 6.40 (±0.89) | 6.47 (±0.91) | 6.39 (±0.88) | 6.45 (±0.90) | 6.41 (±0.90) |
| NO2 | 29.0 (±9.06) | 30.2 (±9.39) | 28.6 (±8.96) | 30.1 (±9.39) | 28.7 (±8.96) | 29.9 (±9.08) | 28.6 (±9.12) |
† Regular physical activity was defined as >150 min/week of moderate activity, or >75 min/week of vigorous activity, or an equivalent combination. FEV1, forced expiratory volume in 1-s; FVC, forced vital capacity; PEF, peak expiratory flow.
Ascertainment of PD morbidity and mortality
PD status and diagnosis date were derived from Hospital Episode Statistics using International Classification of Diseases (ICD) codes: ICD– 9 code “3320” from data Fields 41271 and ICD– 10 code “G20” from data Fields 41270. Self– report PD cases were included from data Field 20002 with code “1262”, and death register data from Fields 40001-40002 was also documented.14,16,17 If two or more different diagnosis dates were recorded for the same disease, the earliest one was used as the primary diagnosis date. The effectiveness of these codes in the UK Biobank for identifying participants with PD was validated, demonstrating a positive predictive value of 91%.18
Data on mortality were obtained from death certificates held within the National Health Service Information Centre (England and Wales) and the National Health Service Central Register Scotland (Scotland). Further information about the linkage procedure is available online (https://content.digital.nhs.uk/services).
Assessment of covariates
The following baseline characteristics were included as covariates: (i) sociodemographic factors, i.e., age, sex, educational levels, race, and socioeconomic status; (ii) lifestyle factors, i.e., smoking status, alcohol frequency, have physical activity, and sleep score; (iii) health conditions, i.e., body mass index (BMI), any history of chronic diseases (hypertension, dyslipidemia, or diabetes), and cancer; (iv) air pollution, i.e., particulate matter with aerodynamic diameters of <2.5μm (PM2.5) and nitrogen dioxide (NO2); and standard polygenic risk score (PRS) for PD.
Educational levels were self-reported and categorized as university or college degree, levels or equivalent, O-levels or equivalent, or none of the above. Socioeconomic status was assessed by collecting the Townsend deprivation index (TDI), which is a composite measure of area-level socio-economic deprivation, with higher scores indicating greater deprivation.19 Smoking status was self-reported as current, past, or never smoker. Alcohol frequency was derived from the question “About how often do you drink alcohol?” and categorized as never, daily or almost daily, 3– 4 times a week, 1– 2 times a week, or less than one time a week. Regular physical activity, as assessed by a self– reported touchscreen questionnaire, was defined as at least 150 min/week of moderate activity or 75 min/week of vigorous activity (or an equivalent combination).20 Details about sleep score have been published previously.21 Information on height and weight was collected during physical measurements by nurses. BMI (kg/m2) was calculated as weight in kilograms divided by height in meters squared. According to World Health Organization (WHO) criteria, BMI was classified into four categories: underweight/normal (<25 kg/m2), overweight (25.0– 29.9 kg/m2), and obese (≥30.0 kg/m2).22 Information on the histories of hypertension, dyslipidemia, diabetes, and cancer was based on primary care, hospital admission, and self– report. To estimate genetic predisposition, PRS for PD was extracted from Standard PRS (Category 301) provided by the UK Biobank PRS Release. And standard PRS for PD was stratified into a tertile variables. The UK Biobank estimated annual concentrations for NO2 between 2005– 2007 and 2010 and exposure data for PM2.5 for the year 2010. Mean estimates of NO2 were included in the present analysis. Participants were treated as those exposed to low or high pollution according to the World Health Organization yearly air quality guideline values or the median (PM2.5: low <10μg/m3 or high ≥10μg/m3; NO2: low <40μg/m3 or high ≥40μg/m3).11
Statistical analysis
Baseline characteristics were described and compared according to participants with different FVC, FEV1, and PEF levels. Continuous variables were presented as means and standard deviations (SD) and categorical variables were presented as numbers (proportions).
In the primary analyses, we assessed the associations of FVC, FEV1, PEF, and FEV1/FVC ratio with the risk of PD using the Cox proportional hazard models. We sequentially adjusted the hazard ratios (HRs) and 95% confidence intervals (CIs) for baseline age, sex (women or men), PRS (tertiles), education level (high [college or university degree], intermediate [A/AS levels or equivalent, O levels/GCSEs or equivalent], or low [none of the aforementioned]), TDI (quintiles), smoking status (current, past, or never), alcohol frequency (never, daily or almost daily, 3– 4 times a week, 1– 2 times a week, or less than one time a week), have physical activity (yes or no), BMI (<25.0, 25– 29.9, or ≥30 kg/m2), and sleep score (healthy sleep pattern, intermediate sleep pattern, or poor sleep pattern), any chronic disease (yes or no), cancer (yes or no), PM2.5 (low or high), and NO2 (low or high). Each patient’s person-year was calculated from the date of attending the assessment center (Field 53) to the earliest incident PD diagnosis, date of death, or end of follow-up (October 31, 2022 [England], February 28, 2018 [Wales], and July 31, 2021 [Scotland]), whichever occurred first. We assessed the association of the FVC, FEV1, PEF, and FEV1/FVC ratio as a continuous (per unit or per SD) and categorial (sex-specific quintiles) variable with the risk of PD in separate models. Moreover, the linear trend across lung function was tested by treating the FVC, FEV1, PEF, and FEV1/FVC ratio as a continuous variable.
The association of FVC, FEV1, PEF, and FEV1/FVC ratio with the number of prodromal PD features (categorized as 0, 1, 2, and ≥3) was estimated using the Cox proportional hazard models. Moreover, we assessed the associations of baseline FVC, FEV1, PEF, and FEV1/FVC ratio with the risk of mortality among participants with newly diagnosed PD during follow-up. Assessments of FVC, FEV1, PEF, and FEV1/FVC ratio were not updated because only 12.8% of participants had repeated measurements. The adjustment was the same as the primary analysis. Person-year was calculated from the date of PD diagnosis until the date of death or the end of follow-up.
We performed prespecified stratified analyses by age (<60 years or ≥60 years), sex (women or men), smoking status (never or current/past), and BMI categories (<25.0 kg/m2 or ≥25.0 kg/m2). We tested for potential interactions using likelihood ratio tests. We also conducted several sensitivity analyses to test the robustness of the primary findings. First, we included only participants with both FEV1 and FVC reproducible.23 Second, we restricted our analyses to participants without baseline hypertension, dyslipidemia, diabetes, and cancer. To further account for the potential of reverse causation, we conducted lagged analyses excluding the first two years of follow– up. Moreover, to reduce the impact of misclassification of PD assessment, we restricted only ICD codes for PD diagnosis.
Two-sided p value less than 0.05 indicate statistical significance. All statistical analyses were performed using SAS, version 9.4 (SAS Institute).
RESULTS
Among the 452,518 participants in the present analysis (mean age of 56.4±8.10 years), 45.2% were men, and most of them were White British (88.6%). At enrollment, compared with the lowest FEV1, FVC, and PEF groups, participants in the highest groups were more likely to be younger age, have higher education level, have higher socioeconomic status, never smoke, have regular physical activity, underweight/normal, and have healthier sleep pattern. Participants in the higher groups also tended to have a lower prevalence of preexisting hypertension, diabetes, or high cholesterol compared with those in lower group. Moreover, they were exposed to lower levels of PM2.5 and NO2.
During a median of 13.5 years of follow-up, 2,996 incident PD cases were documented. In the multivariable models adjusted for sociodemographic factors, lifestyle factors, health conditions, air pollution, and standard PRS, compared with the highest lung function group, participants in the lowest lung function group had a higher likelihood of incident PD. The HR comparing the lowest vs. the highest lung function quintile was 1.18 (95% CI, 1.02– 1.37) for FEV1 and 1.23 (95% CI, 1.08– 1.41) for PEF (Table 2). Per unit decrease in lung function was each associated with higher risk of PD (1.13 [95% CI, 1.04– 1.23] for FEV1, 1.09 [95% CI, 1.02–1.16] for FVC, and 1.08 [95% CI, 1.04–1.13] for PEF) (Table 2). In contrast, we did not find significant associations between FEV1/FVC ratio and risk of PD (HR, 0.92; 95% CI, 0.82– 1.04) (Table 2).
Table 2
Association between lung function and risk of developing Parkinson’s disease (n = 452,518)
| Lung function | p Trend | ||||||
| Q1 | Q2 | Q3 | Q4 | Q5 | Per unit decrease | ||
| FEV1 (L), median | 1.92 | 2.27 | 2.53 | 2.82 | 3.58 | ||
| Case/N | 926 / 90,859 | 799 / 90,005 | 555 / 90,241 | 447 / 91,256 | 269 / 90,157 | ||
| Model 1 | 1.24 (1.08, 1.43) | 1.23 (1.07, 1.42) | 1.03 (0.88, 1.19) | 1.07 (0.92, 1.24) | Ref | 1.16 (1.07, 1.26) | <0.001 |
| Model 2 | 1.18 (1.02, 1.37) | 1.20 (1.04, 1.39) | 1.01 (0.87, 1.17) | 1.06 (0.91, 1.23) | Ref | 1.13 (1.04, 1.23) | 0.004 |
| Model 3 | 1.18 (1.02, 1.37) | 1.20 (1.04, 1.39) | 1.01 (0.87, 1.17) | 1.06 (0.91, 1.23) | Ref | 1.13 (1.04, 1.23) | 0.004 |
| FVC (L), median | 2.58 | 2.98 | 3.29 | 3.65 | 4.67 | ||
| Case/N | 915 / 90,789 | 771 / 90,840 | 551 / 90,612 | 435 / 89,807 | 324 / 90,470 | ||
| Model 1 | 1.21 (1.06, 1.38) | 1.16 (1.02, 1.32) | 0.99 (0.86, 1.14) | 0.97 (0.84, 1.12) | Ref | 1.12 (1.05, 1.19) | <0.001 |
| Model 2 | 1.14 (0.99, 1.30) | 1.12 (0.98, 1.29) | 0.97 (0.84, 1.12) | 0.96 (0.83, 1.11) | Ref | 1.09 (1.02, 1.16) | 0.011 |
| Model 3 | 1.14 (0.99, 1.29) | 1.13 (0.99, 1.31) | 0.97 (0.85, 1.12) | 0.97 (0.84, 1.12) | Ref | 1.09 (1.02, 1.16) | 0.001 |
| PEF (L/min), median | 260.0 | 319.0 | 358.0 | 401.0 | 510.0 | ||
| Case/N | 850 / 90,716 | 740 / 90,154 | 618 / 91,472 | 457 / 89,257 | 331 / 90,919 | ||
| Model 1 | 1.27 (1.12, 1.45) | 1.25 (1.10, 1.43) | 1.20 (1.05, 1.38) | 1.07 (0.93, 1.23) | Ref | 1.09 (1.05, 1.14) | <0.001 |
| Model 2 | 1.23 (1.08, 1.40) | 1.23 (1.07, 1.40) | 1.19 (1.04, 1.36) | 1.06 (0.92, 1.22) | Ref | 1.08 (1.04, 1.13) | <0.001 |
| Model 3 | 1.23 (1.08, 1.41) | 1.23 (1.08, 1.41) | 1.19 (1.04, 1.36) | 1.06 (0.92, 1.23) | Ref | 1.08 (1.04, 1.13) | <0.001 |
| FEV1/FVC, median | 0.68 | 0.74 | 0.77 | 0.80 | 0.83 | ||
| Case/N | 689 / 90,514 | 677 / 90,514 | 584 / 90,506 | 579 / 90,500 | 467 / 90,497 | ||
| Model 1 | 0.88 (0.78, 1.00) | 0.95 (0.84, 1.07) | 0.91 (0.80, 1.02) | 1.02 (0.91, 1.16) | Ref | 0.96 (0.92, 0.99) | 0.02 |
| Model 2 | 0.93 (0.82, 1.05) | 0.99 (0.87, 1.10) | 0.93 (0.82, 1.05) | 1.04 (0.92, 1.18) | Ref | 0.97 (0.93, 1.01) | 0.10 |
| Model 3 | 0.92 (0.82, 1.04) | 0.98 (0.87, 1.11) | 0.93 (0.82, 1.05) | 1.04 (0.92, 1.18) | Ref | 0.97 (0.93, 1.01) | 0.09 |
Model 1: Adjusted for age (years), sex (men or women), and PRS (tertiles); Model 2: Adjusted for age (years), sex (men or women), PRS (tertiles), education level (high [college or university degree], intermediate [A/AS levels or equivalent, O levels/GCSEs or equivalent], or low [none of the aforementioned]), TDI (quintiles), smoking status (current, past, or never), alcohol frequency (never, daily or almost daily, 3– 4 times a week, 1– 2 times a week, or less than one time a week), have physical activity (yes or no), BMI (<25.0, 25– 29.9, or ≥30 kg/m2), sleep score (healthy sleep pattern, intermediate sleep pattern, or poor sleep pattern), any chronic disease (yes or no), and cancer (yes or no); Model 3: Adjusted for age (years), sex (men or women), PRS (tertiles), education level (high [college or university degree], intermediate [A/AS levels or equivalent, O levels/GCSEs or equivalent], or low [none of the aforementioned]), TDI (quintiles), smoking status (current, past, or never), alcohol frequency (never, daily or almost daily, 3– 4 times a week, 1– 2 times a week, or less than one time a week), have physical activity (yes or no), BMI (<25.0, 25– 29.9, or ≥30 kg/m2), and sleep score (healthy sleep pattern, intermediate sleep pattern, or poor sleep pattern), any chronic disease (yes or no), cancer (yes or no), PM2.5 (low or high), and NO2 (low or high). Data with p– value <0.05 are presented in bold. FEV1, forced expiratory volume in 1-s; FVC, forced vital capacity; PEF, peak expiratory flow; PRS, standard polygenic risk score; PD, Parkinson’s disease; TDI, Townsend deprivation index; BMI, body mass index.
Similarly, lower lung function was associated with prodromal PD features. Comparing extreme quintiles of lung function, the HRs for having ≥3 versus 0 prodromal PD features was 1.17 (95% CI, 1.06– 1.29) for FEV1, 1.13 (95% CI, 1.03– 1.25) for FVC, and 1.24 (95% CI, 1.13– 1.36) for PEF (Table 3). Moreover, per unit decrease in lung function was each associated with having ≥3 prodromal PD features (1.10 [95% CI, 1.04–1.17] for FEV1, 1.05 [95% CI, 1.01–1.10] for FVC, 1.08 [95% CI, 1.05–1.11] for PEF, and 1.03 [95% CI, 1.00–1.06] for FEV1/FVC ratio) (Table 3).
Table 3
Association between lung function and risk of prodromal Parkinson’s disease features (comparing ≥3 versus 0 features) (n = 450,407)
| Lung function | p Trend | ||||||
| Q1 | Q2 | Q3 | Q4 | Q5 | Per unit decrease | ||
| FEV1 (L), median | 1.94 | 2.29 | 2.54 | 2.84 | 3.60 | ||
| Case/N | 1,708 / 71,086 | 1,147 / 71,518 | 1,011 / 72,119 | 810 / 71,169 | 690 / 71,450 | ||
| Model 1 | 1.91 (1.74, 2.10) | 1.33 (1.21, 1.47) | 1.23 (1.21, 1.47) | 1.23 (1.11, 1.36) | Ref | 1.51 (1.43, 1.60) | <0.001 |
| Model 2 | 1.16 (1.05, 1.28) | 0.98 (0.89, 1.09) | 1.01 (0.91, 1.12) | 0.86 (0.87, 1.07) | Ref | 1.10 (1.03, 1.16) | 0.003 |
| Model 3 | 1.17 (1.06, 1.29) | 0.99 (0.90, 1.10) | 1.02 (0.92, 1.12) | 0.97 (0.88, 1.08) | Ref | 1.10 (1.04, 1.17) | 0.002 |
| FVC (L), median | 2.60 | 2.99 | 3.30 | 3.66 | 4.69 | ||
| Case/N | 1,656 / 70,838 | 1,161 / 72,003 | 967 / 71,144 | 854 / 71,620 | 728 / 71,737 | ||
| Model 1 | 1.80 (1.64, 1.98) | 1.30 (1.18, 1.43) | 1.16 (1.05, 1.28) | 1.08 (0.98, 1.19) | Ref | 1.33 (1.27, 1.39) | <0.001 |
| Model 2 | 1.12 (1.01, 1.23) | 0.98 (0.89, 1.08) | 0.96 (0.87, 1.06) | 0.95 (0.82, 1.10) | Ref | 1.05 (1.00, 1.10) | 0.05 |
| Model 3 | 1.13 (1.03, 1.25) | 1.00 (0.90, 1.10) | 0.98 (0.88, 1.08) | 1.00 (0.90, 1.10) | Ref | 1.05 (1.01, 1.10) | 0.03 |
| PEF (L/min), median | 264.0 | 322.0 | 360.0 | 403.0 | 515.0 | ||
| Case/N | 1,650 / 71,899 | 1,150 / 70,772 | 959 / 71,671 | 853 / 71,890 | 754 / 71,110 | ||
| Model 1 | 1.73 (1.58, 1.89) | 1.28 (1.17, 1.41) | 1.11 (1.01, 1.22) | 1.04 (0.94, 1.14) | Ref | 1.22 (1.18, 1.26) | <0.001 |
| Model 2 | 1.23 (1.13, 1.35) | 1.06 (0.96, 1.16) | 0.99 (0.90, 1.09) | 0.98 (0.89, 1.08) | Ref | 1.08 (1.05, 1.11) | <0.001 |
| Model 3 | 1.24 (1.13, 1.36) | 1.07 (0.97, 1.17) | 1.00 (0.91, 1.10) | 0.99 (0.89, 1.09) | Ref | 1.08 (1.05, 1.11) | <0.001 |
| FEV1/FVC, median | 0.68 | 0.74 | 0.77 | 0.80 | 0.83 | ||
| Case/N | 1,335 / 71,468 | 1,089 / 71,464 | 973 / 71,477 | 996 / 71,465 | 973 / 71,468 | ||
| Model 1 | 1.13 (1.03, 1.22) | 0.96 (0.88, 1.05) | 0.89 (0.81, 0.97) | 0.96 (0.88, 1.05) | Ref | 1.05 (1.02, 1.08) | <0.001 |
| Model 2 | 1.08 (0.99, 1.18) | 1.00 (0.92, 1.10) | 0.94 (0.86, 1.03) | 0.99 (0.91, 1.09) | Ref | 1.03 (1.00, 1.06) | 0.03 |
| Model 3 | 1.07 (0.98, 1.17) | 0.99 (0.91, 1.08) | 0.93 (0.85, 1.02) | 0.99 (0.90, 1.08) | Ref | 1.03 (1.00, 1.06) | 0.05 |
Model 1: Adjusted for age (years), sex (men or women), and PRS (polygenic risk score) (tertiles); Model 2: Adjusted for age (years), sex (men or women), PRS (tertiles), education level (high [college or university degree], intermediate [A/AS levels or equivalent, O levels/GCSEs or equivalent], or low [none of the aforementioned]), TDI (Townsend deprivation index) (quintiles), smoking status (current, past, or never), alcohol frequency (never, daily or almost daily, 3– 4 times a week, 1– 2 times a week, or less than one time a week), have physical activity (yes or no), BMI (body mass index) (<25.0, 25– 29.9, or ≥30 kg/m2), sleep score (healthy sleep pattern, intermediate sleep pattern, or poor sleep pattern), any chronic disease (yes or no), and cancer (yes or no); Model 3: Adjusted for age (years), sex (men or women), PRS (tertiles), education level (high [college or university degree], intermediate [A/AS levels or equivalent, O levels/GCSEs or equivalent], or low [none of the aforementioned]), TDI (quintiles), smoking status (current, past, or never), alcohol frequency (never, daily or almost daily, 3– 4 times a week, 1– 2 times a week, or less than one time a week), have physical activity (yes or no), BMI (<25.0, 25– 29.9, or ≥30 kg/m2), and sleep score (healthy sleep pattern, intermediate sleep pattern, or poor sleep pattern), any chronic disease (yes or no), cancer (yes or no), PM2.5 (low or high), and NO2 (low or high). Data with p– value <0.05 are presented in bold. FEV1, forced expiratory volume in 1-s; FVC, forced vital capacity; PEF, peak expiratory flow; PRS, standard polygenic risk score; PD, Parkinson’s disease; TDI, Townsend deprivation index; BMI, body mass index.
In the analyses of lung function and mortality among individuals with PD, we found that lower lung function was associated with a higher risk of mortality. The adjusted HR comparing the lowest vs. the highest lung function quintile was 1.32 (95% CI, 1.07– 1.63) for FEV1, 1.38 (95% CI, 1.12– 1.70) for FVC, and 1.51 (95% CI, 1.16– 1.98) for PEF (Table 4). Moreover, per unit decrease in lung function was each associated with higher risk of mortality (1.15 [95% CI, 1.04–1.28] for FEV1, 1.12 [95% CI, 1.03–1.22] for FVC, and 1.16 [95% CI, 1.09–1.23] for PEF) (Table 4). In contrast, non-significant associations were found between FEV1/FVC ratio and risk of mortality (Table 4).
Table 4
Association between lung function and risk of all-cause mortality among individuals with Parkinson’s disease (n = 2,989)
| Lung function | p Trend | ||||||
| Q1 | Q2 | Q3 | Q4 | Q5 | Per unit decrease | ||
| FEV1 (L), median | 1.90 | 2.66 | 2.98 | 3.30 | 3.72 | ||
| Case/N | 289 / 601 | 246 / 593 | 215 / 599 | 213 / 600 | 166 / 596 | ||
| Model 1 | 1.42 (1.16, 1.73) | 1.21 (0.99, 1.48) | 1.06 (0.84, 1.28) | 1.15 (0.94, 1.41) | Ref | 1.20 (1.09, 1.33) | <0.001 |
| Model 2 | 1.32 (1.08, 1.63) | 1.15 (0.93, 1.41) | 1.04 (0.85, 1.29) | 1.15 (0.94, 1.42) | Ref | 1.15 (1.04, 1.28) | 0.007 |
| Model 3 | 1.32 (1.07, 1.63) | 1.15 (0.94, 1.42) | 1.04 (0.85, 1.29) | 1.15 (0.94, 1.42) | Ref | 1.15 (1.04, 1.28) | 0.008 |
| FVC (L), median | 2.72 | 3.58 | 3.99 | 4.39 | 4.96 | ||
| Case/N | 281 / 598 | 231 / 593 | 230 / 601 | 223 / 602 | 164 / 595 | ||
| Model 1 | 1.46 (1.20, 1.78) | 1.21 (0.98, 1.48) | 1.21 (0.99, 1.48) | 1.27 (1.04, 1.55) | Ref | 1.12 (1.01, 1.24) | 0.030 |
| Model 2 | 1.40 (1.13, 1.72) | 1.19 (0.96, 1.46) | 1.19 (0.97, 1.47) | 1.25 (1.02, 1.54) | Ref | 1.13 (1.03, 1.23) | 0.07 |
| Model 3 | 1.38 (1.12, 1.70) | 1.19 (0.96, 1.46) | 1.19 (0.97, 1.46) | 1.25 (1.02, 1.53) | Ref | 1.12 (1.03, 1.22) | 0.010 |
| PEF (L/min), median | 241.0 | 383.0 | 444.0 | 496.0 | 564.0 | ||
| Case/N | 307 / 599 | 231 / 595 | 207 / 602 | 214 / 597 | 170 / 596 | ||
| Model 1 | 1.66 (1.37, 2.01) | 1.17 (0.96, 1.43) | 1.04 (0.85, 1.28) | 1.16 (0.95, 1.42) | Ref | 1.19 (1.12, 1.26) | <0.001 |
| Model 2 | 1.57 (1.29, 1.92) | 1.16 (0.95, 1.42) | 1.02 (0.83, 1.26) | 1.17 (0.96, 1.44) | Ref | 1.16 (1.09, 1.24) | <0.001 |
| Model 3 | 1.51 (1.16, 1.98) | 1.05 (0.79, 1.38) | 0.94 (0.72, 1.25) | 1.16 (0.89, 1.52) | Ref | 1.16 (1.09, 1.23) | <0.001 |
| FEV1/FVC, median | 0.66 | 0.73 | 0.76 | 0.79 | 0.82 | ||
| Case/N | 262 / 597 | 246 / 599 | 208 / 597 | 199 / 599 | 214 / 597 | ||
| Model 1 | 1.09 (0.91, 1.30) | 1.01 (0.84, 1.22) | 0.87 (0.72, 1.06) | 0.86 (0.71, 1.04) | Ref | 1.06 (1.00, 1.12) | 0.05 |
| Model 2 | 1.03 (0.86, 1.25) | 0.98 (0.82, 1.18) | 0.87 (0.72, 1.06) | 0.88 (0.73, 1.07) | Ref | 1.03 (0.98, 1.10) | 0.26 |
| Model 3 | 1.05 (0.87, 1.26) | 0.99 (0.82, 1.19) | 0.88 (0.72, 1.06) | 0.89 (0.73, 1.08) | Ref | 1.04 (0.98, 1.10) | 0.23 |
Model 1: Adjusted for age (years), sex (men or women), and PRS (tertiles); Model 2: Adjusted for age (years), sex (men or women), PRS (tertiles), education level (high [college or university degree], intermediate [A/AS levels or equivalent, O levels/GCSEs or equivalent], or low [none of the aforementioned]), TDI (quintiles), smoking status (current, past, or never), alcohol frequency (never, daily or almost daily, 3– 4 times a week, 1– 2 times a week, or less than one time a week), have physical activity (yes or no), BMI (<25.0, 25– 29.9, or ≥30 kg/m2), sleep score (healthy sleep pattern, intermediate sleep pattern, or poor sleep pattern), any chronic disease (yes or no), and cancer (yes or no); Model 3: Adjusted for age (years), sex (men or women), PRS (tertiles), education level (high [college or university degree], intermediate [A/AS levels or equivalent, O levels/GCSEs or equivalent], or low [none of the aforementioned]), TDI (quintiles), smoking status (current, past, or never), alcohol frequency (never, daily or almost daily, 3– 4 times a week, 1– 2 times a week, or less than one time a week), have physical activity (yes or no), BMI (<25.0, 25– 29.9, or ≥30 kg/m2), and sleep score (healthy sleep pattern, intermediate sleep pattern, or poor sleep pattern), any chronic disease (yes or no), cancer (yes or no), PM2.5 (low or high), and NO2 (low or high). Data with P– value <0.05 are presented in bold. FEV1, forced expiratory volume in 1-s; FVC, forced vital capacity; PEF, peak expiratory flow; PRS, standard polygenic risk score; PD, Parkinson’s disease; TDI, Townsend deprivation index; BMI, body mass index.
In the stratified analyses, no significant effect modifications were detected in sex, gender, smoking status, and BMI (Table 5). Additional sensitivity analyses were overall consistent with the primary analysis when we only included 269,770 participants with both FEV1 and FVC were reproducible (Supplementary Table 2), or restricted our analyses to participants without cancer at baseline (Supplementary Table 3), or performed two-year lagged analyses (Supplementary Table 4). Furthermore, our results remained robust when PD diagnosis was restricted to ICD codes only (Supplementary Table 5).
Table 5
Stratified analyses of lung function in relation to the risk of PD in fully adjusted models
| Variable | Case/N | Lung function | |||||||||||
| FEV1 | FVC | PEF | FEV1/FVC | ||||||||||
| Q5 | Q1 | p– interaction | Q5 | Q1 | p– interaction | Q5 | Q1 | p– interaction | Q5 | Q1 | p– interaction | ||
| Sex | 0.17 | 0.42 | 0.95 | 0.28 | |||||||||
| Men | 1,851/204,435 | Ref | 1.08 (0.90, 1.30) | Ref | 1.10 (0.92, 1.30) | Ref | 1.19 (1.01, 1.41) | Ref | 0.91 (0.78, 1.06) | ||||
| Women | 1,145/248,083 | Ref | 1.33 (1.04, 1.70) | Ref | 1.18 (0.94, 1.48) | Ref | 1.30 (1.04, 1.63) | Ref | 0.95 (0.79, 1.16) | ||||
| Age | 0.31 | 0.47 | 0.26 | 0.89 | |||||||||
| <60 years | 629/260,4432 | Ref | 1.36 (1.03, 1.79) | Ref | 1.20 (0.91, 1.58) | Ref | 1.16 (0.89, 1.52) | Ref | 1.01 (0.78, 1.32) | ||||
| ≥60 years | 2,367/192,086 | Ref | 1.09 (0.91, 1.31) | Ref | 1.07 (0.91, 1.26) | Ref | 1.24 (1.06, 1.45) | Ref | 0.90 (0.79, 1.03) | ||||
| Smoking status | 0.25 | 0.37 | 0.66 | 0.67 | |||||||||
| Never | 1,5474/249,589 | Ref | 1.37 (1.12, 1.68) | Ref | 1.28 (1.06, 1.55) | Ref | 1.32 (1.10, 1.58) | Ref | 0.99 (0.84, 1.16) | ||||
| Current/past | 1,400/200,727 | Ref | 1.00 (0.80, 1.24) | Ref | 0.99 (0.81, 1.21) | Ref | 1.13 (0.93, 1.37) | Ref | 0.87 (0.72, 1.04) | ||||
| BMI | 0.54 | 0.21 | 0.90 | 0.66 | |||||||||
| <25.0 kg/m2 | 833/151,110 | Ref | 1.23 (0.95, 1.59) | Ref | 1.28 (1.00, 1.64) | Ref | 1.31 (1.02, 1.68) | Ref | 0.92 (0.72, 1.17) | ||||
| ≥25.0 kg/m2 | 2,152/300,406 | Ref | 1.15 (0.96, 1.37) | Ref | 1.05 (0.89, 1.24) | Ref | 1.19 (1.02, 1.39) | Ref | 0.92 (0.80 1.06) | ||||
Models were adjusted for age (years), sex (men or women), PRS (tertiles), education level (high [college or university degree], intermediate [A/AS levels or equivalent, O levels/GCSEs or equivalent], or low [none of the aforementioned]), TDI (quintiles), smoking status (current, past, or never), alcohol use (current, past, or never), have physical activity (yes or no), BMI (<25.0, 25– 29.9, or ≥30 kg/m2), and sleep score (healthy sleep pattern, intermediate sleep pattern, or poor sleep pattern), hypertension (yes or no), diabetes (yes or no), high cholesterol (yes or no), cancer (yes or no), PM2.5 (low or high), and NO2 (low or high). Data with p– value <0.05 are presented in bold. FEV1, forced expiratory volume in 1-s; FVC, forced vital capacity; PEF, peak expiratory flow; PRS, standard polygenic risk score; PD, Parkinson’s disease; TDI, Townsend deprivation index; BMI, body mass index.
DISCUSSION
In this population-based cohort of 452,518 participants, we observed that lower FEV1, PEF levels were associated with higher risk of prodromal and clinical PD. Consistently, individuals with PD who had poor lung function were likely to have a higher risk of mortality, relative to those with better lung function.
To the best of our knowledge, the current investigation is the first prospective study for the association between lung function and risk of PD. Consistently, a systematic review and meta-analysis pooling 39 retrospective case-control studies with 1,070 PD participants and 928 healthy controls summarized that high-to-moderate certainty evidence of impairment in PD was identified for vital capacity (standardized mean difference [SMD] 0.75; 95% CI, 0.45– 1.05), total chest wall volume (SMD 0.38; 95% CI, 0.09– 0.68), maximum inspiratory pressure (SMD 0.91; 95% CI, 0.64– 1.19), and sniff nasal inspiratory pressure (SMD 0.58; 95% CI, 0.30– 0.87).5 Our findings added valuable evidence to the current literature that poor lung function could be a predictor of PD, which was independent of the sociodemographic factors, socioeconomic status, lifestyle factors, health conditions, air pollution, and PRS for PD.
It is well known that a prodromal phase exists prior to the time when PD can be formally diagnosed. Actually, most prodromal PD features are oriented outside of central nervous system, such as autonomic system, urogenital system and gastrointestinal system.24,25 Our results provide evidence that poor lung function may also be a marker for the prodromal phase of the PD.15 Our finding may provide a potential temporal window for PD prevention. Once such prevention becomes available, it could be administered to screen for high-risk patient groups, such as those with anosmia, autonomic disorders, RBD, and individuals who are genetically at risk of developing PD.
Over the past generation, the number of individuals with PD globally has more than doubled and the death rates increased for all global burdens of disease regions except for southern Latin America, Eastern Europe, and Oceania.2 Previous physiological evidence indicated that respiratory disorders were recognized predictors of mortality and morbidity in PD.5,26 A meta-analysis pooling nine studies (including 7,162 individuals with PD) summarized that one of the leading cause of hospitalization was pneumonia, with a prevalence of 22%.27 In Sweden, a 9– year follow-up case control study including 170 PD patients and 510 sex- and age-matched controls found that other respiratory disease (mostly pneumonia) was the second largest category of cause of death (24.0%), compared to 8.3% among the controls.28 Actually, most patients do not report respiratory symptoms until the final stages of PD.26,29 Probably this disturbance remains unnoticed because physical disability in patients often makes a patient lead a sedentary life and limits activities where respiratory problems can become manifest.30 Overall, most studies did not estimate the long-term association between lung function and risk of all-cause mortality among individuals with newly diagnosed PD. We herein elucidated firsthand evidence among individuals with newly diagnosed PD, if confirmed, may contribute to delay the progression of PD and reduce the risk of all-cause mortality.
Although the exact mechanism underlying the association between poor lung function and the risk of PD remains to be further elucidated, we speculated several potential mechanisms to explain the observed association. Mechanisms of respiratory disorders in PD, both central and peripheral, have been proposed in recent narrative reviews.31–33 Central mechanisms focus on brain and brain stem respiratory control center changes. Previous studies suggested that early central mechanisms affect respiratory control structures functioning to co-ordinate ventilation and detect peripheral oxygen and carbon dioxide levels.5 Peripheral mechanisms include restrictive dysfunction and obstructive dysfunction. Restrictive dysfunction may result from motor impairments of bradykinesia and rigidity, muscle weakness.33,34 Obstructive disorders may affect the upper or lower airways, especially the upper airways.35 However, no significant association was found between the FEV1/FVC ratio and PD, indicating that other mechanisms, rather than obstructive disorders, might be involved. Further investigations on obstructive disorders are warranted.
The strengths of the current study included the population-based cohort, the long-term follow-up, the high-quality assessment of lung function, and the extensive measurement of covariates. Nevertheless, several limitations need to be considered. First, dynamic data of lung function during follow-up was not largely recorded in the UK Biobank, which prevent us from illustrating the precise impacts of the PD. Given the long preclinical stage of PD, low lung function could be the outcome rather than the prodromal PD feature in disease progression and severity. To minimize the possibility of reverse causation, we conducted a sensitivity analysis that left a lag time of two years between the assessment of lung function and the PD diagnosis. Second, misclassification in PD might still occur because some early stages of PD cases may not be captured because the incident PD cases were only ascertained through electronic health records. Third, given that non-motor symptoms including hyposmia, constipation, and urinary incontinence could not be routinely screened for in primary care settings, there may be an underestimation of participants with these non-motor symptoms. However, the combined criterion of ICD– 9 codes, ICD– 10 codes, primary care data collection, and self-reported medical conditions were used to categorize the prodromal PD features. Further, this misclassification of non-motor symptoms, if non-differential, would like to result in attenuation of the effect size. Moreover, the UK Biobank participants were relatively healthy and affluent, predominantly of White ethnicity, and thus the generalization of our findings was thus of concern. Finally, even though we adjusted for major confounders, residual and unmeasured confounding cannot be fully controlled.
In this prospective cohort study, we found that individuals with lower lung function were more likely to have a higher risk of prodromal and clinical PD, relative to those with higher lung function. Consistently, lower lung function was associated with a higher risk of all-cause mortality among individuals with PD. Future studies are needed to confirm the study findings and to explore the underlying biological mechanisms.
ACKNOWLEDGMENTS
The authors have no acknowledgments to report.
FUNDING
This research was supported by a Startup grant at Fudan University (JIF201047Y and JIF201036Y) and the key projects in the three-year plan of Shanghai municipal public health system (2023?2025) (GWVI-4).
CONFLICT OF INTEREST
The authors have no conflict of interest to report.
DATA AVAILABILITY
Data are available in a public, open access repository. All of the data were obtained from the UK Biobank database (https://www.ukbiobank.ac.uk/) with open access.
SUPPLEMENTARY MATERIAL
[1] The supplementary material is available in the electronic version of this article: https://dx.doi.org/10.3233/JPD-240097.
REFERENCES
[1] | Kalia LV and Lang AE. Parkinson’s disease. Lancet (2015) ; 386: : 896–912. |
[2] | Dorsey ER , Elbaz A , Nichols E , et al. Global, regional, and national burden of Parkinson’s disease, 1990–2016: a systematic analysis for the Global Burden of Disease Study 2016. Lancet Neurol (2018) ; 17: : 939–953. |
[3] | Postuma RB and Berg D. Advances in markers of prodromal Parkinson disease. Nat Rev Neurol (2016) ; 12: : 622–634. |
[4] | Zhang X , Molsberry SA , Pavlova M , et al. Association of sleepwalking and REM sleep behavior disorder with Parkinson disease in men. JAMA Network Open (2021) ; 4: : e215713–e215713. |
[5] | McMahon L , Blake C and Lennon O. A systematic review and meta-analysis of respiratory dysfunction in Parkinson’s disease. Eur J Neurol (2023) ; 30: : 1481–1504. |
[6] | Mehanna R and Jankovic J. Respiratory problems in neurologic movement disorders. Parkinsonism Relat Disord (2010) ; 16: : 628–638. |
[7] | Sudlow C , Gallacher J , Allen N , et al. UK biobank: an open access resource for identifying the causes of a wide range of complex diseases of middle and old age. PLoS Med (2015) ; 12: : e1001779. |
[8] | Caleyachetty R , Littlejohns T , Lacey B , et al. United Kingdom Biobank (UK Biobank) JACC focus seminar 6/8. J Am Coll Cardiol (2021) ; 78: : 56–65. |
[9] | Amaral AF , Strachan DP , Real FG , et al. Lower lung function associates with cessation of menstruation: UK Biobank data. Eur Respir J (2016) ; 48: : 1288–1297. |
[10] | Lenoir A , Fuertes E , Gómez-Real F , et al. Lung function changes over 8 years and testosterone markers in both sexes: UK Biobank. ERJ Open Research (2020) ; 6: : 00070–2020. |
[11] | Ma Y-H , Shen L-X , Li Y-Z , et al. Lung function and risk of incident dementia: A prospective cohort study of 431,834 individuals. Brain Behav Immun (2023) ; 109: : 321–330. |
[12] | Higbee DH , Granell R , Smith GD , et al. Prevalence, risk factors, and clinical implications of preserved ratio impaired spirometry: a UK Biobank cohort analysis. Lancet Respir Med (2022) ; 10: : 149–157. |
[13] | Berg D , Postuma RB , Adler CH , et al. MDS research criteria for prodromal Parkinson’s disease. Mov Disord (2015) ; 30: : 1600–1611. |
[14] | Schalkamp A-K , Peall KJ , Harrison NA , et al. Wearable movement-tracking data identify Parkinson’s disease years before clinical diagnosis. Nat Med (2023) ; 29: : 2048–2056. |
[15] | Heinzel S , Berg D , Gasser T , et al. Update of the MDS research criteria for prodromal Parkinson’s disease. Mov Disord (2019) ; 34: : 1464–1470. |
[16] | Hu Y , Hu K , Song H , et al. Infections among individuals with multiple sclerosis, Alzheimer’s disease and Parkinson’s disease. Brain Commun (2023) ; 5: : fcad065. |
[17] | Blauwendraat C , Reed X , Krohn L , et al. Genetic modifiers of risk and age at onset in GBA associated Parkinson’s disease and Lewy body dementia. Brain (2020) ; 143: : 234–248. |
[18] | Hughes AJ , Daniel SE , Ben-Shlomo Y , et al. The accuracy of diagnosis of parkinsonian syndromes in a specialist movement disorder service. Brain (2002) ; 125: : 861–870. |
[19] | Townsend P , Phillimore P , Beattie A . Health and deprivation: inequalities and the north. Bristol: Croom Helm (1988) . |
[20] | Ahmadi MN , Clare PJ , Katzmarzyk PT , et al. Vigorous physical activity, incident heart disease, and cancer: how little is enough? Eur Heart J (2022) ; 43: : 4801–4814. |
[21] | Fan M , Sun D , Zhou T , et al. Sleep patterns, genetic susceptibility, and incident cardiovascular disease: a prospective study of 385 292 UK biobank participants. Eur Heart J (2020) ; 41: : 1182–1189. |
[22] | Physical status: the use and interpretation of anthropometry. Report of a WHO Expert Committee, World Health Organ Tech Rep Ser (1995) ; 854: : 1–452. |
[23] | Amaral AF , Strachan DP , Burney PG , et al. Female smokers are at greater risk of airflow obstruction than male smokers. UK Biobank. Am J Respir Crit Care Med (2017) ; 195: : 1226–1235. |
[24] | Borghammer P . How does Parkinson’s disease begin? Perspectives on neuroanatomical pathways, prions, and histology. Mov Disord (2018) ; 33: : 48–57. |
[25] | Horsager J , Andersen KB , Knudsen K , et al. Brain-first versus body-first Parkinson’s disease: a multimodal imaging case-control study. Brain (2020) ; 143: : 3077–3088. |
[26] | Polatli M , Akyol A , Çildaǧ O , et al. Pulmonary function tests in Parkinson’s disease. Eur J Neurol (2001) ; 8: : 341–345. |
[27] | Okunoye O , Kojima G , Marston L , et al. Factors associated with hospitalisation among people with Parkinson’s disease–a systematic review and meta-analysis. Parkinsonism Relat Disord (2020) ; 71: : 66–72. |
[28] | Fall PA , Saleh A , Fredrickson M , et al. Survival time, mortality, and cause of death in elderly patients with Parkinson’s disease. A 9-year follow-up. Mov Disord (2003) ; 18: : 1312–1316. |
[29] | Monteiro L , Souza-Machado A , Valderramas S , et al. The effect of levodopa on pulmonary function in Parkinson’s disease: a systematic review and meta-analysis. Clin Ther (2012) ; 34: : 1049–1055. |
[30] | Sathyaprabha T , Kapavarapu P , Pal P , et al. Pulmonary functions in Parkinson’s disease. Indian J Chest Dis Allied Sci (2005) ; 47: : 251. |
[31] | Aquino YC , Cabral LM , Miranda NC , et al. Respiratory disorders of Parkinson’s disease. J Neurophysiol (2022) ; 127: : 1–15. |
[32] | D’Arrigo A , Floro S , Bartesaghi F , et al. Respiratory dysfunction in Parkinson’s disease: a narrative review. ERJ Open Res (2020) ; 6: : 00165–2020. |
[33] | Docu Axelerad A , Stroe AZ , Arghir OC , et al. Respiratory dysfunctions in Parkinson’s disease patients. Brain Sci (2021) ; 11: : 595. |
[34] | Pal PK , Sathyaprabha TN , Tuhina P , et al. Pattern of subclinical pulmonary dysfunctions in Parkinson’s disease and the effect of levodopa. Mov Disord (2007) ; 22: : 420–424. |
[35] | Braak H and Braak E. Pathoanatomy of Parkinson’s disease. J Neurol (2000) ; 247: : II3–II10. |

