
Relationships of B12 and Homocysteine with Outcomes in the SURE-PD, SURE-PD3, and STEADY-PDIII Trials
Abstract
Background:
DATATOP was a study of early Parkinson’s disease (PD) conducted in the 1980 s, before mandatory folic acid fortification in the United States. Our analysis of its baseline serum samples revealed a geometric mean vitamin B12 of 369 pg/mL and homocysteine (tHcy) of 9.5μmol/l. We also found that low B12 predicted greater worsening of ambulatory capacity (AC) and elevated tHcy (>15μmol/L) predicted greater declines in cognitive function.
Objective:
We sought to measure B12 and tHcy in contemporary trial participants with early PD who had not started dopaminergic treatment and to determine whether these analytes were associated with clinical progression.
Methods:
We measured B12 and tHcy from baseline and end-of-study blood samples from three recent clinical trials.
Results:
Baseline geometric mean B12 levels for these studies ranged from 484– 618 pg/ml and for tHcy ranged from 7.4– 10μmol/L. Use of B12-containing supplements ranged from 41– 61%, and those taking supplements had higher B12 and lower tHcy. Those who began levodopa, but were not taking B12-supplements, had greater end-of-study tHcy. There was no association of baseline tHcy > 15μmol/L with annualized change in Montreal Cognitive Assessment and no association of baseline B12 tertiles with change in AC.
Conclusions:
In these longitudinal trials, B12 levels were higher than for DATATOP, due in large part to increased B12-supplement intake, while tHcy levels were similar. Initiation of levodopa was associated with increases of tHcy in those not taking a B12-containing supplement. These smaller studies did not replicate prior findings of low B12 and elevated tHcy with features of progression, possibly due to higher baseline B12.
INTRODUCTION
Study of the variability of progression in Parkinson’s disease (PD) has been of great interest because it may identify reversible conditions that if recognized and treated, could slow disease progression. Converging lines of research have raised vitamin B12 as a possible disease modifier of PD. First, B12 defiency is common, affecting 10– 20% of people 60 years and older [1], and a meta-analysis has shown that serum B12 is lower in PD [2]. Moreover, B12 deficiency alone can cause multiple clinical features which overlap with expected manifestations of PD progression including cognitive, behavioral, neuromuscular and autonomic changes [3]. Also, low B12 has been associated with a number of features that are recognized in more advanced PD, including neuropathy, where it is cited as the most common cause [4], and cognitive impairment [5]. Interestingly, an epidemiology study found that longstanding elevated intake of B12 predicted a lower risk for developing PD [6]. Finally, experimental work has demonstrated that B12 reduces α-synuclein fibrillogenesis [7] and allosterically inhibits leucine-rich repeat kinase 2 (LRRK2) [8], an enzyme for which certain mutations are associated with increased kinase activity and dominantly inherited PD.
Vitamin B12 and folate are required as co-factor and co-substrate, respectively, for methionine synthase, the enzyme responsible for conversion of homocysteine to methionine. When either B12 or folate is deficient, total homocysteine (tHcy) levels increase. Interestingly, tHcy is an established modifier for a number of conditions [9] including dementia [10]. Regarding its particular relevance in PD, levels of tHcy increase soon after starting or increasing levodopa treatment [11] and elevated levels are associated with cognitive impairment and depression [12]. Moreover, both elevated tHcy and B12 deficiency have been associated with increases in the inflammatory and immune responses which could accelerate PD [13, 14].
Our recent investigation [15] of baseline serum samples in the DATATOP study [16], a clinical trial of early PD, showed 1) that the geometric mean B12 level at baseline was 369 pg/ml, 2) that mean tHcy was 9.5μmol/L, and 3) that those in the low B12 tertile developed more gait impairment as measured by greater increases in the ambulatory capacity score [17]. Of equal interest, we found that those with elevated tHcy, defined as > 15μmol/L, had greater declines in the Mini-Mental State Exam score (MMSE).
Low B12 can usually be treated by oral B12 supplementation and elevated tHcy levels can be reduced by B12, B6 and/or folic acid supplementation [9]. Since 1) the DATATOP study enrolled participants from 1987– 1988, prior to mandatory folic acid fortification in the United States (US) in 1998 and 2) US dietary surveys have shown increasing rates of vitamin supplement use over the past 4 decades [18], it is quite possible that B12 and tHcy levels differ in contemporary PD patients. We conducted this study to measure B12 and tHcy from participants from three recent clinical trials of early PD in order to understand the relationships of these analytes with supplement use and to test for their possible associations with gait and cognition impairment as observed in DATATOP.
METHODS
SURE-PD (ClinicalTrials.gov: NCT000833690) recruited from 2009– 2011 and enrolled 75 participants with early PD not requiring symptomatic treatment, although allowing treatment with type B monoamine oxidase inhibitor (MAO-Bi), and whose serum uric acid was below 6 mg/dl [19]. Participants were randomized to 1 of 3 treatment groups: placebo, inosine titrated to mildly elevate serum urate, and inosine titrated to moderately elevate urate. Participants were followed for up to 2 years using the Unified Parkinson’s Disease Rating Scale (UPDRS) and Montreal Cognitive Assessment (MoCA) as well as the time until the need for initiating dopaminergic therapy.
STEADY-PDIII (NCT02168842) recruited from 2014– 2015. It enrolled 336 participants with early PD not taking symptomatic treatments, although allowing treatment with amantadine [20]. Participants were randomized to isradipine 5 mg twice daily or placebo and followed up to 3 years using the UPDRS, Movement Disorder Society-UPDRS (MDS-UPDRS), MoCA, and time to initiate symptomatic treatment.
SURE-PD3 (NCT02642393) recruited from 2016– 2017 and enrolled 298 participants with early PD, not requiring symptomatic treatments, although allowing treatment with a MAO-Bi. Participants were randomized to inosine or placebo [21]. Based on a prespecified futility analysis, the study closed early with 92% of the randomized participants completing the amended study which was originally designed to be a 2-year study. Participants were followed using the MDS-UPDRS, MoCA, and time to initiate symptomatic treatment. In addition, 123I-Ioflupane SPECT scans (DaTscans) were obtained at baseline and study termination.
Plasma measurements
Baseline and end of study plasma samples were shipped from a central repository on dry ice. At UC Davis, the samples were thawed and separated for blinded analysis. B12 was measured by Abbott Alinity Chemiluminescent Microparticle Immunoassay [22]. Methylmalonic Acid (MMA) was measured using Liquid chromatography-tandem mass spectrometry [23]. tHcy was measured by high-performance liquid chromatography [24].
Supplement, dopaminergic, and metformin treatment reporting
As performed for the NET-PD LS1 study [25], we used the prospectively collected concomitant medication and supplement logs from the studies to identify the type, dose, and duration of oral multivitamin, B-complex and/or other B12 supplement for each participant at baseline as well as for starting supplements during the study. Moreover, since each study allowed participants to continue in the study after starting dopaminergic (dopamine agonist or carbidopa/levodopa) treatment, we identified the start date for those participants who began dopaminergic treatments. In order to allow for the effect of levodopa treatment on tHcy levels to reach a steady state, for this analysis, we included participants who began levodopa or dopamine agonist therapy >3 months prior to the end of the study, similar to a previous study [11]. Since use of metformin is associated with lower B12 levels [3], we also identified use of this medication at baseline.
Clinical rating scales
The UPDRS was used as the main rating scale in SURE-PD and STEADY-PDIII. The MDS-UPDRS, an updated PD rating scale, was used as the main clinical outcome measure in SURE-PD3 and was also used in STEADY-PDIII. Ambulatory capacity, a gait and stability rating scale, is defined as the sum of selected gait related items from the UPDRS [17]. Since the MDS-UPDRS is based on the UPDRS, an MDS-UPDRS ambulatory capacity score has been developed [26]. In STEADY-PDIII, we calculated ambulatory capacity using both scales. Since SURE-PD3 used the MDS-UPDRS exclusively, only the MDS-UPDRS ambulatory capacity is reported.
Genotyping
Genotyping data was available for SURE-PD3 and STEADY-PDIII. We extracted data for the common genetic causes of PD including glucocerebrosidase (GBA) SNP variants (rs2230288, rs368060, rs76563715) and the LRRK2 variants (rs34637584 and rs33995463) using the 2021 release of AMP-PD whole genome sequencing (WGS) data using PLINK 2.0 [27]. Because the methylenetetrahydrofolate reductase (MTHFR) SNP variant rs1801133 TT genotype is common and is associated with elevated tHcy levels, we also tested for this variant. Extracted genotypic data were converted to variant call format (VCF) using PLINK 2.0 and then exported for analyses using the vcfR and tidyverse R packages.
Statistical analyses
Statistical comparisons of baseline characteristics by baseline B12 tertiles were performed using one-way analysis of variance with Tukey’s studentized range test for continuous measures and Chi-square tests with Bonferroni adjustment for categorical measures. Mean baseline and final B12 and tHcy levels by 1) dopaminergic treatment initiation groups (no initiation, initiated dopamine agonist not including levodopa, initiated levodopa and MVI or B complex supplement, initiated levodopa but no MVI or B supplement) and 2) utilization of B12 supplements groups (no use during the study, MVI or B-complex with amount of B12 < 100μg at baseline, or B12 > 100μg at baseline, started supplement after baseline) were compared using one-way analysis of variance with Tukey’s studentized range test. Annualized changes in UPDRS scores, MDS-UPDRS scores, MoCA scores, and DaTscan striatal specific binding ratio were based on the change from baseline to the final visit, or in the case of UPDRS and MDS-UPDRS outcomes, the last visit prior to initiation of dopaminergic therapy. These rates were calculated as the change in score from baseline divided by the number of days between the two assessments multiplied by 365. Analysis of covariance was used to determine associations between these annualized changes and 1) baseline B12 tertiles and 2) baseline tHcy > 15μmol/L vs. <15μmol/L, adjusted for baseline value of the outcome, age, sex, and treatment group. Annualized change in ambulatory capacity and MoCA scores were considered the primary outcomes and the remaining were considered exploratory, thus there was no correction for multiple testing. Comparisons of age, sex, and genetic outcomes by baseline tHcy > 15 vs. ≤15μmol/L were performed using a t-test and chi-square tests. Analyses were performed using SAS version 9.4 and p-values < 0.05 were considered statistically significant.
Participants provided written informed consent for each of these studies according to the regulations of their local institutional review board (IRB). The UCSF IRB deemed this study exempt.
RESULTS
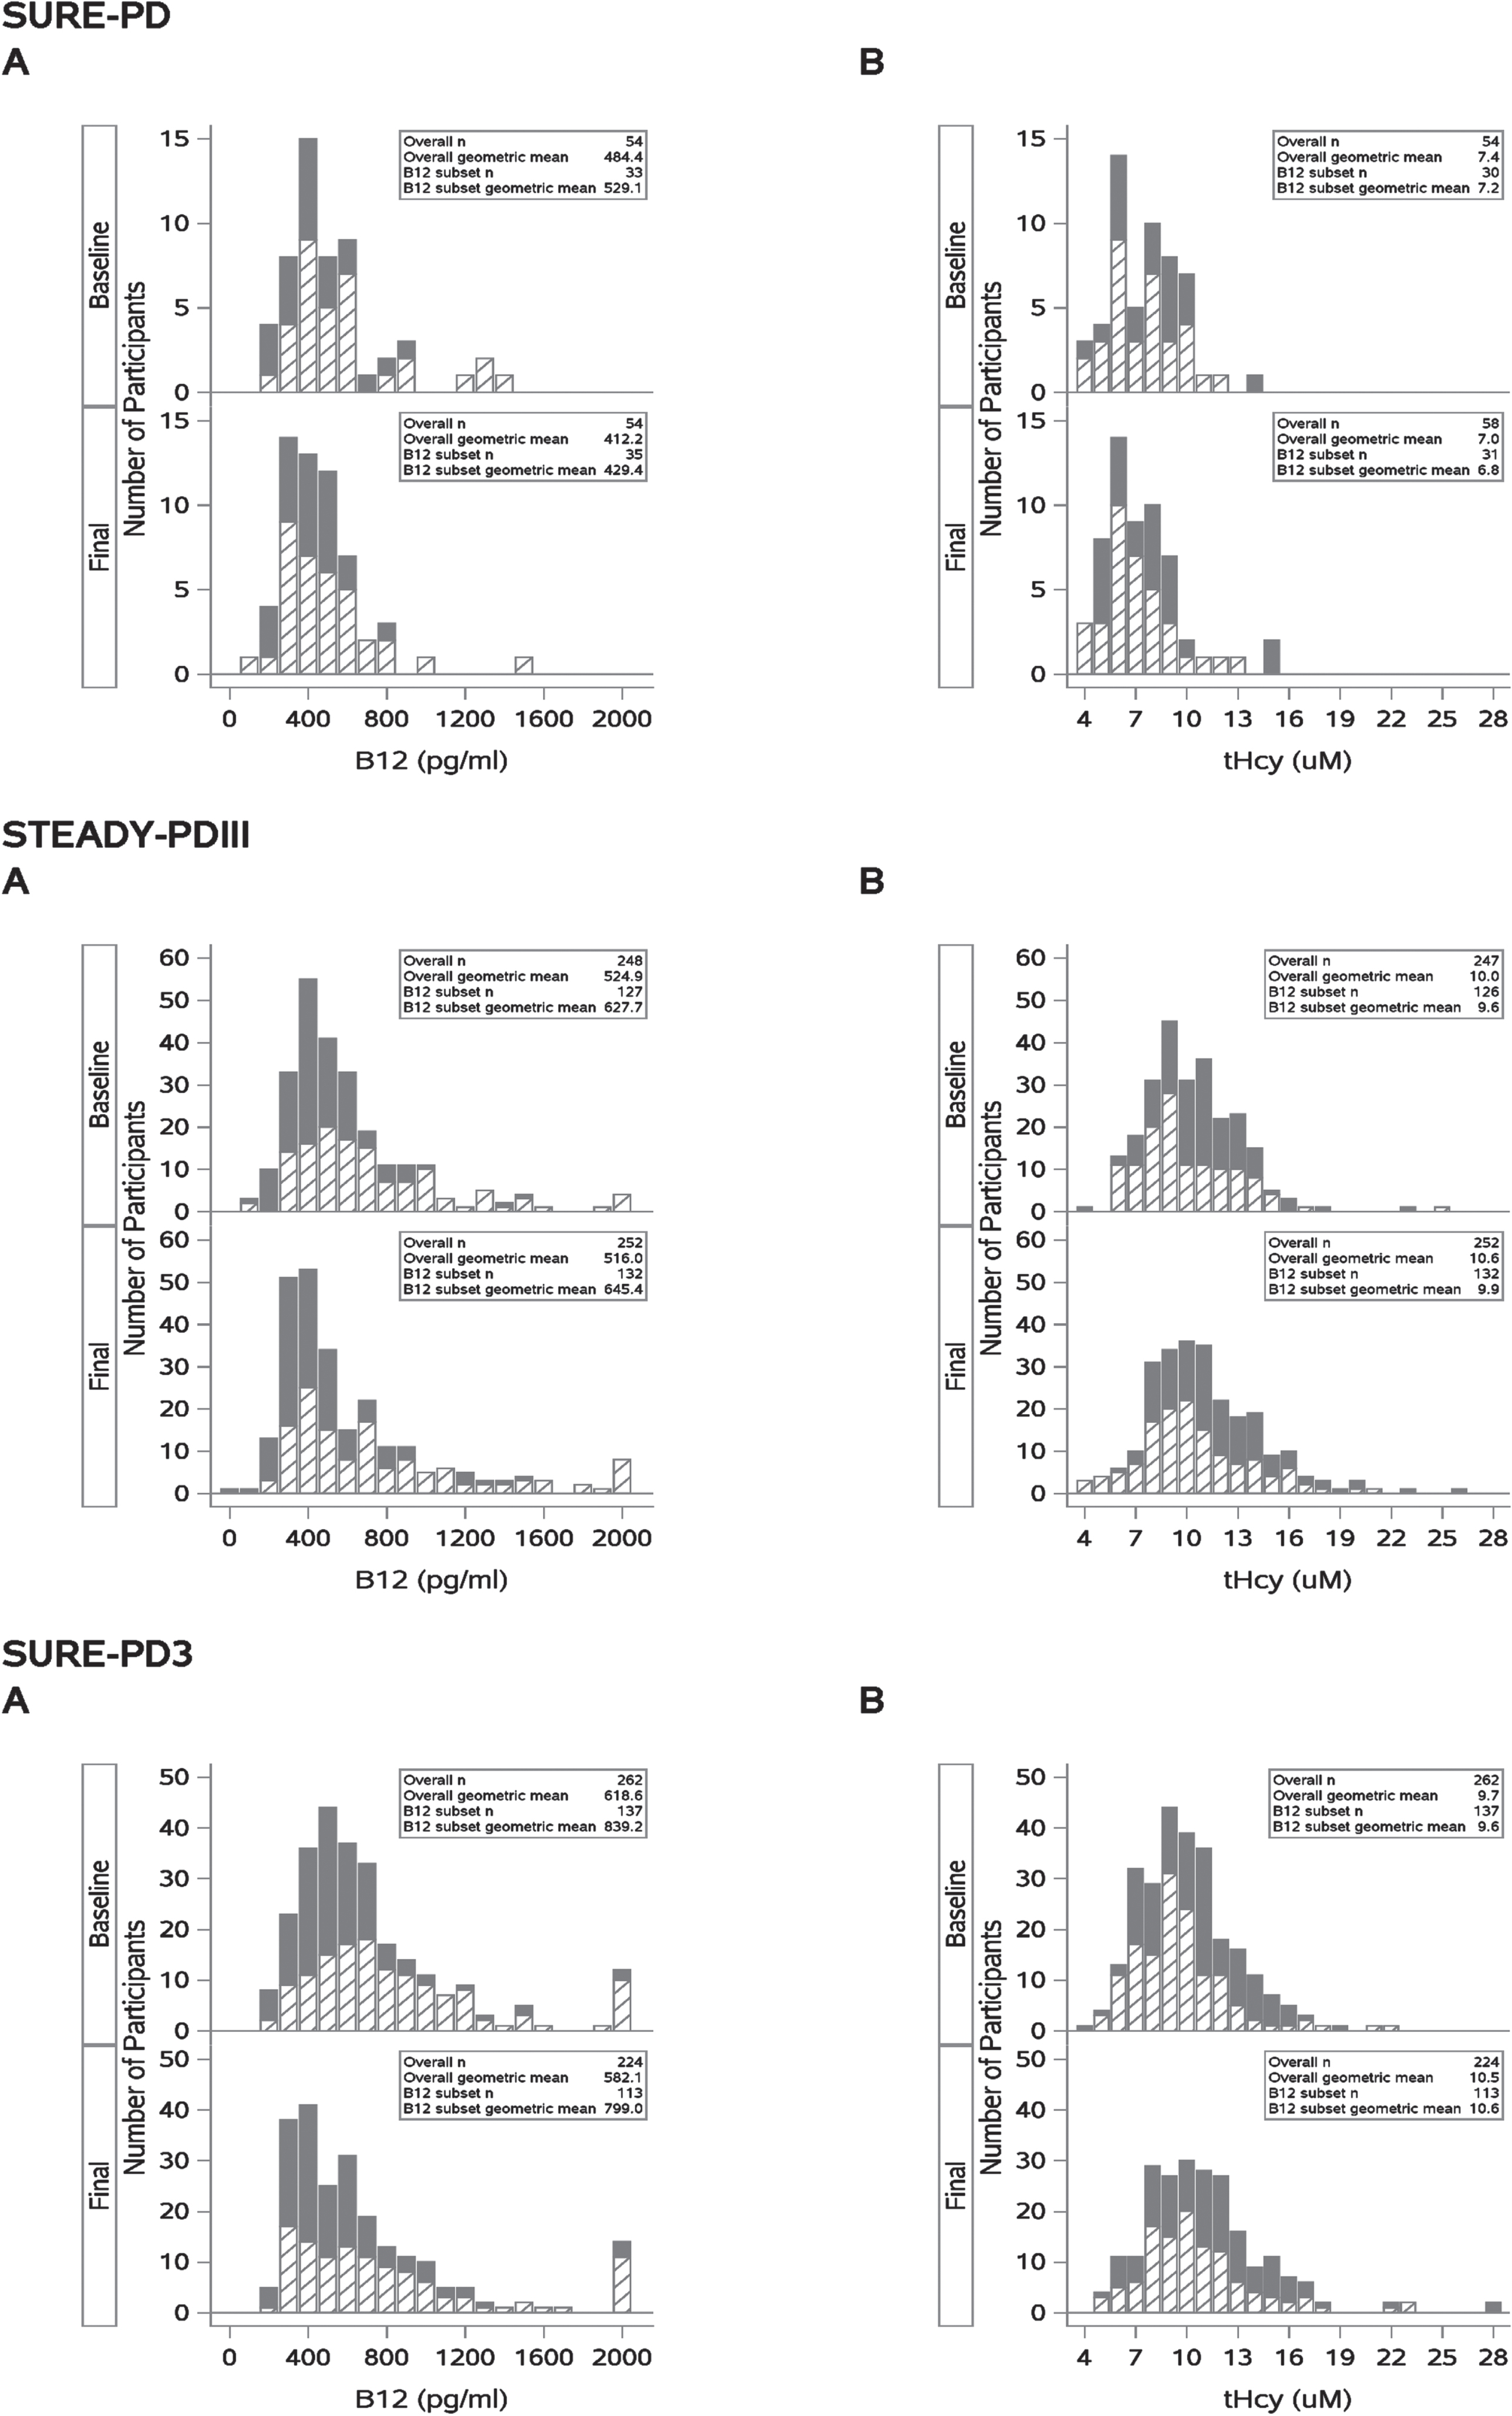
Baseline samples were available for 54/75 SURE-PD participants, 248/336 of STEADY-PDIII, and 262/298 SURE-PD3 participants. Baseline and end of study distributions for vitamin B12 and tHcy are displayed in Fig. 1. At baseline, the geometric mean B12 levels for SURE-PD, STEADY-PDIII, and SURE-PD3 were 484, 524, and 618 pg/ml, respectively. The geometric means for baseline tHcy were 7.4, 10.0, and 9.7μmol/L, while the geometric means for MMA were 0.16, 0.18, and 0.18μmol/L respectively. Over the course of each study, the geometric mean B12 levels declined 37 pg/ml/year in SURE-PD, 3 pg/ml/year in STEADY-PDIII, and 18 pg/ml/year in SURE-PD3. In contrast, the tHcy levels increased 0.2μmol/L/year in STEADY-PDIII and 0.4μmol/L/year in SURE-PD3, but declined by 0.2μmol/L/year in SURE-PD. MMA levels were stable over the course of these studies and because only a small number (6 participants in STEADY-PDIII and 7 in SURE-PD3) were elevated (>0.4μmol/L) at baseline, MMA levels were not included in the subsequent analysis.
Fig. 1
Solid bars represent individuals who did not report any use of B12 supplements (Overall N). Hashed bars represent those reporting use of B12 supplements (B12 subset) during study. These distributions show that B12 containing supplement use is associated with increased B12 levels (rightward shift, A) and with reduced homocysteine levels (leftward shift, B).
Prevalence of low B12 or elevated tHcy status at baseline
In SURE-PD, STEADY-PDIII, SURE-PD3, 7.4%, 5.2%, and 3.1% of participants, respectively, had baseline borderline low B12 (<250 pg/ml) levels while 3.7%, 3.6%, and 1.1% had B12 deficiency (<212 pg/ml). For baseline tHcy, 5% of participants in both STEADPY-PDIII and SURE-PD3 had elevated levels while none in SURE-PD had elevatedtHcy.
Associations of B12 status with baseline features
Table 1 shows the baseline characteristics according to B12 tertiles for each study. The expected inverse associations of B12 tertiles with tHcy were significant in STEADY-PDIII and SURE-PD3 and with MMA in SURE-PD3. In STEADY-PDIII and SURE-PD3, there were also the expected associations of reported use of supplements containing B12 with B12 tertiles. In SURE-PD3, the baseline MDS-UPDRS part 3 score was actually lower in the low B12 tertile compared to the middle tertile. Otherwise, the baseline characteristics were similar across B12 tertiles. No associations for the hematological measurements of mean corpuscular volume or hematocrit with B12 tertiles were observed (not shown). Analysis for common PD mutations in STEADY-PDIII showed 1.6% participants with LRRK2 mutations and 3.2% with GBA mutations and in SURE-PD3, 1.1% with LRRK2 mutations and 4.5% with GBA mutations (not shown). Mutations were observed in each tertile of these 2 studies and appeared to be randomly distributed.
Table 1
Baseline characteristics of participants according to tertiles of baseline B12 levels
| SURE-PD | |||
| Baseline B12 Tertile | |||
| 1st (≤387 pg/ml) | 2nd (388– 569 pg/ml) | 3rd (>569 pg/ml) | |
| Number of subjects | 18 | 18 | 18 |
| Age, y | 63.9 (9.3) | 59.7 (11.3) | 59.8 (11.9) |
| Time since diagnosis, y | 1.1 (1.0) | 1.2 (1.0) | 0.8 (1.2) |
| Female, n (%) | 10 (55.6) | 10 (55.6) | 13 (72.2) |
| Total UPDRS | 22.7 (13.1) | 20.7 (9.2) | 21.9 (9.1) |
| UPDRS Part 3 (Motor) | 16.6 (9.9) | 14.6 (7.4) | 16.2 (7.7) |
| Ambulatory capacity | 0.7 (0.9) | 0.8 (0.7) | 0.9 (1.2) |
| Montreal cognitive assessment score | 27.0 (2.2) | 27.6 (2.0) | 28.1 (1.6) |
| Creatinine, mg/dL | 0.8 (0.2) | 0.7 (0.1) | 0.8 (0.1) |
| Homocysteine, μmol/L | 7.8 (2.1) | 6.8 (1.8) | 8.4 (2.2) |
| Methylmalonic acid, μmol/L | 0.17 (0.03) | 0.15 (0.04) | 0.18 (0.04) |
| Use of multivitamin or B complex with B12≤100mcg, n (%) | 8 (44.4) | 11 (61.1) | 12 (66.7) |
| Use of vitamin B12 > 100mcg, n (%) | 0 (0.0) | 1 (5.6) | 1 (5.6) |
| Use of monoamine oxidase B inhibitor, n (%) | 7 (28.9) | 4 (22.2) | 4 (22.2) |
| Use of metformin, n (%) | 1 (5.6) | 1 (5.6) | 0 (0.0) |
| STEADY-PDIII | |||
| Baseline B12 Tertile | |||
| 1st (≤411 pg/ml) | 2nd (412– 607 pg/ml) | 3rd (>607 pg/ml) | |
| Number of subjects | 82 | 83 | 83 |
| Age, y | 62.8 (7.8) | 61.4 (10.1) | 63.7 (8.1) |
| Time since diagnosis, y | 0.9 (0.8) | 0.7 (0.6) | 0.9 (0.8) |
| Female, n (%) | 25 (30.5) | 27 (32.5) | 32 (38.6) |
| Total MDS-UPDRS | 32.3 (11.0) | 33.0 (12.2) | 32.3 (11.3) |
| MDS-UPDRS ambulatory capacity | 0.8 (0.8) | 0.7 (0.8) | 0.9 (0.9) |
| Total UPDRS | 23.4 (8.0) | 23.8 (9.1) | 22.5 (8.2) |
| UPDRS Part 3 (Motor) | 17.8 (6.9) | 17.6 (7.1) | 16.5 (6.6) |
| UPDRS ambulatory capacity | 0.8 (0.8) | 0.8 (0.9) | 1.0 (1.0) |
| Montreal cognitive assessment score | 28.2 (1.5) | 28.2 (1.4) | 28.0 (1.5) |
| Creatinine, mg/dL | 0.9 (0.2) | 0.9 (0.2) | 0.9 (0.2) |
| Homocysteine, μmol/L | 11.5 (3.0)ab | 10.1 (2.3)a | 9.3 (2.5)b |
| Methylmalonic acid, μmol/L | 0.24 (0.15) | 0.18 (0.05) | 0.16 (0.04) |
| Use of multivitamin or B complex with B12 < 100mcg, n (%) | 12 (14.6)ab | 28 (33.7)ac | 53 (63.9)bc |
| Use of vitamin B12 > 100mcg, n (%) | 1 (1.2) | 0 (0.0) | 6 (7.2) |
| Use of metformin, n (%) | 8 (9.8) | 4 (4.8) | 1 (1.2) |
| SURE-PD3 | |||
| Baseline B12 Tertile | |||
| 1st (≤484 pg/ml) | 2nd (485– 721 pg/ml) | 3rd (>721 pg/ml) | |
| Number of subjects | 87 | 88 | 87 |
| Age, y | 62.6 (9.8) | 62.9 (9.8) | 64.0 (9.7) |
| Female, n (%) | 34 (39.1)b | 44 (50.0) | 55 (63.2)b |
| Total MDS-UPDRS | 30.7 (14.2) | 33.4 (11.3) | 33.0 (11.9) |
| MDS-UPDRS Part 3 (Motor) | 20.0 (7.5)a | 23.3 (9.0)a | 22.0 (8.8) |
| MDS-UPDRS Ambulatory capacity | 0.9 (1.0) | 0.9 (1.0) | 1.0 (1.0) |
| Montreal cognitive assessment score | 27.8 (1.8) | 27.4 (1.6) | 27.6 (2.2) |
| Creatinine, mg/dL | 0.9 (0.2) | 0.8 (0.2) | 0.9 (0.2) |
| Homocysteine, μmol/L | 11.4 (3.2)ab | 9.8 (2.2)a | 9.0 (2.4)b |
| Methylmalonic acid, μmol/L | 0.24 (0.09)ab | 0.18 (0.06)a | 0.17 (0.04)b |
| Use of multivitamin or B complex with B12 < 100mcg, n (%) | 17 (19.5)ab | 32 (36.4)ac | 50 (57.5)bc |
| Use of vitamin B12 > 100mcg, n (%) | 2 (2.3)b | 6 (6.8)c | 29 (33.3)bc |
| Use of monoamine oxidase B inhibitor, n (%) | 34 (39.1) | 33 (37.5) | 31 (35.6) |
| Use of metformin, n (%) | 2 (2.3) | 4 (4.6) | 3 (3.5) |
| DaTscan striatal specific binding ratio | 1.6 (0.5) | 1.6 (0.5) | 1.5 (0.4) |
Results are mean (standard deviation) values unless otherwise indicated. abcMatching symbols indicate statistically significant pairwise differences (p < 0.05) using Tukey’s studentized range test based on one-way analysis of variance and Bonferroni adjustment for Chi-square test.
Vitamin supplement use and associations with baseline and end of study B12 and tHcy levels
At baseline, the reported use of any vitamin supplement containing B12 was 61% in SURE-PD, 41% in STEADY-PDIII, and 52% in SURE-PD3. Across all three studies, use of a multivitamin or B complex vitamin (MVI/B-complex) was much more common than supplements containing only B12 (Table 1). Analysis according to use vs. non-use of B12 containing supplements (Fig. 1, Table 2), showed that mean B12 for taking MVI/B-complex supplements at baseline ranged from 585– 781 pg/ml, compared to 456– 563 pg/ml for those not taking supplements. Although B12 levels declined at the end of each study, they remained statistically higher in STEADY-PDIII for those taking MVI/B-complex supplements. Not surprisingly, participants who took supplements containing > 100μg of B12 had even higher B12 levels (>200 pg/ml) at baseline compared to those taking no supplements. Moreover, across all three studies, tHcy was lower at baseline and end of study for those taking MVI/B-complex at baseline compared to those not taking supplements. In SURE-PD3, those taking B12 > 100μg at baseline had lower tHcy than those taking B12≤100μg and those not taking supplements, and in STEADY-PDIII, the end of study tHcy was lower in those taking MVI/B-complex supplements than those not taking supplements. Finally, for those participants who began a B12 containing supplement during the course of the trials, there were increases in mean B12 of ≥200 pg/ml and reductions in tHcy of ≥0.6μmol/L at the end of thestudy.
Table 2
Mean B12 and Homocysteine (tHcy) levels at baseline and end of study according to use or non-use of B12 supplements
| No use of B12 supplements during study | MVI or B complex with B12 ≤100μg use at baseline | B12 > 100μg use at baseline | Started one of these supplements after baseline | p | |
| SURE-PD | n = 23 | n = 31 | n = 2 | n = 2 | |
| B12 (pg/ml) | |||||
| Baseline | 456 (188) | 585 (304) | 908 (479) | 262 (0.0) | 0.06 |
| Final | 411 (145) | 486 (280) | 550 (63) | 521 (249) | 0.60 |
| tHcy (μM) | |||||
| Baseline | 7.9 (2.1) | 7.4 (2.0) | 7.6 (3.9) | 10.4 (0.0) | 0.51 |
| Final | 7.8 (2.7) | 7.1 (2.1) | 4.9 (1.0) | 8.7 (0.004) | 0.27 |
| STEADY-PD III | n = 121 | n = 95 | n = 8 | n = 30 | |
| B12 (pg/ml) | |||||
| Baseline | 473 (213)ab | 781 (423)ae | 953 (344)bf | 483 (230)ef | <0.001 |
| Final | 465 (254)ac | 756 (477)a | 770 (450) | 812 (543)c | <0.001 |
| tHcy (μM) | |||||
| Baseline | 10.7 (2.6) | 9.7 (2.5) | 8.4 (2.0) | 10.9 (3.8) | 0.01 |
| Final | 11.9 (4.2)a | 10.5 (3.0)a | 9.7 (2.1) | 10.2 (4.0) | 0.01 |
| SURE-PD3 | n = 125 | n = 85 | n = 37 | n = 15 | |
| B12 (pg/ml) | |||||
| Baseline | 563 (292)ab | 749 (322)ade | 1213 (533)bd | 425 (148)e | <0.001 |
| Final | 569 (334)b | 655 (355)d | 1155 (613)bdf | 680 (465)f | <0.001 |
| tHcy (μM) | |||||
| Baseline | 10.6 (2.8)b | 9.8 (2.7)d | 8.1 (1.7)bdf | 11.6 (3.8)f | <0.001 |
| Final | 11.4 (3.8) | 10.8 (3.9) | 9.8 (2.2) | 11.0 (2.8) | 0.15 |
Mean (Standard Deviation). abcdefMatching symbols indicate statistically significant differences (p < 0.05) using Tukey’s studentized range test based on one-way analysis of variance.
End of study B12 and tHcy levels according start of dopaminergic treatment
The design of these studies allowed participants to begin dopaminergic treatments during the course of the study if clinically indicated. For STEADY-PDIII and SURE-PD3, those who began levodopa≥3 months prior to study termination had greater increases of tHcy compared to those who did not begin symptomatic treatment (not shown). This observation motivated us to analyze B12 and tHcy levels in those who initiated levodopa according to baseline use or non-use of an MVI/B-complex supplement. In STEADY-PDIII and SURE-PD3, for those who began levodopa during the study, those not taking an MVI/B-complex at baseline had lower B12 levels at baseline and both lower B12 and higher tHcy levels at the end of these studies compared to those taking a MVI/B-complex (Table 3). Across the three studies, in contrast to those who started levodopa, for those starting a dopamine agonist, end of study mean tHcy levels were similar to those who did not start dopaminergic treatment.
Table 3
Mean B12 and Homocysteine (tHcy) levels at baseline and end of study according to initiation of dopaminergic treatment prior to end of study
| No initiation of Levodopa or dopamine agonist treatment | Initiated dopamine agonist not including Levodopa | Initiated Levodopa and MVI or B complex supplement user | Initiated Levodopa but no MVI or B supplement | p | |
| SURE-PD | n = 30 | n = 6 | n = 11 | n = 5 | |
| B12 (pg/ml) geometric mean | |||||
| Baseline | 472.5 | 407.4 | 539.2 | 519.6 | 0.62 |
| Final | 370.4 | 338.3 | 512.8 | 570.5 | 0.08 |
| tHcy (μmol/L) | |||||
| Baseline | 7.2 (1.8) | 9.0 (2.3) | 7.7 (2.5) | 8.8 (1.5) | 0.13 |
| Final | 6.7 (2.1)a | 8.4 (3.3) | 7.3 (1.9) | 9.8 (3.2)a | 0.04 |
| STEADY-PD III | n = 46 | n = 25 | n = 76 | n = 79 | |
| B12 (pg/ml) geometric mean | |||||
| Baseline | 503.7b | 480.9c | 646.0bcd | 444.7d | <0.001 |
| Final | 507.9 | 515.1 | 656.1d | 384.1d | <0.001 |
| tHcy (μmol/L) | |||||
| Baseline | 10.1 (3.2) | 10.1 (3.5) | 9.9 (2.6) | 10.7 (2.6) | 0.40 |
| Final | 10.3 (2.9)a | 10.7 (3.4) | 10.7 (3.3)d | 12.5 (4.7)ad | 0.01 |
| SURE-PD3 | n = 71 | n = 25 | n = 61 | n = 54 | |
| B12 (pg/ml) geometric mean | |||||
| Baseline | 606.1 | 633.6 | 718.7d | 507.8d | 0.003 |
| Final | 628.9a | 585.5 | 692.1d | 465.3ad | 0.001 |
| tHcy (μmol/L) | |||||
| Baseline | 9.9 (2.8) | 10.4 (2.6) | 9.3 (2.6)d | 10.8 (2.7)d | 0.02 |
| Final | 10.3 (3.7)a | 10.1 (2.9)c | 10.6 (3.1)d | 12.4 (3.9)acd | 0.004 |
abcdMatching symbols indicate statistically significant pairwise differences (p < 0.05) using Tukey’s studentized range test based on one-way analysis of variance.
Associations of baseline B12 status with clinical outcomes
Table 4 shows the annualized change in outcome scores in each study according to baseline B12 tertiles. The UPDRS and MDS-UPDRS annualized changes are based on the last visit prior to starting dopaminergic treatment. For SURE-PD, although the annualized changes for total UPDRS, motor UPDRS, and ambulatory capacity in the first tertile were greater, these were not significantly different from the second and third tertiles. For STEADY-PDIII and SURE-PD3, the annualized changes in outcomes according to baseline B12 tertiles were similar, although the change in total UPDRS score was lower in the first tertile compared to the combined second and third tertiles in STEADY-PDIII. For SURE-PD3, where baseline and end of study DaTscans were obtained, although there was a trend towards greater annualized decline in striatal uptake in the low B12 tertile, this difference was not significant.
Table 4
Adjusted mean (standard error) annualized change in outcomes according to tertiles of baseline B12 levels
| SURE-PD | |||
| Baseline B12 Tertile | |||
| 1st (≤387 pg/ml) (n = 12) | 2nd (388– 569 pg/ml) (n = 18) | 3rd (>569 pg/ml) (n = 14) | |
| Total UPDRS | 14.0 (5.5) | 2.2 (4.3) | 7.4 (5.0) |
| UPDRS Part 1 (Mental) | 0.9 (0.9) | 0.1 (0.7) | 0.4 (0.9) |
| UPDRS Part 2 (ADL) | 5.1 (1.6) | 1.4 (1.3) | 4.3 (1.5) |
| UPDRS Part 3 (Motor) | 8.6 (4.4) | 0.6 (3.5) | 2.4 (4.0) |
| UPDRS ambulatory capacity | 1.6 (0.6) | 0.6 (0.5) | 0.8 (0.6) |
| Montreal cognitive assessment score | 0.8 (0.6) | 0.6 (0.4) | 0.3 (0.5) |
| STEADY-PDIII | |||
| Baseline B12 Tertile | |||
| 1st (≤411 pg/ml) (n = 66) | 2nd (412– 607 pg/ml) (n = 58) | 3rd (>607 pg/ml) (n = 61) | |
| Total MDS-UPDRS | 7.0 (1.3) | 9.6 (1.4) | 8.8 (1.3) |
| MDS-UPDRS Part 1 (Mental) | 0.6 (0.5) | 0.4 (0.5) | 0.7 (0.5) |
| MDS-UPDRS Part 2 (ADL) | 2.1 (0.4) | 2.5 (0.5) | 2.9 (0.4) |
| MDS-UPDRS Part 3 (Motor) | 4.2 (1.0) | 6.8 (1.0) | 5.2 (1.0) |
| MDS-UPDRS ambulatory capacity | 0.5 (0.2) | 0.5 (0.2) | 0.6 (0.2) |
| Total UPDRS | 5.6 (1.1)a | 8.4 (1.1) | 8.2 (1.1) |
| UPDRS Part 1 (Mental) | 0.2 (0.2) | 0.4 (0.2) | 0.3 (0.2) |
| UPDRS Part 2 (ADL) | 2.5 (0.4) | 2.8 (0.4) | 3.4 (0.4) |
| UPDRS Part 3 (Motor) | 3.0 (0.8) | 5.2 (0.9) | 4.4 (0.8) |
| UPDRS ambulatory capacity | 0.7 (0.2) | 0.7 (0.2) | 0.7 (0.2) |
| Montreal cognitive assessment score | 0.09 (0.1) | – 0.04 (0.1) | – 0.03 (0.1) |
| SURE-PD3 | |||
| Baseline B12 Tertile | |||
| 1st (≤484 pg/ml) (n = 57) | 2nd (485– 721 pg/ml) (n = 65) | 3rd (>721 pg/ml) (n = 66) | |
| Total MDS-UPDRS | 7.1 (1.8) | 9.0 (1.6) | 10.0 (1.7) |
| MDS-UPDRS Part 1 (Mental) | 0.7 (0.7) | 0.1 (0.6) | 1.1 (0.7) |
| MDS-UPDRS Part 2 (ADL) | 1.6 (0.5) | 2.7 (0.5) | 2.4 (0.5) |
| MDS-UPDRS Part 3 (Motor) | 4.6 (1.1) | 6.3 (1.1) | 6.5 (1.1) |
| MDS-UPDRS ambulatory capacity | 0.1 (0.2) | 0.8 (0.2) | 0.4 (0.2) |
| Montreal cognitive assessment score | 0.1 (0.2) | 0.6 (0.2) | 0.3 (0.2) |
| DaTscan striatal specific binding ratio | – 0.16 (0.02) | – 0.15 (0.02) | – 0.14 (0.02) |
Models are adjusted for baseline value of the outcome, age, sex, and treatment group. Annualized change in UPDRS or MDS-UPDRS scores based on visits prior to initiation of levodopa or dopamine agonist treatment. ap < 0.05 compared with combined second and third tertiles.
Because baseline geometric mean B12 levels were substantially higher in these studies compared to the DATATOP study, we also examined mean annualized changes in UPDRS or MDS-UPDRS and ambulatory capacity prior to dopaminergic treatment according to B12 tertile at baseline, using the low tertile cutoff from DATATOP of <317 pg/ml. Although the change in ambulatory capacity score was numerically higher for SURE-PD and STEADY-PDIII, the differences were not significant (not shown).
Association of tHcy with MoCA
Unexpectedly, when mean annualized changes in MoCA were analyzed according to baseline tHcy (Table 5), non-significant increases (consistent with improving cognitive function) were observed in participants with tHcy > 15μmol/L in STEADY-PDIII and SURE-PD3 compared to those with tHcy≤15μmol/L. (There were no participants with elevated tHcy in SURE-PD.) Of those participants with tHcy > 15μmol/L, 31% in STEADY-PD III and 27% in SURE-PD3, had B12 levels <250 pg/ml at baseline. We then tested whether elevated tHcy was associated with age, sex or MTHFR CC77T TT genotype, which causes elevated tHcy, but no associations were observed (Table 6).
Table 5
Adjusted mean (standard error) annualized change in outcomes according to cutoffs of baseline tHcy levels
| Baseline tHcy (μM) | |||
| >15 | ≤15 | p | |
| STEADY-PD III | n = 13 | n = 235 | |
| Total UPDRS | 5.1 (4.1) | 8.8 (1.0) | 0.36 |
| UPDRS Part 1 (Mental) | – 0.6 (0.6) | 0.2 (0.2) | 0.21 |
| UPDRS Part 2 (ADL) | 2.5 (1.6) | 3.1 (0.4) | 0.75 |
| UPDRS Part 3 (Motor) | 3.0 (3.0) | 5.6 (0.7) | 0.39 |
| UPDRS ambulatory capacity | 1.0 (0.7) | 0.8 (0.2) | 0.79 |
| Montreal cognitive assessment score | 0.2 (0.2) | 0.002 (0.04) | 0.33 |
| SURE-PD3 | n = 14 | n = 248 | |
| Total MDS-UPDRS | 0.8 (13.9) | 11.3 (3.3) | 0.46 |
| MDS-UPDRS Part 1 (Mental) | – 4.1 (2.8) | 0.2 (0.7) | 0.14 |
| MDS-UPDRS Part 2 (ADL) | 2.3 (3.5) | 2.4 (0.8) | 0.97 |
| MDS-UPDRS Part 3 (Motor) | 2.0 (10.1) | 8.7 (2.4) | 0.52 |
| MDS-UPDRS ambulatory capacity | 0.3 (2.0) | 0.7 (0.5) | 0.85 |
| Montreal cognitive assessment score | 1.1 (0.5) | 0.3 (0.1) | 0.09 |
Models are adjusted for baseline value of the outcome, age, sex, creatinine, and treatment group.
Table 6
Demographics and Genetic Outcomes According to Cutoffs of Baseline Homocysteine (tHcy) Levels
| STEADY-PD III | SURE-PD3 | |||||
| Baseline tHcy (μM) | Baseline tHcy (μM) | |||||
| >15 (n = 13) | ≤15 (n = 235) | p | >15 (n = 14) | ≤15 (n = 248) | p | |
| Age, y | 62.6 (7.5) | 62.6 (8.8) | 0.98 | 65.5 (6.3) | 63.0 (9.9) | 0.36 |
| Female, n (%) | 2 (15.4) | 82 (34.9) | 0.23 | 4 (28.6) | 129 (52.0) | 0.09 |
| rs1801133, n (%) | (n = 11) | (n = 205) | 0.86 | (n = 14) | (n = 231) | 0.24 |
| CC | 4 (36) | 85 (41) | 6 (43) | 105 (45) | ||
| CT | 5 (45) | 94 (46) | 8 (57) | 94 (41) | ||
| TT | 2 (19) | 26 (13) | 0 (0.0) | 32 (14) | ||
DISCUSSION
This study measured blood B12, tHcy and MMA levels from three similarly designed contemporary clinical trials of early PD and showed that mean B12 levels were higher and B12 deficiency was less common compared to the DATATOP study conducted decades earlier. Unlike DATATOP, elevated tHcy at baseline was not associated with more rapid worsening of cognitive function as measured by the MoCA.
Moreover, the association of greater worsening of gait as measured by the ambulatory capacity score according to B12 tertiles observed in DATATOP was not replicated in this study. We suspect that this was because substantially higher mean B12 levels in these contemporary participants shifted the B12 tertile thresholds higher and reduced the power to detect a difference. It is also likely that differences in study design, whereby investigators initiated dopaminergic therapy after modest worsening of UPDRS scores, reduced the power to detect an association. These interpretations are supported by the trends seen in the SURE-PD study where the mean B12 level was lower than in the other studies, and the changes in UPDRS were greater before participants started dopaminergic treatment (Table 4). The numerical trend for smaller declines in DaTscan striatal specific binding in SURE-PD3 in higher B12 tertiles, provides intriguing support for the hypothesis that higher B12 levels may slow nigro-striatal neurodegeneration, possibly related to inhibiting α-synuclein fibrillogenesis [7] and LRRK2 activity [8].
In these three studies, use of vitamin supplements containing B12, ranged from 41– 61%, similar to national surveys of MVI use [18] and to a recent study of early PD in North America [25]. The geometric mean B12 levels ranged from 484– 618 pg/ml and were substantially higher than that of 369 pg/ml in DATATOP. Since B12 levels were higher in those taking supplements, the higher mean levels are likely due in large part to MVI supplement use.
With aging, modest declines of B12 levels are expected. One study of healthy aging found a mean annualized decline of 5 pg/ml [28], The observed annual declines of 19 pg/ml/year in SURE-PD3 and 37 pg/ml/year in SURE-PD were substantially higher than expected in healthy aging, as has previously been reported in PD [29], and may relate to changes in dietary/supplement intake during the course of these studies, changes in gastrointestinal absorption over time, and/or to specific effect of levodopa therapy on B12 levels, as has been reported [11] and for which trends were observed in STEADY-PDIII and SURE-PD3 (Table 3, initiated levodopa but no MVI/B supplement).
While B12 levels in these studies were higher than in DATATOP, the geometric mean for baseline tHcy, which ranged from 7.4– 10μmol/L, was similar to 9.5μmol/L in DATATOP. Moreover, the fraction of participants with elevated tHcy was only modestly lower in STEADY-PDIII and SURE-PD3 compared to DATATOP (5% vs. 7%). Large surveys of nutritional status in the US conducted after mandated folic acid fortification have shown that the geometric mean tHcy gradually increases about 0.5μmol/L per decade from age 40 and by age 60 is 9.3 for men and 7.9μmol/L for women [30].
After age 60, tHcy increases more rapidly [30]. Aside from age, other factors associated with elevated tHcy levels include certain medical conditions (such as atherosclerosis, renal insufficiency, hypothyroidism), vitamin deficiencies (B12, B6, and/or folate), and genetic variants [11]. Consistent with other studies [31], we did not find a higher frequency of the MTHFR CC77T TT genotype in those with tHcy >15μmol/L. Thus, since B12 levels were higher across all three studies, the explanation of a similar rate of elevated tHcy at baseline in STEADY-PDIII and SURE-PD3 is uncertain but might relate to insufficiently elevated B12 levels as suggested by the lower level of tHcy in the B12 >100μg supplement group in SURE-PD3 (Table 2) or other factors that affect tHcy levels.
The design of these studies allowed testing for an association of starting dopaminergic treatment with changes in B12 and tHcy, and our analysis revealed a dynamic relationship of MVI/B-complex use and levodopa use with tHcy levels. We found that starting treatment with levodopa was associated with increases in tHcy, as previously reported [11], but in STEADY-PDIII and SURE-PD3, the expected increase in tHcy was largely prevented in those taking an MVI/B-complex throughout the study (Table 3).
In contrast to the finding of an association of elevated tHcy with annualized worsening in MMSE scores in DATATOP [3], we did not find that baseline elevated tHcy predicted greater declines in the MoCA score. In fact, in these 3 trials there was no decline in MoCA scores. Since cognitive function is expected to worsen over time, the explanation for this result is uncertain but may reflect practice effects (the MoCA was performed 4 times over 3 years in STEADY-PDIII compared to 4 times over 2-year period in SURE-PD3), reduced sensitivity of the MoCA compared to the MMSE to detect cognitive change when administered longitudinally [32], cognitive improvements after starting dopaminergic treatments [33], fairly short period of longitudinal follow-up, and/or protective benefits from greater mean B12 levels.
Interestingly, elevated tHcy and cognitive impairment in PD have been associated with frontal cortical thinning [34]. Although the relationship of elevated tHcy with development of cognitive impairment is robust [10, 12, 35], the benefit of B-vitamin supplementation in preventing development of cognitive impairment has not been established, although some benefit was reported in one cohort of patients with MCI and tHcy >11.3μmol/L [36] as well as a recent study of adults ≥65 years [37].
The strengths of this study include the analysis of longitudinally collected clinical data and blood samples as well as mostly consistent findings across three similarly designed studies. The limitations include the post-hoc design and the storage time between blood collection and analysis. However, because these studies used standard blood collection and storage procedures, and prior studies have shown stability for B12 [38], MMA [38], and tHcy [39] over time, it is likely that these measurements are accurate. Also, because these studies did not include standardized reporting of all sources of supplement use, it is possible that MVI or other B-vitamin supplement use are underreported, particularly for unrealized additional sources, such as fortified cereals, snacks, and drinks which are not normally assessed during clinical trials. Nevertheless, the clear correlations of B12 and tHcy levels with reported concomitant supplement use indicates that for most participants, reporting of supplements was largely reliable.
This study shows that participants taking an oral multivitamin supplement at baseline had 100– 200 pg/ml higher levels of B12 and 0.5– 1μmol/L lower levels of tHcy. This is consistent with the observation that in a population consuming a folic acid fortified diet, that the B12 level is the pre-eminent nutritional determinant of tHcy [40]. Moreover, those who started levodopa during these studies, and were not taking a MVI/B-complex, had tHcy levels about 2μmol/L higher at study termination compared to those who were taking a MVI/B-complex.
Extrapolation of these findings from clinical trials to the general PD population is problematic. Because borderline low levels of B12 were measured in 3– 7% of participants of these contemporary clinical trials and simple oral B12 supplementation using an MVI/B-complex supplement was associated with higher B12 levels, our results support the routine measurement of B12 at the time of diagnosis and oral supplementation if found low. Our findings that use of a MVI was associated with lower baseline tHcy and prevented elevations of tHcy after starting levodopa provide support for considering empirical MVI supplementation in early PD [41], although evidence for a clinical benefit is lacking. Bearing in mind the limitations of brief cognitive instruments observed in this study and others [32, 33, 42], a future trial using should be conducted to determine whether treatment with B-vitamins, dosed to prevent elevations of tHcy in early PD, reduces the development of cognitive impairment, depression, or cardiovasculardisease.
ACKNOWLEDGMENTS
We thank Dr. Michael Schwarzschild and Dr. Tanya Simuni for their assistance in obtaining access to the clinical trial results. We thank all the participants in these studies for their time and efforts. We acknowledge the contribution of the NINDS BioSEND for the storage and shipping of the SURE-PD blood samples. We acknowledge SURE-PD(2) as the source of the SURE PD DATA and biospecimens and the Michael J Fox Foundation as the funding source for SURE-PD(2).
Data and biospecimens used in preparation of this manuscript were obtained from the Parkinson’s Disease Biomarkers Program (PDBP) Consortium, supported by the National Institute of Neurological Disorders and Stroke at the National Institutes of Health. Investigators include: Roger Albin, Roy Alcalay, Alberto Ascherio, Thomas Beach, Sarah Berman, Bradley Boeve, F. DuBois Bowman, Shu Chen, Alice Chen-Plotkin, William Dauer, Ted Dawson, Paula Desplats, Richard Dewey, Ray Dorsey, Jori Fleisher, Kirk Frey, Douglas Galasko, James Galvin, Dwight German, Lawrence Honig, Xuemei Huang, David Irwin, Kejal Kantarci, Anumantha Kanthasamy, Daniel Kaufer, James Leverenz, Carol Lippa, Irene Litvan, Oscar Lopez, Jian Ma, Lara Mangravite, Karen Marder, Laurie Orzelius, Vladislav Petyuk, Judith Potashkin, Liana Rosenthal, Rachel Saunders-Pullman, Clemens Scherzer, Michael Schwarzschild, Tanya Simuni, Andrew Singleton, David Standaert, Debby Tsuang, David Vaillancourt, David Walt, Andrew West, Cyrus Zabetian, Jing Zhang, and Wenquan Zou. The PDBP Investigators have not participated in reviewing the data analysis or content of the manuscript.
FUNDING
Funding to support this work was provided by the Michael J. Fox Foundation for Parkinson’s Research, Grant 18462.
CONFLICT OF INTEREST
The authors have no conflict of interest to report.
DATA AVAILABILITY
The data for SURE-PD3 and STEADY-PD3 is hosted on NNIDS PDBP DMR website (https://pdbp.ninds.nih.gov/data-management-resource) and questions can be directed to this email address: E-mail: . SURE-PD2 data is stored at the Michael J. Fox Foundation For Parkinson’s Research and can be accessed by contacting MJFF (E-mail: ) by email.
REFERENCES
[1] | Green R , Allen LH , Bjorke-Monsen AL , Brito A , Gueant JL , Miller JW , Mollow AM , Nexo E , Stabler S , Toh BH , Ueland PM , Yajnik C ((2017) ) Vitamin B12 deficiency. Nat Rev Dis Primers 3: , 17040. |
[2] | Shen L ((2015) ) Associations between B vitamins and Parkinson’s disease. Nutrients 7: , 7197–7208. |
[3] | Stabler SP ((2013) ) Clinical practice. Vitamin B12 deficiency. N Engl J Med 368: , 149–160. |
[4] | Zis P , Grunewald RA , Chaudhuri RK , Hadjivassiliou M ((2017) ) Peripheral neuropathy in Idiopathic Parkinson’s disease: A systematic review. J Neurol Sci 378: , 204–209. |
[5] | McCarter SJ , Stang C , Turcano P , Mielke MM , Ali F , Bower JH , Savica R ((2020) ) Higher vitamin B12 level at Parkinson’s disease diagnosis is associated with lower risk of future dementia. Parkinsonism Relat Disord 73: , 19–22. |
[6] | Flores-Torres MH , Christine CW , Bjornevik K , Molsberry SA , Hung AY , Healy BC , Blacker D , Schwarzchild MA , Ascherio A ((2023) ) Long-term intake of folate, vitamin B6, and vitamin B12 and the incidence of Parkinson’s disease in a sample of U.S. women and men. Mov Disord 38: , 866–879. |
[7] | Jia L , Wang Y , Wei W , Zhao W , Lu F , Lui F ((2019) ) Vitamin B12 inhibits alpha-synuclein fibrillogenesis and protects against amyloid-induced cytotoxicity. Food Funct 10: , 2861–2870. |
[8] | Schaffner A , Li X , Gomez-Llorente Y , Leandrou E , Memou A , Cleamente N , Yao C , Afsari F , Zhi L , Pan N , Morohashi K , Hua X , Zhou MM , Wang C , Zhang H , Chen SG , Elliott CJ , Rideout H , Ubarretxena-Belandia I , Yue Z ((2019) ) Vitamin B12 modulates Parkinson’s disease LRRK2 kinase activity through allosteric regulation and confers neuroprotection. Cell Res 29: , 313–329. |
[9] | Smith AD , Refsum H ((2021) ) Homocysteine - from disease biomarker to disease prevention. J Intern Med 290: , 826–854. |
[10] | Seshadri S , Beiser A , Selhub J , Jacques PF , Rosenberg IH , D’Agostino RB , Wilson PW , Wolf PA ((2002) ) Plasma homocysteine as a risk factor for dementia and Alzheimer’s disease. N Engl J Med 346: , 476–483. |
[11] | O’Suilleabhain PE , Bottiglieri T , Dewey RB , Sharma S , Diaz-Arrastia R ((2004) ) Modest increase in plasma homocysteine follows levodopa initiation in Parkinson’s disease. Mov Disord 19: , 1403–1408. |
[12] | O’Suilleabhain PE , Sung V , Hernandez C , Lacritz L , Dewy RB , Bottiglieri T , Diaz-Arrastia R ((2004) ) Elevated plasma homocysteine level in patients with Parkinson disease: Motor, affective, and cognitive associations. Arch Neurol 61: , 865–868. |
[13] | Al-Kuraishy HM , Al-Gareeb AI , Ali Elewa YH , Zahran MH , Alexiou A , Papadakis M , Batiha GE ((2023) ) Parkinson’s disease risk and hyperhomocysteinemia: The possible link. Cell Mol Neurobiol 43: , 2743–59. |
[14] | Scalabrino G , Carpo M , Bamonti F , Pizzinelli S , D’Avino C , Bresolin N , Meucci G , Martinelli V , Comi GC , Peracchi M ((2004) ) High tumor necrosis factor-α in levels in cerebrospinal fluid of cobalamin-deficient patients. Ann Neurol 56: , 886–890. |
[15] | Christine CW , Auinger P , Joslin A , Yelpaala Y , Green R. ((2018) ) Vitamin B12 and homocysteine levels predict different outcomes in early Parkinson’s disease. Mov Disord 33: , 762–770. |
[16] | Parkinson Study Group ((1993) ) Effects of tocopherol and deprenyl on the progression of disability in early Parkinson’s disease. N Engl J Med 328: , 176–183. |
[17] | Parashos SA , Elm J , Boyd JT , Chou KL , Dai L , Mari Z , Morgan JC , Sudarsky L , Wielinski CL ((2015) ) Validation of an ambulatory capacity measure in Parkinson disease: A construct derived from the Unified Parkinson’s Disease Rating Scale. J Parkinsons Dis 5: , 67–73. |
[18] | Cowan AE , Tooze JA , Gahche JJ , Eicher-Miller HA , Guenther PM , Dwyer JT , Potischman N , Bhadra A , Carroll RJ , Bailey RL ((2013) ) Trends in overall and micronutrient-containing dietary supplement use in US adults and children, NHANES 2007– 2018. J Nutr 152: , 2789–2801. |
[19] | The Parkinson Study Group SURE-PD Investigators ((2014) ) Inosine to increase serum and cerebrospinal fluid urate in Parkinson disease: A randomized clinical trial. JAMA Neurol 71: , 141–150. |
[20] | The Parkinson Study Group STEADY-PDIIII Investigators ((2020) ) Isradipine versus placebo in early Parkinson disease: A randomized trial. Ann Intern Med 172: , 591–598. |
[21] | Parkinson Study Group SURE-PD3 Investigators ((2021) ) Effect of urate-elevating inosine on early Parkinson disease progression: The SURE-PD3 randomized clinical trial. JAMA 326: , 926–939. |
[22] | Lee DS , Griffiths BW ((1985) ) Human serum vitamin B12 assay methods— a review. Clin Biochem 18: , 261–266. |
[23] | Kushnir MM , Komaromy-Hiller G , Shushan B , Urry FM , Roberts WL ((2001) ) Analysis of dicarboxylic acids by tandem mass spectrometry. High-throughput quantitative measurement of methylmalonic acid in serum, plasma, and urine. Clin Chem 47: , 1993–2002. |
[24] | Gilfix BM , Blank DW , Rosenblatt DS ((1997) ) Novel reductant for determination of total plasma homocysteine. Clin Chem 43: , 687–688. |
[25] | Dietiker C , Kim S , Zhang Y , Christine CW ((2019) ) Characterization of vitamin B12 supplementation and correlation with clinical outcomes in a large longitudinal study of early Parkinson’s disease. J Mov Disord 12: , 91–96. |
[26] | Venuto CS , Smith G , Herbst K , Zielinski R , Yung NCW , Grosset DG , Dorsey ER , Kieburtz K ((2023) ) Predicting ambulatory capacity in Parkinson’s disease to analyze progression, biomarkers, and trial design. Mov Disord 38: , 1774–1785. |
[27] | Iwaki H , Leonard HL , Makarious MB , Bookman M , Landin B , Vismer D , Casey , B.Gibbs JR , Hernandez DG , Blauwendraat C , Vitale D , Song Y , Kumar D , Dalgard CL , Sadeghi M , Dong X , Misquitta L , Scholz Sw , Scherzer CR , Nalls MA , Biswas , Singleton AB ((2021) ) Accelerating medicines partnership: Parkinson’s disease. Genetic resource. Mov Disord 36: , 1795–1804. |
[28] | Nilsson-Ehle H , Jagenburg R , Landahl S , Lindstedt S , Svanborg A , Westin J ((1991) ) Serum cobalamins in the elderly: A longitudinal study of a representative population sample from age 70 to 81. Eur J Haematol 47: , 10–16. |
[29] | Luthra NS , Marcus AH , Hills NK , Christine CW ((2020) ) Vitamin B12 measurements across neurodegenerative disorders. J Clin Mov Disord 7: , 3. |
[30] | Ganji V , Kafai MR ((2006) ) Population reference values for plasma total homocysteine concentrations in US adults after the fortification of cereals with folic acid. Am J Clin Nutr 84: , 989–994. |
[31] | Perinan MT , Macias-Garcia D , Jesus S , Martin-Rodriguez JF , Munoz-Delgado L , Jimenez-Jaraba MV , Buiza-Rueda D , Bonilla-Toribio M , Adarmes-Gomez AD , Gomez-Garre P , Mir P ((2023) ) Homocysteine levels, genetic background, and cognitive impairment in Parkinson’s disease. J Neurol 270: , 477–485. |
[32] | Lessig S , Nie D , Xu R , Corey-Bloom J ((2012) ) Changes on brief cognitive instruments over time in Parkinson’s disease. Mov Disord 27: , 1125–1128. |
[33] | Murakami H , Momma Y , Nohara T , Mori Y , Futamura A , Sugita T , Ishigaki S , Katoh H , Ono K , Miller MW , Kawamura M ((2016) ) Improvements in language function correlates with gait improvement in drug-naïve Parkinson’s disease patients taking dopaminertig medication. J Parkinsons Dis 6: , 209–217. |
[34] | Sampedro F , Martinez-Horta S , Horta-Barba A , Grothe MJ , Labrador-Espinsa MA , Jesus S , Adarmes-Gomez A , Carrillo F , Puig-Davi A , Lora FR , Barbera MA , Pastor P , Arroyo SE , Villa BS , Foraster AC , Martinez JR , adilla FC , Morians MP , Aramburu IG , Cerio JI , Vara JH , de Fabregues-Poixar O , De Deus Fonticoba T , Avila A , Martinez-Castrillo JC , Bejr-Kasem H , Campolongo A , Pascual-Sedano B , Coppadis Study Group Martinez-Martin P , Santos-Garcia D , Mir P , Kulisevsky J ((2022) ) Increased homocysteine levels correlate with cortical structural damage in Parkinson’s disease. J Neurol Sci 434: , 120148. |
[35] | Sleeman I , Lawson RA , Yarnall AJ , Duncan GW , Johnston F , Khoo TK , Burn DJ ((2019) ) Urate and homocysteine: Predicting motor and cognitive changes in newly diagnosed Parkinson’s disease. J Parkinsons Dis 9: , 351–359. |
[36] | de Jager CA , Oulhaj A , Jacoby R , Refsum H , Smith AD ((2012) ) Cognitive and clinical outcomes of homocysteine-lowering B-vitamin treatment in mild cognitive impairment: A randomized controlled trial. Int J Geriatr Psychiatry 27: , 592–600. |
[37] | Vyas Cm , Manson Je , Sesso HD , Cook NR , Rist PM , Weinberg A , Moorthy MV , Baker LD , Espeland MA , Yeung L , Brickman AM , Okereke OI ((2024) ) Effect of multivitamin-mineral supplementation versus placebo on cognitive function: Results from the clinic subcohort of the COcoa Supplement and Multivitamin Outcomes Study (COSMOS) randomized clinical trial and meta-analysis of 3 cognitive studies within COSMOS. Am J Clin Nutr 110: , 692–701. |
[38] | Hustad S , Eussen S , Midttun O , Ulvik A , van de Kant PM , Morkrid L , Gislefoss R , Leland PM ((2012) ) Kinetic modeling of storage effects on biomarkers related to B vitamin status and one-carbon metabolism. Clin Chem 58: , 402–410. |
[39] | Brown AS , Bottiglieri T , Schaefer CA , Quesenberry CP , Liu L , Bresnahan M , Susser ES ((2007) ) Elevated prenatal homocysteine levels as a risk factor for schizophrenia. Arch General Psychiatry 64: , 31–39. |
[40] | Green R , Miller JW ((2005) ) Vitamin B12 deficiency is the dominant nutritional cause of hyperhomocysteinemia in a folic acid-fortified population. Clin Chem Lab Med 43: , 1048–1051. |
[41] | Ahlskog JE ((2023) ) Levodopa, homocysteine and Parkinson’s disease: What’s the problem? Parkinsonism Relat Disord 109: , 105357. |
[42] | Faust-Socher A , Duff-Canning S , Grabovsky A , Armstrong MJ , Rothberg B , Eslinger PJ , Meaney CA , Schneider RB , Tang-Wai DF , Fox SH , Zadikoff C , Kennedy N , Chou KL , Persad C , Litvan I , Mast BT , Gerstenecker AT , Weintraub S , Reginold W , Marras C ((2019) ) Responsiveness to change of the Montreal Cognitive Assessment, Mini-Mental State Examination, and SCOPA-Cog in non-demented patients with Parkinson’s disease. Dement Geriatr Cogn Disord 47: , 187–197. |


