
A Characterization of Central Auditory Processing in Parkinson’s Disease
Abstract
Background:
Research indicates that people with Parkinson’s disease (PwPs) may experience challenges in both peripheral and central auditory processing, although findings are inconsistent across studies. Due to the diversity of auditory measures used, there is a need for standardized, replicable hearing assessments to clarify which aspects of audition are impacted in PWPs and whether they are linked to motor and non-motor symptoms.
Objective:
To characterize auditory processes and their possible alteration in PwPs. To address this, we collected a comprehensive set of standardized measures of audition using PART, a digital testing platform designed to facilitate replication. Additionally, we examined the relationship between auditory, cognitive, and clinical variables in PwPs.
Methods:
We included 44 PwPs and 54 age and education matched healthy controls. Assessments included detection of diotic and dichotic frequency modulation, temporal gaps, spectro-temporal broad-band modulation, and speech-on-speech masking.
Results:
We found no statistically significant differences in auditory processing measures between PwPs and the comparison group (ps > 0.07). In PwPs, an auditory processing composite score showed significant medium size correlations with cognitive measures (0.39 < r<0.41, ps < 0.02) and clinical variables of motor symptom severity, quality of life, depression, and caretaker burden (0.33 < r<0.52, ps < 0.03).
Conclusions:
While larger datasets are needed to clarify whether PwPs experience more auditory difficulties than healthy controls, our results underscore the importance of considering auditory processing on the symptomatic spectrum of Parkinson’s disease using standardized replicable methodologies.
Plain Language Summary
It is unknown whether there exists a relationship between Parkinson’s disease (PD) and hearing ability. While some studies have found hearing difficulties to be associated with PD, other studies failed to replicate these effects. We suggest that a possible reason for these differing findings are differences in how hearing is measured. To clarify the literature, we tested a group of people with Parkinson’s (PwPs) on several aspects of hearing using a freely available tablet-based app. We compared PwPs hearing tests to those of an age and education matched group of people without PD. While we found no clear differences among the groups, we did find better hearing abilities were related to less motor symptom severity and depression, better reported quality of life, and less reported burden of the disease experienced by the caretaker. We conclude that while there is no solid evidence showing the hearing is necessarily impaired in PD, that measuring hearing in PwPs can provide valuable clinical information. This can inform new approaches to treatment for people living with PD such as those related with improving hearing.
INTRODUCTION
Parkinson’s disease (PD) is a neurodegenerative illness that affects approximately 1.6 million people around the world [1]. While motor symptoms are the formal axis of PD diagnosis and lead conventional treatment, non-motor symptoms are profuse and may have a similar or even stronger impact on patients’ quality of life [2]. Cognitive and sensory impairment in PD are increasingly reported [3–5], indicating important risk factors for decreased quality of life in these patients [6].
Research suggests that people with PD (PwPs) may experience more auditory processing difficulties than matched controls. Studies with large samples [7] describe an increased risk to develop PD in people with untreated hearing loss, similar to what has been observed for Alzheimer’s disease [8, 9]. A recent review focused on measures of peripheral hearing in PD [10], indicated that most studies show worse pure tone detection thresholds in PwPs in some of the frequencies tested [7, 11–13]. Differences in central auditory processing have also been reported in PwPs, including reduced spatial hearing sensitivity [14], worse temporal sensitivity [15, 16], worse speech reception thresholds [17], and reduced ability to understand speech-in-competition [18]. However, other studies have failed to observe differences in either peripheral or central audition using similar measures [15, 19, 20]. These mixed results in the extant literature preclude strong conclusions and suggest a need for new research using more comprehensive, and easily replicable, measures of auditory processing measures that can be related to cognition and relevant clinical variables.
To address this need, in this study we tested PwPs on a wide range of auditory tests and compared their performance with an age- and education-matched comparison group without PD. Hearing was measured using PART (Portable Automated Rapid Testing), a validated, free-access, mobile, cross-platform, laboratory-grade auditory testing app [21, 22] that facilitates replication and the posterior aggregation of datasets across studies [23]. Using PART, we characterized auditory processing in PwPs in comparison to controls, as well as relationships between auditory performance and demographic, cognitive, and clinical variables in PwPs.
METHODS
Participants
PwPs were recruited at the Parkinson’s Disease and Movement Disorders Clinic at the Instituto Nacional de Neurología y Neurocirugía Manuel Velasco Suárez (INNNMVS). The diagnosis of PD was made by at least one neurologist expert in abnormal movements following the clinical criteria of the Movement Disorder Society [24]. Two neurologists conducted a clinical interview in which sociodemographic and clinical information was obtained. The type and quantity of medication taken by each participant in the PwPs group was converted to an L-Dopa equivalent daily dosage (LEDD) [25]. Additionally, the neurologists estimated the severity of the disease using the Hoehn and Yahr Scale [26] and the motor impairment degree through the Movement Disorder Society United Parkinson’s Disease Rating Scale, section III (MDS-UPDRS-III) [27, 28].
The study was previously approved by the INNNMVS ethics committee. All the experimental procedures followed the guidelines provided by the Declaration of Helinsiki. Participants who agreed to participate signed an informed consent which guaranteed the confidential treatment of their data. The following inclusion criteria were used: 1) diagnosis of idiopathic PD with Hoehn & Yahr scores≤3; 2) undergoing stable pharmacological treatment for PD; and 3) having education greater than 6 years. Only early and middle-stage PwPs were included for three reasons. First, the feasibility of data collection with the automatic digital measures included in this study had not been shown in PwPs and so this study represents a first step in demonstrating automated assessment feasibility in early-stage PD. Second, auditory deficits have been proposed as early markers of risk to develop dementia [8, 9] and PD [7], and so they may be expressed early in PD. Third, since around 46% of PwPs with more than 10 years of disease duration show dementia [3], we tried to reduce the chance of getting unreliable auditory scores due to severe cognitive decline in our sample. The education criterion was included to ensure participants were able to read automated instructions on their own.
Participants were excluded if they 1) had a history of neurosurgery except for deep brain stimulation (DBS) placement, 2) used a sound amplification device, 3) showed uncorrected visual impairment, 4) had a diagnosis of another neuropsychiatric condition, except for mild anxiety or depression disorders or 5), did not complete at least 75% of the assessments in the session. After demographic data was collected, 10 participants from the PwPs group were excluded from the study: 3 were falling asleep and 2 became exhausted during the evaluation and decided to stop their participation, 3 persons could not complete the entire test due to lack of time, and another 2 responded randomly, so the results of their evaluation were not considered valid. The demographic information of the final sample is reported in Table 1. The performance scores of the people with DBS (n = 5) did not show a differential pattern, as detailed in Supplementary Figure 4.
Table 1
Sociodemographic and clinical features in both groups. Comparisons between PD and control groups are also provided for relevant variables
| Control | PD | Statistic | p | |
| N | 54 | 44 | ||
| Gender, female | N = 37 (69%) | N = 17 (39%) | 8.75b | 0.003 |
| Age, y | 60.31±10.35 | 58.5±11.61 | 0.817a | 0.41 |
| MoCA, total score | 25.26±2.94 | 24.75±3.63 | 0.75a | 0.45 |
| Manual dexterity, right | N = 50 (92%) | N = 42 (95%) | 2.50b | 0.28 |
| HHIE-S | 6±4.43 | 3.65±4.48 | 2.41a | 0.018 |
| PTA, nominal dB | 20.86±9.54 | 22.35±12.26 | –0.67a | 0.5 |
| Education (grade) | 2.13b | 0.71 | ||
| Elementary | N = 6 (11%) | N = 8 (18%) | ||
| Middle | N = 8 (15%) | N = 9 (20%) | ||
| High school | N = 11 (20%) | N = 6 (14%) | ||
| University | N = 20 (37%) | N = 15 (34%) | ||
| Master’s | N = 9 (17%) | N = 6 (14%) | ||
| Disease duration | – | 8.09±5.14 | – | – |
| MDS-UPDRS-III | – | 25.02±12.26 | – | – |
| Hoehn &Yahr | ||||
| 1 | – | N = 6 (15%) | ||
| 2 | – | N = 30 (77%) | ||
| 3 | – | N = 3 (8%) | ||
| Left motor symptom onset | N = 22 (50%) | |||
| LEDD, mg | 596.5±374.7 | |||
| HRSD | – | 9.2±5.06 | ||
| HRSA | – | 8.7±5.23 |
MoCA, Montreal Cognitive Assessment; HHIES, Hearing Handicap Inventory for the Elderly in Spanish; PTA, pure-tone average; LEDD, L-Dopa Equivalent Daily Dose; HRSD, Hamilton Rating Scale for Depression; HRSA, Hamilton Rating Scale for Anxiety. aT-test; bChi-square.
As a healthy control comparison, we used previously collected data from middle aged adults who were tested with the same methods and experimental conditions, including the lab setting [29]. In addition to these participants, we recruited 10 additional healthy older adults between 60 and 80 years old to better match the groups’ age distributions. They fulfilled the same inclusion criteria, in addition to not having any neurological or psychiatric diagnosis at the moment of the study. These participants followed the procedures of Lelo de Larrea et al. [29], with the addition of the clinical scales, assessment of visual selective attention (UCancellation) and dichotic sentence identification (DSI).
Instruments
Assessments were divided into two main batteries: an auditory battery which both groups completed for comparison (except DSI); and a cognitive battery of which the comparison group only completed the Montreal Cognitive Assessment (MoCA). Additionally, a set of clinical and neuropsychiatric scales were collected in the PwPs group (all measures are described below).
Auditory assessment
For most measures of central auditory processing, a two-cue two-alternative forced choice paradigm (2AFC) was used (with exception of pure-tone thresholds and spatial release from masking, whose methods are described below). In the 2AFC four squares are displayed horizontally and sequentially associated with three standard sounds and one target sound. The first and last stimuli are always paired with a non-target sound (cue), and participants choose which of the 2nd or 3rd squares were associated with the target sound (described below for each task). Task difficulty was adapted with a 2-up 1-down staircase with unequal step-sizes (1.5 : 1) that estimates a threshold at around 77.5% accuracy [21]. Each staircase contained two stages, with larger step-sizes for three reversals in the first stage, and smaller steps in the second stage for six reversals. Specific details about the parameters used in each task are described below.
Pure-tone audiogram
Pure-tone audiometry was performed diotically (to both ears) at frequencies of 500, 1000, 2000, and 4000 Hz. Participants first indicated whether they heard a series of three-to-four 100 ms pure tones presented at an initial level of 70 dB. After obtaining three consecutive “yes” responses indicating tone detection, the level of tone presentation was decreased; first by a step of 20 dB, then by steps of 10 dB until a level of 10 dB was reached, and finally by 5 dB. The procedure concluded when three consecutive “no” responses were recorded or when the value of 0 dB was reached. The threshold was determined by the level at which the last correct response was made. Because this test was applied diotically, the reported thresholds correspond to sensitivity of the better ear.
Frequency modulation detection (Dichotic & Diotic FM)
To assess monaural and binaural sensitivity to the fine temporal structure of sounds [30], we used two tasks involving detection of frequency modulations (FM) on narrowband tones adapting on the range of modulation. Pure-tone stimuli were delivered at 75 dB, with a duration of 400 ms. The frequency of the narrowband was roved between 460 and 540 Hz, for each of the four tones per trial. Target stimuli had a sinusoidal FM of 2 Hz either in-phase between the ears to assess monaural sensitivity (diotic FM task) or phase-inverted between the ears to assess the binaural sensitivity (dichotic FM task). The FM range (e.g. how far was frequency modulated by the 2 Hz FM) was adapted on an exponential scale starting at 6 Hz. FM range was reduced in steps of 21/2 Hz after two correct responses (down) and 23/4 Hz after each incorrect response (up) in the first stage, while in the second stage the range adapted in steps of 21/10 Hz and 23/20 Hz, respectively, with a minimum of 0 and a maximum of 10 kHz.
Temporal gap detection
To assess sensitivity to temporal gaps, we used a task where target stimuli adapted on duration of a silent gap between tone bursts starting at 20 ms. The standard stimuli were two 2 kHz tone bursts presented diotically at 80 dB [31–33]. In the first stage of the staircase, the stimuli adapted exponentially in steps of 2½ ms (down) after two correct responses, and by 23/4 ms (up) after every incorrect response. In the second stage of staircase the gap was adapted by steps of 21/10 ms (down) and 23/20 ms (up).
Spectro-temporal modulations (TM, SM, and STM)
A set of three tasks was used to evaluate the detection of sinusoidal amplitude spectro-temporal modulations over broadband noise (from 400 Hz to 8 kHz). Stimuli were presented at a level of 65 dB with a duration of 500 ms. Target stimuli consisted of either temporal modulation (TM) at rate of 4 Hz; spectral modulation (SM) at a rate of 2 cycles/octave; or a combination of both spectral and temporal modulation (STM) [21, 34, 35]. The modulation depth (expressed in dB) measured from the middle to the peak of the amplitude range [36] was the adaptive parameter. All tasks started with targets containing 6 dB modulation depth and adapted (down) by 0.5 dB steps every two correct responses and by 0.75 dB (up) after each incorrect response (upward). The second stage had modulation adapting by.1 dB (down) and.15 dB (up), with a minimum value of 0 dB and a maximum of 10 dB.
Spatial release from masking (SRM)
To assess the identification of speech targets in the presence of two competing speech maskers we used the spatial release from masking task (SRM) [37], employing stimuli from the Spanish version of the coordinate response measure (CRM) [23]. On each trial, participants had to listen to instructions given to the code-name “Carlos” (e.g., “Listo Carlos, ve al dos azul ahora.” or ‘’Ready Charlie, go to blue two now.”) and respond on a grid presented on the screen showing four rows of colored squares (white, green, blue, and red) with a number inside (from 1 to 8). Target sentences were delivered in presence of another two competing talkers uttering different instructions for other code-names (e.g., “Listo Delta, ve al cinco verde ahora.” Or “Ready Delta, go to green five now”). While the target level was fixed at nominal level of 65 dB, the level of two masker speakers progressed from 55 dB by 2 dB every two responses until reaching two trials at 73 dB. This task was delivered in two conditions that differed according to the spatial localization of the masker speakers. In the colocated condition, target and maskers are simulated to be directly in front of the participant, in the separated condition maskers are presented in the left and right (–/+45 degrees) of the target. Simulated auditory space was performed following the methods developed and validated by Gallun et al. [37], using a generic set of head-related transfer functions (HRTFs). The difference between separated and colocated thresholds was used as a measure of the SRM.
Dichotic Sentence Identification
The Dichotic Sentence Identification (DSI) test was used to assess divided attention and dichotic hearing [38]. Here, two sentences are presented simultaneously (at 50 dB) with a different sentence in each ear. Sentence pairs were chosen randomly from a set of 6 seven-word, third-order sentences from the Synthetic Sentence Identification (SSI) test. Participants responded by selecting the two sentences from a list of 6 written sentences. Five trials were presented; if performance was not 100%, an additional five trials were presented. The main outcome was the percentage of correct responses (accuracy). The DSI was included in the PwPs group to further characterize auditory function and its relationship to other clinically relevant measures following the findings of Gates et al. [39], and Mohammed et al. [40] that indicated poor performance on this measure increased the risk of developing dementia in later years. Thus, the DSI may be useful in characterizing the relationship between auditory and cognitive function in PwPs.
Self-reported hearing difficulty
Hearing Handicap Inventory for Adults
The Hearing Handicap Inventory for the Elderly (HHIE-S) [41], was used to evaluate self-reported hearing difficulty. We used a version previously described in Lelo de Larrea-Mancera et al. [29] that is based on prior work [42, 43]. Scores range from 0 to 40, with higher scores indicating greater self-perceived hearing handicap. A cutoff value of 8 is provided by ASHA guidelines to determine hearing loss [44].
Cognitive assessment battery
2.11.1UCancellation
Selective and sustained attention was measured using Ucancellation [45], a user-friendly version of more typical cancellation tests such as the d2 Test of Attention [46]. Participants sequentially search for 3–5 target stimuli (a sitting dog and an upside-down monkey) among a row of 8 pictures of dogs and monkeys, which vary either in the color distribution (same color palette) or orientation (horizontal and vertical). Participants have up to 6 s to complete each row with 1 s screen between rows. The task is divided into three blocks, first the dog images are searched for 60 seconds, then the monkey images are searched for 60 seconds, and finally both stimuli are searched for 120 seconds. Similar cancellation tests have shown to be sensitive to attentional deficits associated to PD [47].
Montreal cognitive assessment (MoCA)
To assess global cognitive functioning, we employed the total score of the MoCA test (version 8.1) which includes the cognitive sub-domains of short-term memory, visuospatial ability, executive function, attention and working memory, language, and orientation [48] validated in Mexican population [49] as well as in PwPs [50]. The MoCA is among the most widely used cognitive screening test in PD [51]. In this study we treat the MoCA total score as a continuous variable to estimate general cognitive ability. This measure was originally included in Lelo de Larrea-Mancera et al. [29] (control group) to afford sample matching in future studies with different clinical populations (e.g. this study). Thus, our main objective with this measure was to ensure groups are matched in general cognitive terms.
Clinical scales
In addition to the clinical scales described in the participants section that address motor symptoms (Hoehn & Yahr, and MDS-UPDRS-III) and medication (LEDD), we included the following clinical measures.
Hamilton rating scale for depression
The HRSD [52] is a 17-item questionnaire, administered by an expert clinician, which assesses severity of depression [53]. Each item is scored from 0 to 4 in a total scale from 0 to 51 with higher scores indicating more severe depressive symptoms [53].
Hamilton rating scale for anxiety
The HRSA is a clinician-rated evaluation designed to assess severity of anxiety symptoms in adults [54]. This scale is composed of 14 items scored from 0 to 4 in a total scale from 0 to 56 with higher scores indicating more severe anxiety symptoms [55].
Parkinson’s disease questionnaire-39
The PDQ-39 is a 39 item self-report questionnaire that provides a comprehensive view of the impact of PD symptoms across eight dimensions of daily living [56, 57]. Scores range from 0 to 100, with 100 representing more severe impact [56, 58].
Zarit burden interview (ZBI)
The ZBI is a 22-item self-report questionnaire that assesses perceived impact of providing care, where higher scores indicate greater caregiver burden. The ZBI is sensitive to changes in caregiver burden over time [59, 60]. We included this measure as complementary to the clinical picture of the sample, and because auditory difficulty may have a negative impact on communication and the social life of people affected [61, 62] that may represent increased burden in caretakers.
MDS-UPDRS-III
The Movement Disorder Society Unified Parkinson’s Disease Rating Scale (MDS-UPDRS) is one of the most widely used scales to assess progression of PD symptoms [27]. Section III of the MDS-UPDRS allows to quantify the severity of motor symptoms, with higher scores indicating worse motor function [63].
Hoehn & Yahr scale
The Hoehn and Yahr scale (H&Y) [26] is a clinical assessment tool commonly used to measure symptom severity in PwPs [64]. H&Y classifies the stage of PD and provides a general overview of the progression of motor symptoms from Stage 0 to 5, with higher stages indicating more severe symptoms [65].
Procedure
Patients who attended their routine consultation at the Movement Disorders Clinic at the INNNMVS were invited to participate in the present study by two qualified neurologists. We confirmed participants took their antiparkinsonian medication 30 to 60 minutes prior to the start of the evaluation, to ensure that they were in an ON state. Participants were directed to a quiet room and seated in a comfortable chair where they were tested using an iPad (Apple, Inc., Cupertino, CA) and Sennheiser 280 Pro headphones (Sennheiser electronic GmbH & Co. KG, Wedemark, Germany) by a trained psychologist. Assessment lasted about 50 minutes. Test order was counter-balanced using three different orders of administration across participants. After finishing the PART evaluation and taking a short break, a neuropsychologist and a neurologist applied the cognitive and neurological scales. At the end of the study, participants were presented with the results of each task and feedback was provided on their performance.
Statistical analysis
To compare auditory processing of PwPs and an age- and education-matched healthy controls, we conducted a number of analyses. Pure tone audiogram detection thresholds across 4 frequencies were compared using a 4-by-2 repeated measures ANOVA with within-subject factor Frequency (4 levels: 0.5, 1, 2, and 4 kHz) and between-subject factor Group (2 levels: PwPs and control). A MANOVA was conducted including all auditory processing measures as dependent variables, and the between-subject factor Group. Post hoc ANOVAs were planned to determine individual dependent variables with significant results. As a complementary analysis, we compared self-report measures of hearing handicap (HHIE-S) using an independent samples t-test. The study was sufficiently powered (>80%) to find differences between groups greater than 0.5 SD which fits well with previous reports of effect sizes between 0.5 and 1 SD [16, 17].
We also examined relationships between auditory measures collected in the PwPs group and variables indicating cognitive performance and clinical state. To this end, we created a subject-specific auditory composite score from the average of the z-scored auditory processing measures. The auditory composite was subjected to correlation analyses with cognitive, clinical and demographic variables in the PwPs group. This post hoc analysis was intended to determine possible associations of hearing with important PwPs features that could be a target for later study.
Lastly, considering that the auditory composite combines measures that are sensitive to different levels of processing along the auditory pathway that might carry different information, and to further characterize the relationship between auditory measures and clinically relevant variables in PwPs, we computed three different composite scores with sub-groups of assessments: 1) low-level (four-frequency PTA; mainly sensitive to peripheral function); 2) mid-level (Gap, FMs, and STMs; sensitive to central function); and 3) high-level (SRM colocated, SRM separated, and DSI; intimately linked to cognitive function). The same set of correlations conducted for the general auditory composite were repeated for the three additional composite scores.
RESULTS
Demographic and clinical variables
The final sample was made up of 44 PwPs and 55 matched controls. Demographic variables for both groups are shown in Table 1. There were no significant differences between the PwPs group and the comparison control group in terms of age, education, or global cognition (MoCA total score; see Table 1).
Was there any evidence of auditory processing alterations in PwPs?
We first examined pure tone audiometry and self-reported hearing handicap. Figure 1 (left panels) shows audiometric thresholds of each participant of each group. Average performance was very similar between groups. The 4x2 repeated measures ANOVA with frequency (0.5, 1, 2, 4 kHz) and group factors showed neither a significant main effect of group (F (1,93) = 0.45, p = 0.5) nor a significant interaction group*frequency (F (3,279) = 0.19, p = 0.9), failing to replicate group-level differences in pure-tone audiometry between PwPs and controls.
Fig. 1
Left and middle panels show pure tone detection thresholds across the four frequencies tested in each group. The solid black line represents the mean detection threshold. The right panel shows the mean self-reported hearing loss in each group. The error bars represent the standard deviation.
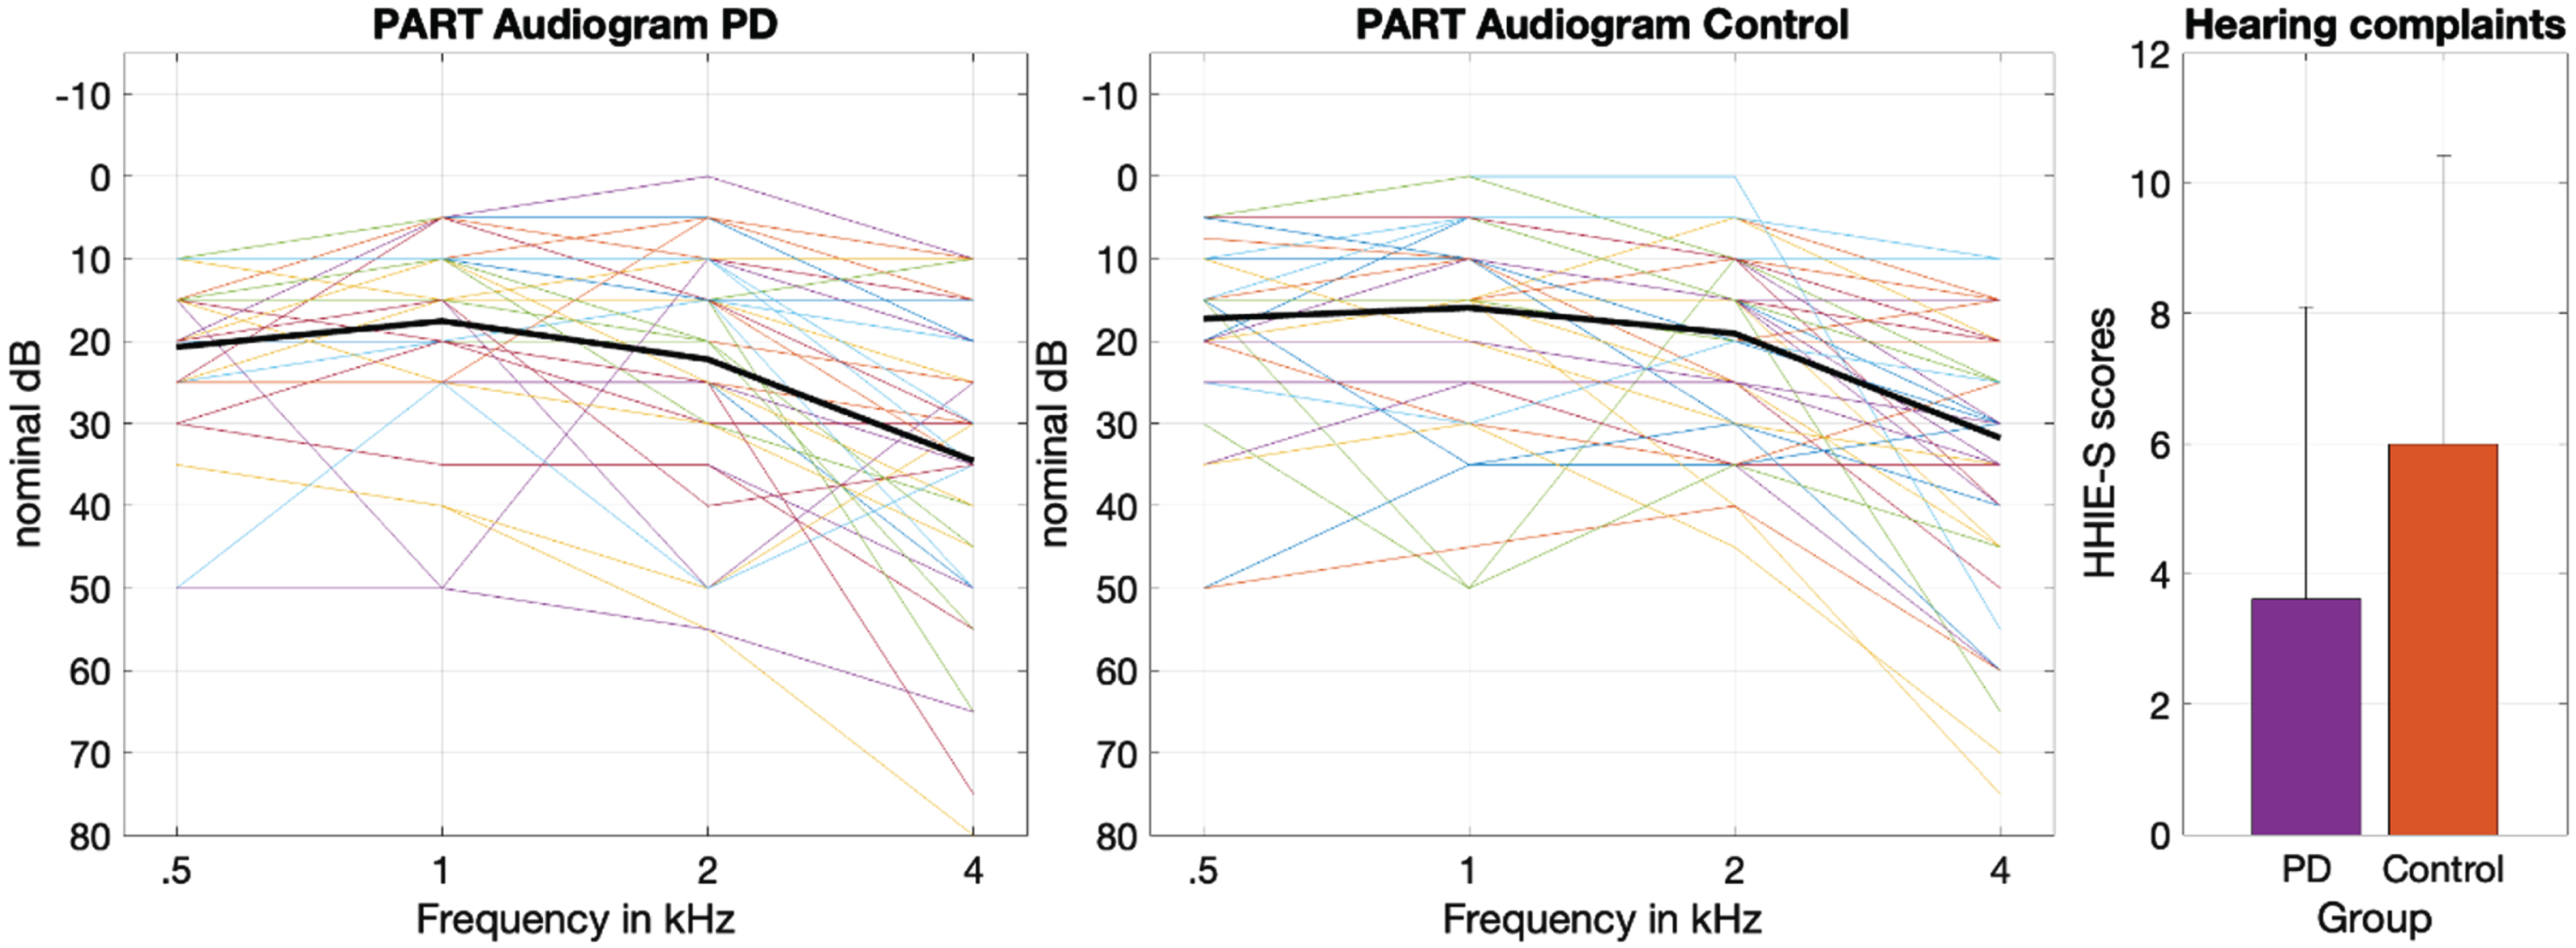
Figure 1 (right) shows mean self-reported hearing difficulties of each group. There were significant differences in self-reported hearing (t (89) = 2.72, p = 0.008, Cohen’s d = 0.57, Mean diff. = 3.1) with PwPs reporting fewer hearing difficulties (M = 6.76, SD = 6.1) than controls (M = 3.61, SD = 4.4). However, mean scores of both groups were below the suggested cutoff value to determine hearing loss (i.e., 8 points) [45].
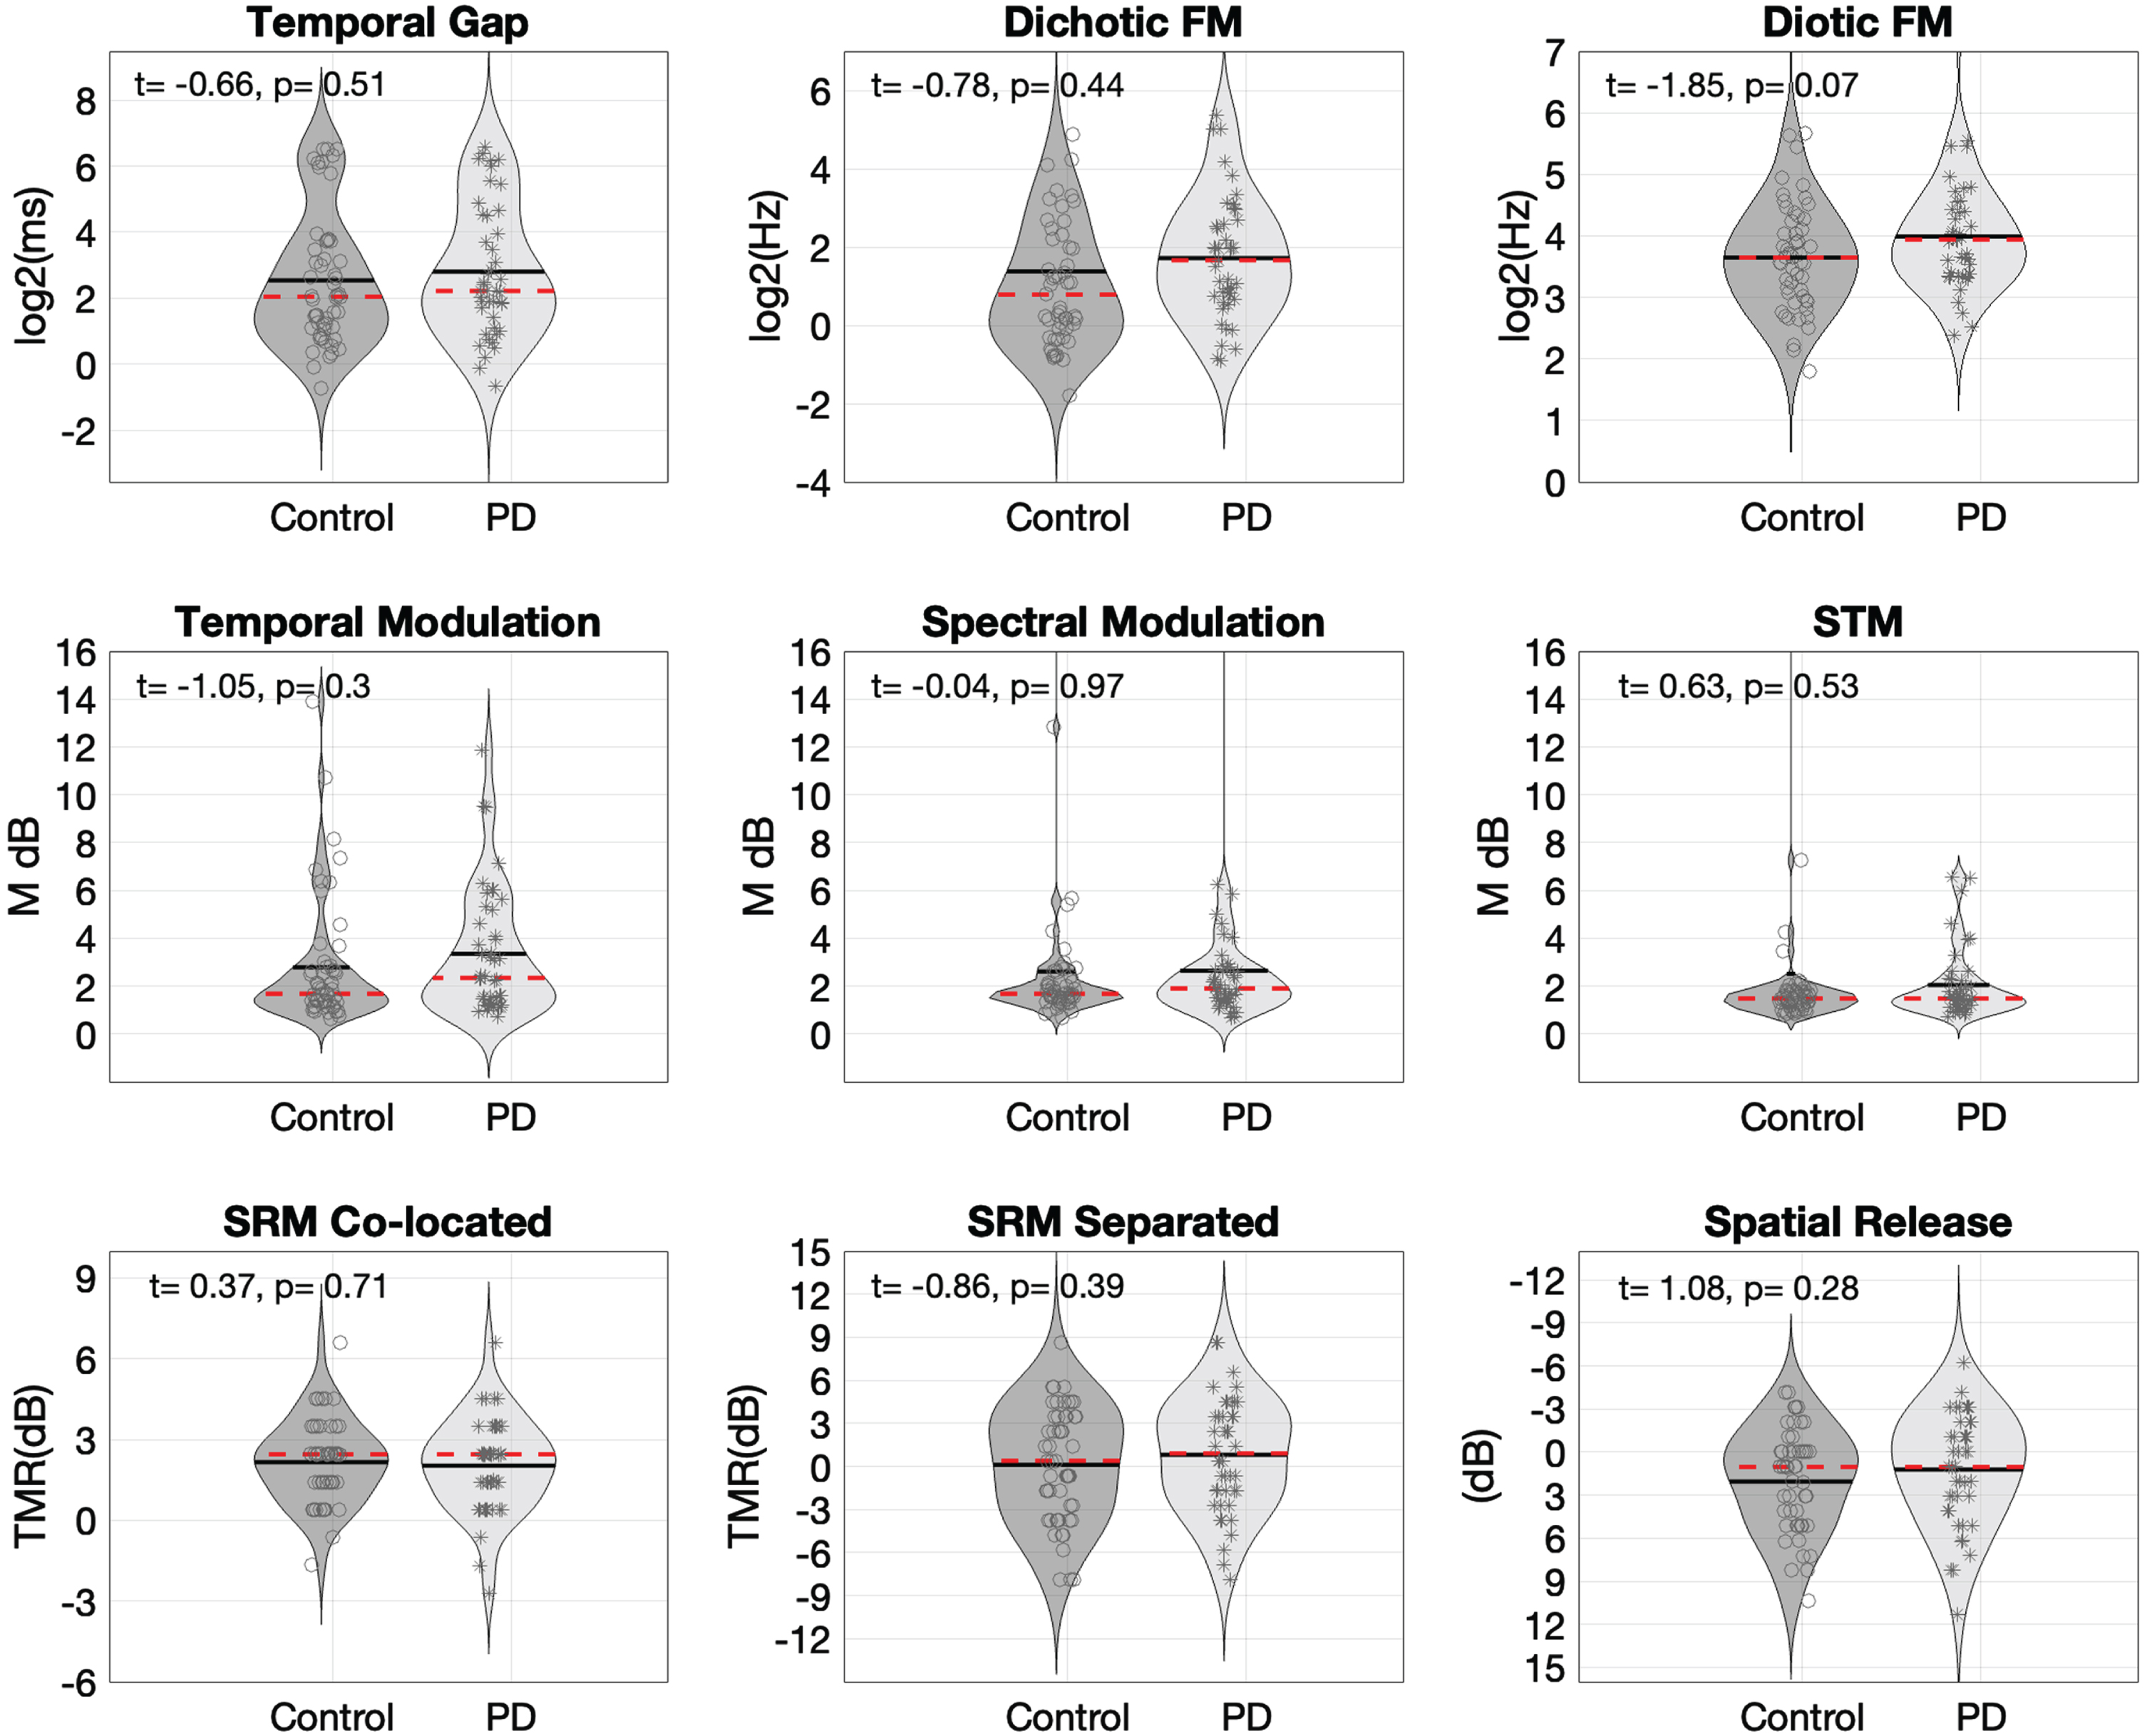
We next examined central auditory processing and speech in competition measures. The MANOVA indicated no significant differences between groups across the additional 8 measures of central auditory processing (Pillai’s trace = 0.072, Fapprox . = 0.78, p = 0.61). Figure 2 shows distributions of thresholds for each auditory processing measure. For descriptive purposes, an independent samples t-test is displayed on each sub-test to provide a notion of individual task-level comparisons. Figure 2 indicates small qualitative differences between groups, but these do not reach statistical significance. In sum, there is no statistical evidence of auditory processing alterations associated to PD in the sample investigated here.
Fig. 2
Violin plots showing probability density functions to compare control and PD distributions of threshold values across the set of 8 auditory processing measures taken and the spatial release from masking metric. Red dotted lines inside the violins indicate median and solid black lines the mean of each distribution. Each assessment includes the result of an independent samples t-test calculated for descriptive purposes only and are not corrected for multiple comparisons. FM, frequency modulation; STM, spectro-temporal modulation; SRM, spatial release from masking.
What is the relationship between auditory, cognitive, and clinical variables in PwPs?
We next addressed extent to which auditory processing measures might relate to cognition and clinical aspects of PD. Figure 3 shows correlations between the auditory processing composite (lower scores reflect better audition) and clinical, cognitive, and demographic variables.
Fig. 3
Scatter plots and Pearson correlations showing clinical, cognitive, and demographic measures as a function of the auditory processing composite score within the PD group. The categories for the education variable are: 0 = elementary; 1 = middle-school; 2 = high-school; 3 = university; 4 = graduate school.
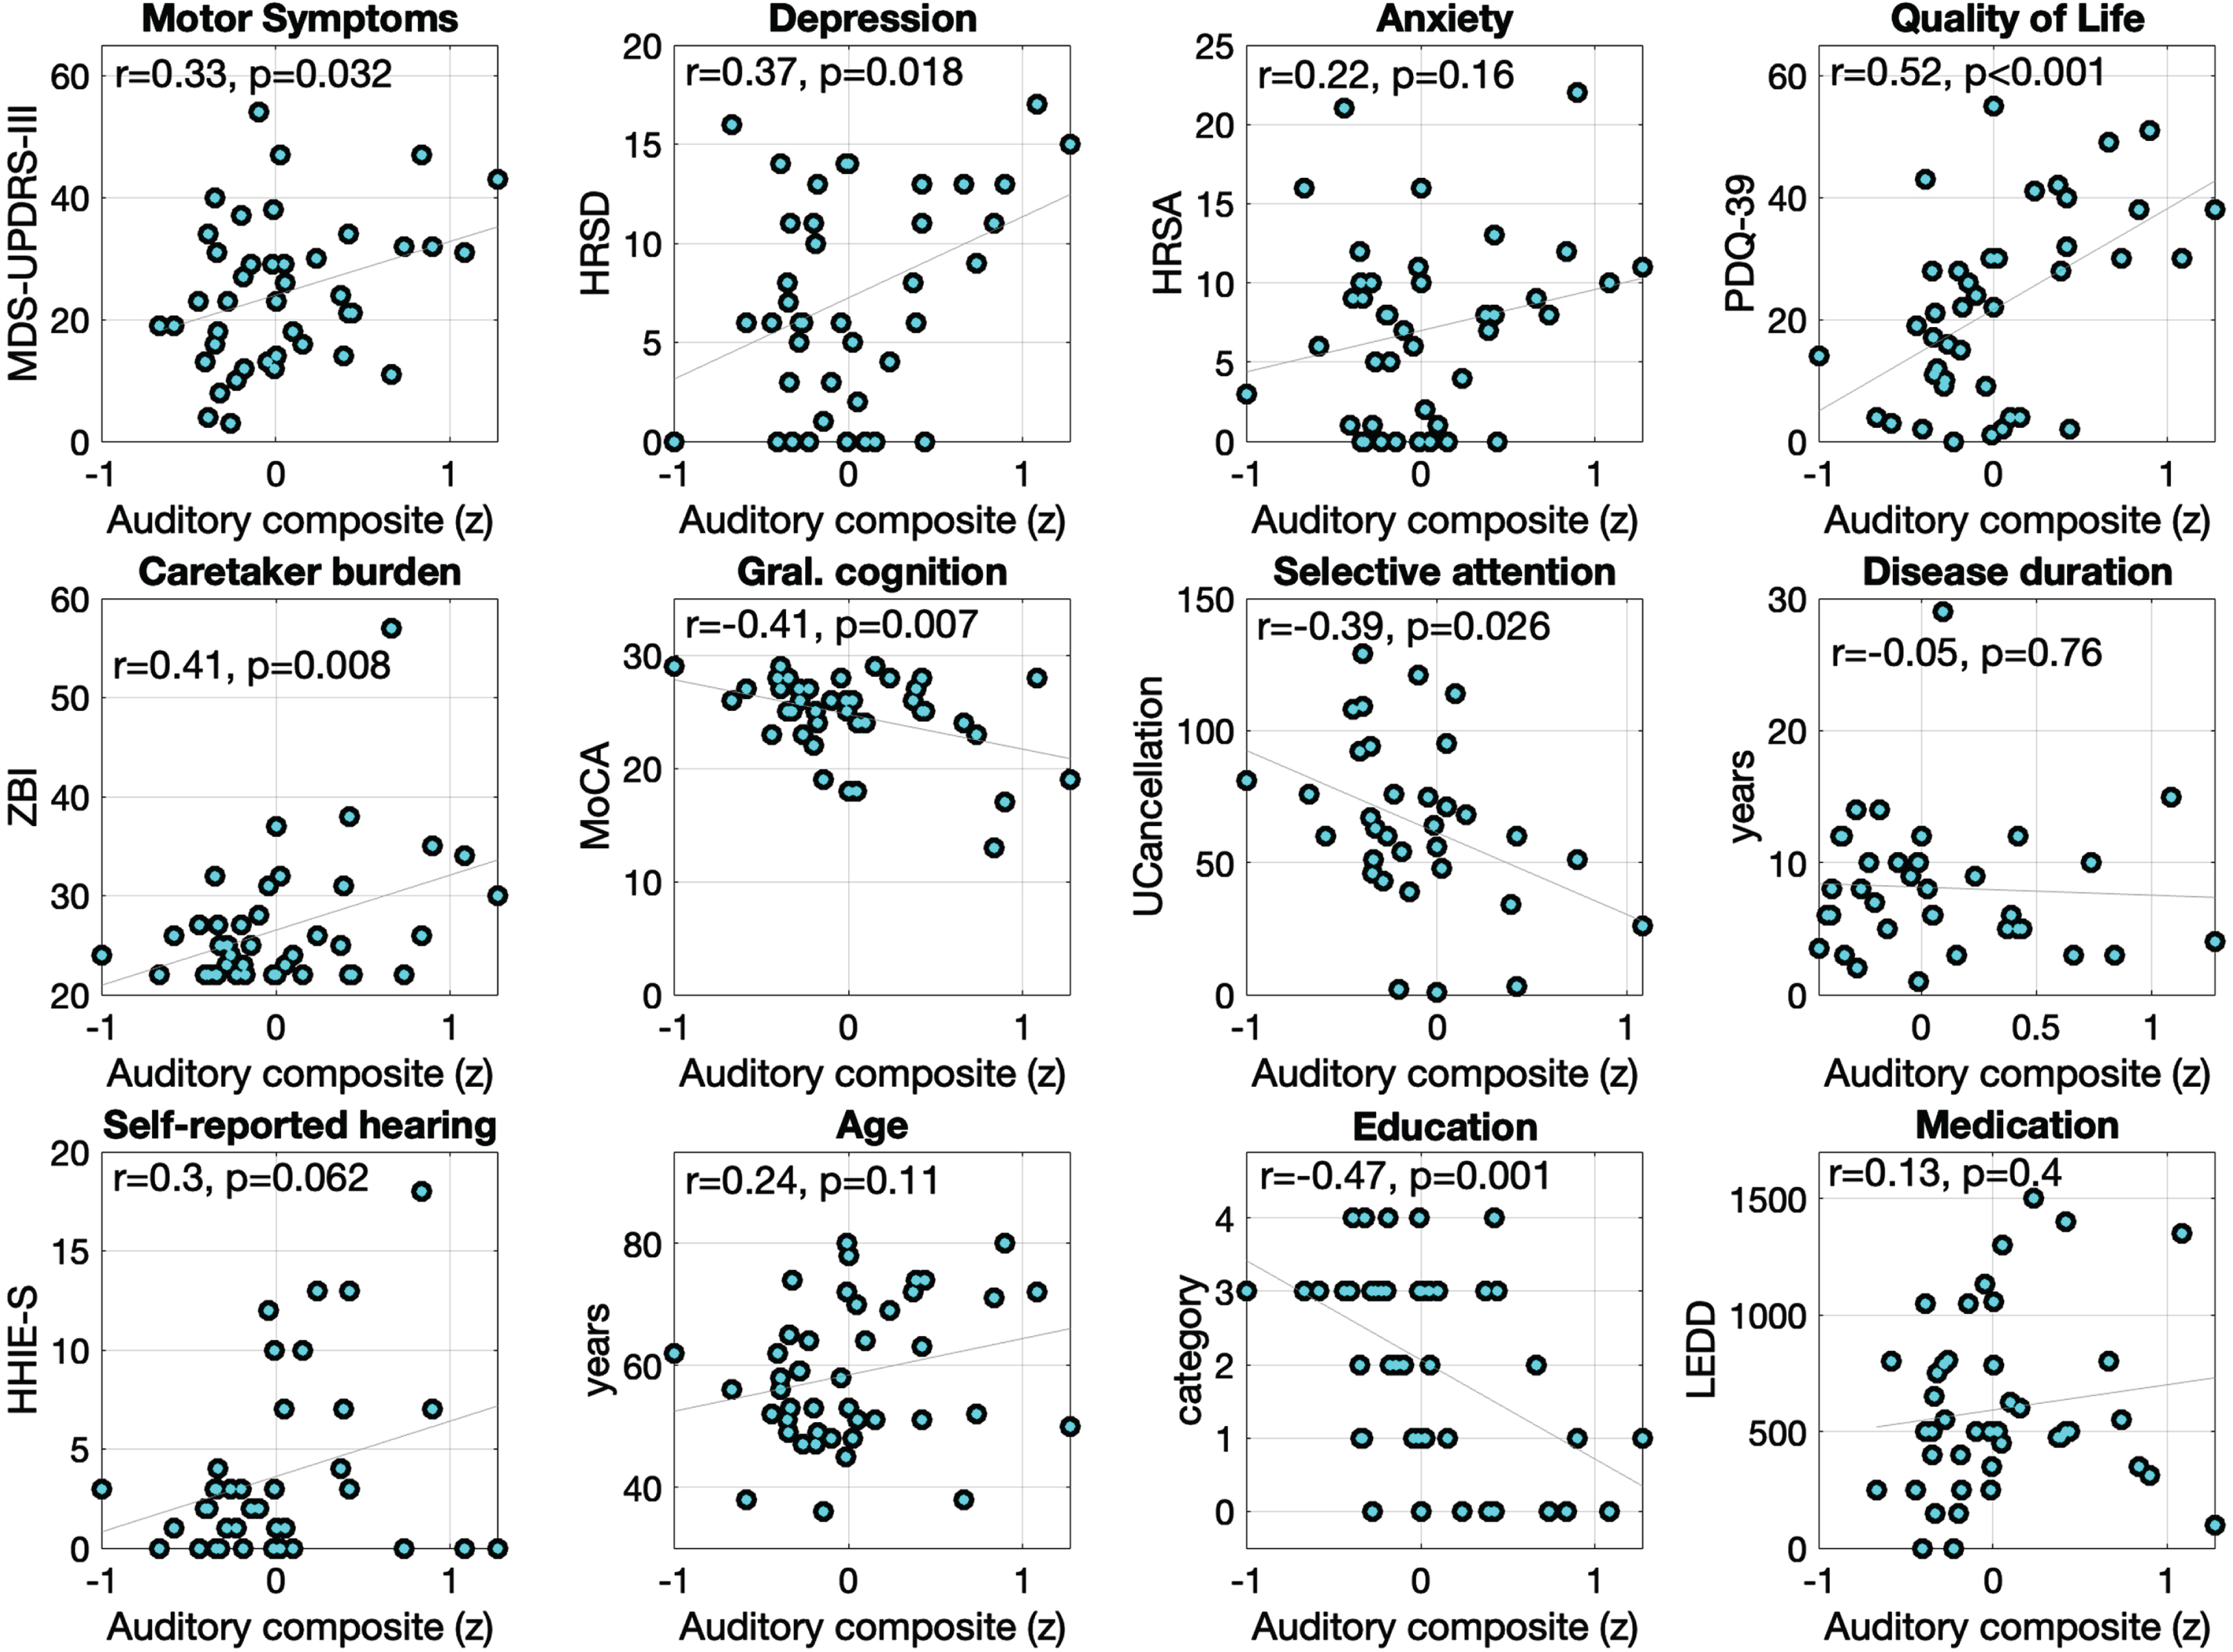
Within the PwPs group, there were statistically significant correlations between the auditory composite and the clinical variables MDS-UPDRS-III (r (40) = 0.33, p = 0.03), depression (r (39) = 0.37, p = 0.01), quality of life (r (39) = 0.52, p = 0.001), and caregiver burden (r (39) = 0.41, p = 0.008). These results indicate that worse auditory processing is related to worse motor and depressive symptoms, increased difficulties in daily living activities, and higher burden for the caregivers. No statistically significant correlations were found between auditory processing and measures of anxiety, disease duration (years), or levodopa intake (LEDD) (ps≥0.16).
For cognitive measures, better auditory processing was associated with better scores in the MoCA (r (39) = 0.41, p = 0.007) and UCancellation (i.e., Selective attention, r (32) = 0.39, p = 0.024). Further, auditory processing showed a trending relationship with HHIE-S (r (38) = 0.30, p = 0.062) where participants reporting more hearing handicap trended to show worse auditory processing. Finally, we observed a statistically significant correlation between auditory processing and education (r (42) = 0.47, p < 0.001), but not with the age of the participants (r (42) = 0.24, p = 0.11).
To further characterize relationships between auditory, cognitive, and clinical variables in PwPs, we computed three auditory composite scores grouped by their association to auditory processing hierarchy (see Table 2). The low-level composite was significantly correlated to PD duration, HHIE-S, and age. The mid-level composite showed a trending correlation with MDS-UPDRS-III and UCancellation, and statistically significant correlations to clinical variables of depression, quality of life, caregiver burden, and education. The high-level auditory composite showed only a significant correlation with the MoCA total score, and a trending relationship to HHIE-S. Scatter plots for the three additional composite scores with sub-groups of assessments can be found in Supplementary Figures 1–3).
Table 2
Correlations between the auditory composite scores and clinical, cognitive, and demographic variables of interest in the PD group
| Gral. composite r (p) | Low-level r (p) | Mid-level r (p) | High level r (p) | |
| Age | 0.24 (0.11) | 0.45 (0.003)* | 0.12 (0.42) | 0.18 (0.23) |
| Education | –0.47 (0.001)* | –0.16 (0.30) | –0.48 (0.001)* | –0.04 (0.80) |
| Disease duration | –0.05 (0.76) | –0.38 (0.028)* | –0.03 (0.85) | 0.18 (0.29) |
| MDS-UPDRS-III | 0.33 (0.032)* | –0.02 (0.88) | 0.33 (0.036)* | 0.10 (0.51) |
| LEDD | 0.13 (0.4) | –0.04 (0.80) | 0.19 (0.22) | –0.08 (0.62) |
| HRS depression | 0.37 (0.018)* | –0.03 (0.84) | 0.42 (0.007)* | –0.01 (0.96) |
| HRS anxiety | 0.22 (0.16) | –0.17 (0.31) | 0.25 (0.11) | 0.10 (0.51) |
| MoCA total score | –0.41 (0.007)* | –0.14 (0.39) | –0.19 (0.22) | –0.59 (<0.0001)* |
| UCancellation | –0.39 (0.026)* | –0.28 (0.11) | –0.35 (0.049)* | 0.02 (0.92) |
| HHIE-S | 0.3 (0.062) | 0.53 (0.001)* | 0.12 (0.45) | 0.3 (0.059) |
| Quality of life (PDQ-39) | 0.52 (<0.001)* | –0.04 (0.80) | 0.51 (0.001)* | 0.18 (0.25) |
| Caregiver burden (ZBI) | 0.41 (0.008)* | –0.13 (0.44) | 0.39 (0.013)* | 0.16 (0.31) |
HHIES, Hearing Handicap Inventory for the Elderly in Spanish; HRS, Hamilton Rating Scale; MoCA, Montreal Cognitive Assessment. Note p-values are not corrected for multiple comparisons.
DISCUSSION
In this study, we collected a wide scope of auditory processing measures to investigate what aspects of auditory processing might be compromised in PwPs. We used PART, a validated, freely available, cross platform, mobile laboratory-grade auditory testing app, which provides easy opportunity for replication. We found no evidence of alterations in auditory processing in PwPs compared to an age-, education- and general cognition-matched control group without PD. Only self-reported hearing handicap, which was in the normal range for both groups, showed a significant difference between groups, however this measure indicated lower hearing handicap for PwPs in this study. Notably, we did find significant associations between overall auditory processing and clinical scales of cognitive state, motor symptom severity, depression, quality of life, and burden of the caregiver.
These results suggest that in early and middle stages of PD, auditory processing may play an important role in dealing with the inherent difficulties of the illness. Therefore, auditory measures may serve as behavioral biomarkers that provide information about the non-motor symptoms of PD. Even in the absence of additional auditory difficulties inherent to PD, auditory difficulty in PwPs may contribute to disease burden in several aspects including motor, affective, functional, and cognitive domains. These data, combined with other research suggesting that hearing difficulty can increase the risk of expressing PD [7] and dementia [8, 9, 39, 40] in persons without PD, provides good reason to adopt measures of central auditory processing more broadly in this clinical population.
We further analyzed the relationship between auditory processing scores and cognitive measures which have become essential to describe the non-motor spectrum of PD [3, 66]. We found a medium size correlation between auditory processing and the UCancellation test, which evaluates sustained and selective visual attention under highly similar distractors [45]. The association indicates that visual attention and auditory processing share a portion of variance in this sample, but also, have the potential to be differentially informative. We also found a moderate correlation between the auditory processing composite and the MoCA total score. The MoCA is typically used as a general screen test for cognitive decline and it measures several cognitive sub-domains including executive processes, attention and working memory [48]. The correlation with the MoCA assessment indicates that the auditory measure scores share a common variance with general cognitive performance, in line with previous reports [67, 68]. Overall, PwPs that showed reduced cognitive capacity also struggled with the auditory assessment. These results indicate that auditory processes could contribute to construct a more detailed understanding of non-motor, specifically cognitive symptoms of PwPs at the individual level.
To further characterize the observed relationship between the general auditory processing composite and the clinical and cognitive measures, we computed three sub-composites: 1) low-level (four-frequency PTA; mainly sensitive to peripheral function); 2) mid-level (Gap, FMs, and STMs; sensitive to central function); and 3) high-level (SRM collocated, SRM separated, and DSI; intimately linked to cognitive function). Starting from the top, this analysis indicated that the high-level composite was the main driver of the correlation with the MoCA. Therefore, SRM measures might be incorporated as part of traditional neuropsychological batteries for cognitive assessment of PwPs. Whether speech in competition might represent a reliable predictor of cognitive decline and future dementia in PD remains to be explored. The correlation with motor symptoms (MDS-UPDRS-III), depression (HRSD), quality of life (PDQ-39), caregiver burden (ZBI), the cognitive measure of UCancellation, and the demographic variable of years of education were mainly driven by the mid-level composite. This result indicates that middle-level auditory processing, mainly composed here of the spectral and temporal features of sound, is the one more strongly related to the severity and impact of motor and non-motor symptoms. From a neurological perspective, assessment of middle-level processes might become informative of potential worsening of PD symptomatology due to hearing impairment. Lastly, the low-level composite was the main driver of the correlation with self-reported hearing (HHIE-S) with a likely contribution by the high-level composite which showed a marginally significant relationship. Further, the low-level composite showed a significant correlation with the variables of disease duration and age of the participant. This association opens the question about whether low-level auditory processing better indexes the progressive decline of the auditory pathway associated with aging, compared to superior processing. The association observed for disease duration was in the opposite direction than expected, where people with longer disease durations had worse hearing thresholds. This relationship is difficult to explain and will need to be confirmed in other samples. Overall, although our observations on the sub-composites should be taken as post hoc and preliminary as they are not controlled for multiple comparisons, our results suggest that measures of central auditory processing may carry important differential clinical information for PD.
Limitations
PwPs in our study were instructed to participate while being ON their medication as in [12, 14, 15, 17] and so our findings are limited to the medicated-ON state. This is important to note since dopamine receptors are found all along the auditory pathway except for the superior olivary complex [69], and cochlear activity has been shown to be affected by dopamine agonists [11, 15]. We did not find a statistically significant relationship between LEDD and auditory processing performance in this sample, however, further exploring this relationship with PwPs OFF medication still represents an important aspect to test this relationship.
Further, the vast majority PwPs in our sample showed low or middle motor symptom severity, with 92% of them having a score lower than 3 in the Hoehn and Yahr scale, and the mean disease duration was 8±5. Importantly, we specifically recruited people without severe cognitive or auditory complaints. PwPs with cognitive and/or auditory complaints as well as those with more severe motor symptoms and disease duration might manifest differences that were not yet expressed in the sample under investigation here. We note that other studies that found significant auditory difficulty in PwPs included participants with longer disease durations [16].
It is thus important to recognize that while we failed to find evidence of differences in hearing between PwPs and controls, this could be due to many factors, including the sample size, medication, early and middle stage of disease progression, selection criteria, etc. Also, we did not collect clinical scale measures on the comparison control group, and we cannot say whether the observed relationships between auditory processing measures and clinical scale variables would also be present in those without PD. However, we might expect restricted score ranges in some scales (e.g., MDS-UPDRS-III and Hoehn & Yahr scale) that would prevent meaningful analysis. While our findings are broadly consistent with the extant literature, where a number of other studies failing to find differences among similar groups and sample sizes as this study [15, 19, 20], studies with similar groups and sample sizes that found differences in peripheral [11, 12, 17], and central [14–16] auditory measures serve to indicate there is complexity to unveil before we are able to answer conclusively whether there is auditory processing challenge in PwPs beyond what can be expected for matched controls and in what measures.
Conclusion
This study demonstrates feasibility of use of a freely available testing platform (PART) to better understand auditory processing in PwPs. While our findings suggest that auditory processing may be preserved in PwPs with recent disease onset and low to middle severity of the disease, further research is needed to undertand the extent to which auditory processing may manifest heterogeneously and be a moderator of motor and non-motor symptoms in the PwPs population. Further, our findings of significant differential relationships between hearing with clinical variables of motor symptom severity, cognitive decline, depression, quality of life and caregiver burden within the PwPs group indicates that collecting auditory measures from PwPs may have potential clinical value for prognostic purposes.
Importantly, the PART app is a free-to-use app that can be employed by other research groups to promote collection of larger-samples in more diverse participants and contexts. Replication and meta-analysis with a diversity of standardized measures may be what is necessary to better answer what type of alterations in auditory processing can occur with PD. As such, this study represents just a first step towards better understanding of auditory processing alterations in PwPs and the diversity in which they may manifest. Current clinical guidance on PD is largely silent on the auditory alterations that can occur [70] and the way they relate to other motor and non-motor symptoms of the disease. Additional research is needed to study the relationship between auditory, cognitive, and clinical variables in PwPs, and ultimately pave a path towards improving clinical care provided for PwPs.
ACKNOWLEDGMENTS
The authors thank Diego Ignacio Moreno AragÓn for the design of the recruitment posters and flyers. Special thanks to the UC Brain Game Center for contributing the tablets and headphones used for data collection.
FUNDING
The authors have no funding to report.
CONFLICT OF INTEREST
The authors have no conflict of interest to report.
DATA AVAILABILITY
The data supporting the findings of this study are available on request from the corresponding author.
SUPPLEMENTARY MATERIAL
[1] The supplementary material is available in the electronic version of this article: https://dx.doi.org/10.3233/JPD-230458.
REFERENCES
[1] | Ou Z , Pan J , Tang S , Duan D , Yu D , Nong H , Wang Z ((2021) ) Global trends in the incidence, prevalence, and years lived with disability of Parkinson’s disease in 204 countries/territories from 1990 to 2019. Front Public Health 9: , 776847. |
[2] | Jenny AL , Meyer A , Handabaka I , Calabrese P , Fuhr P , Gschwandtner U ((2020) ) Nonmotor-related quality of life in Parkinson’s patients with subjective memory complaints: Comparison with PDQ-39. Parkinsons Dis 2020: , 7953032. |
[3] | Aarsland D , Batzu L , Halliday GM , Geurtsen GJ , Ballard C , Ray Chaudhuri K , Weintraub D ((2021) ) Parkinson disease-associated cognitive impairment. Nat Rev Dis Primer 7: , 47. |
[4] | Erro R , Santangelo G , Barone P , Vitale C ((2015) ) Nonmotor symptoms in Parkinson’s disease: Classification and management. J Parkinsonism Restless Legs Syndr 2015: , 5. |
[5] | Folmer RL , Vachhani JJ , Riggins A ((2021) ) Electrophysiological evidence of auditory and cognitive processing deficits in Parkinson disease. BioMed Res Int 2021: , 6610908. |
[6] | Barone P , Erro R , Picillo M ((2017) ) Quality of life and nonmotor symptoms in Parkinson’s disease. Int Rev Neurobiol 133: , 499–516. |
[7] | Lai SW , Liao KF , Lin CL , Lin CC , Sung FC ((2014) ) Hearing loss may be a non-motor feature of Parkinson’s disease in older people in Taiwan. Eur J Neurol 21: , 752–757. |
[8] | Livingston G , Sommerlad A , Orgeta V , Costafreda SG , Huntley J , Ames D , Ballard C , Banerjee S , Burns A , Cohen-Mansfield J , Cooper C , Fox N , Gitlin LN , Howard R , Kales HC , Larson EB , Ritchie K , Rockwood K , Sampson EL , Samus Q , Schneider LS , Selbæk G , Teri L , Mukadam N ((2017) ) Dementia prevention, intervention, and care. Lancet 390: , 2673–2734. |
[9] | Livingston G , Huntley J , Sommerlad A , Ames D , Ballard C , Banerjee S , Brayne C , Burns A , Cohen-Mansfield J , Cooper C , Costafreda SG , Dias A , Fox N , Gitlin LN , Howard R , Kales HC , Kivimäki M , Larson EB , Ogunniyi A , Orgeta V , Ritchie K , Rockwood K , Sampson EL , Samus Q , Schneider LS , Selbæk G , Teri L , Mukadam N ((2020) ) Dementia prevention, intervention, and care: 2020 report of the Lancet Commission. Lancet 396: , 413–446. |
[10] | Leme MS , Sanches SGG , Carvallo RMM ((2023) ) Peripheral hearing in Parkinson’s disease: A systematic review. Int J Audiol 62: , 805–813. |
[11] | Pisani V , Sisto R , Moleti A , Di Mauro R , Pisani A , Brusa L , Altavista MC , Stanzione P , Di Girolamo S ((2015) ) An investigation of hearing impairment in de-novo Parkinson’s disease patients: A preliminary study. Parkinsonism Relat Disord 21: , 987–991. |
[12] | Vitale C , Marcelli V , Allocca R , Santangelo G , Riccardi P , Erro R , Amboni M , Pellecchia MT , Cozzolino A , Longo K , Picillo M , Moccia M , Agosti V , Sorrentino G , Cavaliere M , Marciano E , Barone P ((2012) ) Hearing impairment in Parkinson’s disease: Expanding the nonmotor phenotype. Mov Disord 27: , 1530–1535. |
[13] | Yýlmaz S , Karalý E , Tokmak A , Güçlü E , Koçer A , Öztürk Ö ((2009) ) Auditory evaluation in Parkinsonian patients. Eur Arch Otorhinolaryngol 266: , 669–671. |
[14] | Lewald J , Schirm SN , Schwarz M ((2004) ) Sound lateralization in Parkinson’s disease. Cogn Brain Res 21: , 335–341. |
[15] | Lopes MDS , Melo ADS , Corona AP , NÓbrega AC ((2018) ) Is there auditory impairment in Parkinson’s disease? Rev CEFAC 20: , 573–582. |
[16] | Guehl D , Burbaud P , Lorenzi C , Ramos C , Bioulac B , Semal C , Demany L ((2008) ) Auditory temporal processing in Parkinson’s disease. Neuropsychologia 46: , 2326–2335. |
[17] | Vitale C , Marcelli V , Abate T , Pianese A , Allocca R , Moccia M , Spina E , Barone P , Santangelo G , Cavaliere M ((2016) ) Speech discrimination is impaired in parkinsonian patients: Expanding the audiologic findings of Parkinson’s disease. Parkinsonism Relat Disord 22: , S138–S143. |
[18] | Folmer RL , Vachhani JJ , Theodoroff SM , Ellinger R , Riggins A ((2017) ) Auditory processing abilities of Parkinson’s disease patients. Biomed Res Int 2017: , 2618587. |
[19] | De Keyser K , De Letter M , De Groote E , Santens P , Talsma D , Botteldooren D , Bockstael A ((2019) ) Systematic audiological assessment of auditory functioning in patients with Parkinson’s disease. J Speech Lang Hear Res 62: , 4564–4577. |
[20] | Gökay NY , Gündüz B , Söke F , Karamert R ((2021) ) Evaluation of efferent auditory system and hearing quality in Parkinson’s disease: Is the difficulty in speech understanding in complex listening conditions related to neural degeneration or aging? J Speech Lang Hear Res 64: , 263–271. |
[21] | Lelo De Larrea-Mancera ES , Stavropoulos T , Hoover EC , Eddins DA , Gallun FJ , Seitz AR ((2020) ) Portable Automated Rapid Testing (PART) for auditory assessment: Validation in a young adult normal-hearing population. J Acoust Soc Am 148: , 1831–1851. |
[22] | Gallun FJ , Seitz A , Eddins DA , Molis MR , Stavropoulos T , Jakien KM , Kampel SD , Diedesch AC , Hoover EC , Bell K , Souza PE , Sherman M , Calandruccio L , Xue G , Taleb N , Sebena R , Srinivasan N ((2018) ) Development and validation of Portable Automated Rapid Testing (PART) measures for auditory research. Proc Meet Acoust 33: , 050002. |
[23] | Lelo De Larrea-Mancera ES , Solís-Vivanco R , Sánchez-Jimenez Y , Coco L , Gallun FJ , Seitz AR ((2023) ) Development and validation of a Spanish-language spatial release from masking task in a Mexican population. J Acoust Soc Am 153: , 316–327. |
[24] | Postuma RB , Berg D , Stern M , Poewe W , Olanow CW , Oertel W , Obeso J , Marek K , Litvan I , Lang AE , Halliday G , Goetz CG , Gasser T , Dubois B , Chan P , Bloem BR , Adler CH , Deuschl G ((2015) ) MDS clinical diagnostic criteria for Parkinson’s disease: MDS-PD Clinical Diagnostic Criteria. Mov Disord 30: , 1591–1601. |
[25] | Tomlinson CL , Stowe R , Patel S , Rick C , Gray R , Clarke CE ((2010) ) Systematic review of levodopa dose equivalency reporting in Parkinson’s disease. Mov Disord 25: , 2649–2653. |
[26] | Hoehn MM , Yahr MD ((1967) ) Parkinsonism: Onset, progression, and mortality. Neurology 50: , 318–318. |
[27] | Goetz CG , Tilley BC , Shaftman SR , Stebbins GT , Fahn S , Martinez-Martin P , Poewe W , Sampaio C , Stern MB , Dodel R , Dubois B , Holloway R , Jankovic J , Kulisevsky J , Lang AE , Lees A , Leurgans S , LeWitt PA , Nyenhuis D , Olanow CW , Rascol O , Schrag A , Teresi JA , Van Hilten JJ , LaPelle N ((2008) ) Movement Disorder Society-sponsored revision of the Unified Parkinson’s Disease Rating Scale (MDS-UPDRS): Scale presentation and clinimetric testing results. Mov Disord 23: , 2129–2170. |
[28] | Martinez-Martin P , Rodriguez-Blazquez C , Alvarez-Sanchez M , Arakaki T , Bergareche-Yarza A , Chade A , Garretto N , Gershanik O , Kurtis MM , Martinez-Castrillo JC , Mendoza-Rodriguez A , Moore HP , Rodriguez-Violante M , Singer C , Tilley BC , Huang J , Stebbins GT , Goetz CG ((2013) ) Expanded and independent validation of the Movement Disorder Society–Unified Parkinson’s Disease Rating Scale (MDS-UPDRS). J Neurol 260: , 228–236. |
[29] | Lelo De Larrea-Mancera ES , Solís-Vivanco R , Sánchez-Jiménez Y , Padilla-Bustos K , Correa-Medina EI , Clamage DS , Bologna WJ , Gallun FJ , Seitz AR ((2023) ) Testing the informativeness of diverse measures of auditory processing for clinical audiological practice in middle-aged adults in Mexico. Am J Audiol 33: , 55–65. |
[30] | Grose JH , Mamo SK ((2012) ) Frequency modulation detection as a measure of temporal processing: Age-related monaural and binaural effects. Hear Res 294: , 49–54. |
[31] | Gallun FJ , McMillan GP , Molis MR , Kampel SD , Dann SM , Konrad-Martin DL ((2014) ) Relating age and hearing loss to monaural, bilateral, and binaural temporal sensitivity. Front Neurosci 8: , 172. |
[32] | Hoover E , Pasquesi L , Souza P ((2015) ) Comparison of clinical and traditional gap detection tests. J Am Acad Audiol 26: , 540–546. |
[33] | Hoover EC , Kinney BN , Bell KL , Gallun FJ , Eddins DA ((2019) ) A comparison of behavioral methods for indexing the auditory processing of temporal fine structure cues. J Speech Lang Hear Res 62: , 2018–2034. |
[34] | Bernstein JGW , Mehraei G , Shamma S , Gallun FJ , Theodoroff SM , Leek MR ((2013) ) Spectrotemporal modulation sensitivity as a predictor of speech intelligibility for hearing-impaired listeners. J Am Acad Audiol 24: , 293–306. |
[35] | Sabin AT , Eddins DA , Wright BA ((2012) ) Perceptual learning evidence for tuning to spectrotemporal modulation in the human auditory system. J Neurosci 32: , 6542–6549. |
[36] | Stavropoulos TA , Isarangura S , Hoover EC , Eddins DA , Seitz AR , Gallun FJ ((2021) ) Exponential spectro-temporal modulation generation. J Acoust Soc Am 149: , 1434–1443. |
[37] | Gallun FJ , Diedesch AC , Kampel SD , Jakien KM ((2013) ) Independent impacts of age and hearing loss on spatial release in a complex auditory environment. Front Neurosci 7: , 252. |
[38] | Fifer RC , Jerger JF , Berlin CI , Tobey EA , Campbell JC ((1983) ) Development of a dichotic sentence identification test for hearing-impaired adults. Ear Hear 4: , 300–305. |
[39] | Gates GA , Anderson ML , McCurry SM , Feeney MP , Larson EB ((2011) ) Central auditory dysfunction as a harbinger of Alzheimer dementia. Arch Otolaryngol Neck Surg 137: , 390. |
[40] | Mohammed A , Gibbons LE , Gates G , Anderson ML , McCurry SM , McCormick W , Bowen JD , Grabowski TJ , Crane PK , Larson EB ((2022) ) Association of performance on dichotic auditory tests with risk for incident dementia and Alzheimer dementia. JAMA Otolaryngol Neck Surg 148: , 20. |
[41] | Newman CW , Weinstein BE , Jacobson GP , Hug GA ((1990) ) The hearing handicap inventory for adults: Psychometric adequacy and audiometric correlates. Ear Hear 11: , 430–433. |
[42] | Lichtenstein MJ , Hazuda HP ((1998) ) Crosscultural adaptation of the Hearing Handicap Inventory for the Elderly-Screening Version (HHIE-S) for use with Spanish-speaking Mexican Americans. J Am Geriatr Soc 46: , 492–498. |
[43] | López-Vázquez Món , Orozco JA , Jiménez G , Berruecos P ((2002) ) Spanish hearing impairment inventory for the elderly: Cuestionario en Español sobre debilidad auditiva para adultos mayores. Int J Audiol 41: , 221–230. |
[44] | ((1989) ) Guidelines for the identification of hearing impairment/handicap in adult/elderly persons. ASHA 31: , 59–63. |
[45] | Pahor A , Mester RE , Carrillo AA , Ghil E , Reimer JF , Jaeggi SM , Seitz AR ((2022) ) UCancellation: A new mobile measure of selective attention and concentration. Behav Res Methods 54: , 2602–2617. |
[46] | Brickenkamp R , Zillmer E ((1998) ) Test d2: Concentration-endurance test. CJ Hogrefe, Gottingen. |
[47] | Adwani S , Yadav R , Kumar K , Chandra S , Pal P ((2016) ) Neuropsychological profile in early Parkinson′ disease: Comparison between patients with right side onset versus left side onset of motor symptoms. Ann Indian Acad Neurol 19: , 74. |
[48] | Nasreddine ZS , Phillips NA , Bédirian V , Charbonneau S , Whitehead V , Collin I , Cummings JL , Chertkow H ((2005) ) The Montreal Cognitive Assessment, MoCA: A brief screening tool for mild cognitive impairment. J Am Geriatr Soc 53: , 695–699. |
[49] | Aguilar-Navarro SG , Mimenza-Alvarado AJ , Palacios-García AA , Samudio-Cruz A , Gutiérrez-Gutiérrez LA , Ávila-Funes JA ((2018) ) Validez y confiabilidad del MoCA (Montreal Cognitive Assessment) para el tamizaje del deterioro cognoscitivo en méxico. Rev Colomb Psiquiatr 47: , 237–243. |
[50] | Chou KL , Amick MM , Brandt J , Camicioli R , Frei K , Gitelman D , Goldman J , Growdon J , Hurtig HI , Levin B , Litvan I , Marsh L , Simuni T , Tröster AI , Uc EY, on behalf of the Parkinson Study Group Cognitive/Psychiatric Working Group ((2010) ) A recommended scale for cognitive screening in clinical trials of Parkinson’s disease. Mov Disord 25: , 2501–2507. |
[51] | Fengler S , Kessler J , Timmermann L , Zapf A , Elben S , Wojtecki L , Tucha O , Kalbe E ((2016) ) Screening for cognitive impairment in Parkinson’s disease: Improving the diagnostic utility of the MoCA through subtest weighting. PLoS One 11: , e0159318. |
[52] | Hamilton M ((1960) ) A rating scale for depression. J Neurol Neurosurg Psychiatry 23: , 56–62. |
[53] | Rohan KJ , Rough JN , Evans M , Ho S-Y , Meyerhoff J , Roberts LM , Vacek PM ((2016) ) A protocol for the Hamilton Rating Scale for Depression: Item scoring rules, Rater training, and outcome accuracy with data on its application in a clinical trial. J Affect Disord 200: , 111–118. |
[54] | Hamilton M ((1959) ) The assessment of anxiety states by rating. Br J Med Psychol 32: , 50–55. |
[55] | Matza LS , Morlock R , Sexton C , Malley K , Feltner D ((2010) ) Identifying HAM-A cutoffs for mild, moderate, and severe generalized anxiety disorder. Int J Methods Psychiatr Res 19: , 223–232. |
[56] | Jenkinson C , Fitzpatrick R , Peto V , Greenhall R , Hyman N ((1997) ) The Parkinson’s Disease Questionnaire (PDQ-39): Development and validation of a Parkinson’s disease summary index score. Age Ageing 26: , 353–357. |
[57] | Morley D , Dummett S , Kelly L , Dawson J , Jenkinson C ((2015) ) Evaluating the psychometric properties of an e-based version of the 39-item Parkinson’s Disease Questionnaire. Health Qual Life Outcomes 13: , 5. |
[58] | Peto V , Jenkinson C , Fitzpatrick R ((1998) ) PDQ-39: A review of the development, validation and application of a Parkinson’s disease quality of life questionnaire and its associated measures. J Neurol 245: , S10–S14. |
[59] | Kühnel MB , Ramsenthaler C , Bausewein C , Fegg M , Hodiamont F ((2020) ) Validation of two short versions of the Zarit Burden Interview in the palliative care setting: A questionnaire to assess the burden of informal caregivers. Support Care Cancer 28: , 5185–5193. |
[60] | Hébert R , Bravo G , Préville M ((2000) ) Reliability, validity and reference values of the Zarit Burden Interview for assessing informal caregivers of community-dwelling older persons with dementia. Can J Aging Rev Can Vieil 19: , 494–507. |
[61] | Maharani A , Pendleton N , Leroi I ((2019) ) Hearing impairment, loneliness, social isolation, and cognitive function: Longitudinal analysis using English Longitudinal Study on Ageing. Am J Geriatr Psychiatry 27: , 1348–1356. |
[62] | Shukla A , Harper M , Pedersen E , Goman A , Suen JJ , Price C , Applebaum J , Hoyer M , Lin FR , Reed NS ((2020) ) Hearing loss, loneliness, and social isolation: A systematic review. Otolaryngol Neck Surg 162: , 622–633. |
[63] | Tosin MHDS , Goetz CG , Luo S , Choi D , Stebbins GT ((2020) ) Item response theory analysis of the MDS – UPDRS Motor Examination: Tremor vs. nontremor items. Mov Disord 35: , 1587–1595. |
[64] | Lee HK , Altmann LJP , McFarland N , Hass CJ ((2016) ) The relationship between balance confidence and control in individuals with Parkinson’s disease. Parkinsonism Relat Disord 26: , 24–28. |
[65] | Goetz CG , Poewe W , Rascol O , Sampaio C , Stebbins GT , Counsell C , Giladi N , Holloway RG , Moore CG , Wenning GK , Yahr MD , Seidl L; Movement Disorder Society Task Force on Rating Scales for Parkinson’s Disease ((2004) ) Movement Disorder Society Task Force report on the Hoehn and Yahr staging scale: Status and recommendations. Mov Disord 19: , 1020–1028. |
[66] | Litvan I , Goldman JG , Tröster AI , Schmand BA , Weintraub D , Petersen RC , Mollenhauer B , Adler CH , Marder K , Williams-Gray CH , Aarsland D , Kulisevsky J , Rodriguez-Oroz MC , Burn DJ , Barker RA , Emre M ((2012) ) Diagnostic criteria for mild cognitive impairment in Parkinson’s disease: Movement Disorder Society Task Force guidelines. Mov Disord 27: , 349–356. |
[67] | Dryden A , Allen HA , Henshaw H , Heinrich A ((2017) ) The association between cognitive performance and speech-in-noise perception for adult listeners: A systematic literature review and meta-analysis. Trends Hear 21: , 233121651774467. |
[68] | Gallun FJ , Jakien KM ((2019) ) The ability to allocate attentional resources to a memory task predicts speech-on-speech masking for older listeners. Proceedings of the 23rd International Congress on Acoustics, pp. 8242–8249. |
[69] | Budinger E , Kanold PO ((2018) ) Auditory cortex circuits. In The Mammalian Auditory Pathways, Oliver DL, Cant NB, Fay RR, Popper AN, eds. Springer International Publishing, Cham, pp. 199–233. |
[70] | Mayo Clinic. Parkinson’s disease—Symptoms and causes. https://www.mayoclinic.org/diseases-conditions/parkinsons-disease/symptoms-causes/syc-20376055. Accessed September 18, (2022) . |

