
Modeling of Parkinson’s Disease Progression and Implications for Detection of Disease Modification in Treatment Trials
Abstract
Background:
Objectively measuring Parkinson’s disease (PD) signs and symptoms over time is critical for the successful development of treatments aimed at halting the disease progression of people with PD.
Objective:
To create a clinical trial simulation tool that characterizes the natural history of PD progression and enables a data-driven design of randomized controlled studies testing potential disease-modifying treatments (DMT) in early-stage PD.
Methods:
Data from the Parkinson’s Progression Markers Initiative (PPMI) were analyzed with nonlinear mixed-effect modeling techniques to characterize the progression of MDS-UPDRS part I (non-motor aspects of experiences of daily living), part II (motor aspects of experiences of daily living), and part III (motor signs). A clinical trial simulation tool was built from these disease models and used to predict probability of success as a function of trial design.
Results:
MDS-UPDRS part III progresses approximately 3 times faster than MDS-UPDRS part II and I, with an increase of 3 versus 1 points/year. Higher amounts of symptomatic therapy is associated with slower progression of MDS-UPDRS part II and III. The modeling framework predicts that a DMT effect on MDS-UPDRS part III could precede effect on part II by approximately 2 to 3 years.
Conclusions:
Our clinical trial simulation tool predicted that in a two-year randomized controlled trial, MDS-UPDRS part III could be used to evaluate a potential novel DMT, while part II would require longer trials of a minimum duration of 3 to 5 years underscoring the need for innovative trial design approaches including novel patient-centric measures.
Plain Language Summary
To develop effective medicines that can slow down or stop the progression of Parkinson’s disease (PD), it is important to accurately understand how the disease worsens over time. We used data from an observational study, led by the Michael J. Fox Foundation, called the Parkinson’s Progression Markers Initiative (PPMI) to understand the natural progression of PD. We simulated clinical trials on a computer using different scales to measure the progression of PD. We specifically looked at a physician-reported measure MDS-UPDRS part III, and at a patient-reported measure MDS-UPDRS part II of how PD symptoms worsen over time. To measure the effect of a new medicine slowing down the progression of PD using patient-reported measure MDS-UPDRS part II, we estimate that we may need to conduct a clinical trial of at least 3 to 5 years. On the other hand, to measure an effect using physician-reported measure MDS-UPDRS part III, the duration of the trial could be shorter than 2 years. We were also able to show that worsening recorded by the physician-reported measure MDS-UPDRS part III could be predictive of a later worsening recorded by the patient-reported measure MDS-UPDRS part II. We concluded that MDS-UPDRS part III may be a good endpoint for a clinical trial of a reasonable duration and that MDS-UPDRS part II could be measured in longer studies, for example, open-label extensions.
INTRODUCTION
There are no treatments which can slow down or stop the disease progression of people with Parkinson’s disease (PD) preserving their independence and quality of life.1–4 Objectively measuring PD signs and symptoms over time is critical for the successful development of treatments aimed at halting the disease progression of people with PD.
Quantitative approaches such as modeling and simulation are recognized as fundamental for maximizing the chance of developing effective therapeutic strategies in PD.5 Disease progression models, in particular, constitute relevant tools to elucidate the quantitative relationship between the patient population and the progression of an endpoint or measure of efficacy. Recent advances in the field of neurodegenerative diseases, particularly Alzheimer’s disease, have highlighted the importance of focusing on disease progression and have underscored the necessity of translating short-term effects on clinical rating scales into slowing of progression or time delays considered as more patient-centric measures.6–8 Indeed, a disease progression modeling framework enables to establish that “for population X, endpoint Y is expected to progress by Z points in a given timeframe”. This is fundamental for optimally designing clinical trials because, together with the hypothesis regarding the pharmacological properties of an experimental treatment, key design elements such as patient population, i.e., stage of the disease, endpoint, and other parameters such as treatment duration and/or dose can be optimized.9
The Unified Parkinson’s Disease Rating Scale developed by the Movement Disorder Society (MDS-UPDRS)10 represents one of the most used tools to assess PD progression. In particular, two out of the four parts of the scale which focus on motor manifestations—MDS-UPDRS part II and part III—are extensively studied and commonly considered as clinical endpoints for on-going disease-modifying trials.
MDS-UPDRS part III measures motor signs as assessed by clinicians, while MDS-UPDRS part II measures the motor aspect of daily living and is a patient self-reported assessment of motor symptoms and their impact on daily functions.
To support successful drug development, it is critical to develop predictions about expected change in the MDS-UPDRS sub-scores when a treatment is slowing down the disease. In particular, is the same magnitude of change expected for each of the MDS-UPDRS parts? Are the parts expected to change simultaneously, or is one preceding the others? And finally: Is the probability to detect disease modification in treatment trials significantly different when using one part compared to another?
Complementing clinimetric approaches which have generated important insights with respect to how MDS-UPDRS part II and part III should or should not be used in clinical trials,11,12 disease modeling can be used to characterize disease progression longitudinally and to disentangle the effect of symptomatic treatments.13–15 Such models can also be extended into clinical trial simulations. Altogether, the resulting framework can be used to make predictions about the probability of trial success when using either MDS-UPDRS part II or part III as endpoint in a targeted specific patient population, such as early PD.
We developed such disease progression models of early-stage PD leveraging natural history data from real world data (RWD), integrating—by means of pharmacological modeling—the effect of symptomatic treatments. We then checked the accuracy of these models using the placebo data from Roche clinical study PASADENA, a phase II study testing prasinezumab in early-stage PD.16
We extended the disease progression models into a clinical trial simulation framework to predict probability of study success of a randomized controlled trial when MDS-UPDRS part II and III are considered as potential study endpoints under the hypothesis of an effective intervention in slowing down disease progression.
METHODS
Data from PPMI and PASADENA
Data from the Parkinson’s Progression Markers Initiative (PPMI)17 from both PD and prodromal cohorts, from the September 2022 release, was used for the model development. Genetic forms of PD were excluded by filtering out subjects with presence of LRRK2, GBA, or SNCA mutations due to their impact on progression. Overall, data from a total of 401 (PD) and 65 (prodromal) subjects were included. The available time course data for MDS-UPDRS parts I, II, and III were used for models’ development.
PASADENA is a phase 2 randomized, double-blind, placebo-controlled trial, aimed at testing the efficacy of prasinezumab in participants with early-stage PD. Only the data from the placebo group (105 patients over a duration of 1 year) were used (after 1 year, patients from the placebo group were re-randomized into one of the two prasinezumab dose groups – see16 for further details). PASADENA data were used as an external evaluation from the PPMI-based model predictions of MDS-UPDRS parts I, II, and III.
For both PPMI and PASADENA, the levodopa equivalent daily dose (LEDD)18,19 was used as an input of the mathematical model of disease progression integrating the effect of the symptomatic treatments. Thus, the comparison with PASADENA data was performed balancing for symptomatic treatment use throughout the progression. Descriptive summary statistics for MDS-UPDRS parts and LEDD from both PPMI and PASADENA are presented in the Supplementary Material.
Disease progression modeling
There are multiple ways to model progression of the clinical score and the effect of symptomatic treatments.13 Over a pool of 32 different structural models combining various growth laws (linear, logistic or Gompertz) for the natural disease progression and various treatment effects (direct or indirect, linear or nonlinear), we selected a logistic progression model with a direct effect of symptomatic therapy on the clinical score to report the results. This selection is based on multiple criteria including past literature evidence, parsimony and model diagnostics. Details about the pool of 32 structural models can be found in the Supplementary Material. Statistics from parameters’ values from the pool of models were also calculated to confirm natural progression predictions.
In the logistic growth model, the MDS-UPDRS parts I, II and III were described by the following equation:
(1)
Where S denotes the clinical score. The first term in the first line of Equation (1) (mathematical integral) refers to the growth law (logistic model) while the second term refers to the effect of symptomatic treatments. The term S0 stands for the baseline of the clinical score and θ for its maximal value, also called plateau. The term α is the effect parameter of symptomatic treatments. It can be negative (LEDD reduces the score) or positive. The term D (t) denotes the dose of treatment and is taken equal to the LEDD value, normalized to the median of LEDD at the individual level. The model parameters were used to estimate a linearized natural disease progression speed, considered as a valid approximation of growth for the first years of the disease.
The model contains 4 parameters, 3 for the natural disease progression and one for the effect of treatment.
The regression problem was formulated using a population approach where the parameters were associated with random effects.20 Parameter estimation was performed in R 4.2.1 with the nlmixr2 package.21
We have tested the relevance of including several patient’s characteristics at baseline as model covariates to improve the data fit. Following medical expert guidance, we considered six potential covariates: sex, age, time from diagnosis, MDS-UPDRS part III score, Dopamine Transporter Single-Photon Emission Computerized Tomography (DaT-SPECT)22 putamen SBR average, and Hoehn and Yahr stage. The covariate search was performed on the selected model using a stepwise covariate model building procedure to identify relevant covariates to parameter estimates.23 More details can be found in the Supplementary Material.
Clinical trials simulations
The calculation of the probability of study success was performed based on a clinical trial simulation framework.
As opposed to symptomatic treatments, which alleviate symptoms without modifying the natural progression of the disease, our focus is on treatments expected to change disease progression trajectory due to their impact on the underlying disease biology. Such compounds aim at slowing down the progression of the disease.
Mathematically, taken the simplest assumption of a linear progression, the magnitude of effect of such intervention can be modeled too as a linear function of time:
(2)
Where the subscript i denotes the endpoint (i.e. MDS-UPDRS part II or part III). The term potency being a number between 0 and 1, where 0 indicates no effect and 1 indicates a total inhibition (stopping) of the progression.
In our simulations, we assumed a treatment effect between 20 and 50%, i.e., potency= [0.2, 0.5] in Equation (4). A range that appeared reasonable for the sake of such simulation exercise and given that 25% is frequently cited as an appropriate benchmark for clinical meaningfulness in Alzheimer’s disease studies.6–8 We assumed that the potency is the same on the progression of observable clinical endpoints such as MDS-UPDRS part III and part II reflecting the effect on the progression of the true (unobserved) disease. However, although the factor potency is the same, the effect can be different as indicated in the above equation because the natural progression slopes can be different.
To quantify the probability of success of trials using either MDS-UPDRS part III or part II, we simulated 10,000 clinical trials with a sample size of n = 500 or n = 1000 following the methodology by Mori et al.24
For each of these simulated trials and at different time points, we sample the treatment effect on MDS-UPDRS part III and part II from a normal distribution with mean representing a signal effect and given by Equation (2) above, and standard error representing a noise, function of the trial size (the larger the trial, the more precise is the estimates of the treatment effect).
A statistical test can further be calculated with the signal to noise ratio and treatment success declared if the p-value is lower than 5%; and probability of study success derived from the results of the test (success or not) over the 10’000 simulated trials. Additional details can be found in the Supplementary Material.
RESULTS
Parameter estimates, inter-individual and unexplained variability
All parameters of Equation 1 were estimated with relatively high precision (narrow confidence intervals) and their values are reported in Table 1.
Table 1
Summary of parameter estimates of the logistic growth model with symptomatic treatment effect of the time course of MDS-UPDRS parts III (off), II and I. CI, confidence interval; I.I.V, Inter-individual variability; CV, Coefficient of variation (for parameters log-normally distributed); sd, standard deviation (for parameters normally distributed)
| Estimated Progression | S0 (baseline) (95% CI) | θ (plateau) (95% CI) | α (symptomatic) (sd) | Tprog (95% CI) | |||||
| Population estimate | I.I.V (CV) | Population estimates | I.I.V. (CV) | Population estimate | I.I.V. (sd) | Population estimate | I.I.V. (CV) | ||
| MDS-UPDRS part I | 1 point/year | 4.3(4.0–4.7) | 75% | 16.2(14.3–18.2) | 25% | +0.2(0 – +0.4) | 2.8 | 69(53–91) | 91% |
| MDS-UPDRS part II | 1 point/year | 5.5(5.0–5.9) | 69% | 21.3(19.2–23.6) | 21% | –0.5(–0.7 – –0.3) | 2.8 | 84(68–104) | 81% |
| MDS-UPDRS part III (off) | 3 points/year | 20.5(19.6–21.5) | 41% | 43.3(40.7–46.2) | 23% | –0.6(–1.13 – –0.1) | 2.8 | 122(99–151) | 87% |
Estimated baseline scores (i.e., at PD diagnosis) were approximately 5 points for MDS-UPDRS parts II and I (motor and non-motor aspects of daily living or functional impairment) and 20 points for MDS-UPDRS part III (motor signs). The natural disease progression (given by Equation 3) was significantly faster for MDS-UPDRS part III with approximately 3 points per year versus parts II and I which progressed by approximately 1 point per year (Table 1 and Fig. 1).
Fig. 1
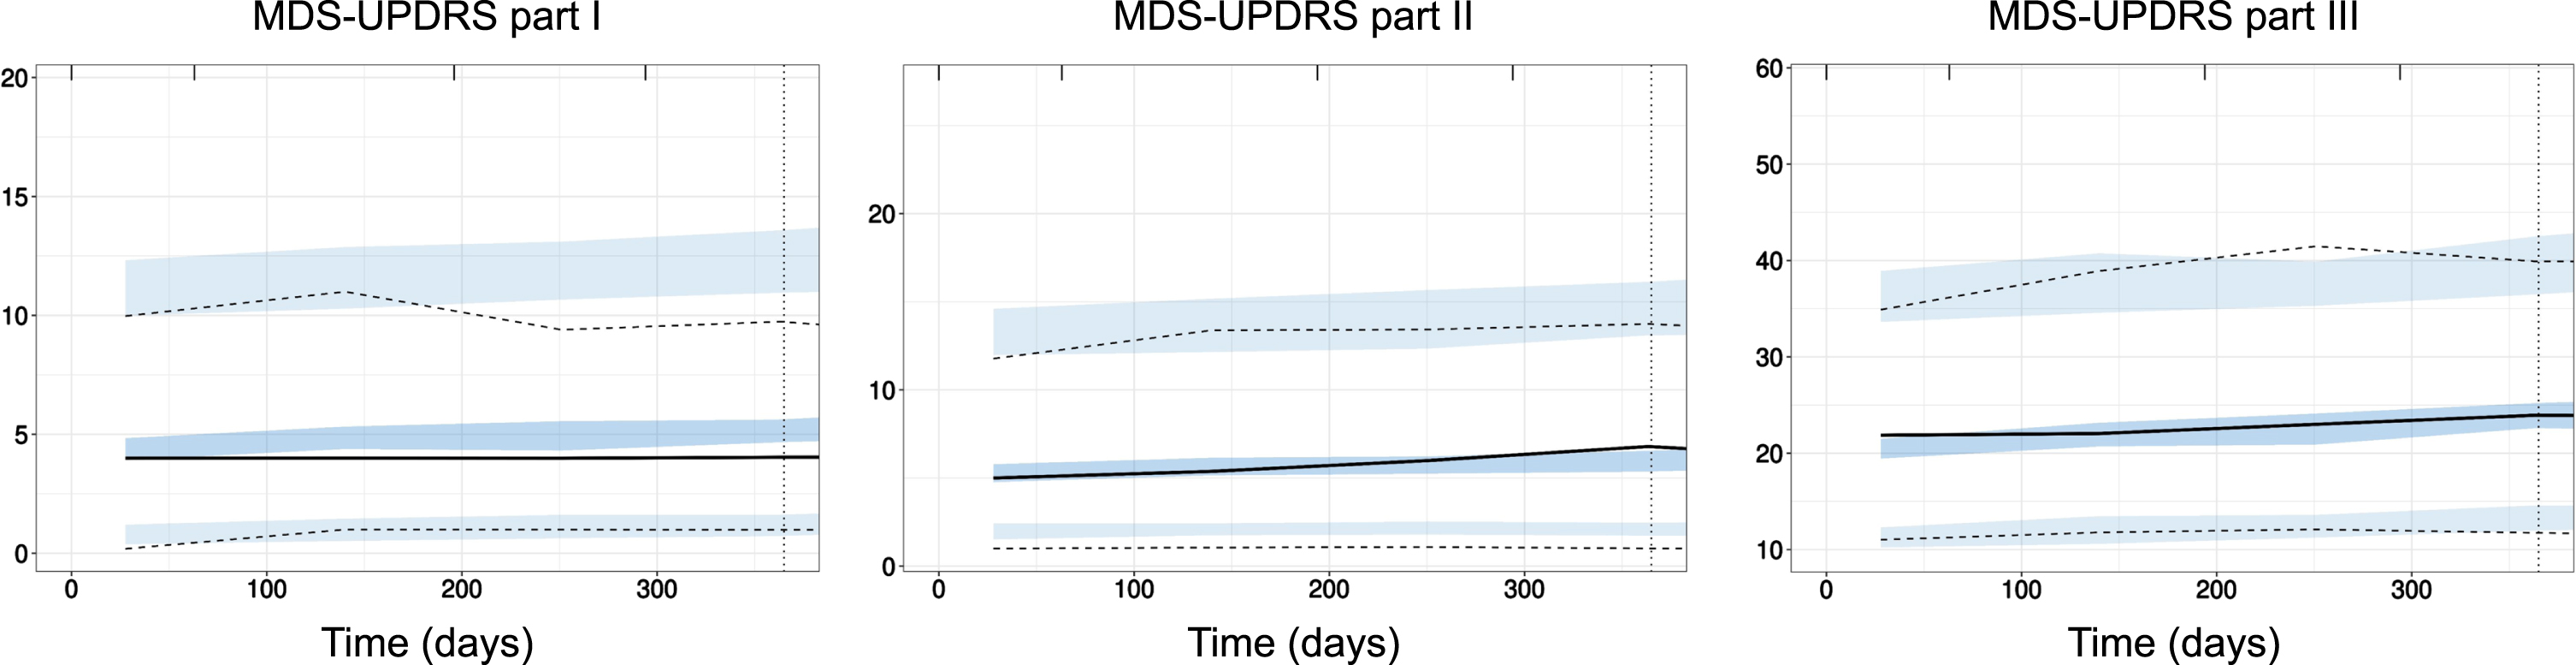
External evaluation of PPMI model on PASADENA placebo data. Prediction-corrected visual predictive check (pcVPC) of PPMI model prediction (blue shaded areas, 90% confidence interval around the 5th, 50th, and 95th percentiles) with data from PASADENA placebo cohort (black lines). Left panel: MDS-UPDRS part I; Middle panel: MDS-UPDRS part II; Right panel: MDS-UPDRS part III off. Time in days.
Inter-individual variability (I.I.V) in parameters for the MDS-UPDRS part I model was the highest (highest I.I.V. across all parameters). Variability in the baseline score parameter for MDS-UPDRS parts I and II were significantly higher than for part III (75 and 69% versus 41%). The unexplained (residual) variability was also higher for parts I and II than for part III: for part I, unexplained variability was quantified with a proportional component of 30% of the score plus an additive component of approximately 2 points. For MDS-UPDRS parts II and III, the best models for the unexplained error were proportional with magnitude of 40% and 20%, respectively.
While no relevant covariate was identified for MDS-UPDRS part I, the MDS-UPDRS part III score at baseline (diagnosis) was identified as a significant covariate of MDS-UPDRS part II baseline. The association was positive (beta = 0.2, 95% CI = [0.1–0.4]) meaning that the higher MDS-UPDRS part III the higher MDS-UPDRS part II at baseline. The introduction of the covariate in the progression model of MDS-UPDRS part II led to the reduction of the I.I.V. of the baseline parameter from 69% to 61%. For MDS-UPDRS part III, the Hoehn and Yahr stage was identified as a significant covariate of baseline parameter estimates (beta = 0.5, 95% CI = [0.4–0.6]). The introduction of the covariate in the progression model of MDS-UPDRS part III led to reducing the I.I.V. of the progression from 87% to 78% and of the baseline parameter from 41% to 33%.
Model predictions were evaluated against data from the placebo arm of PASADENA trial. The corresponding prediction-corrected visual predictive checks25 are presented in Fig. 2. The models describe well the data of MDS-UPDRS part III and part II. The evaluation showed a slight overestimation of the lowest (5th) percentile of the data for part II. For part I, the model performed worse and the evaluation showed an overestimation of the median progression time course. More details about models, parameter formulation and prediction accuracy can be found in the Supplementary Material.
Fig. 2
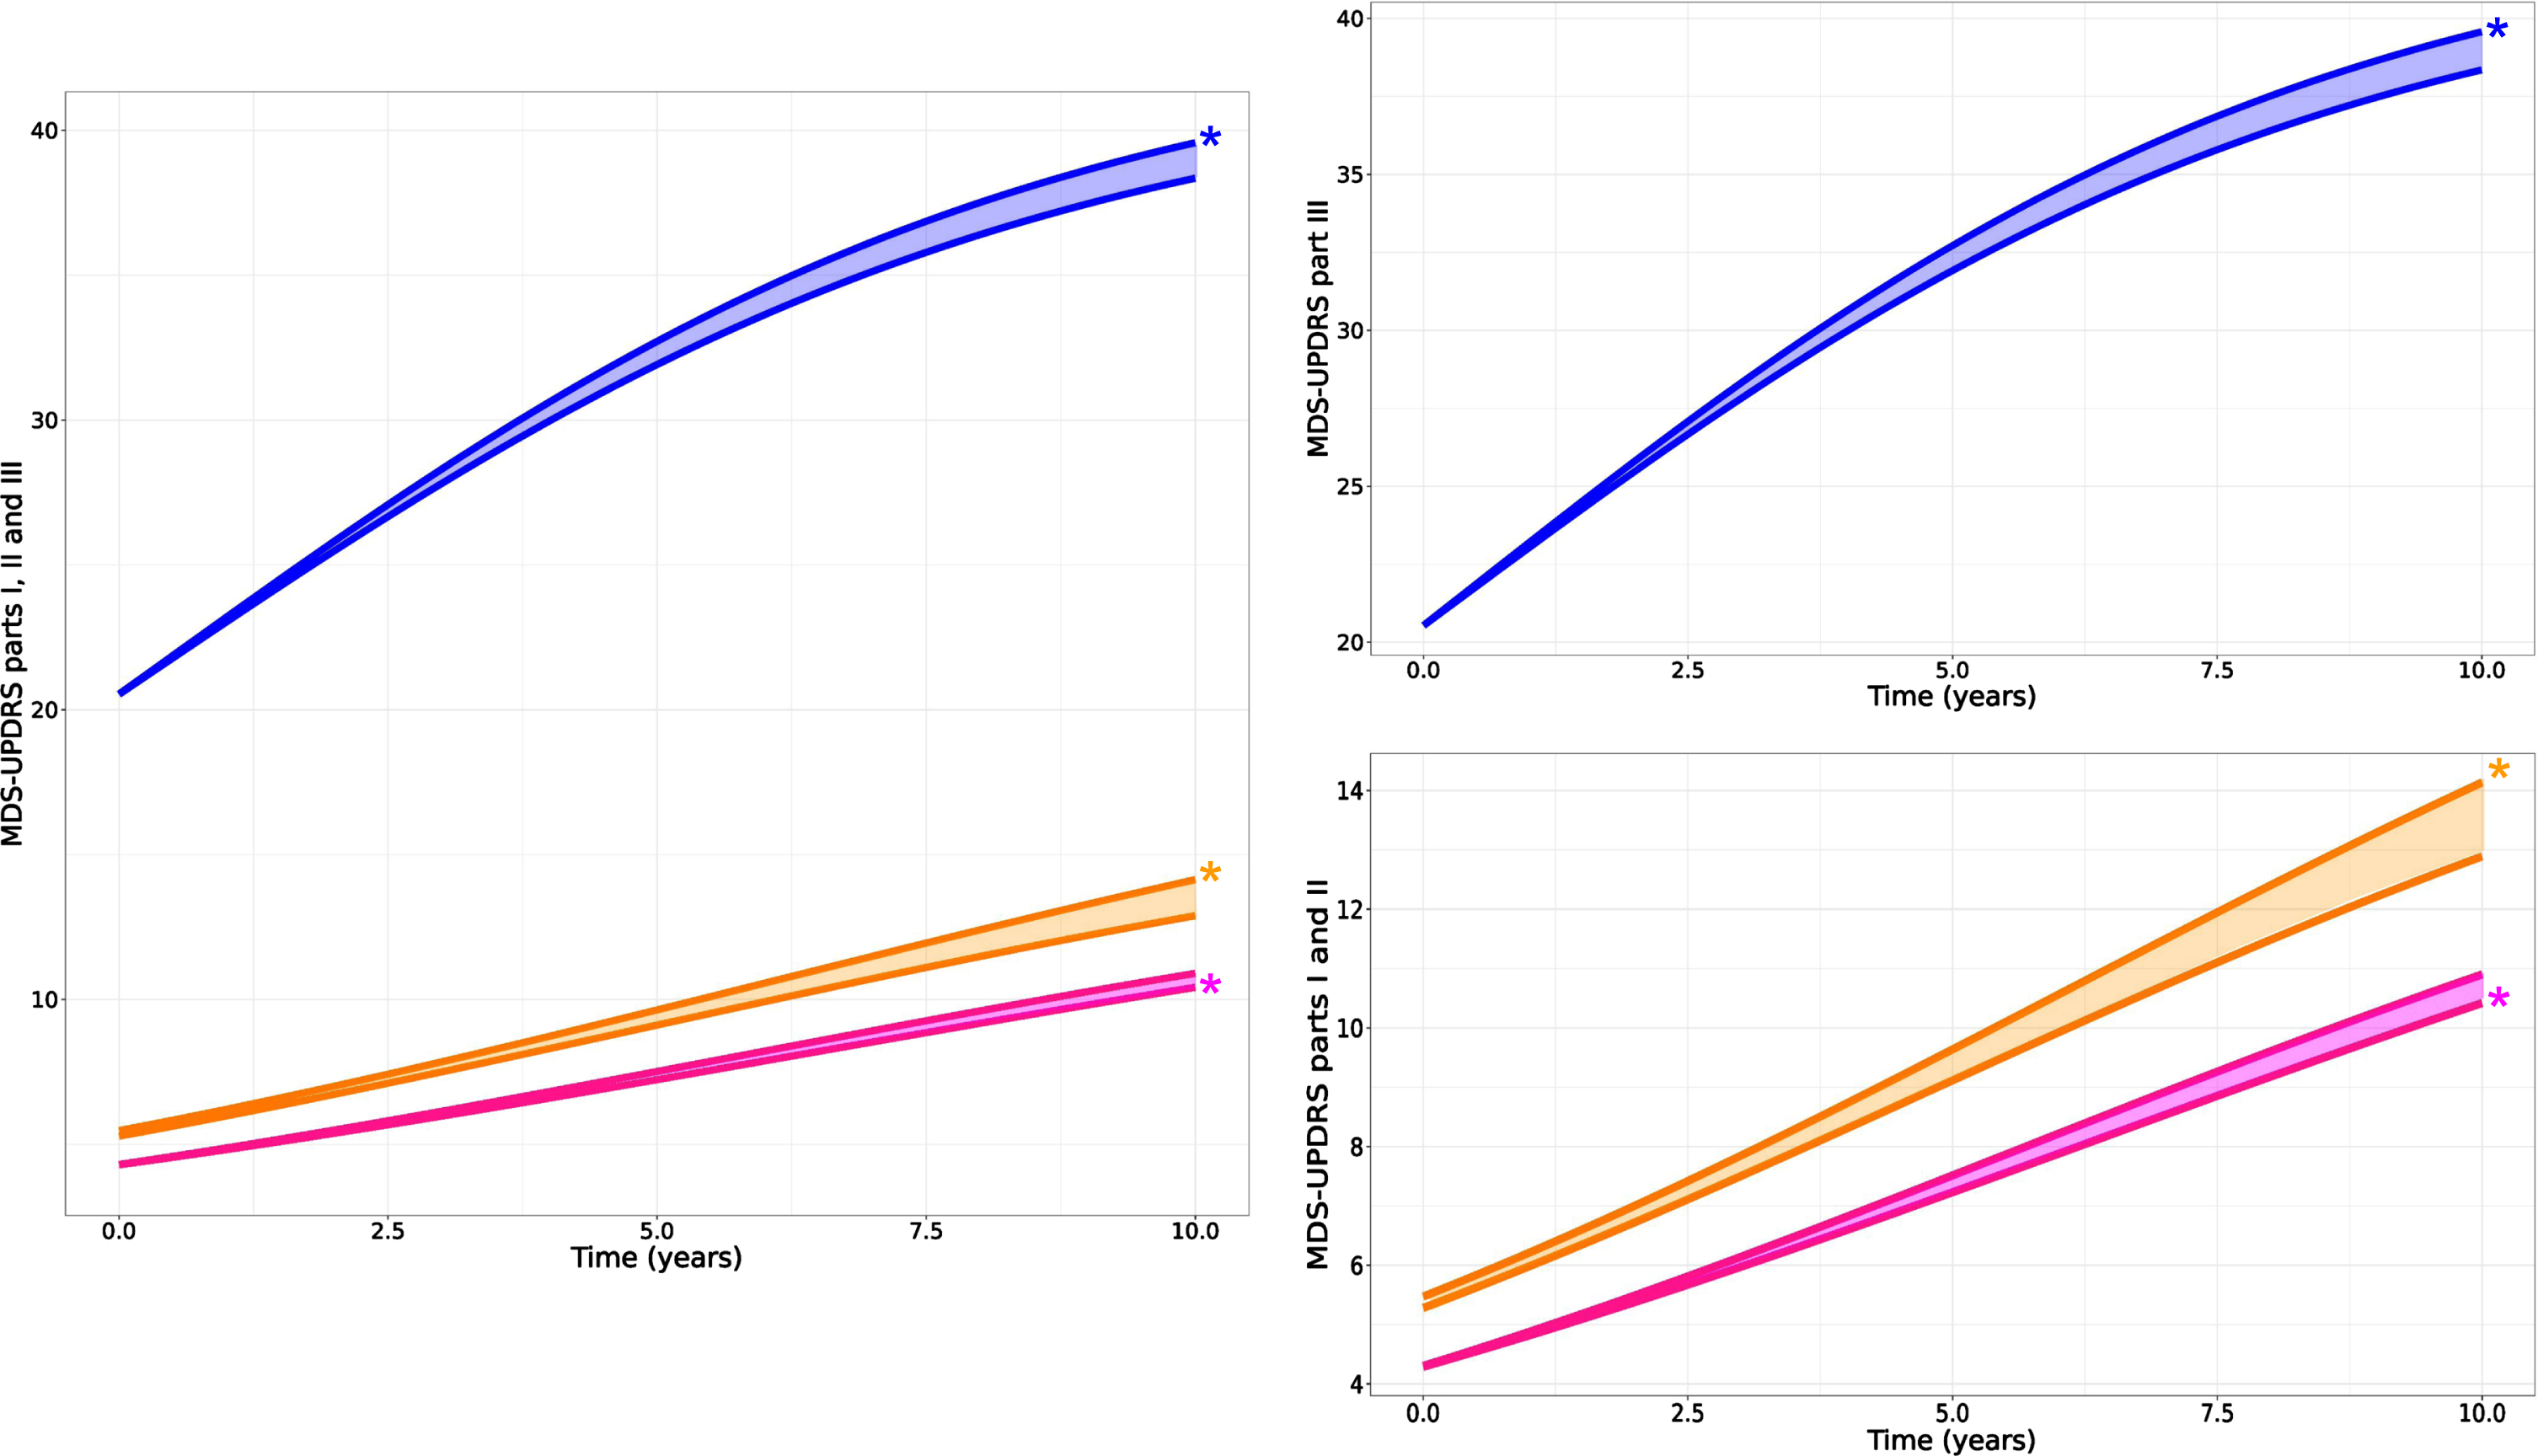
Predicted time course of MDS-UPDRS part III OFF (blue), part II (orange), and part I (pink) from PPMI Parkinson cohort. Left: all MDS-UPDRS parts together to appreciate the difference in time course; Right: scattered for more focus on each part (part III at the top and parts I and II at the bottom). For each part, two curves are shown where the curve with the * (star) symbol designates the natural disease progression curve. The other curve indicates the disease progression “as observed”, i.e., with the effect of symptomatic treatments. The shaded area in between the two curves gives an indication of the magnitude of impact of symptomatic treatment on the progression of each MDS-UPDRS parts.
Symptomatic treatments affect all MDS-UPDRS parts
Results indicated that higher amounts of symptomatic therapy are associated with slower progression of MDS-UPDRS part III. We estimated that 300 to 400 mg of LEDD would reduce the score by 1 point (population estimate of α is –0.6 points per normalized LEDD and median LEDD across the population is approximately 200 mg – see Supplementary Table 1). It is interesting to note that despite the analysis of part III data “in off”, the model can still detect the effect of symptomatic treatments highlighting the importance of accounting for this factor when estimating disease progression. For MDS-UPDRS part II, higher amount of symptomatic therapy was also associated with slower progression. However, for MDS-UPDRS part I, the effect was in the opposite direction, i.e., a higher amount of symptomatic therapy could be associated with faster progression of part I score, although minor (Table 1 for effect parameter estimates and Fig. 2 for visual representation).
Motor signs appear earlier and progress faster than functional impairments in early PD
A moderate level of correlation was found between the random effects associated with the natural progression of the motor signs (part III) and the motor aspects of daily living (part II) (Pearson coefficient r = 0.4) and also between the motor and non-motor aspect of daily living (part I) (r = 0.4). No correlation was found between the progression of the motor signs and non-motor aspect of daily living (Fig. 3, left panel).
Fig. 3
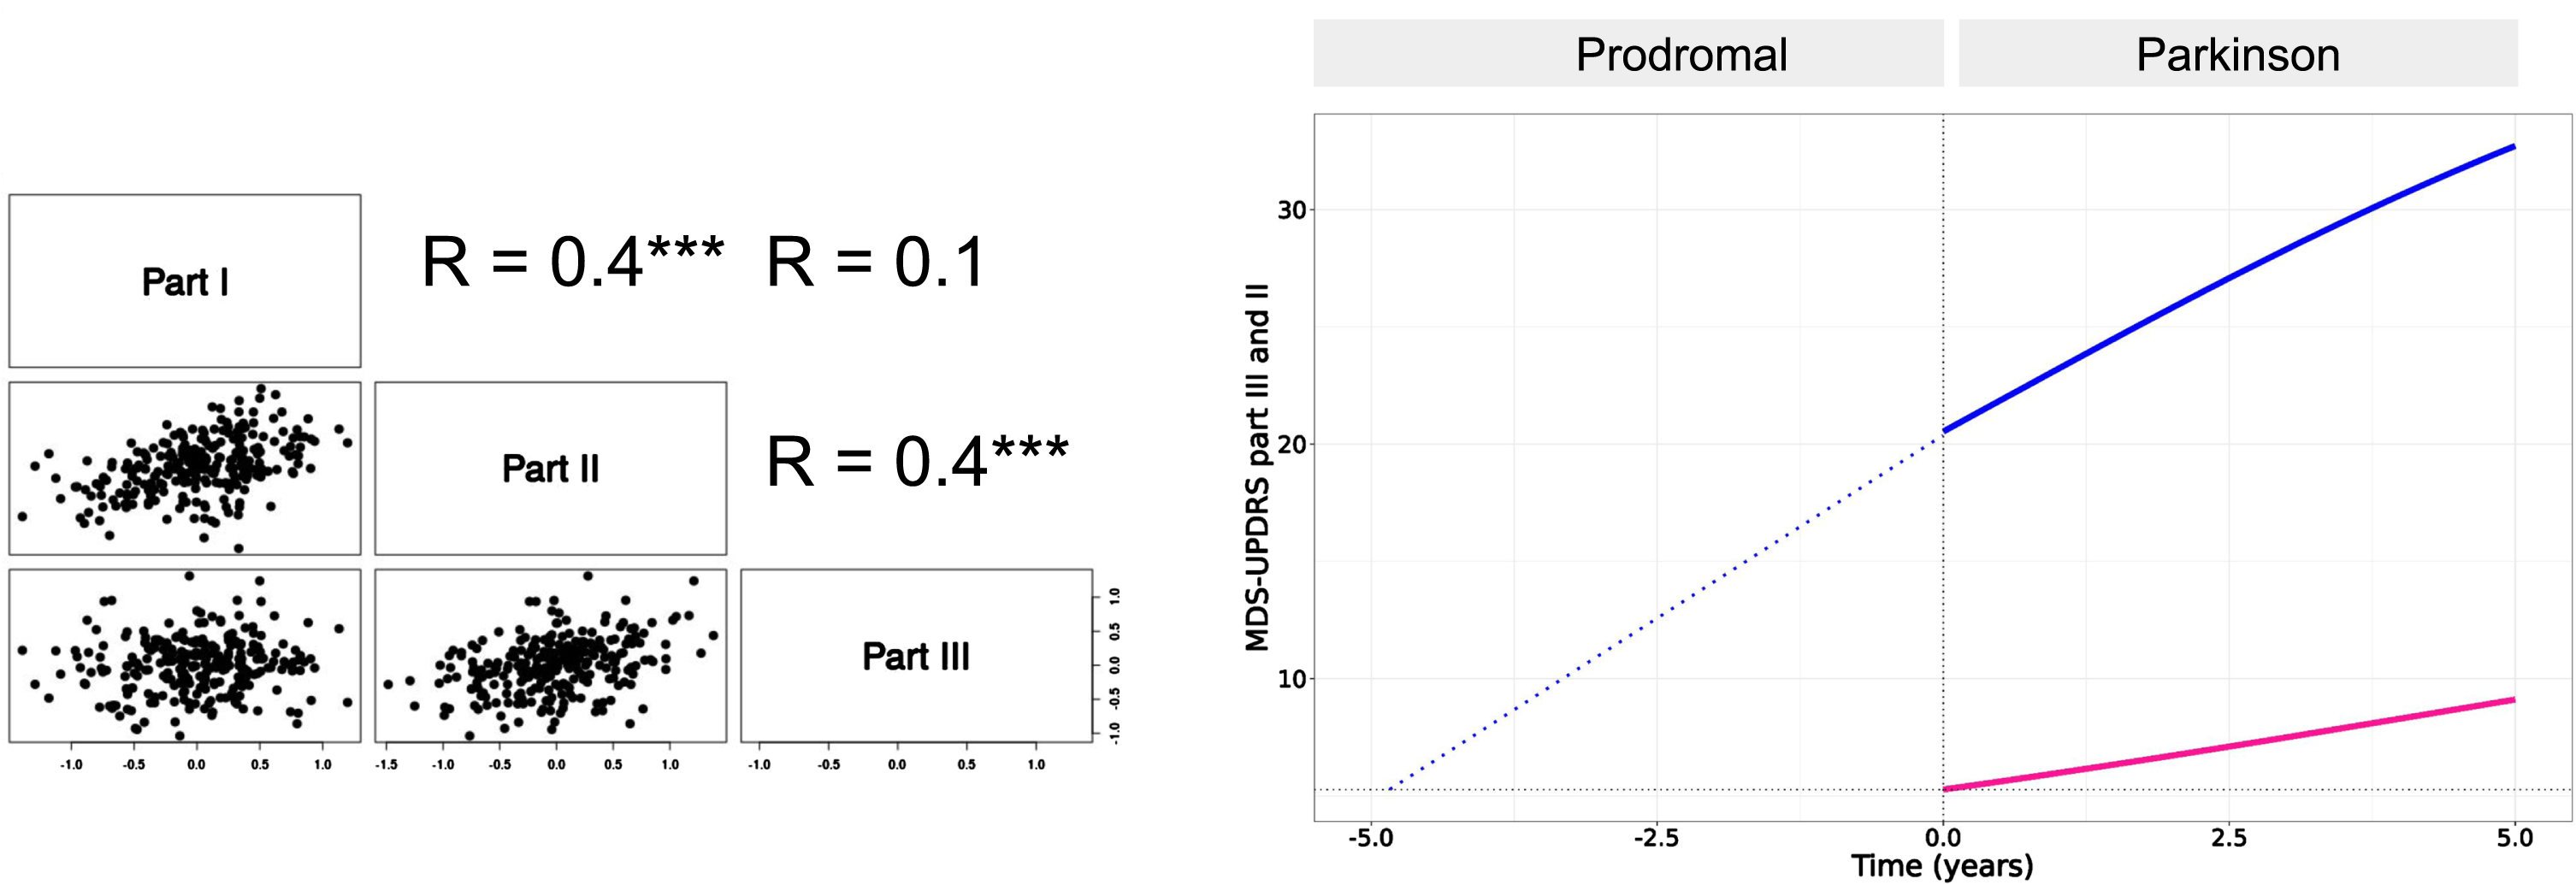
Left panel: pairwise Pearson correlation coefficients of inter-individual variabilities of the progression (Tprog). Only correlation between part III and part II and between part II and part I were found significant (p < 0.001, indicated by three starts). Right panel: Backward extrapolation of MDS-UPDRS part III scores supported by PPMI data in the Prodromal cohort which were modeled with a linear growth model (blue dotted line).
The moderate level of correlation between MDS-UPDRS part III and part II supports the hypothesis of a link between the dynamics of the two parts.
To estimate the lag time between the progression of MDS-UPDRS part III and part II scores, we used data from the prodromal cohort of PPMI. We found that the prodromal stage is well described by a linear growth for MDS-UPDRS part III with a slope of approximately 3 points/year. The estimated difference is 5 years between part III and part II onsets (onset here taken as part II baseline score at PD diagnosis, i.e. ∼5 points) (Fig. 3, right panel).
Of note, for part II, the progression in the prodromal cohort was slower than after PD diagnosis with less than 0.4 points/year. Overall, these results confirm that MDS-UPDRS part III not only progresses faster than part II but that it also precedes part II. Moreover, these results suggest that in the earliest stage of the disease, part II may progress even slower than after diagnosis.
Detection of treatment effect on motor signs and on motor aspect of experiences of daily living may come two years apart in the early-stage of PD even for trials with large sample size
The progression of 3 points/year and 1 point/year were taken as the population estimation of progression for MDS-UPDRS part III and part II respectively. Following our assumption that the disease-modifying factor characterizing the effective hypothetical treatment is the same on the progression of the true (unobserved) disease, the progression of MDS-UPDRS part III and part II (see Method section), we illustrate in Fig. 4, why—although the factor is conserved—the effect could be different given the natural progression slope is different.
Fig. 4
Schematic representation of disease progression and effect of a hypothetical DMT treatment. We represent the progression of MDS-UPDRS part III and part II in thin dark blue and pink lines respectively. An effective treatment affects progression by a given factor, taken here at 0.5 (50% reduction of progression). The translation of the same factor to MDS-UPDRS part III and part II results in different absolute treatment effects due to the difference in natural progression (3 points/year versus 1 point/year). The two vertical red dotted lines represent the start and end of a hypothetical clinical trial.
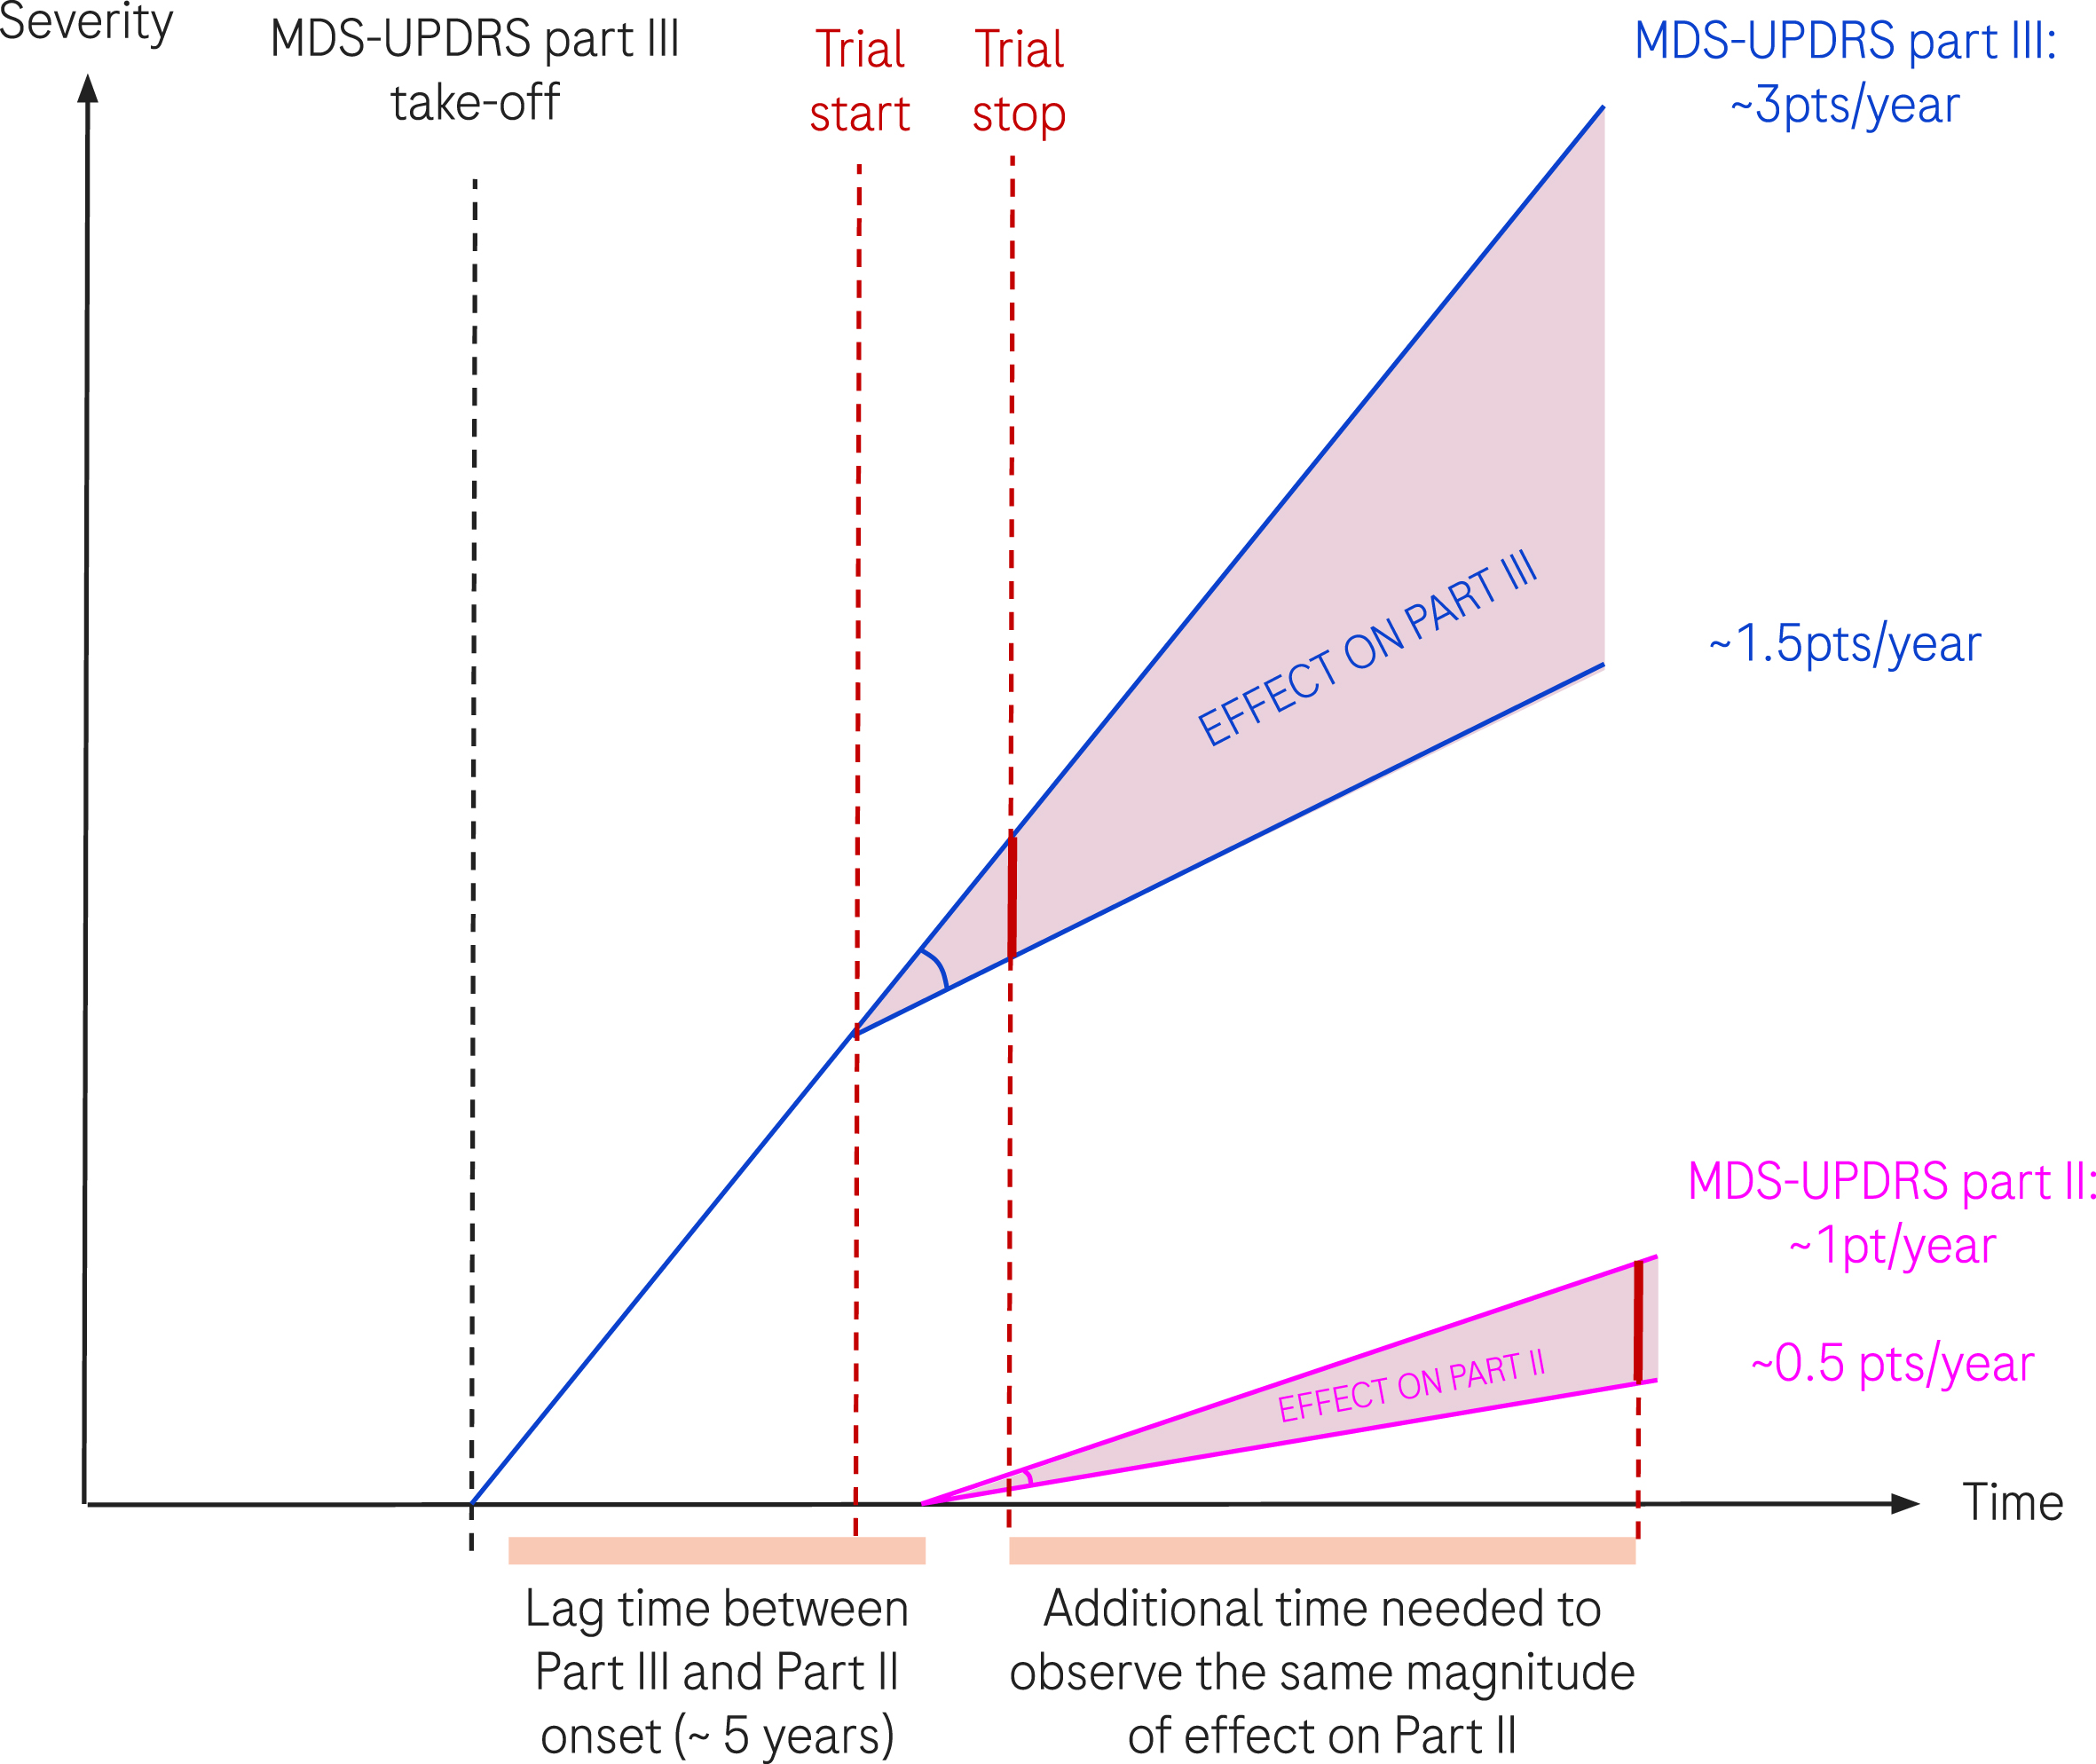
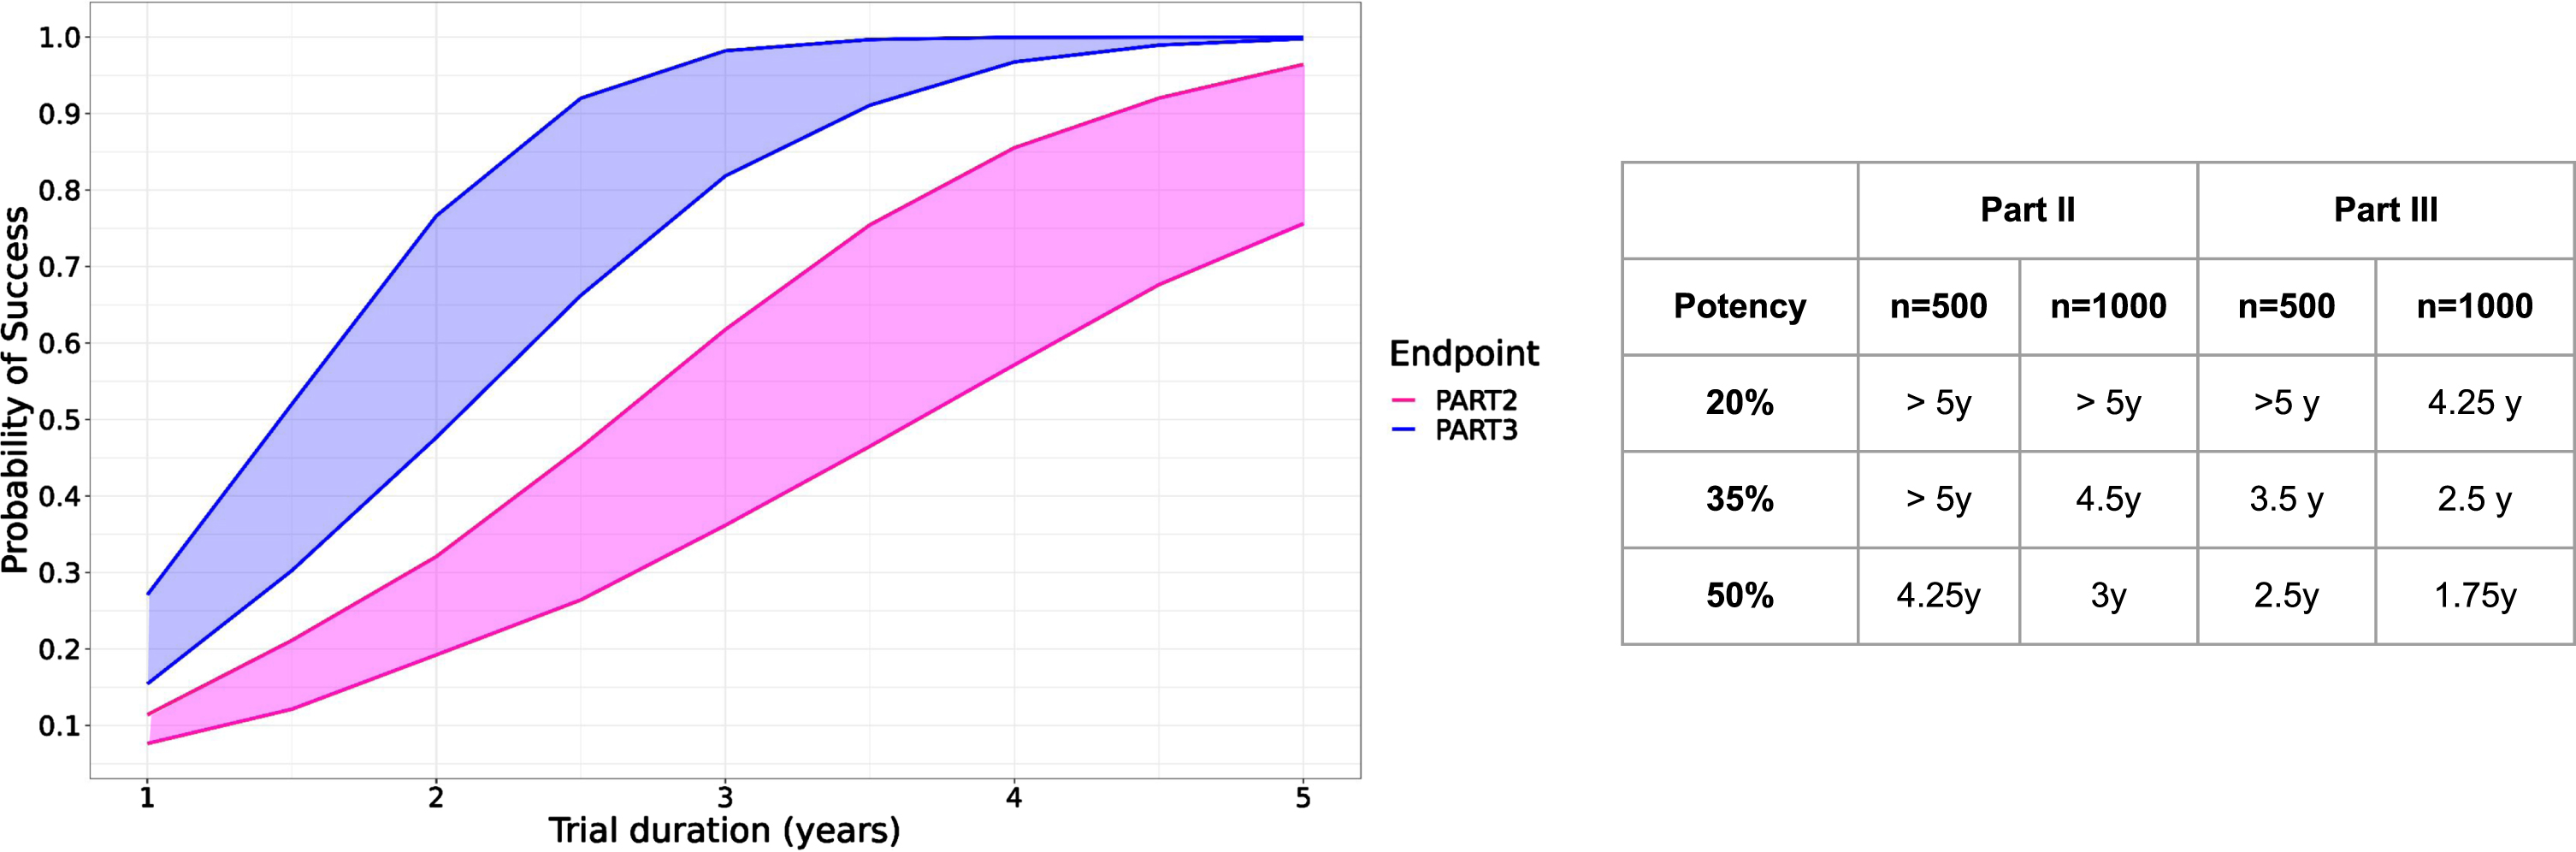
Figure 5 shows the result of the simulations for hypothetical trials enrolling 500 or 1000 participants, half of them being assigned to the treatment group. The probability of success is consistently higher when using MDS-UPDRS part III than with part II. While the relative effect is exactly the same (35% of reduction in Fig. 5 left panel), the translation into the absolute score differs between MDS-UPDRS part III and part II, and consequently the probability to detect a treatment effect. Effect on part III ultimately translates into a detectable effect on part II, the lag time depending on the simulation scenario and function of the number of subjects in the trials as well as the potency of the treatment. With a potency of 35% slowing down the progression of MDS-UPDRS part III and II and a trial of 1000 subjects, we estimated that effect on part II could be detectable 2 years after effect on part III (4.5 years versus 2.5).
Fig. 5
Left: Predicted probability of study success as function of trial duration over 10’000 simulated clinical trials with 500 (lower curves) and 1000 subjects (upper curves) with part II (pink) or part III (blue) or as study endpoint with a hypothetical treatment effect reducing progression by 35%. Right panel: Time needed to achieve 90% probability of success for three different treatment potencies (20–50%) and two different sample sizes (n = 500, 1000).
DISCUSSION
We present a comprehensive mathematical modeling of progression of MDS-UPDRS parts I, II, and III in early PD. Aligned with what was already published using PPMI data from de-novo patients,26 we found that the natural progression of MDS-UPDRS part III is significantly faster than parts I and II. The predicted time courses were validated externally using the data from the placebo arm of the PASADENA trial and accounting for the differences in the usage of symptomatic treatments between PPMI and the trial data. The faster progression of motor signs (MDS-UPDRS part III) compared to the impact on daily living (MDS-UPDRS part II) may indicate that patients experience a period where motor symptoms have begun to worsen, but their ability to perform daily activities is not yet significantly affected. The findings fully support clinical experience of the measurable change in MDS-UPDRS part III and limited change in MDS-UPDRS parts I and II but introduce novel trial simulation approaches. We demonstrate that all MDS-UPDRS parts are sensitive to change but the magnitude and timeline are different. The modeling highlights a number of findings important for the design of disease modification trials in early PD that intend to use the scale.
Disease modifying trials with the typical 2-year duration will have a challenge demonstrate meaningful impact on part II even with a large sample size. While the voice of the patient is and should remain of the highest importance for a comprehensive assessment of PD impact and thus for evaluating drug effect, we showed that MDS-UPDRS part II as an endpoint might require trials in early PD of at least 3 to 5 years duration. However, meaningful change can be detected in part III and it predicts change in part II. That means that MDS-UPDRS part III, although not being reported by the patients, may still be a viable alternative because effect could be detected earlier and translate into effect on part II at a later time point. This temporal discrepancy may reflect the progression pattern of PD, where motor symptoms become more pronounced before the full impact on daily living is reported by patients.
There are also a number of methodological innovations to be highlighted, specifically the existence of an effect of symptomatic treatments on all analyzed parts of MDS-UPDRS parts, including part III in OFF state, strengthening the relevance of modeling approaches accounting for such effects. As expected, in MDS-UPDRS part III and part II, symptomatic treatments lower the score which has to be built into the models but for part I, symptomatic treatments tend to increase the score. Although the magnitude of effect was minor, this finding is in agreement with reported negative effects of symptomatic treatment on non-motor symptoms such as constipation.27
We identified a moderate correlation between the estimated natural disease progression of MDS-UPDRS parts III and part II, between part II and I, but not between part III and part I. This is consistent with the fact that both part III and part II are about the motor domain and that both parts II and I are self-reported questionnaires.
The model also provided important novel observations for the prodromal population. We estimated, through modeling MDS-UPDRS part III before PD (prodromal cohort) that part III was at the level of part II baseline (i.e., 5 points) approximately 5 years before diagnosis. To our knowledge, this is the first time that a link in terms of time delay is established between MDS-UPDRS part III and II based on a data-driven approach combining both prodromal and PD cohorts of PPMI. With faster progression, earlier onset and still, link to part II, MDS-UPDRS part III may offer an advantage for identifying quicker and with smaller trials compounds effectively slowing down the disease.
The work presented has several shortcomings. We have used the LEDD as the driver of pharmacodynamics effect on disease progression of MDS-UPDRS parts scores. While the concept of LEDD is well accepted, there are large differences in symptomatic treatments and thus, a more refined analysis taking into account not only the dose but also the class of molecules (e.g., amantadine derivatives, COMT inhibitors, dopamine agonists, monoamine oxidase B inhibitors) is an important next step as it can have important implications for clinical trial design too. In addition to that, PPMI collects medication list as it stands at the annual visit while medications might have been changed any time between the visits.
In our analysis, we excluded the genetic forms of PD. This constitutes a strong assumption and a potential burden for patients who would not normally be genetically screened. However, to ensure the robustness of our model under different scenarios, we have conducted a sensitivity analysis to assess the impact of including genetic forms of PD in our results. Thus, the analysis (reported in the Supplementary Material) demonstrates that the inclusion of these subpopulations does not significantly alter the values of the estimates that were obtained. Therefore, we are confident that the modeling approach remains valid even in the absence of genetic screening. This sensitivity analysis underscores the adaptability of our model to various clinical settings and supports its potential utility in broader PD populations.
The endpoints were modeled as continuous variables, while others have preferred item response theory (IRT) or bounded integer modeling framework given the composition of the scale.28–30 Replicating the analysis with different modeling approaches can increase the confidence in the results obtained. Also, while PPMI constitutes a comprehensive database for modeling early PD, other datasets exist and applying the modeling analysis to such datasets will strengthen the model predictions and overall results. Specifically, application of the model to larger prodromal cohorts will be highly valuable. The level of correlation between part III and part II progression was only moderate. To further explore potential link between the two parts (part III and part II), it would be interesting to check if a model integrating the two dependent variables and relying on the assumption of a “mechanistic” link between the two can successfully fit the data. In such a model, MDS-UPDRS parts II and III would be modeled with two compartments and the progression of part II will be proportional to the progression of part III. In such a model, MDS-UPDRS part II would lag behind part III due to its lower score at baseline and its slower progression. Also, we did not add a placebo effect in the models while evaluating predictions with PASADENA data. Further evaluation is required given recent findings reported in literature on transient placebo effect.31
Finally, the framework used for clinical trial simulations is simplistic and based on strong assumptions (e.g. same potency and noise on both parts), and thus theoretical, highlighting the need to analyze real trial data to check if the predictions obtained regarding MDS-UPDRS part III and part II are correct. The upcoming data from the open label extension of the PASADENA trial will be particularly interesting in this regard and might help us to refine this framework.
In conclusion, our work provides a novel approach to model-based analysis of MDS-UPDRS. It highlights the limitation of the scale in detecting voice of the patient in early disease, however it provides options to utilize the scale. We recognize that the implementation of the hypothetical, data-driven designs in real patient populations necessitates additional considerations. Among these, inputs from people living with PD are paramount to ensure that the outcomes of such models are aligned with their experiences and needs. As a next step, we are actively involving people living with PD in the discussion of assumptions and interpretations of our models to ensure that our work not only advances scientific understanding but also resonates with the experiences of those affected by PD. Such efforts will inform the extension of disease modeling approaches for clinical measures of how a patient feels, functions and survives to bridge the gap with true patient experience and ultimately support the development of more effective and meaningful therapeutic interventions for PD.
ACKNOWLEDGMENTS
The authors wish to acknowledge Marzia Antonella Scelsi, Francesco Brizzi, and Marcelo Boareto for constructive and valuable inputs during the preparation and review of the manuscript. The authors wish to acknowledge Matthew May for his support in reviewing this work with members of the Parkinson’s community and people living with Parkinson’s, and his work on the Plain Language Summary.
FUNDING
The authors have no funding to report.
CONFLICT OF INTEREST
B.R, C.D., P.B.P., A.M., B.R., T.N., and G.P. are employees of F. Hoffmann La Roche Ltd. T.S. has served as a consultant for AcureX, Adamas, AskBio, Amneal, Blue Rock Therapeutics, Critical Path for Parkinson’s Consortium (CPP), Denali, Michael J Fox Foundation, Neuroderm, Sanofi, Sinopia, Roche, Takeda and Vanqua Bio. She has also served on advisory boards for AcureX, Adamas, AskBio, Denali, and Roche, and as a member of the scientific advisory board of Neuroderm, Sanofi and UCB. In addition, she has received research funding from Amneal, Biogen, Neuroderm, Prevail, Roche, and UCB and is an investigator for NINDS, MJFF, Parkinson’s Foundation. She is an Editorial Board Member of this journal, but was not involved in the peer-review process nor had access to any information regarding its peer-review. K.M. is a consultant for Michael J Fox Foundation, Roche, UCB, Denali, Takeda, Biohaven, Neuron23, Aprinoia, Prothena, Calico, Inhibikase, Invicro, Koneksa, Lilly, Xingimaging.
DATA AVAILABILITY
More information regarding access to data from the Parkinson’s Progressive Markers Initiative can be found on the PPMI website: https://www.ppmi-info.org/.
SUPPLEMENTARY MATERIAL
[1] The supplementary material is available in the electronic version of this article: https://dx.doi.org/10.3233/JPD-230446.
REFERENCES
1. | Poewe W , Seppi K , Tanner CM , et al. Parkinson disease, Nat Rev Dis Primers (2017) ; 3: : 17013. |
2. | Mhyre TR , Boyd JT , Hamill RW , et al. Parkinson’s disease, Subcell Biochem (2012) ; 65: : 389–455. |
3. | Verschuur CVM , Suwijn SR , Boel JA , et al. Randomized delayed-start trial of levodopa in Parkinson’s disease, N Engl J Med (2019) ; 380: : 315–324. |
4. | Calabresi P , Mechelli A , Natale G , et al. Alpha-synuclein in Parkinson’s disease and other synucleinopathies: from overt neurodegeneration back to early synaptic dysfunction, Cell Death Dis (2023) ; 14: : 176. |
5. | Stephenson D , Belfiore-Oshan R , Karten Y , et al. Transforming drug development for neurological disorders: proceedings from a multidisease area workshop. Neurotherapeutics (2023) ; 20: : 1682–1691. |
6. | Petersen RC , Aisen PS , Andrews JS , et al. Expectations and clinical meaningfulness of randomized controlled trials, Alzheimers Dement (2023) ; 19: : 2730–2736. |
7. | Mintun MA , Lo AC , Duggan Evans C , et al. Donanemab in early Alzheimer’s disease, N Engl J Med (2021) ; 384: : 1691–1704. |
8. | Insel PS , Weiner M , Mackin RS , et al. Determining clinically meaningful decline in preclinical Alzheimer disease, Neurology (2019) ; 93: : e322–e333. |
9. | Gobburu JV and Lesko LJ. Quantitative disease, drug, and trial models, Annu Rev Pharmacol Toxicol (2009) ; 49: : 291–301. |
10. | Goetz CG , Tilley BC , Shaftman SR , et al. Movement Disorder Society-sponsored revision of the Unified Parkinson’s Disease Rating Scale (MDS-UPDRS): scale presentation and clinimetric testing results, Mov Disord (2008) ; 23: : 2129–2170. |
11. | Goetz CG , Choi D , Guo Y , et al. It is as it was: MDS-UPDRS Part III scores cannot be combined with other parts to give a valid sum, Mov Disord (2023) ; 38: : 342–347. |
12. | Guo Y , Goetz CG , Stebbins GT , et al. Using Movement Disorder Society Unified Parkinson’s Disease Rating Scale Parts 2 and 3 simultaneously: combining the patient voice with clinician ratings, Mov Disord (2023) ; 38: : 453–463. |
13. | Vu TC , Nutt JG and Holford NH. Progression of motor and nonmotor features of Parkinson’s disease and their response to treatment, Br J Clin Pharmacol (2012) ; 74: : 267–283. |
14. | Post TM , Freijer JI , DeJongh J , et al. Disease system analysis: basic disease progression models in degenerative disease, Pharm Res (2005) ; 22: : 1038–1049. |
15. | Holford N and Nutt JG. Disease progression, drug action and Parkinson’s disease: why time cannot be ignored, Eur J Clin Pharmacol (2008) ; 64: : 207–216. |
16. | Pagano G , Boess FG , Taylor KI , et al. A phase II study to evaluate the safety and efficacy of Prasinezumab in Early Parkinson’s Disease (PASADENA): Rationale, design, and baseline data, Front Neurol (2021) ; 12: : 705407. |
17. | Marek K , Chowdhury S , Siderowf A , et al. The Parkinson’s progression markers initiative (PPMI) - establishing a PD biomarker cohort, Ann Clin Transl Neurol (2018) ; 5: : 1460–1477. |
18. | Tomlinson CL , Stowe R , Patel S , et al. Systematic review of levodopa dose equivalency reporting in Parkinson’s disease, Mov Disord (2010) ; 25: : 2649–2653. |
19. | Jost ST , Kaldenbach MA , Antonini A , et al. Levodopa dose equivalency in Parkinson’s disease: updated systematic review and proposals, Mov Disord (2023) ; 38: : 1236–1252. |
20. | Lavielle M . Mixed Effects Models for the Population Approach: Models, Tasks, Methods and Tools (1st edition). Chapman and Hall/CRC, (2014) . |
21. | Fidler M , Wilkins JJ , Hooijmaijers R , et al. Nonlinear mixed-effects model development and simulation using nlmixr and related R open-source packages, CPT Pharmacometrics Syst Pharmacol (2019) ; 8: : 621–633. |
22. | Akdemir UO , Bora Tokcaer A and Atay LO. Dopamine transporter SPECT imaging in Parkinson’s disease and parkinsonian disorders, Turk J Med Sci (2021) ; 51: : 400–410. |
23. | Svensson RJ and Jonsson EN. Efficient and relevant stepwise covariate model building for pharmacometrics, CPT Pharmacometrics Syst Pharmacol (2022) ; 11: : 1210–1222. |
24. | Mori H , Wiklund SJ and Zhang JY. Quantifying the benefits of digital biomarkers and technology-based study endpoints in clinical trials: project moneyball, Digit Biomark (2022) ; 6: : 36–46. |
25. | Bergstrand M , Hooker AC , Wallin JE , et al. Prediction-corrected visual predictive checks for diagnosing nonlinear mixed-effects models, AAPS J (2011) ; 13: : 143–151. |
26. | Holden SK , Finseth T , Sillau SH , et al. Progression of MDS-UPDRS scores over five years in de novo Parkinson disease from the Parkinson’s Progression Markers Initiative Cohort, Mov Disord Clin Pract (2018) ; 5: : 47–53. |
27. | Pagano G , Tan EE , Haider JM , et al. Constipation is reduced by beta-blockers and increased by dopaminergic medications in Parkinson’s disease, Parkinsonism Relat Disord (2015) ; 21: : 120–125. |
28. | Ueckert S . Modeling composite assessment data using item response theory, CPT Pharmacometrics Syst Pharmacol (2018) ; 7: : 205–218. |
29. | Buatois S , Retout S , Frey N , et al. Item response theory as an efficient tool to describe a heterogeneous clinical rating scale in de novo idiopathic Parkinson’s disease patients, Pharm Res (2017) ; 34: : 2109–2118. |
30. | Wellhagen GJ , Kjellsson MC and Karlsson MO. A bounded integer model for rating and composite scale data, AAPS J (2019) ; 21: : 74. |
31. | Arshad U , Rahman F , Hanan N , et al. Longitudinal meta-analysis of historical Parkinson’s disease trials to inform future trial design, Mov Disord (2023) ; 38: : 1716–1727. |

