
Risk Factors for Postoperative Delirium Severity After Deep Brain Stimulation Surgery in Parkinson’s Disease
Abstract
Background:
Postoperative delirium (POD) is a serious complication following deep brain stimulation (DBS) but only received little attention. Its main risk factors are higher age and preoperative cognitive deficits. These are also main risk factors for long-term cognitive decline after DBS in Parkinson’s disease (PD).
Objective:
To identify risk factors for POD severity after DBS surgery in PD.
Methods:
57 patients underwent DBS (21 female; age 60.2±8.2; disease duration 10.5±5.9 years). Preoperatively, general, PD– and surgery-specific predictors were recorded. Montreal Cognitive Assessment and the neuropsychological test battery CANTAB ConnectTM were used to test domain-specific cognition. Volumes of the cholinergic basal forebrain were calculated with voxel-based morphometry. POD severity was recorded with the delirium scales Confusion Assessment Method for Intensive Care Unit (CAM-ICU) and Nursing Delirium Scale (NU-DESC). Spearman correlations were calculated for univariate analysis of predictors and POD severity and linear regression with elastic net regularization and leave-one-out cross-validation was performed to fit a multivariable model.
Results:
21 patients (36.8%) showed mainly mild courses of POD following DBS. Correlation between predicted and true POD severity was significant (spearman rho = 0.365, p = 0.001). Influential predictors were age (p < 0.001), deficits in attention and motor speed (p = 0.002), visual learning (p = 0.036) as well as working memory (p < 0.001), Nucleus basalis of Meynert volumes (p = 0.003) and burst suppression (p = 0.005).
Conclusions:
General but also PD– and surgery-specific factors were predictive of POD severity. These findings underline the multifaceted etiology of POD after DBS in PD. Valid predictive models must therefore consider general, PD– and surgery-specific factors.
INTRODUCTION
Deep brain stimulation (DBS) in Parkinson’s disease (PD) has been shown to improve motor fluctuations and quality of life in patients who have complications that cannot be controlled by adjustments of medical therapy.1 Long-term cognitive deterioration can be observed in few cases after DBS surgery but the etiology is unclear. Main risk factors for cognitive decline are higher age and preoperative cognitive impairment.2 These are also the main predisposing factors for postoperative delirium (POD)3 which, in turn, can lead to long-term cognitive decline.4 POD is defined as an acute disturbance of attention and awareness accompanied by change in cognition after surgery. It is further characterized by fluctuating symptoms including hallucinations, confusion and disorientation.5 The pathogenesis is complex and not well understood to date. Hypotheses include cholinergic and to a lesser extent dopaminergic imbalances as well as neuroinflammatory processes.6 Delirium is of high relevance as it is associated with a poorer prognosis due to higher mortality, higher rate of institutionalization, dependency of care and dementia.3,7
A narrative review by Vardy et al. reasoned that PD patients may be at higher risk for POD in comparison to controls without chronic diseases. Reasons are dopaminergic and cholinergic deficits as part of the pathogenesis of PD.6,8,9 PD patients show an even higher mortality rate due to the consequences of delirium than healthy controls and delirium is associated with faster PD progression and long-term cognitive decline.10 Although the incidence of POD after neurosurgical procedures is higher than after surgery in other localizations,11 POD after DBS in the subthalamic nucleus (STN), the main surgical target in PD, is rarely examined and mostly investigated retrospectively. Incidences of POD after DBS are reported to range from 5.8% to 42.6%. Reasons for this range may result from various definitions and ways to detect POD in addition to different sample sizes and characteristics.12
Many different parameters have an influence on the occurrence and severity of POD in PD. Valid predictive models must therefore consider general, PD– and surgery-specific factors. Important general predictors for POD are higher age, preexisting cognitive impairment, comorbidities, malnutrition, need of care and preoperative inflammation.3 Neurofilament light chain (NfL)13 derived from blood serum and dementia markers derived from cerebrospinal fluid (CSF) have also been linked to POD risk.13,14
In terms of PD-specific characteristics increasing the risk of POD, an akinetic-rigid motor type, disease severity, depressive symptoms, a history of hallucinations and impulsive disorders have been described.12 The genetic background of PD also has an influence on cognitive trajectories. Especially mutations in the GBA gene, which encodes glucocerebrosidase, the most common genetic risk factor for PD, are associated with a poorer cognitive prognosis15 and might therefore also go along with an increased risk of delirium.
Deficits in global cognition increase the risk of POD significantly. When investigating patients with no obvious dementia, domain-specific neuropsychological impairments have been proposed as showing higher predictive values. In their meta-analysis, Ghezzi et al. found the largest effects on delirium incidence in older hospitalized patients for the domains orientation and visuospatial capacities, two very basic abilities.16 However, domain-specific neuropsychological testing for risk calculation of POD after DBS in PD has not been conducted yet.
Perioperative procedures also play a role in the development of POD. In this regard, predictors of POD after STN-DBS in PD need to take into account specific surgery characteristics, for example the intermission of dopaminergic medication and the aim to avoid deep sedation for intraoperative clinical testing during electrode implantation.12 As deep sedation has been found to be a risk factor for POD,17 body weight-adjusted doses of anesthetics and electroencephalography monitoring (EEG) during surgery can provide quantifiable predictive factors of POD.18 However, in a single retrospective study in the context of STN-DBS in PD, deep sedation did not prove to be a risk factor for POD.19
Ray and colleagues20 have shown that PD patients with lower-than-expected NBM volumes at baseline have a 3.5-fold greater risk of becoming cognitively impaired after 5 years. Schulz and colleagues21 have described NBM volume and mean diffusivity to be predictive of cognitive impairment after 3 years. This led us to test the predictive value of the NBM for cognition one year after STN-DBS in PD in a retrospective study. Here, we were able to show that the NBM had the highest predictive value for the cognitive performance one year after STN-DBS surgery in a machine learning analysis.22 Due to the large overlap between the risk factors for POD and cognitive decline, this imaging marker might also be predictive of POD.
This prospective study aims at identifying risk factors for POD severity after DBS in PD patients that take into account the multifaceted etiology of this complication. Thereby, PD patients in the evaluation process for DBS surgery could be counseled on a more individual basis. By raising awareness on POD, we also hope to prompt prevention, early detection and treatment of this common complication after DBS in PD. Last but not least, this study could also have an influence on in- and exclusion criteria for DBS surgery and perioperative management strategies in the future.
METHODS
This analysis is a subproject of the prospective cohort study of cognitive outcomes one year following DBS surgery in PD (NCT03982953). The ethics committee of the Charité - Universitätsmedizin Berlin approved all study procedures (EA2/0019). Patients with PD were included if 1) they were evaluated positively for receiving bilateral DBS electrodes in the subthalamic nucleus (STN) at our center between 06/2019 and 09/2021, 2) spoke sufficient German and 3) gave their written informed consent. Prior to DBS surgery, all patients had undergone a careful examination of the diagnosis, indication, response to Levodopa and exclusion of possible contraindications (most importantly biological age higher than 70 years or a clinical diagnosis of dementia). Recruitment of patients was delayed about one year due to COVID restrictions. TRIPOD reporting guidelines were used for reporting prediction model development.23
POD assessment
Duration and severity of POD were recorded by means of the validated scales Confusion Assessment Method for Intensive Care Unit (CAM-ICU)24–26 and Nursing Delirium Screening Scale at non-ICU wards (NU-DESC)27 every eight hours after surgery until hospital discharge. Ratings were conducted by trained physicians or nurse practitioners who were trained to focus on acute changes of the patient’s behavior. Pre-condition to use the CAM-ICU is to rate the level of sedation followed by the step-by-step examination of acute onset or a fluctuating course, inattention, disorganized thinking and level of consciousness. The NU-DESC consists of five categories: disorientation, inappropriate behavior and communication, illusions or hallucinations and psychomotor retardation. For each category a score of 0 (no symptom), 1 (mild symptom) or 2 (severe symptom) is assigned. POD is present if two or more points are scored in total and the maximum score is ten. POD was rated present if CAM-ICU or NU-DESC scores were positive. POD severity was calculated as the average NU-DESC score on POD-positive days. In case of different positive NU-DESC scores during one day, the highest scores were used and subsequently divided by the number of POD positive days. For further information, please see the Supplementary Material.
Possible predictors influencing the occurrence of POD are investigated in this study and are introduced in the following sections:
General predictors
Preoperative age, sex, level of education, body mass index (BMI), nutritional status as measured by the Mini Nutritional Assessment short form (MNA-SF),28 comorbidities as measured by the Charlson Comorbidity Index (CKI),29 need of assistance in daily life activities (Bain and Findley Activities of Daily Living (ADL)30) and plasma C-reactive protein on the day before DBS surgery were recorded.
Where lumbar puncture was possible, dementia markers (phospho-tau, total-tau, amyloid- β 1–40 and 1–42, amyloid-β ratio and amyloid-β 1–42/total-tau ratio) from CSF as well as neurofilament from blood serum were measured (sNfL). As sNfL levels increase with age and decrease with BMI, age- and BMI-adjusted sNFL Z-Scores were calculated.31
PD-specific predictors
We recorded the motor predominance type, disease duration, Levodopa equivalent daily dosage (LEDD),32 MDS-UPDRS III On and Off medication and MDS-UPDRS IV and PD specific quality of life (PDQ-39).33 In terms of non-motor domains, MDS-UPDRS I and II, depressive symptoms (BDI-II),34 apathy (Starkstein-Apathy-Scale),35 and impulsive behaviors (QUIP-RS)36 were assessed. Genetic testing for 68 monogenetic causes as well as susceptibility genes and loci was additionally conducted.
Preoperative cognitive performance
Patients completed the Montréal cognitive assessment (MoCA),37 an overall cognitive screening test and an extensive computer-based neuropsychological test battery (CANTAB ConnectTM)38 established individually for our study and pilot tested in PD patients of different disease stages. A description of the tests applied in this study can be found in the Supplementary Material. Parameters used for statistical analysis were selected according to the main outcome measures of each test.
Assessing the cognitive domains of attention and motor speed, reaction time from the Motor Screening Task (MOT-ML) was used to test for the patient’s ability to functionally manage the rest of the test battery. The Reaction Time test focused on perception of stimuli, processing and execution as well as accuracy of response in both a simple task with a single cue (RTI-SMDRT) and advanced five choice trial (RTI-FMDRT). Outcome parameters for visual learning were visual short- (PRM-PCI) and long-time memory (PRM-PCD) from the Pattern Recognition Memory test in which the participant had to memorize previously seen patterns. In the Paired Associated Learning task, association learning was combined with a time sequence. Here, the measures were errors (PAL-TEA) and correct pairs on first attempt (PAL-FAMS). Visuospatial working memory was tested with the Spatial Span test. The patient was asked to reproduce the right sequence of color changing squares and short-time memory (SSP-FSL) as well as working memory (SSP-RSL) was assessed by measuring the length of the correct forward or backward sequence. Verbal learning was recorded by asking for previously learned words in free recall (VRM-FRDS), an immediate recognition (VRM-IRTC) and a delayed recognition set (VRM-DRTC). Tests for executive functions were evaluating attentional flexibility and adjustment. Reported outcome parameters were errors in the Multitasking test (MTT-TIC), reaction time (MTT-LMD), incongruency costs for conflicting stimuli (MTT) and multitasking costs (MTT-MTCMD). In addition, executive functions were assessed by a spatial working memory test where the patient had to memorize visuospatial information and devise a strategy in order to complete the task. Outcome parameters were repetitive errors (SWM-BE468) and strategy points (SWM-S). Social cognition was assessed by the Emotion Recognition test with the main outcome being correct choices of recognizing basic emotions based on facial expression (ERT-TH). Theory of Mind (ToM), the ability to infer other peoples’ thoughts was investigated by means of the Yoni task39 differentiating affective from cognitive ToM. Additionally, the number of affected domains in the standard neuropsychological test session conducted by a neuropsychologist was assessed.
Imaging predictors
Preoperative structural 3T MRIs from clinical routine (Siemens Magnetom Vida / Skyra) acquired between 05/2019 and 09/2021 were used for voxel-based morphometry (VBM). Volumes of the cholinergic basal forebrain, i.e., of the nucleus basalis of Meynert and surrounding nuclei (Ch1-3) were calculated from T1-MPRAGE sequences via the open-source toolbox CAT12 (http://141.35.69.218/cat) running in MATLAB. The methodology was exactly the same as previously described:22 After segmentation, normalization and smoothing, homogeneity was checked. Volumes were calculated using the atlas of Zaborszky and colleagues40 implemented in the Anatomy toolbox. As all brain volumes depend on total intracranial volume (TIV), which in turn depends on age and sex, the NBM/TIV and Ch1-3/TIV ratios were calculated. DBS leads were localized on postoperative CT scans using the Lead DBS toolbox running in MATLAB.
Perioperative predictors
For stereotactic implantation of DBS electrodes in the bilateral STN, the duration of intermission of dopaminergic medication was monitored. Start time and length of this procedure and the implantation of the impulse generator (IPG) several days later were recorded. If possible, patients had only a minimal sedation during the first surgery. The IPG implantation took place under general anesthesia. Doses of sedatives and anesthetics (Propofol, Fentanyl and Remifentanil) administered during electrode and IPG implantation were recorded. Depth of sedation was assessed using frontal EEG recordings (raw data from SedLine® device) with 4 frontal channels placed on the forehead throughout electrode implantation. Details on EEG analysis can be found in the Supplementary Material of this article. Measures extracted for further analysis were the power peak, spectral edge frequency (SEF95, the frequency below which 95% of the power lies) and the relative time of burst suppression.
Statistical analysis
Basic statistical analysis was performed in IBM SPSS Statistics Version 28 whereas multivariable analyses were carried out with the sci-kit learn Version 1.3.0 in Python 3.9.13.41 Shapiro-Wilk tests revealed that the distribution of the majority of data differed significantly from normality. Measures are reported as median±interquartile range or mean±standard deviation (SD) depending on their distribution. Two-sided p-values <0.05 were considered significant.
Spearman correlations between possible predictors and POD severity were performed and are given as univariate coefficients rho with their respective uncorrected p-values.
Additionally, clinical characteristics and test results are reported for the POD+ and POD– groups separately and a group comparison was conducted with Chi-Square, Mann-Whitney-U-tests and t-tests depending on the category of data pairs (both categorial or mixed metric and categorial, respectively).
Because of the high number of possible predictors (p = 61 after exclusion of predictors available in less than 50% of participants, namely CSF markers, NFLZ-Scores, doses of Fentanyl and Remifentanil during IPG implantation) compared to the number of patients (n = 57), we additionally implemented regression with elastic net regularization42 to mitigate overfitting and increase the stability of coefficient estimates.43 Elastic net regression is a linear regression model with a combination of an L1 penalty, which enforces setting of coefficient values to 0 and is thus used for variable selection, and L2 penalty, which reduces large individual coefficients and increases the stability of the coefficient estimates and the generalization ability of the models. To test the model’s predictive performance, we used leave-one-out cross-validation, in which relationships between predictors and POD severity and duration were learned in a training set, which comprised all but one (left out) patient. The model that was fitted to the patients in the training set was then applied to predict POD severity and duration in the left out (test) patient. This procedure was repeated until all patients had been left out once. The predictive performance of the model for test patients (who were not used in its training process) was assessed by calculating the mean absolute error, Spearman correlation between each patient’s predicted and true POD severity or duration. The analysis pipeline in each cross-validation fold comprised one-hot-encoding of categorical predictors, imputation of missing values using k-nearest-neighbors imputation as implemented in KNNImputer class of sklearn with default parameters,44 z-standardization of numerical variables, and training of the regression model in the training set. The hyperparameters of the elastic net regression model (regularization strength and ratio between L1 and L2 penalty) were optimized in a nested 20-fold cross-validation loop within each training set. The participant in the test set was preprocessed in the same way as learned in the training set and his/her POD risk was predicted with the regression model trained in the training set. A final multivariable model was fit with all patients and the hyperparameter set which was optimal in the majority of cross-validation folds and its coefficients are reported as multivariablecoefficients.
To sum up, predictors were considered especially significant if they had a statistically significant univariate relationship to delirium severity and were additionally relevant to the predictions of the multivariable model (non-zero coefficient).43
RESULTS
62 patients with PD were enrolled in our main study. Five decided against treatment with DBS, hence 57 PD patients (21 female) who underwent STN-DBS surgery at Charité - Universitätsmedizin Berlin between 06/2019 and 09/2021 were included in the analysis. N (%), means (SD) or median (IQR) of all cohort characteristics and possible predictors are reported in Table 1.
Table 1
Cohort characteristics and possible predictors, multivariable coefficients of the final regularized regression model and group comparison POD+/POD–
| n (%) | mean±SD/median± interquartile range | Outcome POD severity | Outcome POD group comparison | ||||||
| Univariate coefficient rho (95% CI) | p | Elastic net regression model Multivariable coefficient | POD– mean±SD/median ±interquartile range | POD+ mean±SD/ median± interquartile range | p | ||||
| General predictors | Sex | –0.208 (–0.450–0.064) | 0.121 | –0.009 | 0.033*1 | ||||
| Male | 36 (63.2) | 19 (52.8%) | 17 (81%) | ||||||
| Female | 21 (36.8) | 17 (47.2%) | 4 (19%) | ||||||
| Age | 57 | 60.2±8.15a | 0.475 (0.237–0.659) | <0.001** | 0.123 | 57.5±8.53a | 64.9±4.67a | 0.001**2 | |
| Years of education | 57 | 15.4±3.42a | 0.100 (–0.173–0.358) | 0.460 | 0.056 | 14.0±5.9b | 16.1±3.73a | 0.2772 | |
| Charlson comorbidity index (CKI)5 | 57 | 0.0±0.0b | 0.113 (–0.160–0.370) | 0.402 | –0.021 | 0.0±1.0b | 0.0±1.0b | 0.4933 | |
| Body mass index (BMI) | 57 | 27.1±5.17a | –0.139 (–0.392–0.134) | 0.302 | –0.055 | 27.6±5.33a | 26.3±4.93a | 0.3632 | |
| Mini nutritional assessment (MNA-SF)5 | 57 | 12.2±2.02a | –0.036 (–0.301–0.234) | 0.792 | 0.001 | 13.0±3.0b | 13.0±3.0b | 0.6082 | |
| Beck depression inventory (BDI-II)5 | 55 | 12.4±8.01a | –0.009 (–0.281–0.265) | 0.951 | –0.000 | 12.0±12.0b | 12.1±5.86a | 0.8172 | |
| Starkstein apathy scale (SAS)5 | 54 | 13.0±10b | –0.055 (–0.325–0.224) | 0.695 | –0.004 | 13.0±9.0b | 14.8±6.44a | 0.8723 | |
| Activity of daily living (ADL)5 | 55 | 10.5±15b | 0.212 (–0.065–0.485) | 0.121 | 0.122 | 10.0±15.0b | 20.0±16.16a | 0.0843 | |
| Preoperative CRP (in μl) | 57 | 1.1±1.6b | –0.118 (–0.374–0.155) | 0.381 | 0.040 | 1.3±1.6b | 0.9±1.7b | 0.3983 | |
| NFL Z-Score in serum | 21 | 0.9±0.93a | –0.001 (–0.443–0.442) | 0.997 | e.f.m.4 | 0.9±23.48a | 1.2±1.36a | 0.5642 | |
| CSF markers | e.f.m.4 | ||||||||
| Phospho TAU (in pg/ml) | 23 | 31.2±17.70b | 0.202 (–0.242–0.576) | 0.355 | 31.0±18.40b | 35.0±8.06a | 0.3663 | ||
| Total TAU (in pg/ml) | 22 | 208.0±121.25b | 0.128 (–0.323–0.531) | 0.572 | 207.0±182.0b | 209.0±47.93b | 0.6473 | ||
| ß-Amyloid 1–40 (in pg/ml) | 23 | 10755.09±3519.97a | 0.156 (–0.286–0.543) | 0.156 | 10565.4±3797.29a | 11188.7±3011.13a | 0.7052 | ||
| ß-Amyloid 1–42 (in pg/ml) | 22 | 958.1±282.22a | 0.012 (–0.422–0.442) | 0.957 | 942.9±298.53a | 998.7±253.89a | 0.6902 | ||
| ß-Amyloid 1–42/40 Ratio | 23 | 0.1±0.02a | –0.059 (–0.470–0.373) | 0.790 | 0.1±0.02a | 0.1±0.01a | 0.6422 | ||
| ß-Amyloid 1–42/ Total TAU Ratio | 19 | 4.3±1.39a | 0.097 (–0.386–0.538) | 0.693 | 4.2±1.64a | 4.6±0.63a | 0.6122 | ||
| PD-specific predictors | Disease duration (in years) | 57 | 10.5±5.87a | 0.184 (–0.88–0.431) | 0.170 | 0.071 | 9.0±8.0b | 11.0±5.0b | 0.0952 |
| Motor predominance type | 57 | ||||||||
| Tremor-dominant | 10 (17.5) | –0.047 (–0.367–0.162) | 0.728 | 0 | 7 (19.4%) | 3 (14.3%) | 0.2441 | ||
| Akinetic-rigid | 28 (49.1) | 0.207 (–0.065–0.450) | 0.123 | 0.02 | 15 (41.7%) | 13 (61.9%) | 0.1401 | ||
| Equivalent | 19 (33.3) | –0.181 (–0.428 –0.091) | 0.178 | –0.012 | 14 (38.9%) | 5 (23.8%) | 0.2441 | ||
| Levodopa equivalent dose (LEDD) (in mg) | 57 | 1278.7±341.03a | 0.255 (–0.014–0.490) | 0.055 | 0.109 | 1222.8±320.29a | 1299.0±413.0b | 0.1062 | |
| Genetics | 54 | ||||||||
| negative | 43 (75.4) | 0.183 (–0.502–0.014) | 0.186 | 0.036 | 25 (69.4%) | 18 (98%) | 0.1471 | ||
| GBA | 6 (10.5) | –0.263 (–0.097–0.436) | 0.055 | –0.018 | 6 (16.7%) | 0 | 0.046*1 | ||
| LRRK2 | 4 (7.0) | –0.097 (–0.363–0.183) | 0.484 | –0.008 | 3 (8.3%) | 1 (1%) | 0.6041 | ||
| PARK2 | 1 (1.8) | 0.255 (–0.022–0.496) | 0.063 | 0.004 | 0 | 1 (1%) | 0.1881 | ||
| MDS-UPDRS I5 | 55 | 10.0±5.86a | 0.040 (–0.235–0.309) | 0.771 | 0 | 9.0±7.0b | 9.0±5.0b | 0.7322 | |
| MDS-UPDRS II5 | 55 | 11.9±6.51a | 0.237 (–0.039–0.478) | 0.082 | 0.049 | 10.9±6.13a | 13.0±7.0b | 0.1402 | |
| MDS-UPDRS III On5 | 57 | 25.0±12.29a | 0.246 (–0.023–0.478) | 0.065 | 0.061 | 22.6±12.59a | 28.9±10.91a | 0.0612 | |
| MDS-UPDRS III Off5 | 57 | 53.9±15.32a | 0.077 (–0.195–0.338) | 0.569 | –0.023 | 53.2±15.95a | 55.0±14.50a | 0.6782 | |
| MDS-UPDRS IV5 | 52 | 9.0±9.00b | –0.248 (–0.494–0.035) | 0.076 | –0.097 | 10.0±5.0b | 5.8±5.01a | 0.039*3 | |
| PDQ-39 PDSI (in %) | 56 | 32.0±15.37b | 0.100 (–0.175–0.361) | 0.461 | 0.013 | 32.0±10.82a | 33.8±10.72a | 0.4423 | |
| QUIP-RS5 | 54 | 8.6±10.37a | –0.089 (–0.355–0.191) | 0.523 | 0.006 | 6.0±16.0b | 3.0±17.0b | 0.6962 | |
| Cognitive predictors | Montreal-cognitive-assessment (MoCA)5 | 57 | 25.6±2.99a | –0.223 (–0.463–0.048) | 0.096 | –0.055 | 26.1±2.91a | 25.0±4.0b | 0.1152 |
| Number of deteriorated domains in classical neuropsychocological testing | 56 | 1.8±1.34a | –0.043 (–0.310–0.230) | 0.754 | –0.039 | 2.0±2.0b | 1.0±1.0b | 0.7212 | |
| CANTAB connect test battery | |||||||||
| Attention and motor speed | |||||||||
| MOT-ML (reaction time: ms) | 57 | 947.6±349.5b | 0.300 (0.035–0.526) | 0.023* | 0.108 | 933.9±205.24a | 1164.7±457.33a | 0.0713 | |
| RTI-SMDRT (simple reactiontime:ms) | 57 | 381.4±64.51a | 0.402 (0.150–0.605) | 0.002** | 0.085 | 360.9±44.76a | 416.5±78.05a | 0.001**2 | |
| RTI-FMDRT (advanced reactiontime: ms) | 57 | 417.0±93.0b | 0.283 (0.016–0.512) | 0.033* | 0.047 | 417.9±58.28a | 427.0±72.0b | 0.028*3 | |
| Visual learning | |||||||||
| PRM-PCI (visual short-timememory: %) | 57 | 88.9±16.66b | –0.212 (–0.454–0.059) | 0.113 | –0.060 | 87.5±9.34a | 81.7±14.17a | 0.1553 | |
| PRM-PCD (visual long-timememory: %) | 54 | 73.7±14.32a | 0.062 (–0.217–0.332) | 0.654 | 0.084 | 72.5±13.80a | 75.5±15.33a | 0.4622 | |
| PAL-TEA (association learning:errors) | 57 | 20.0±27b | 0.278 (0.011–0.508) | 0.036* | 0.043 | 19.5±25.0b | 35.0±22.04a | 0.1073 | |
| PAL-FAMS (association learning:correct pairs) | 57 | 9.0±5.0a | –0.271 (–0.503 – –0.004) | 0.041* | –0.025 | 8.9±4.13a | 6.9±4.81a | 0.0992 | |
| Memory and working memory | |||||||||
| SSP-FSL (visual short-timememory: score) | 56 | 6.0±1.0b | –0.441 (–0.635 – –0.193) | <0.001** | –0.147 | 6.0±1.0b | 4.5±1.27a | 0.003**3 | |
| SSP-RSL (visual workingmemory: score) | 56 | 5.0±1.0b | –0.295 (–0.523 – –0.026) | 0.027* | –0.111 | 5.5±1.0b | 5.0±1.0b | 0.0743 | |
| VRM-FRDS (verbal learning:words in free recall) | 57 | 3.0±3.0b | –0.141 (–0.394–0.132) | 0.297 | –0.042 | 3.0±3.0b | 3.2±2.16a | 0.2763 | |
| VRM-IRTC (verbal learning:words in immediate recognition) | 57 | 29.0±4.0b | –0.089 (–0.348–0.184) | 0.512 | 0.007 | 28.5±3.83a | 27.1±4.60a | 0.4353 | |
| VRM-DRTC (verbal learning:words in delayed recognition) | 55 | 26.9±4.30a | –0.179 (–0.431–0.099) | 0.191 | –0.030 | 28.0±6.0b | 26.2±4.37a | 0.3362 | |
| Executive functions | |||||||||
| MTT-TIC (multitasking: errors) | 57 | 8.0±12.0b | 0.267 (–0.001–0.499) | 0.045* | 0.053 | 6.5±11.0b | 11.0±36.0b | 0.1013 | |
| MTT-LMD (multitasking reactiontime: ms) | 57 | 843.1±170.59a | 0.182 (–0.091–0.429) | 0.176 | –0.038 | 825.3±113.86a | 873.5±239.29a | 0.3082 | |
| MTT-ICMD (multitaskingincongruency costs: ms) | 57 | 87.5±89.5b | –0.121 (–0.377–0.152) | 0.370 | –0.032 | 103.3±79.9b | 78.0±87.15a | 0.4183 | |
| MTT-MTCMD (multitaskingcosts: ms) | 57 | 305.2±169.73a | 0.022 (–0.247–0.288) | 0.871 | 0 | 308.6±135.75a | 299.3±219.89a | 0.8432 | |
| SWM-BE468 (spatial workingmemory: repetitive errors) | 57 | 20.0±10.0a | 0.164 (–0.109–0.414) | 0.223 | 0.016 | 18.5±7.42a | 23.0±9.0b | 0.3212 | |
| SWM-S (spatial working memory:strategy) | 57 | 10.0±2.0a | –0.049 (–0.313–0.222) | 0.717 | –0.039 | 10.0±2.0b | 9.3±1.77a | 0.7322 | |
| Social cognition | |||||||||
| ERT-TH (emotion recognition:correct choices) | 57 | 24.0±4.0b | 0.031 (–0.239–0.296) | 0.820 | 0.053 | 23.5±5.0b | 23.9±5.21a | 0.6843 | |
| Theory of mind (ToM) Yoni Task | |||||||||
| Cog_accuracy (cognitive ToMcondition: correct choices in %) | 39 | 85.0±0.2b | –0.246 (–0.528–0.085) | 0.131 | 0 | 0.8±0.23b | 0.7±0.22a | 0.1933 | |
| Aff_accuracy (affective ToMcondition: correct choices in %) | 39 | 80.0±0.31b | –0.213 (–0.503–0.119) | 0.192 | 0.008 | 0.8±0.32b | 0.7±0.23a | 0.3093 | |
| Phy_accuracy (ToM controlcondition: correct choices in %) | 39 | 85.0±0.2b | –0.267 (–0.544–0.063) | 0.100 | 0 | 0.9±0.2b | 0.8±0.45b | 0.1533 | |
| Imaging parameters | NBM/TIV | 52 | 0.0005±0.00005a | –0.408 (–0.618 – –0.144) | 0.003** | –0.083 | 0.00053±0.000048a | 0.00048±0.000046a | 0.008**2 |
| Ch1-3/TIV | 52 | 0.0005±0.00005a | –0.230 (–0.479–0.054) | 0.102 | –0.027 | 0.00059±0.000049a | 0.00057±0.000057a | 0.1532 | |
| Peri-operative predictors | EEG parameters | ||||||||
| Alpha Peak | 40 | 9.6±2.50b | 0.227 (–0.101–0.510) | 0.159 | 0.014 | 9.5±1.92b | 9.8±1.53b | 0.1833 | |
| SEF 95 % | 40 | 25.2±1.89a | –0.112 (–0.417–0.216) | 0.491 | 0 | 25.3±3.36b | 25.3±1.51b | 0.3122 | |
| Burst suppression ratio | 10 | 0.004±0.02b | 0.436 (0.134–0.663) | 0.005** | 0.068 | 0.0±0.0b | 0.0±0.01b | 0.017*3 | |
| Doses of narcotics | |||||||||
| Electrode lead implantation: | |||||||||
| Propofol (mg/kg body weight) | 43 | 31.9±16.75a | 0.095 (–0.220–0.392) | 0.546 | 0.008 | 30.9±16.27a | 33.2±17.72a | 0.6602 | |
| Remifentanil (μg/kg bodyweight) | 51 | 77.1±59.61a | 0.218 (–0.070–0.472) | 0.125 | 0.038 | 85.3±118.29b | 99.9±89.9b | 0.1942 | |
| Fentanyl (μg/kg body weight) | 3 | 37.9±60.09a | 0.866 (–) | 0.333 | e.f.m.4 | 3.2±2.91a | 107.2a | 0.022*2 | |
| Impulse generator implantation: | |||||||||
| Propofol (mg/kg body weight) | 56 | 13.2±7.42a | –0.097 (–0.358–0.178) | 0.475 | –0.041 | 13.4±6.47b | 12.6±3.92b | 0.4902 | |
| Remifentanil (μg/kg bodyweight) | 27 | 30.9±17.41a | 0.375 (0.017–0.668) | 0.054 | e.f.m.4 | 22.2±19.82b | 35.8±12.45a | 0.2332 | |
| Fentanyl (μg/kg body weight) | 31 | 5.6±1.58a | –0.036 (–0.395–0.332) | 0.848 | e.f.m.4 | 5.0±2.07b | 5.4±1.39a | 0.6182 | |
| Dopaminergic medication pause (in hours) | 57 | 12.0±11.2b | 0.029 (–0.240–0.295) | 0.828 | –0.010 | 12.5±10.5b | 14.0±9.75b | 0.6493 | |
| Duration of electrode lead implantation (in minutes) | 57 | 355.0±61b | 0.026 (–0.244–0.292) | 0.849 | 0.034 | 363.0±48.43a | 356.4±46.06a | 0.9213 | |
| Duration of impulse generator implantation (in minutes) | 56 | 121.0±47b | 0.122 (–0.153–0.380) | 0.370 | 0.060 | 112.1±27.40a | 111.0±37.0b | 0.4163 | |
List of all cohort characteristics and possible predictors. From left to right: Total number (n) or percentage (%) of participants; median range±interquartile range or mean±standard deviation (SD); Outcome POD severity: Coefficients of the univariate model (univariate coefficients with respective p-values from Spearman correlations and 95% confidence interval (CI)) and multivariable elastic net regression model (multivariable coefficient); Group comparison of patients with (POD+) and without POD (POD–): Median and interquartile range or mean±standard deviation (SD); p-values POD+/– of statistical tests depending on the category of data pairs (both categorial, mixed metric and categorial, respectively). amean±SD, bmedian±interquartile range (depending on the distribution of the variable), 1Chi-Square, 2t-test, 3Mann-Whitney-U-test, 4e.f.m.: excluded from multivariable model because data was available in less than 50% of subjects, 5in points, *p < 0.05, **p < 0.005; NFL: neurofilament, CSF: cerebrospinal fluid, MDS-UPDRS I–IV: Movement Disorder Society Unified Parkinson’s Disease Rating Scale, PDQ-39 PDSI: Parkinson’s Disease Questionnaire Sum Index, QUIP-RS: Impulsive-Compulsive Disorders in Parkinson’s Disease–Rating Scale, NBM: Nucleus basalis of Meynert, TIV: total intracranial volume, Ch1-3: surrounding nuclei of NBM, EEG: electroenzephalography, SEF: spectral edge frequency.
Characteristics of POD
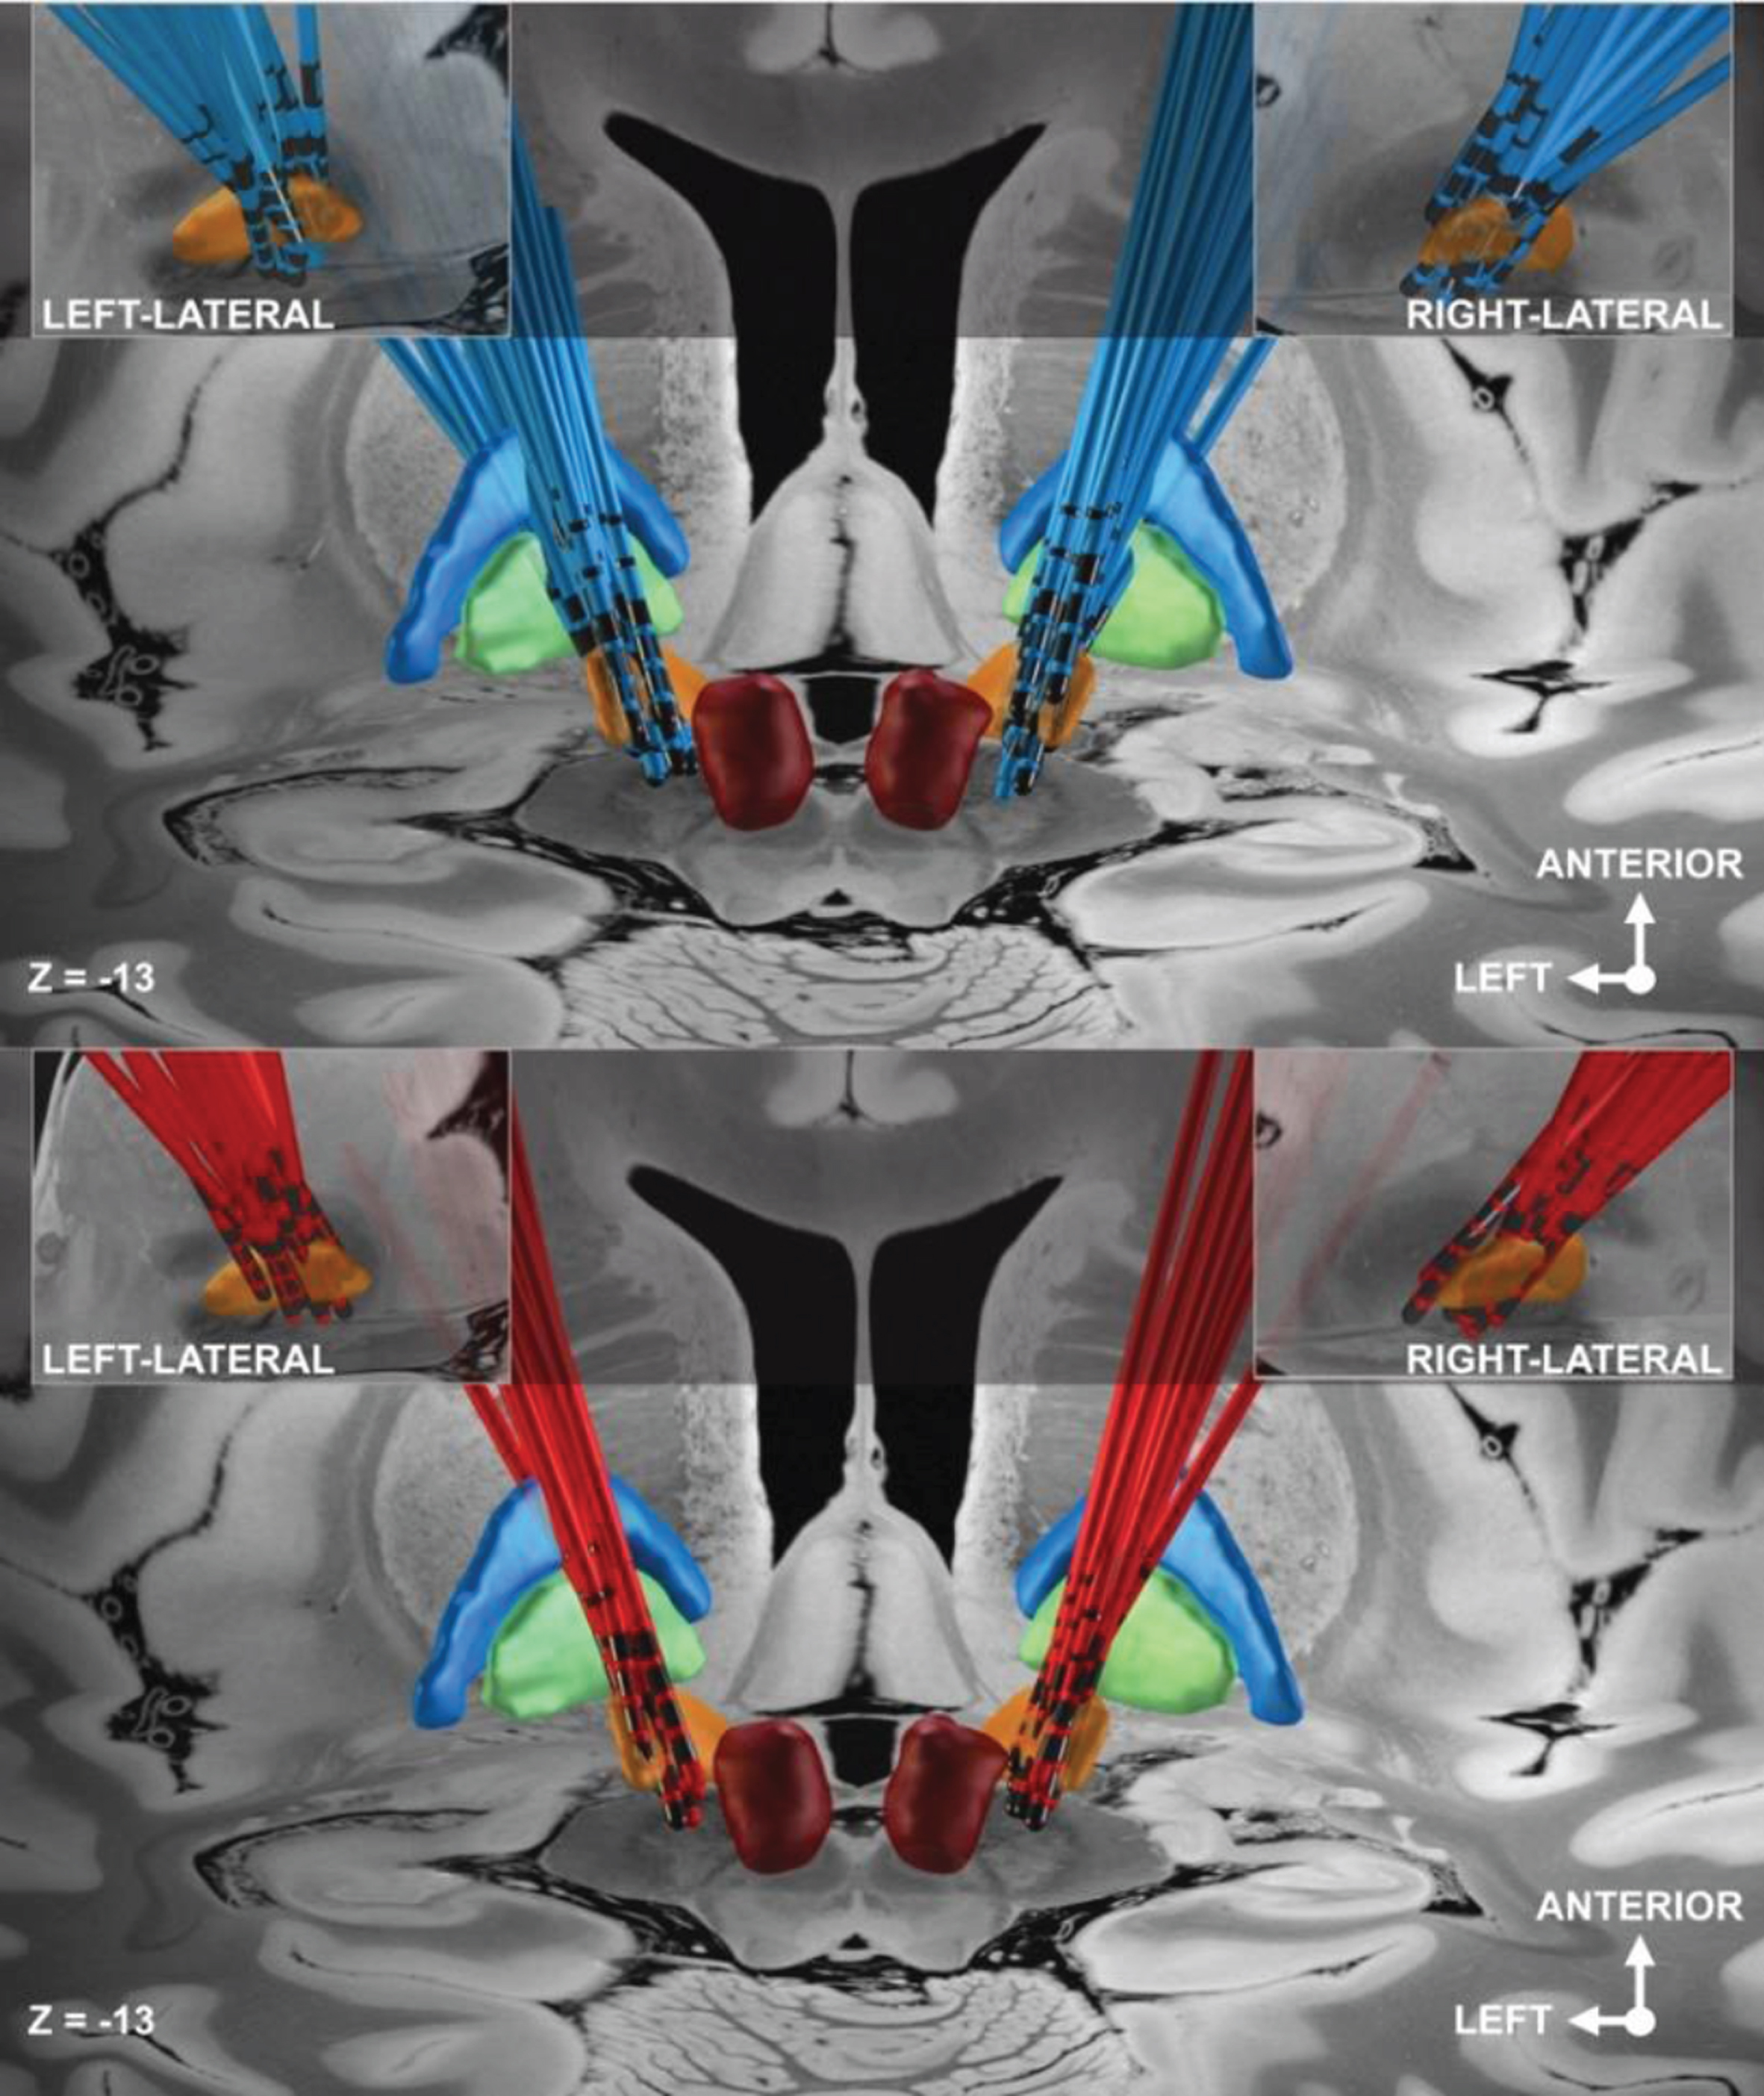
36.8% (n = 21) of the 57 PD patients were screened positively for POD after DBS surgery (consecutively named POD+). No patient showed signs of delirium prior to DBS surgery. POD occurred after 1.7±2.0 days. Only one patient started displaying POD in the second week after DBS surgery. In all other patients, POD developed during the first week postoperatively. Mean POD duration was 7.5 days±6.4 with a maximum of 21 days in two patients. POD was no longer detectable after two days in 23.5% (n = 5) of the patients with delirium. Mean POD severity was rather mild with 2.8±1.0 NU-DESC points. Electrode locations of the POD+ and POD– group are shown in Fig. 1.
Fig. 1
Visualization of electrode locations of the POD– (blue electrodes) and POD+ group (red electrodes). Dark red: red nucleus; orange: STN; green: Globus pallidus internus (GPi); blue: Globus pallidus externus (GPe).
Univariate analysis
General predictors
Among the general predictors, higher age (rho = 0.475, p < 0.001) was most influential with respect to POD severity.
In the group comparison POD+/POD–, male sex was also associated with the appearance of POD (p = 0.033).
There is some missing data as the invasive procedure of lumbar puncture was optional, so some patients objected for this reason.
PD-specific predictors
Within the predictors referring to specific characteristics of PD, only in the group comparison POD+/POD–, severity of motor fluctuations (MDS-UPDRS IV) and mutations in the GBA gene were negatively associated with the development of POD (p = 0.039 and p = 0.046 respectively).
Preoperative cognitive performance
Among the specific predictors of preoperative cognition, deficits in the domains attention and motor speed, visual learning and working memory of the CANTAB ConnectTM test battery had strongest associations with POD severity in the elastic net regression model. More specifically, slow reaction time in the MOT (rho = 0.300, p = 0.023) and RTI (simple and advanced reaction time rho = 0.402, p = 0.002 and rho = 0.283, p = 0.033), deficits in the visual association learning test PAL (errors rho = 0.278, p = 0.036, correct pairs rho=–0.271, p = 0.041) as well as worse performance in the spatial span test SSP (forward: visual short-time memory r = –0.441, p < 0.001, backward: visual working memory rho = –0.295, p = 0.027) were associated with higher POD severity.
Imaging predictors
POD severity was significantly associated with lower relative NBM volume as extracted from VBM (NBM/TIV ratio rho = –0.408, p = 0.003).
Perioperative predictors
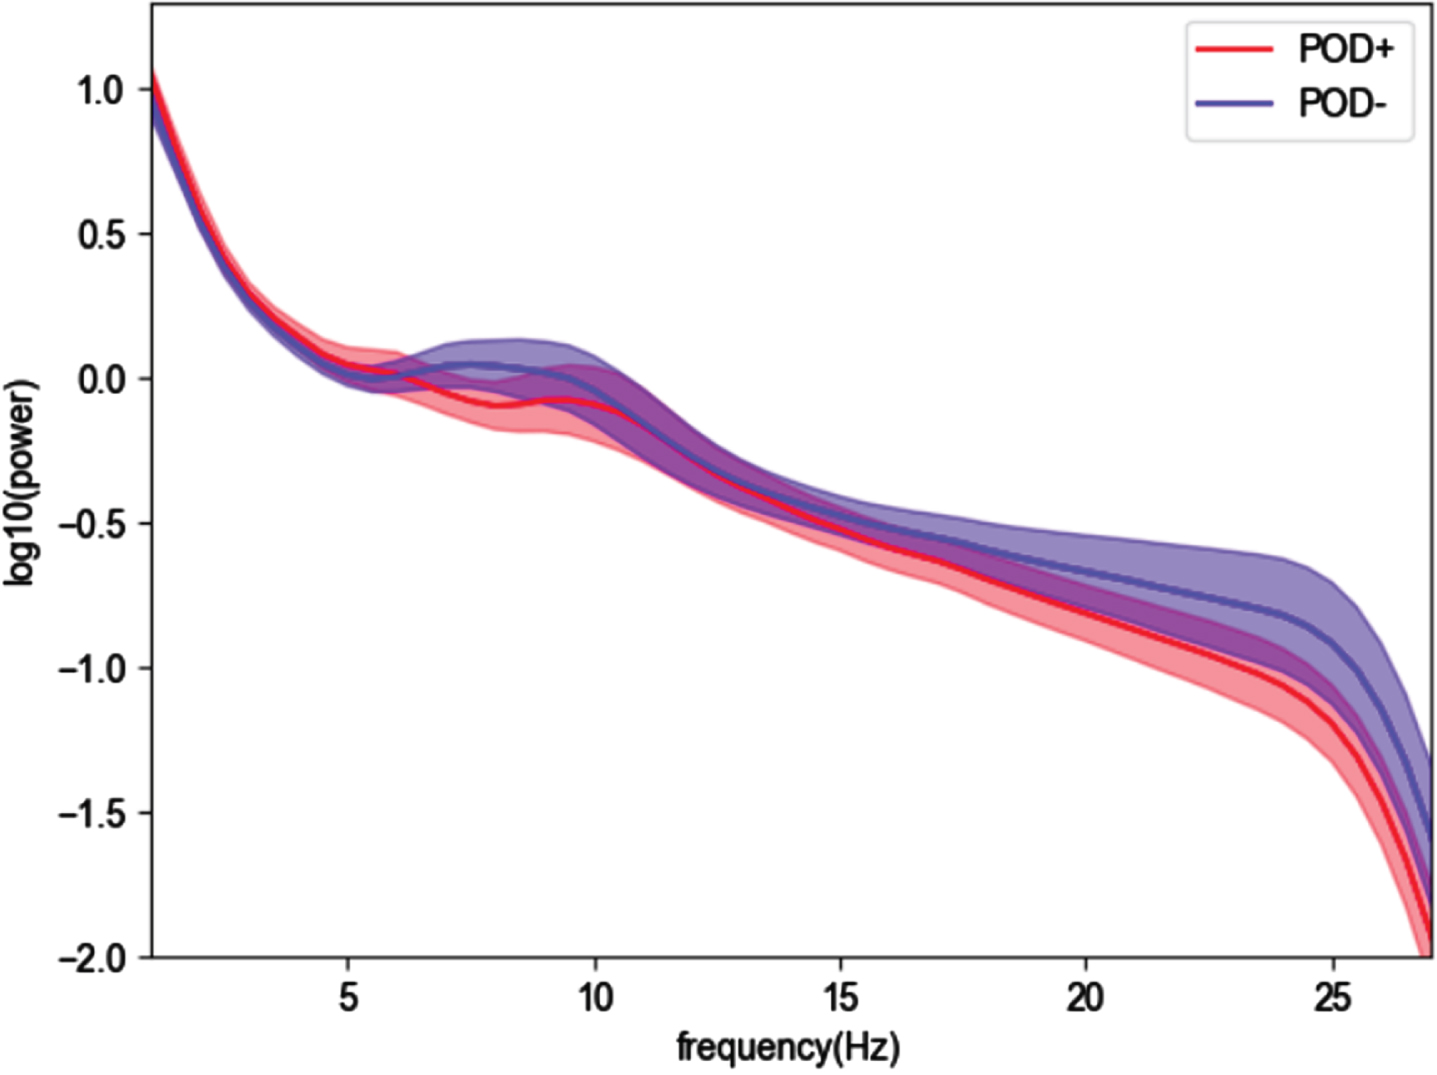
Three patients were operated in local anesthesia and did not receive any sedatives at all. 61.4% of our cohort were operated in intubation narcosis, whereas 38.4% had only sedatives. Intubation narcosis was neither associated with POD severity (rho = 0.003, p = 0.983) nor with the appearance of POD itself in the group comparison (p = 0.080). Burst suppression patterns in the EEG indicative of deep sedation were detected in ten out of 40 cases with SedLine® monitoring during electrode implantation and were associated with POD severity (rho = 0.436, p = 0.005). Additionally, the comparison of the groups POD+ and POD– revealed an association of the intraoperative body weight-adjusted dose of the sedative Fentanyl during electrode implantation with POD (p = 0.022). When comparing intraoperative power spectra of these groups visually, the POD+ group showed on average lower EEG frequencies than the POD– group (Fig. 2) but neither power peak nor SEF95 showed significant differences between POD+ and POD–.
Fig. 2
Intraoperative EEG power spectra (average of the normalized power across the 4 channels) with 95% confidence interval, group comparison between POD+ (red) and POD– (blue).
Multivariable analysis
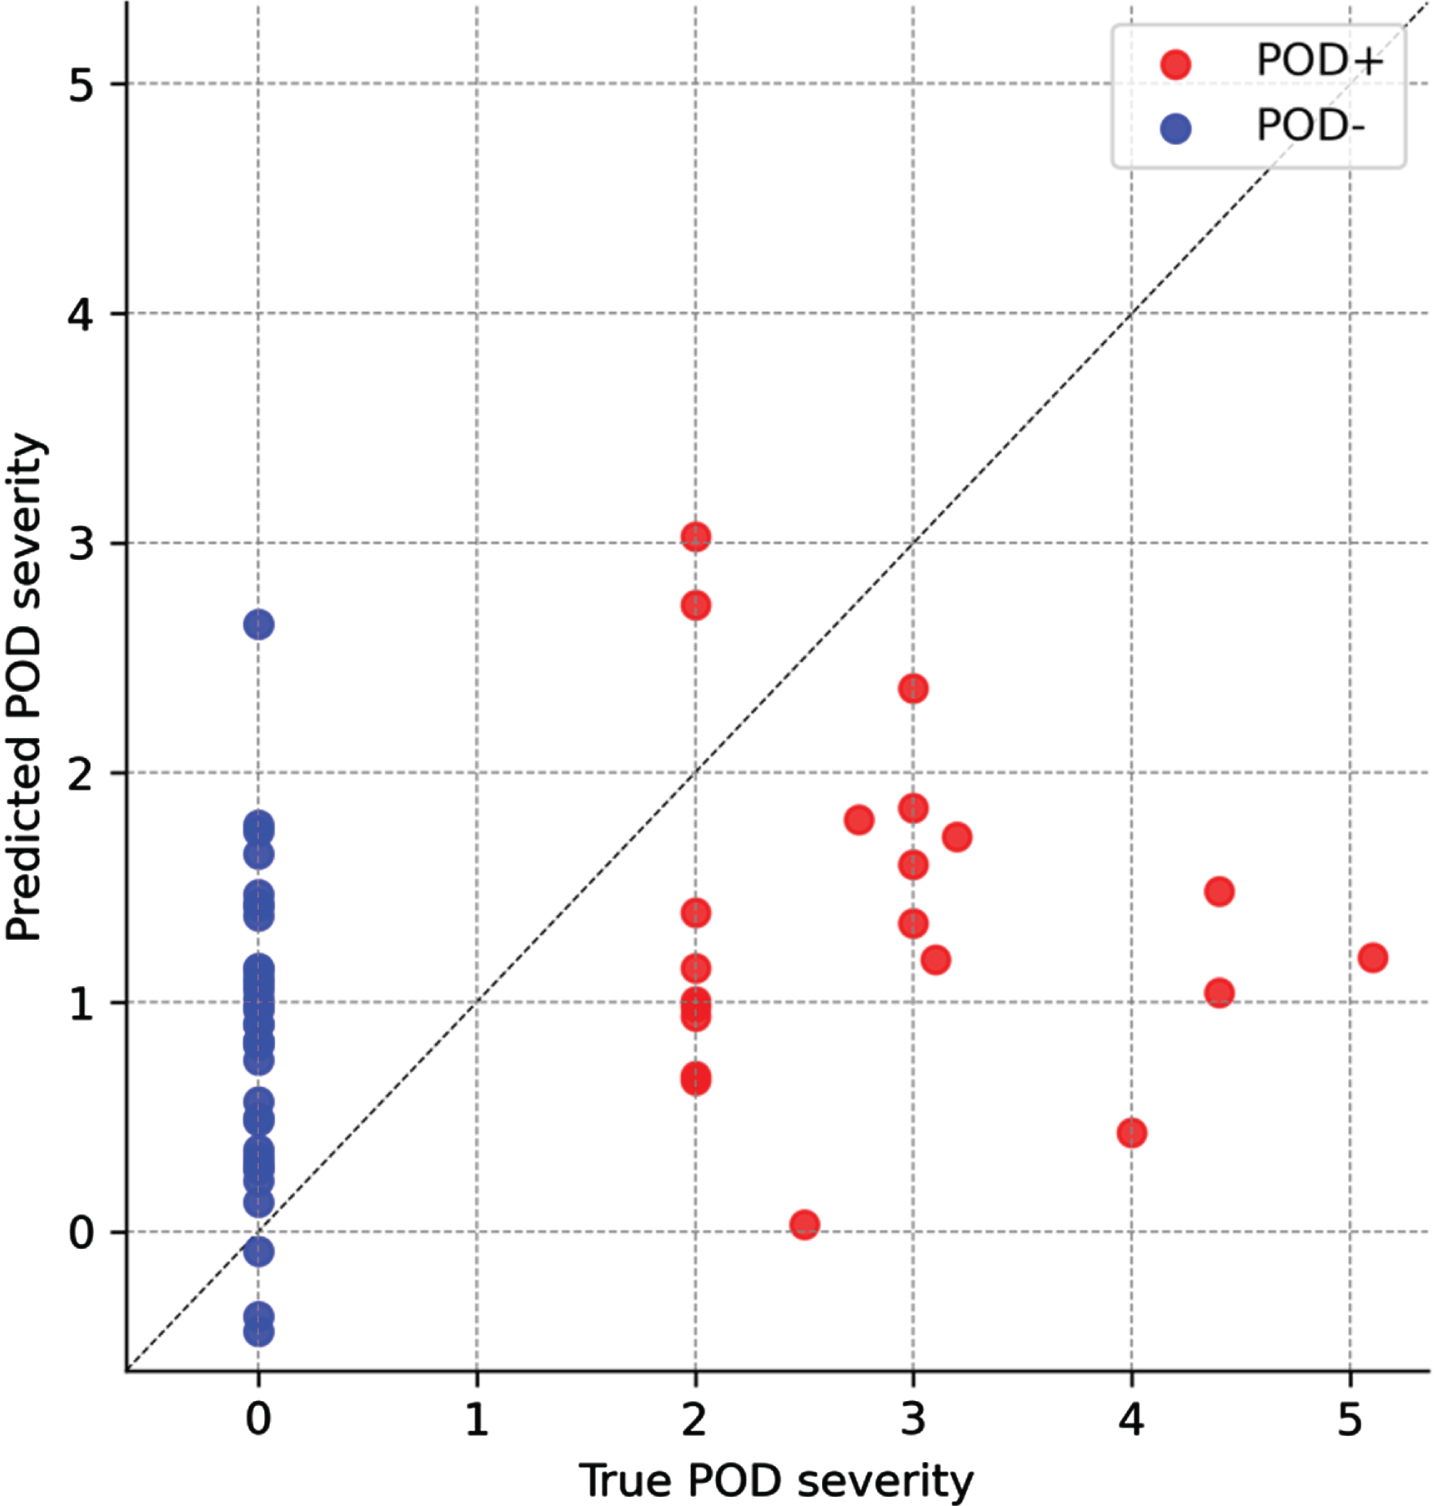
We found a significant correlation between predicted and true POD severity (Spearman rho = 0.365, p = 0.001, mean absolute error = 1.167, concordance correlation coefficient of true and predicted delirium severity: 0.239, Fig. 3) but not POD duration (Spearman rho = 0.213, p = 0.111). With POD severity as the outcome, a few predictors showed a multivariable coefficient of ≈ 0 and were thus removed from the model (tremor-dominant motor type, MDS-UPDRS I, BDI-II, MTT multitasking costs, accuracy in Yoni cognitive and control conditions as well as SEF95). All multivariable coefficients of the final regularized regression models can be found in Table 1.
Fig. 3
Correlation between true and predicted POD severity from the regularized regression. POD+ (red) and POD– (blue). For illustration purposes of the model fit, an x = y line was plotted.
DISCUSSION
POD is highly relevant in terms of quality of life, dependency on care and mortality.12 In the present study, we have shown that POD after STN-DBS in PD patients is common and many factors contribute to its occurrence. In particular, age, deficits in specific neuropsychologic domains, NBM volume and deep sedation are drivers of POD severity.
Characteristics of POD after STN-DBS in PD
It is essential to detect POD early in order to implement treatment, e.g., frequent visits by family members, avoidance of noise and assurance of circadian rhythm.3,45 On average, POD occurred 1.7 days after electrode implantation and lasted 7.5 days. POD severity was 2.8 NU-DESC points on average implicating predominantly mild courses of POD as only scores equal or higher than 2 points are classified as delirium-positive. As this is the first study with POD severity after STN-DBS in PD as primary outcome, no comparisons to other cohorts can be drawn. However, characterization of POD duration and severity is of importance because it is strongly related to the long-term outcome,46 although we assume these mainly mild courses of POD would rather not be recognized in the clinical routine.
The prevalence in our cohort was 36.8%, which is higher than in most previous studies on complications of STN-DBS 6 with only Tanaka et al. detecting a maximum prevalence of 42.6%.47 We attribute the relatively high rate and long duration of POD to the prospective nature of our study with explicit screening for POD with validated scales3,48 every 8 h until discharge from hospital. This has not been done in previous works on the topic. Another reason for the discrepancy in POD rates described after STN-DBS is the overlap of symptoms of PD and POD, especially in hypoactive delirium that is even more difficult to diagnose.49 It has to be considered that there could be a bias towards detection of hyperactive delirium due to underdiagnosis of hypoactive delirium. This is very relevant as delayed initiation of treatment for hypoactive delirium leads to a poorer prognosis.3 With regular teaching to raters, we aimed at overcoming these difficulties which might also have resulted in the high POD prevalence in our study. However, there might be a limitation in distinguishing acute changes due to delirium from preexisting PD symptoms, e.g. fluctuating hallucinations, lack of attention or bradykinesia.8 Further, CAM-ICU and NU-DESC were validated as excellent screening tools for the detection of delirium50 but when focusing on POD severity or differentiation between hypo- and hyperactive delirium, there is some evidence that they may be less sensitive in comparison to other scales.51 POD severity is rather rarely investigated and if so the measurement instruments differ which leads to poorer comparability.52
General predictors
Age was shown to be a main risk factor for POD in general as well as it is one following STN-DBS in PD patients.12 We were able to reproduce this prospectively for POD severity. It is remarkable that the impact is that high although our cohort is limited to the biological age of 70 years as a prerequisite for DBS surgery.
In a previous paper, higher levels of comorbidities were linked to POD after STN-DBS.53 The low numbers of comorbidities other than PD and a stable nutritional status in our cohort may explain that we could not reproduce this association with our data.
According to previous studies, depressive symptoms are another risk factor for the development of POD in general3 and after STN-DBS in PD in particular.54 On average, our cohort was suffering from mild depressive symptoms but they were not specifically connected to POD severity.
C-reactive protein (CRP) levels have previously been linked to POD, a result that our study could not reproduce.55 This may be due to the generally very low CRP levels in our cohort, which can be explained by the elective nature of DBS surgery.
Neurofilament light chain as well as CSF amyloid-β and tau were shown to be promising biomarkers for neurodegeneration associated with cognitive decline in PD patients.56,57 We assumed that these biomarkers would also be connected to POD. For the present study, their impact on the elastic net regression model remains unclear as they were not included due to the lack of available data.
In the additional group comparison of POD+ and POD- patients, male PD patients suffered significantly more from POD after STN-DBS surgery than women. There is some evidence that PD in men was more advanced in our cohort but there were no differences in preoperative cognitive functions between the sexes. This finding was also observed in a retrospective study by Zhan et al.58 and in delirium after hip fractures in a non-PD cohort59 but underlying reasons need to be further elucidated.
PD-specific predictors
Longer disease duration and higher LEDD, i.e., more dopaminergic medication needed to control individual PD symptoms, were only associated with higher POD severity in the multivariable model. This is in line with both hypodopaminergic states and dopaminergic medication being independent risk factors of delirium that may also emerge without previous surgery.60 Surprisingly, the duration of the perioperative dopaminergic medication pause did not show a specific impact on POD severity in our study. This may be due to the fact that the pause of PD medication was held as short as possible as withdrawal is very stressful for patients.12
Interestingly, the classic motor phenotypes of PD had barely an impact on POD severity in our cohort. Especially the akinetic-rigid type has previously been associated with a more severe disease course and earlier cognitive impairment indicating a higher risk for delirium as well.61 This lack of reproducibility might be due to several reasons: Motor subtypes are not well defined and can change during the course of the disease. Their definition is currently discussed and further extended taking into account imaging findings and non-motor symptoms.62 Other than that, rapidly progressing PD patients with mostly akinetic-rigid symptoms and cognitive impairment were not recommended for DBS surgery.
The association between PD-specific gene mutations and POD has to be discussed in the light of the presence of only six patients with GBA mutations in our cohort. However, given the prominent cognitive deficits in GBA mutation carriers with PD, it is remarkable that not a single PD patient with this mutation suffered from POD in our prospective cohort.
Cognitive predictors
Remarkably, the impact of global cognitive impairment on POD as measured by the MoCA and the classic neuropsychological test session didn’t contribute significantly to the model. The reason for this negative finding could be that our cohort was very limited in this regard as dementia is an established exclusion criterion for STN-DBS.
When disentangling specific cognitive deficits indicating a higher risk for POD, the domains attention and motor speed, visual learning and memory were most influential. In contrary to Radziunas et al.,63 impairments of executive functions were not as predictive of POD severity as the domains named above. Theory of mind, an aspect of social cognition as represented by the ERT and Yoni paradigm did not find a significant association with POD severity. Our results of the differentiated cognitive testing are plausible as the domains shown to be particularly predictive of POD severity mainly rely on the cholinergic network with its main nucleus NBM. Impairments in cholinergic circuitry have been shown to predispose for delirium and long-term cognitive decline in general,64,65 and we are the first to show this specific effect for POD after STN-DBS. Our findings underline the importance of detailed domain-specific neuropsychological testing apart from applying cognitive screening tests for risk stratification of POD after STN-DBS. As both, attentional deficits and delirium are mainly of cholinergic nature, it seems logical to draw a connection between them. Nevertheless, there is an obvious lack of data concerning deficits in specific cognitive domains that might be predictive of delirium. A recent metanalysis of Ghezzi et al. (2022) showed impairments of all cognitive domains to be a risk factor for delirium. It is important to note that our PD patients who intended to undergo DBS had no clinically relevant attentional deficits.16
However, some patients had difficulties to solve the extensive test battery. To overcome possible obstacles, we ensured to give participants a break if they felt tired and provided Levodopa if needed.
Imaging predictors
Smaller NBM size was found to be associated with POD severity which is intuitive as this nucleus constitutes the main relay station for cholinergic output to wide areas of the cortex. This finding is however new in the context of POD. To date, smaller NBM volume has retrospectively been related to an unfavorable cognitive outcome one year after STN-DBS in PD.22 Thus, NBM volume seems to be another factor predicting both POD and long-term cognitive decline. The influence of POD on sustained cognitive deterioration after STN-DBS surgery will be further elucidated in the one-year follow-up of our cohort.
Perioperative predictors
Among the characteristics of surgical and anesthesiologic procedures, burst suppression rates and Fentanyl doses applied during electrode implantation had a significant impact on POD severity. This underlines the findings of previous studies that have found that the dose of anesthetics66 and deep sedation are predictors of POD. We conclude that also in DBS surgery, burst suppression should be monitored and prevented where possible. The duration of both surgeries, however, did not have a strong association on the primary outcome. In a retrospective study by Carlson et al.67 in DBS surgery in PD, opiate doses were indeed negatively correlated with POD, so the influence of analgetics on POD remains inconclusive. This ambiguous role of anesthetics may be explained by their desirable analgetic and anxiolytic but also unfavorable sedative and nauseating properties each with different effects on POD.
Strengths and limitations
The main strengths of our study are the comprehensive protocol and prospective design investigating clinical, biochemical, genetic and imaging biomarkers of POD after STN-DBS. The use of a test battery in CANTAB ConnectTM allowed us to characterize preoperative cognition accurately in a standardized and comparable way.
When comparing the univariate and multivariable analysis, the results match well. Especially age, attention and motor speed, short and working memory proved to be highly relevant to both approaches. However, some of the predictors, for instance visual learning, NBM volumes and burst suppression ratios proved to be significant in the univariable analysis but their impact on the multivariable was low. A possible reason for this discrepancy could be the limited number of patients and additional missing values, especially of intraoperative EEG data. Another reason might be that predictors have shown to contribute to delirium severity in the univariate analysis had less strong influences when included in a multivariable predictive model. This illustrates the relevance of the usage of multivariable models also taking into account intercorrelations. This is to our knowledge the first study using machine learning to identify risk factors for POD after STN-DBS in PD patients. Regarding the regularized regression, one has to be aware that collinearity of predictors leads to smaller coefficients. As many of the predictors tested in this study are intercorrelated, this is a potential shortcoming of the modeling approach. Otherwise, this approach allows to discard factors with no considerable impact on the outcome68 and gives the opportunity to make inferences on the multifaceted etiology of POD although limiting the danger of model overfitting.69 The specifications of our multivariable model’s performance are better than chance, however, not indicative of clinically meaningful predictive capacities. Another main limitation is the relatively small number of included patients in comparison to the number of tested predictors. Other reasons might include missing values, for instance of EEG data. Therefore, as a next step, prognostic factors and predictors require validation by international multicenter trials. The results could then be included in the development of a POD prediction tool, which might support personalized and evidence-based assessment of the individual risk of POD. This tool could be implemented into the preoperative evaluation process. Our next study aims at validating the identified POD risk factors.
POD extends length of stay in hospital and on intensive care units.3 We also found this connection in our study. Long term follow-up of POD patients with respect to mortality, level of dependency on care and cognitive decline is needed. As this project is part of a prospective study examining cognitive outcomes following STN-DBS, we hope to answer the question of POD effects on long-term cognition with the results of the main study. The overarching goal is to improve assessment of individual risk factors of the highly effective treatment of STN-DBS in order to guide PD patients to the appropriate therapy with optimal success.
ACKNOWLEDGMENTS
The authors have no acknowledgments to report.
FUNDING
HS and DKW are supported by the BIH-Charité (Digital) Clinician Scientist Program funded by the Charité-Universitätsmedizin Berlin and the Berlin Institute of Health. AAK and DKW are supported by the Deutsche Forschungsgemeinschaft (DFG, German Research Foundation) under Germany's Excellence Strategy EXC-2049 – 390688087 and Project-ID 424778381 – TRR 295. AAK is additionally funded by the Lundbeck Foundation as part of the collaborative project grant “Adaptive and precise targeting of cortex-basal ganglia circuits in Parkinson's Disease” (Grant Nr. R336-2020-1035). SH was supported by the European Research Council (ERC) under the European Union’s Horizon 2020 research and innovation program (Grant agreement No. 758985). MM and SH were further supported by the Einstein Foundation Berlin (award number IPF-2020-599).
CONFLICT OF INTEREST
GHS reports honoraria for lectures by Medtronic, Boston Scientific and Abbott. CS reports public grants from German Research Society, DLR, Einstein Foundation Berlin, G-BA, Inner University Grants, Project Management Agency, Non-Profit Society Promoting Science and Education, European Siciety of Anaesthesiology and Intensive Care, BMWI, Georg Thieme Verlag, Dr. F. Köhler Chemie GmbH, Sintetica GmbH, Max-Planck-Gesellschaft zur Förderung von Wissenschaften e.V., Metronic, Philips Electronics Nederland BV, RKI, BMBF and nonfinancial support from AWMF and Leopoldina. GE reports honoraria from AbbVie Pharma, BIAL Pharma, Desitin Pharma, STADA Pharma, ESTEVE Pharma, Neuraxpharm GmbH, Boehringer GmbH, speakers honorary from AbbVie Pharma, BIAL Pharma, Britannia Pharma, Desitin Pharma, ESTEVE Pharma, Licher GmbH, STADA Pharma, Zambon Pharma and Royalties from Kohlhammer Verlag, Thieme Verlag. AAK reports honoraria and non-financial support from Medtronic, honoraria from Boston Scientific, Ipsen Pharma and Abbott. DKW reports reports honoraria for lectures from BIAL Pharma and STADA Pharma. MA, MM, LMR, HS, SH, FB, JHH, BAF and CF have nothing to disclose.
DATA AVAILABILITY
The data supporting the findings of this study are available within the article and/or its supplementary material.
SUPPLEMENTARY MATERIAL
[1] The supplementary material is available in the electronic version of this article: https://dx.doi.org/10.3233/JPD-230276.
REFERENCES
1. | Armstrong MJ and Okun MS. Diagnosis and treatment of Parkinson disease: a review. JAMA (2020) ; 323: : 548–560. |
2. | Maheshwary A , Mohite D , Omole JA , et al. Is deep brain stimulation associated with detrimental effects on cognitive functions in patients of Parkinson’s disease? A systematic review. Cureus (2020) ; 12: : e9688. |
3. | Aldecoa C , Bettelli G , Bilotta F , et al. European Society of Anaesthesiology evidence-based and consensus-based guideline on postoperative delirium. Eur J Anaesthesiol (2017) ; 34: : 192–214. |
4. | Kunicki ZJ , Ngo LH , Marcantonio ER , et al. Six-year cognitive trajectory in older adults following major surgery and delirium. JAMA Intern Med (2023) ; 183: : 442–450. |
5. | American Psychiatric Association. Diagnostic and Statistical Manual of Mental Disorders, https://cdn.website-editor.net/30f11123991548a0af708722d458e476/files/uploaded/DSM%2520V.pdf (2013, accessed 20.07.2022). |
6. | Lawson RA , McDonald C and Burn DJ. Defining delirium in idiopathic Parkinson’s disease: A systematic review. Parkinsonism Relat Disord (2019) ; 64: : 29–39. |
7. | Green S , Perrott SL , McCleary A , et al. First delirium episode in Parkinson’s disease and parkinsonism: incidence, predictors, and outcomes. NPJ Parkinsons Dis (2021) ; 7: : 92. |
8. | Ebersbach G , Ip CW , Klebe S , et al. Management of delirium in Parkinson’s disease. J Neural Transm (Vienna) (2019) ; 126: : 905–912. |
9. | Vardy ER , Teodorczuk A and Yarnall AJ . Review of delirium in patients with Parkinson’s disease. J Neurol (2015) ; 262: : 2401–2410. |
10. | Serrano-Dueñas M and Bleda MJ. Delirium in Parkinson’s disease patients. a five-year follow-up study. Parkinsonism Relat Disord (2005) ; 11: : 387–392. |
11. | Viderman D , Brotfain E , Bilotta F , et al. Risk factors and mechanisms of postoperative delirium after intracranial neurosurgical procedures. Asian J Anesthesiol (2020) ; 58: : 5–13. |
12. | Li H , Han S and Feng J. Delirium after deep brain stimulation in Parkinson’s disease. Parkinsons Dis (2021) ; 2021: : 8885386. |
13. | Wang S , Greene R , Song Y , et al. Postoperative delirium and its relationship with biomarkers for dementia: a meta-analysis. Int Psychogeriatr (2022) ; 34: : 377–390. |
14. | Fong TG , Vasunilashorn SM , Gou Y , et al. Association of CSF Alzheimer’s disease biomarkers with postoperative delirium in older adults. Alzheimers Dement (N Y) (2021) ; 7: : e12125. |
15. | Collins LM and Williams-Gray CH. The genetic basis of cognitive impairment and dementia in Parkinson’s disease. Front Psychiatry (2016) ; 7: : 89. |
16. | Ghezzi ES , Ross TJ , Sharman R , et al. The neuropsychological profile of delirium vulnerability: A systematic review and meta-analysis. Neurosci Biobehav Rev (2022) ; 132: : 248–259. |
17. | Fritz BA , Kalarickal PL , Maybrier HR , et al. Intraoperative electroencephalogram suppression predicts postoperative delirium. Anesth Analg (2016) ; 122: : 234–242. |
18. | Hesse S , Kreuzer M , Hight D , et al. Association of electroencephalogram trajectories during emergence from anaesthesia with delirium in the postanaesthesia care unit: an early sign of postoperative complications. Br J Anaesth (2019) ; 122: : 622–634. |
19. | Ling YT , Guo QQ , Wang SM , et al. Nomogram for prediction of postoperative delirium after deep brain stimulation of subthalamic nucleus in Parkinson’s disease under general anesthesia. Parkinsons Dis (2022) ; 2022: : 6915627. |
20. | Ray NJ , Bradburn S , Murgatroyd C , et al. In vivo cholinergic basal forebrain atrophy predicts cognitive decline in de novo Parkinson’s disease. Brain (2018) ; 141: : 165–176. |
21. | Schulz J , Pagano G , Fernández Bonfante JA , et al. Nucleus basalis of Meynert degeneration precedes and predicts cognitive impairment in Parkinson’s disease. Brain (2018) ; 141: : 1501–1516. |
22. | Kübler D , Wellmann SK , Kaminski J , et al. Nucleus basalis of Meynert predicts cognition after deep brain stimulation in Parkinson’s disease. Parkinsonism Relat Disord (2022) ; 94: : 89–95. |
23. | Moons K , Altman D , Reitsma J , et al. Transparent Reporting of a multivariable prediction model for Individual Prognosis Or Diagnosis (TRIPOD): Explanation and elaboration. Ann Intern Med (2015) ; 162: : W1–W73. |
24. | Lütz A , Radtke FM , Franck M , et al. The nursing delirium screening scale (NU-DESC). Anasthesiol Intensivmed Notfallmed Schmerzther (2008) ; 43: : 98–102. |
25. | Ely EW , Margolin R , Francis J , et al. Evaluation of delirium in critically ill patients: validation of the Confusion Assessment Method for the Intensive Care Unit (CAM-ICU). Crit Care Med (2001) ; 29: : 1370–1379. |
26. | Inouye SK , van Dyck CH , Alessi CA , et al. Clarifying confusion: the confusion assessment method. A new method for detection of delirium. Ann Intern Med (1990) ; 113: : 941–948. |
27. | Gaudreau JD , Gagnon P , Harel F , et al. Impact on delirium detection of using a sensitive instrument integrated into clinical practice. Gen Hosp Psychiatry (2005) ; 27: : 194–199. |
28. | Guigoz Y . The Mini Nutritional Assessment (MNA) review of the literature–What does it tell us? J Nutr Health Aging (2006) ; 10: : 466–485; discussion 485-467. |
29. | Charlson ME , Pompei P , Ales KL , et al. A new method of classifying prognostic comorbidity in longitudinal studies: development and validation. J Chronic Dis (1987) ; 40: : 373–383. |
30. | Bain PG , Findley LJ , Atchison P , et al. Assessing tremor severity. J Neurol Neurosurg Psychiatry (1993) ; 56: : 868–873. |
31. | Benkert P , Meier S , Schaedelin S , et al. Serum neurofilament light chain for individual prognostication of disease activity in people with multiple sclerosis: a retrospective modelling and validation study. Lancet Neurol (2022) ; 21: : 246–257. |
32. | Tomlinson CL , Stowe R , Patel S , et al. Systematic review of levodopa dose equivalency reporting in Parkinson’s disease. Mov Disord (2010) ; 25: : 2649–2653. |
33. | Peto V , Jenkinson C , Fitzpatrick R , et al. The development and validation of a short measure of functioning and well being for individuals with Parkinson’s disease. Qual Life Res (1995) ; 4: : 241–248. |
34. | Beck AT , Steer RA and Brown GK. Beck depression inventory: Manual: BDI-II, https://www.testzentrale.de/shop/beck-depressions-inventar.html (2006, accessed 20.07.2022). |
35. | Starkstein SE , Mayberg HS , Preziosi TJ , et al. Reliability, validity, and clinical correlates of apathy in Parkinson’s disease. J Neuropsychiatry Clin Neurosci (1992) ; 4: : 134–139. |
36. | Weintraub D , Mamikonyan E , Papay K , et al. Questionnaire for impulsive-compulsive disorders in Parkinson’s disease-rating scale. Mov Disord (2012) ; 27: : 242–247. |
37. | Nasreddine ZS , Phillips NA , Bédirian V , et al. The montreal cognitive assessment, MoCA: a brief screening tool for mild cognitive impairment. J Am Geriatr Soc (2005) ; 53: : 695–699. |
38. | Cambridge Cognition. CANTAB® [Cognitive assessment software] All rights reserved., www.cantab.com (2022, accessed 22.07.2022). |
39. | Bodden ME , Kubler D , Knake S , et al. Comparing the neural correlates of affective and cognitive theory of mind using fMRI: Involvement of the basal ganglia in affective theory of mind. Adv Cogn Psychol (2013) ; 9: : 32–43. |
40. | Zaborszky L , Hoemke L , Mohlberg H , et al. Stereotaxic probabilistic maps of the magnocellular cell groups in human basal forebrain. Neuroimage (2008) ; 42: : 1127–1141. |
41. | Pedregosa F , Varoquaux G , Gramfort A , et al. Scikit-learn: Machine learning in Python. J Mach Learn Res (2011) ; 12: : 2825–2830. |
42. | Zou H and Hastie T. Regularization and variable selection via the elastic net. J R Stat Soc Series B Stat Methodol (2005) ; 67: (2), 301–320. |
43. | Babyak MA . What you see may not be what you get: a brief, nontechnical introduction to overfitting in regression-type models. Psychosom Med (2004) ; 66: : 411–421. |
44. | Troyanskaya O , Cantor M , Sherlock G , et al. Missing value estimation methods for DNA microarrays. Bioinformatics (2001) ; 17: : 520–525. |
45. | Barnes-Daly MA , Phillips G and Ely EW. Improving hospital survival and reducing brain dysfunction at Seven California Community Hospitals: implementing PAD guidelines via the ABCDEF bundle in 6,064 patients. Crit Care Med (2017) ; 45: : 171–178. |
46. | Janssen TL , Alberts AR , Hooft L , et al. Prevention of postoperative delirium in elderly patients planned for elective surgery: systematic review and meta-analysis. Clin Interv Aging (2019) ; 14: : 1095–1117. |
47. | Tanaka M , Tani N , Maruo T , et al. Risk factors for postoperative delirium after deep brain stimulation surgery for Parkinson disease. World Neurosurg (2018) ; 114: : e518–e523. |
48. | Deutsche Gesellschaft für Neurologie (DGN). Delir und Verwirrtheitszustände inklusive Alkoholentzugsdelir, S1-Leitlinie, www.dgn.org/leitlinien (2020, accessed 20.07.2022). |
49. | Cullinan RJ , Richardson SJ , Yarnall AJ , et al. Documentation and diagnosis of delirium in Parkinson’s disease. Acta Psychiatr Scand (2023) ; 147: : 527–535. |
50. | Kim S , Choi E , Jung Y , et al. Postoperative delirium screening tools for post-anaesthetic adult patients in non-intensive care units: A systematic review and meta-analysis. J Clin Nurs (2023) ; 32: : 1691–1704. |
51. | Jones RN , Cizginer S , Pavlech L , et al. Assessment of instruments for measurement of delirium severity: a systematic review. JAMA Intern Med (2019) ; 179: : 231–239. |
52. | Siddiqi N , Harrison JK , Clegg A , et al. Interventions for preventing delirium in hospitalised non-ICU patients. Cochrane Database Syst Rev (2016) ; 3: : CD005563. |
53. | Paim Strapasson AC , Martins Antunes ÁC , Petry Oppitz P , et al. Postoperative confusion in patients with Parkinson disease undergoing deep brain stimulation of the subthalamic nucleus. World Neurosurg (2019) ; 125: : e966–e971. |
54. | Pilitsis JG , Rezai AR , Boulis NM , et al. A preliminary study of transient confusional states following bilateral subthalamic stimulation for Parkinson’s disease. Stereotact Funct Neurosurg (2005) ; 83: : 67–70. |
55. | Vasunilashorn SM , Dillon ST , Inouye SK , et al. High C-reactive protein predicts delirium incidence, duration, and feature severity after major noncardiac surgery. J Am Geriatr Soc (2017) ; 65: : e109–e116. |
56. | Aamodt WW , Waligorska T , Shen J , et al. Neurofilament light chain as a biomarker for cognitive decline in Parkinson disease. Mov Disord (2021) ; 36: : 2945–2950. |
57. | Schrag A , Siddiqui UF , Anastasiou Z , et al. Clinical variables and biomarkers in prediction of cognitive impairment in patients with newly diagnosed Parkinson’s disease: a cohort study. Lancet Neurol (2017) ; 16: : 66–75. |
58. | Zhan L , Wang XQ and Zhang LX. Nomogram model for predicting risk of postoperative delirium after deep brain stimulation surgery in patients older than 50 years with Parkinson disease. World Neurosurg (2020) ; 139: : e127–e135. |
59. | Qi YM , Li YJ , Zou JH , et al. Risk factors for postoperative delirium in geriatric patients with hip fracture: A systematic review and meta-analysis. Front Aging Neurosci (2022) ; 14: : 960364. |
60. | Lauretani F , Ceda GP , Maggio M , et al. Capturing side-effect of medication to identify persons at risk of delirium. Aging Clin Exp Res (2010) ; 22: : 456–458. |
61. | Abboud H , Genc G , Saad S , et al. Factors associated with postoperative confusion and prolonged hospital stay following deep brain stimulation surgery for Parkinson disease. Neurosurgery (2020) ; 86: : 524–529. |
62. | Fereshtehnejad SM , Romenets SR , Anang JB , et al. New clinical subtypes of Parkinson disease and their longitudinal progression: a prospective cohort comparison with other phenotypes. JAMA Neurol (2015) ; 72: : 863–873. |
63. | Radziunas A , Deltuva VP , Tamasauskas A , et al. Neuropsychiatric complications and neuroimaging characteristics after deep brain stimulation surgery for Parkinson’s disease. Brain Imaging Behav (2020) ; 14: : 62–71. |
64. | Gratwicke J , Jahanshahi M and Foltynie T. Parkinson’s disease dementia: a neural networks perspective. Brain (2015) ; 138: : 1454–1476. |
65. | Kehagia AA , Barker RA and Robbins TW. Cognitive impairment in Parkinson’s disease: the dual syndrome hypothesis. Neurodegener Dis (2013) ; 11: : 79–92. |
66. | Chen H , Jiang H , Chen B , et al. The incidence and predictors of postoperative delirium after brain tumor resection in adults: a cross-sectional survey. World Neurosurg (2020) ; 140: : e129–e139. |
67. | Carlson JD , Neumiller JJ , Swain LD , et al. Postoperative delirium in Parkinson’s disease patients following deep brain stimulation surgery. J Clin Neurosci (2014) ; 21: : 1192–1195. |
68. | Stuke H , Priebe K , Weilnhammer VA , et al. Sparse models for predicting psychosocial impairments in patients with PTSD: An empirical Bayes approach. Psychol Trauma (2023) ; 15: : 80–87. |
69. | Brandt L , Ritter K , Schneider-Thoma J , et al. Predicting psychotic relapse following randomised discontinuation of paliperidone in individuals with schizophrenia or schizoaffective disorder: an individual participant data analysis. Lancet Psychiatry (2023) ; 10: : 184–196. |


