
Transcriptome Analysis Reveals a Two-Gene Signature Links to Motor Progression and Alterations of Immune Cells in Parkinson’s Disease
Abstract
Background:
The motor impairment in Parkinson’s disease (PD) can be managed but effective treatments for stopping or slowing the disease process are lacking. The advent of transcriptomics studies in PD shed light on the development of promising measures to predict disease progression and discover novel therapeutic strategies.
Objective:
To reveal the potential role of transcripts in the motor impairment progression of patients with PD via transcriptome analysis.
Methods:
We separately analyzed the differentially expressed genes (DEGs) between PD cases and healthy controls in two cohorts using whole blood bulk transcriptome data. Based on the intersection of DEGs, we established a prognostic signature by regularized regression and Cox proportional hazards analysis. We further performed immune cell analysis and single-cell RNA sequencing analysis to study the biological features of this signature.
Results:
We identified a two-gene-based prognostic signature that links to PD motor progression and the two-gene signature-derived risk score was associated with several types of immune cells in blood. Notably, the fraction of neutrophils increased 5% and CD4+ T cells decreased 7% in patients with high-risk scores compared to that in patients with low-risk scores, suggesting these two types of immune cells might play key roles in the prognosis of PD. We also observed the downregulated genes in PD patients with high-risk scores that enriched in PD-associated pathways from iPSC-derived dopaminergic neurons single-cell RNA sequencing analysis.
Conclusion:
We identified a two-gene signature linked to the motor progression in PD, which provides new insights into the motor prognosis of PD.
INTRODUCTION
Parkinson’s disease (PD) is the most common neurodegenerative movement disorder that presents with motor and non-motor clinical manifestations [1]. Hallmark pathological changes of PD include the progressive loss of nigral dopamine neurons and the accumulation of α-synuclein containing inclusions called Lewy bodies [2]. To date, lack of effective treatments that can slow the disease process, it is crucial to identify promising measures predictive of PD progression to advance disease management and therapeutics developments [3, 4]. Previous studies have identified various predictive factors for PD motor progression, including age [5], sex [6], blood pressure [7], cerebrospinal fluid (CSF) biomarkers [6], apolipoprotein E (APOE) ɛ4 [8], and neurofilament light chain (NfL) levels in the blood [9]. The advent of omics big data in PD longitudinal studies provides us opportunities to uncover novel progression biomarkers and new measures to predict motor impairment.
Many transcriptomics studies have indicated the change in RNA abundance correlates with neurological disease phenotypes [10, 11] and blood transcriptome analysis is a powerful and low-invasive approach to identifying diagnostic or prognostic predictors in PD [12–14]. Based on the Parkinson’s Progression Marker Initiative (PPMI) cohort data [3], Kern et al. [13] have reported dysregulated microRNAs in the blood are associated with PD. In another blood-based transcriptomics study from GENomic Biomarkers for PARKinson’s Disease (GENEPARK consortium), Shamir et al. [14] uncovered a signature of 87 genes that can discriminate patients with idiopathic PD (iPD) from healthy controls. These transcriptomics studies are primarily focused on gene expression in case-control comparison [11], and exploring the role of transcripts in the progression of motor impairment in patients with PD is urgently needed.
In this study, we presented whole blood gene expression profiles from the PPMI and GENEPARK cohorts that generated a prognostic signature of two genes (LILRB3, LRRN3), which was successfully applied to predict the motor progression (progression to Hoehn and Yahr (H&Y) stage 3) in patients with PD. Further analyses indicated that the two-gene signature-derived risk score was associated with specific immune cells in the blood, including increased neutrophils and decreased CD4+ T cells in PD patients with high-risk scores. We replicated relevant findings for the two-gene signature in an independent cohort from the Parkinson’s Disease Biomarkers Program (PDBP) [15]. Additionally, we observed significant expression alterations of genes enriched in PD-associated pathways in the high-risk score PD patients’ iPSC-derived dopaminergic neurons (DaNs) by single-cell RNA sequencing (scRNA-seq) analysis.
MATERIALS AND METHODS
Data collection
Longitudinally clinical records and bulk RNA sequencing (RNA-seq) data (counts and transcripts per million (TPM) matrix data) of two cohorts used in this study were obtained through the Accelerating Medicine Partnership in Parkinson’s Disease (AMP PD, https://amp-pd.org/). The Parkinson’s Progression Marker Initiative (PPMI) cohort [16] (594 healthy controls and 691 PD patients) was used as the discovery cohort and the PDBP cohort [15] (458 healthy controls and 702 PD patients) for external replication. In the PPMI cohort, 691 PD patients include 166 Genetic Registry PD, 158 Genetic Cohort PD, and 367 PD; 594 healthy controls include 203 Genetic Registry Unaffected Healthy Control, 215 Genetic Cohort Unaffected Healthy Control, and 176 Healthy Control (the definition method was mentioned in previous literature [17, 18]). Another whole blood gene expression dataset (GSE99039) [14] consisting of 233 healthy controls and 205 PD patients from the GENomic Biomarkers for PARKinson’s Disease (GENEPARK) cohort was downloaded from the Gene Expression Omnibus (GEO) database [19] (https://www.ncbi.nlm.nih.gov/geo). In addition, one single-cell sequencing (scRNA-seq) dataset of iPSC-derived dopaminergic neurons on day 65 including six healthy controls and twelve PD patients was attained from the PPMI data repository [16] (https://www.ppmi-info.org/). The demographic and clinical characteristics of these participants are presented in Supplementary Table 1.
Differential gene expression and prediction models analyses
To identify the differentially expressed genes (DEGs) between patients with PD and healthy controls in the PPMI and GENEPARK (GSE99039 dataset) cohorts, we used the limma [20] v3.42.2 R package with the voom method to analyze raw counts as previously described [17], adjusting by covariates of age at baseline, sex, and available RNA integrity number (RIN). Genes with an adjusted p < 0.05 (p values adjusted by the Benjamini-Hochberg method) and absolute log2 (fold change) > 0.1 were considered to be differentially expressed.
Three regularized regression models (ElasticNet, Lasso, and Ridge regression) were built using the glmnet [21] v4.1-1 R package to discriminate case/control status based on differential gene expression analysis results. According to the previous method [22], the penalty parameter lambda (λ) was evaluated with tenfold cross-validation on the discovery dataset using the caret [23] v6.0–90 R package, and set to lambda.min. The models fitted to the PPMI cohort were applied to the replication dataset (PDBP cohort data) using the “predict” function. We used the area under the curve (AUC) of the receiver operating characteristic curve (ROC) to assess the precision of the models, which was implemented by the pROC [24] v1.17.0.1 R package.
Prognostic signature construction
Hoehn and Yahr (H&Y) scale is a simple staging assessment that estimates the overall severity of PD based on bilateral motor involvement and the compromise of gait and balance [25]. Previous studies used the transition from baseline H&Y stage 1 or stage 2 to the endpoint of motor disability with balance deficits (H&Y stage 3) as the index of motor progression in PD [4, 26]. The H&Y stage used in this study was the modified H&Y and patients were assessed during the off period. To develop a prognostic gene signature, we excluded PD patients who had reached H&Y stage 3 at baseline, and patients with less than three visits or missing clinical measurements (such as age at visit, sex, years of education, and the duration of disease) in both PPMI and PDBP cohorts. A total of 438 patients in PPMI and 250 patients in PDBP were kept. We assigned patients from the PPMI and PDBP to the discovery and replication cohorts, respectively, for two reasons. Firstly, patients in PPMI are de novo within one year of diagnosis (temporally close to diagnosis and pre-treatment) and confirmed by DatScan, while PDBP recruits those within 5 years of receiving a diagnosis regardless of medication status and without DatScan confirmation [17]. Secondly, after excluding right censor events in the Cox regression model, more patients in the PPMI cohort make the trained model more robust.
In the discovery cohort, we adopted the univariate Cox proportional hazards model to assess the association between 257 DEGs and the time to reach H&Y stage 3. Only 22 genes with a p < 0.05 were considered to be potential prognostic genes. The glmnet [21] v4.1-1 R package was then employed to perform the Least Absolute Shrinkage and Selector Operation (LASSO) analysis for variable selection and to minimize the risk of overfitting. We used the optimal penalty parameter lambda (λ) determined by tenfold cross-validation using minimum criteria to identify the most potential genes affecting patients’ prognosis. Subsequently, a multivariate Cox regression analysis was performed using the survival [27] v3.2-13 R package to construct the gene signature for predicting the disease progression and adjusting for the covariates of age, sex, years of education, and the duration of disease.
Based on the signature, the risk score of each patient was calculated as the following formula:
Biological and functional analysis of DEGs
Gene ontology (GO) analysis was conducted to insight into biological features of the DEGs using the ClusterProfiler [28] v3.18.1 R package. Only terms with an adjusted p < 0.05 were considered significantly enriched. Gene set enrichment analysis (GSEA) was further performed to identify significantly correlated gene sets with the threshold set at adjusted p < 0.05 and |NES| > 1. The gene set “c2.cp.kegg.v7.1.symbols.gmt” downloaded from the Molecular Signatures Database (https://www.gsea-msigdb.org/gsea/msigdb/) was chosen as the reference gene set. Furthermore, to identify the source of DEGs at the cell type level from bulk RNA-seq data, we employed the LRcell [29] v1.2.0 R package, a complementary tool to cell type deconvolution, with the linear regression method and pre-embedded marker genes from peripheral blood mononuclear cell (PBMC) [30]. Results with false discovery rate (FDR) < 0.05 were considered reliable.
Estimation of the fraction of immune cell types from bulk RNA-seq data
We used the CIBERSORT [31] algorithm to estimate the fraction of 22 types of immune cells based on bulk RNA-seq data. These 22 immune cell types were then reclassified into 12 major cell types according to the previous literature [32]. To identify the relationship between 12 major cell types and the two-gene signature, we employed the “cor.test” function in R to conduct Pearson’s correlation analysis. All tests with adjusted p < 0.05 and Pearson coefficient ≥ 0.2 were considered significantly associated. We used the multivariable linear regression analysis to test the differences of immune cells distributed among healthy controls, patients in the high- and low-risk score groups adjusted by covariates of age, sex, and the duration of disease, and the “ci.mean” function in the Publish v.2020.12.23 R package to calculate the percentage of change. The Benjamini-Hochberg method was performed for multiple testing and adjusted p < 0.05 were considered significant.
Single-cell RNA sequencing data analysis
The filtered unique molecular identifier (UMI) feature-barcode counts for six healthy controls, six PD patients with high-risk scores, and six PD patients with low-risk scores were processed with the Seurat [33] v4.1.0 R package. In the quality control process, we set the following criteria [34] for each cell of all PD patients and healthy controls: the number of genes between 1,000 and 9,000; the number of UMIs > 2,000 and mitochondrial gene percentage < 20%. After filtering, a gene UMI counts matrix was integrated with the “SCTransform” function in Seurat to remove batch effects across different samples. The uniform manifold approximation and projection [35] (UMAP) was performed on the top 30 principal components and 0.5 resolution for visualizing cells. Thereafter, to compare the differential expression in different clusters or conditions, we used the “FindAllMarkers” function (MAST [36] method) with default parameters. Genes with an adjusted p < 0.05 (p values adjusted by false discovery rate) and absolute log2 (fold change) > 0.25 were considered to be differentially expressed.
Statistical analysis
The R v4.0.3 (https://www.R-project.org) was used for all statistical analyses. To compare clinical characteristics between patients with PD and healthy controls, we used the Mann-Whitney test for continuous variables and the Chi-Square (χ2) test for categorical variables. p values referred to in this study were further adjusted using the Benjamini-Hochberg method to control the false discovery rate (FDR), and adjusted p < 0.05 were considered significant unless stated otherwise.
RESULTS
Comparison of whole blood gene expression profiles between PD and healthy controls
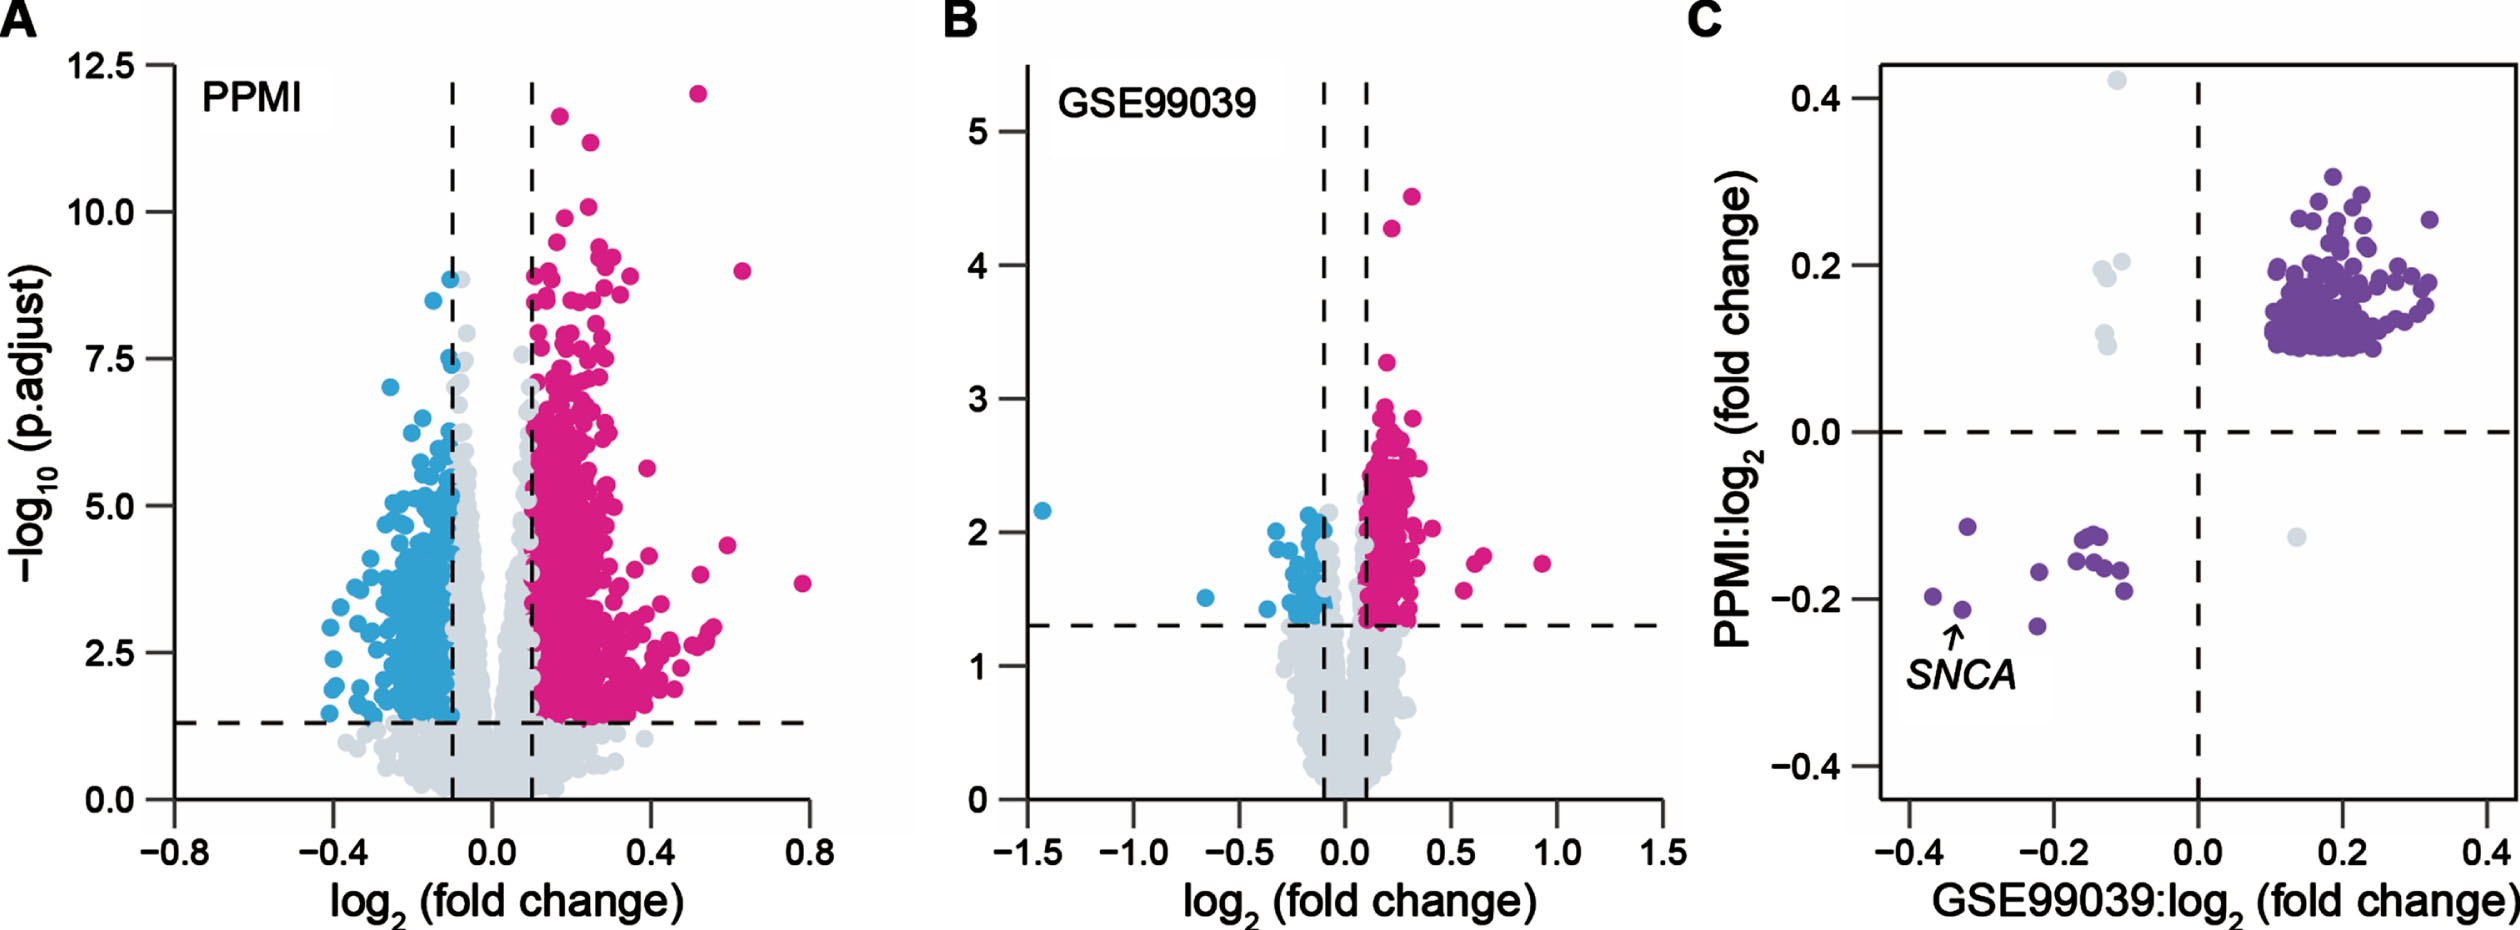
The flowchart of this study is shown in Supplementary Figure 1. To identify the DEGs between patients with PD and healthy controls (HC) in the blood, one whole blood bulk RNA-seq dataset (PPMI cohort) and one whole blood microarray dataset (GENEPARK cohort: GSE99039 dataset) were separately analyzed. We observed 2,432 DEGs in the PPMI cohort and 969 DEGs in the GSE99039 dataset, respectively (Fig. 1A, B). A total of 257 overlapping DEGs with the concordant direction of expression change in both cohorts remained for subsequent analysis, of which 243 genes were upregulated and 14 genes were downregulated in PD cases, including a known PD risk gene SNCA [37] (Fig. 1C).
Fig. 1
Identification of blood-based differentially expressed genes between PD patients and health controls. Volcano plots presented the differentially expressed genes (DEGs) between patients with Parkinson’s disease (PD) and healthy controls (HC) in the PPMI cohort (691 PD, 594 HC) (A) and the GENEPARK cohort (GSE99039 dataset: 203 PD, 233 HC) (B). Magenta dots represented significantly upregulated DEGs and cyan dots represented downregulated DEGs. The p values were adjusted by the Benjamini-Hochberg method. (C) Scatter-plot showed the value of log2 (fold change) of the overlapped DEGs in the PPMI and GENEPARK cohorts.
To further investigate the diagnostic potentiality of 257 DEGs, we built three regularized regression models based on the PPMI cohort, and the parameters from the trained models were applied to the PDBP cohort to evaluate their performance. In the PPMI cohort, the ridge regression model including all DEGs had the best classification accuracy (AUC: 0.81, 95% CI: 0.79–0.84) compared to the other models (Supplementary Figure 2A), but only achieved an AUC of 0.69 (95% CI: 0.66–0.72) in the PDBP cohort (Supplementary Figure 2B). Overall, these results indicated DEGs, as potential biomarkers, can moderately discriminate between patients with PD and healthy controls.
Identification of a two-gene-based prognostic signature in PD
We next explored the relationship between the DEGs and the motor impairment (progression to H&Y stage 3 balance deficits) in patients with PD and carried out a univariate Cox regression analysis for each of these 257 DEGs in the PPMI cohort. There were 22 genes (nominal p < 0.05) that weresignificantly associated with the prognosis of patients with PD. Then, the LASSO Cox regression analysis was performed for further shrinkage and selection, and we found that Leukocyte Immunoglobulin Like Receptor B3 (LILRB3) and Leucine Rich Repeat Neuronal 3 (LRRN3) were the most valuable genes with prognostic power (Supplementary Figure 3A, B). Based on the expression levels and regression coefficients of LILRB3 and LRRN3 (Supplementary Table 2), we calculated a risk score for each patient, and patients were classified into high- or low-risk groups according to the optimal cutoff value of risk scores (Methods, Supplementary Figure 3C). The Cox proportional hazards analysis suggested that patients with PD in the high-risk score group had a more severe motor disability than those in the low-risk score group during study (HR = 3.51, 95% CI 3.17–5.68, p = 3.38×10⁻⁷, Fig. 2A). We observed the risk score prior to year three since the study resulted in the highest time-dependent AUC of 0.78 (95% CI 0.71–0.87, Supplementary Figure 4A, B). We next compared longitudinal MDS-UPDRS Part III scores of patients in the high- and low-risk score groups using a linear mixed effects model (Supplementary Methods) in the PPMI cohort. We did not observe a significant difference in the baseline MDS-UPDRS Part III scores between these two groups (p = 0.24, Supplementary Figure 5A), but patients in the high-risk score group had a rapid progression of motor disability over time compared to those in the low-risk score group (β= 0.97, p = 0.002, Supplementary Figure 5B).
Fig. 2
Survival analysis to evaluate the predictive ability of the two-gene signature for the motor progression in PD. Cox-adjusted survival curves for patients in the high- and low-risk score groups from the PPMI cohort (A) and PDBP cohort (B) with a cutoff risk score of 1.46. HY3, Hoehn and Yahr stage 3.
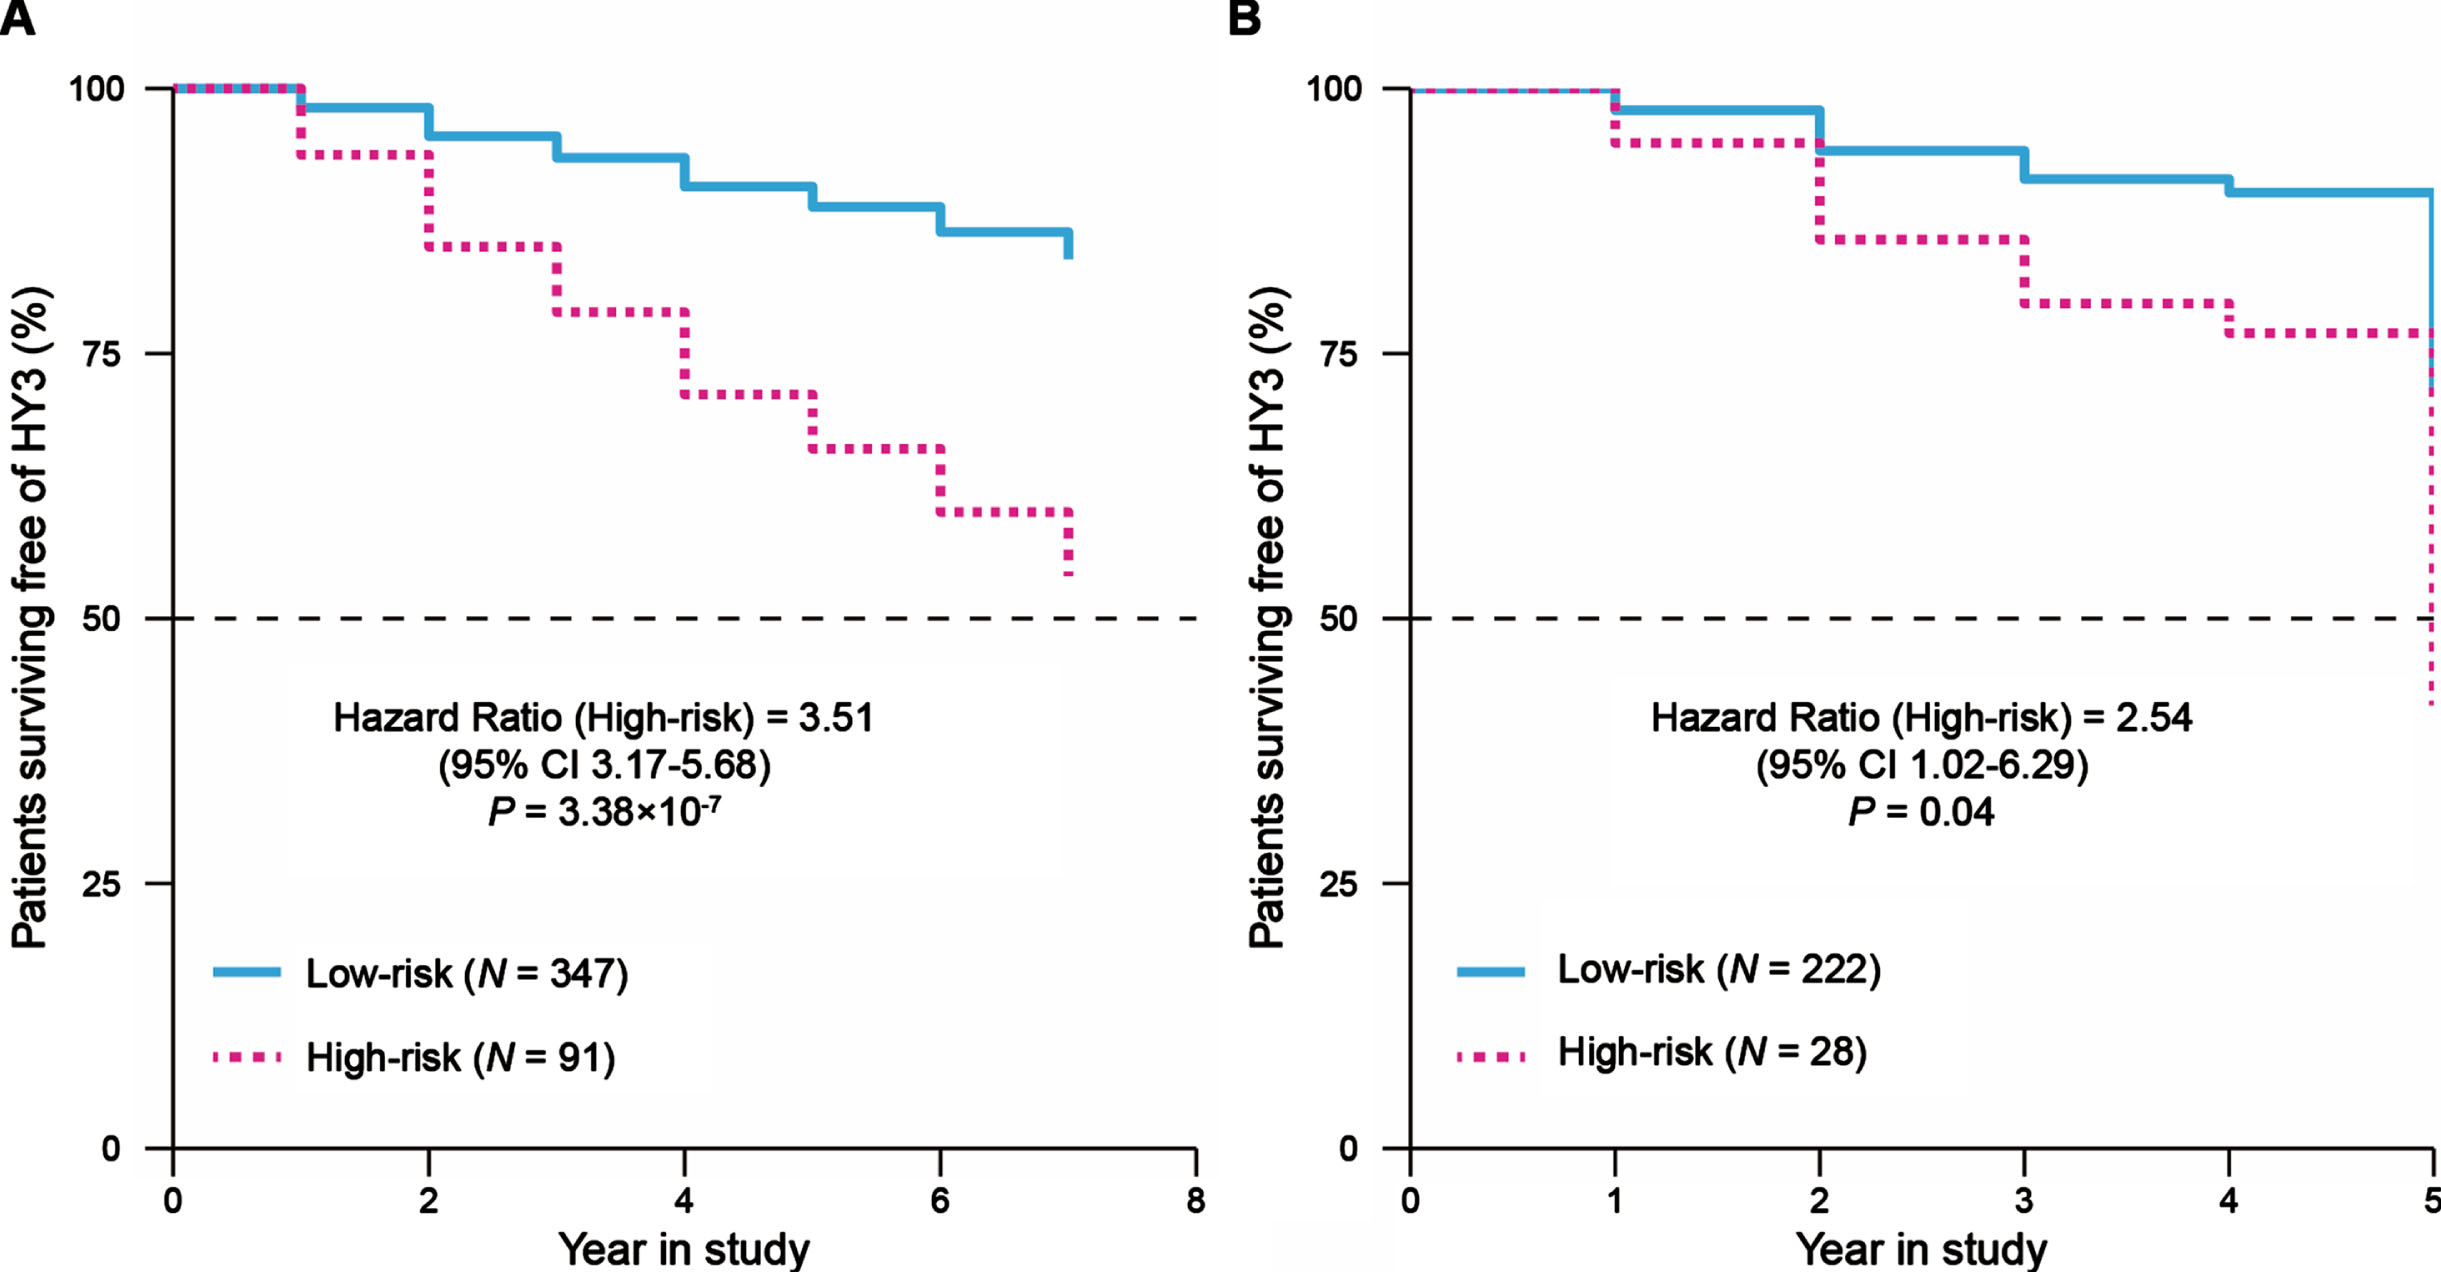
We evaluated the prognostic power of this two-gene signature in the replication cohort. For each patient, the risk score was calculated using the formula and coefficients identified with the PPMI cohort, and patients were classified into high- or low-risk score groups. The pattern of survival curves for the PDBP cohort was similar to that in the PPMI cohort, where the high-risk score group had a faster progression to H&Y stage 3 than the low-risk score group (HR = 2.54, 95% CI 1.02–6.29, p = 0.04, Fig. 2B) and the risk score prior to year three had a time-dependent AUC of 0.73 (95% CI 0.64–0.84, Supplementary Figure 4C, D). These results suggested that the two-gene signature has a robust potential to predict the motor prognosis of PD.
The PD prognostic two-gene signature links to specific types of immune cells in peripheral blood
To further explore the underlying mechanism of the two-gene signature in PD progression, we performed differential gene expression analysis between the high- and low-risk score groups at baseline. A total of 2,228 DEGs (adjusted p < 0.05, |log2 (fold change)| > 0.5) were identified in the PPMI cohort, including 1,781 up- and 447 downregulated genes. The GO analysis revealed that neutrophil activation involved in immune response genes and neutrophil degranulation genes were significantly upregulated in patients with high-risk scores (Supplementary Figure 6A). Conversely, downregulated genes were implicated in protein translation and ribosome-related terms (Supplementary Figure 6B). Additionally, we found that CD14+ and CD16+ monocytes could be the DEGs-driving cell types (Fig. 3A).
Fig.3
The relationship between the PD prognostic two-gene signature and immune cells in blood. (A) LRcell result of mapping the differentially expressed genes between the high- (N = 347) and low-risk (N = 91) score groups to human peripheral blood mononuclear cell (PBMC). CD14+ monocyte is the most significant cell type. The x-axis represents various cell types. Inset: Volcano plot indicated the DEGs between the high- and low-risk score groups. Magenta dots represented significantly upregulated DEGs and cyan dots represented downregulated DEGs. (B) Correlation between the fraction of neutrophils estimated from bulk RNA-seq data and the available clinical cell count data from 1,130 participants. (C) Correlations between the risk scores and 12 major immune cell fractions from 438 patients with PD. Negative correlation was marked with cyan and positive correlation with magenta. (D) Differences of the 12 major types of immune cells among healthy controls (N = 594), PD patients with low-risk scores (N = 347), and PD patients with high-risk scores (N = 91). The upper and lower ends of the boxes represented interquartile range of values. The lines in the boxes represented median value. For (C) and (D) the asterisks represented the statistical p value (*p < 0.05, **p < 0.01, ***p < 0.001, n.s. not significant). The p values were adjusted by the Benjamini-Hochberg method.
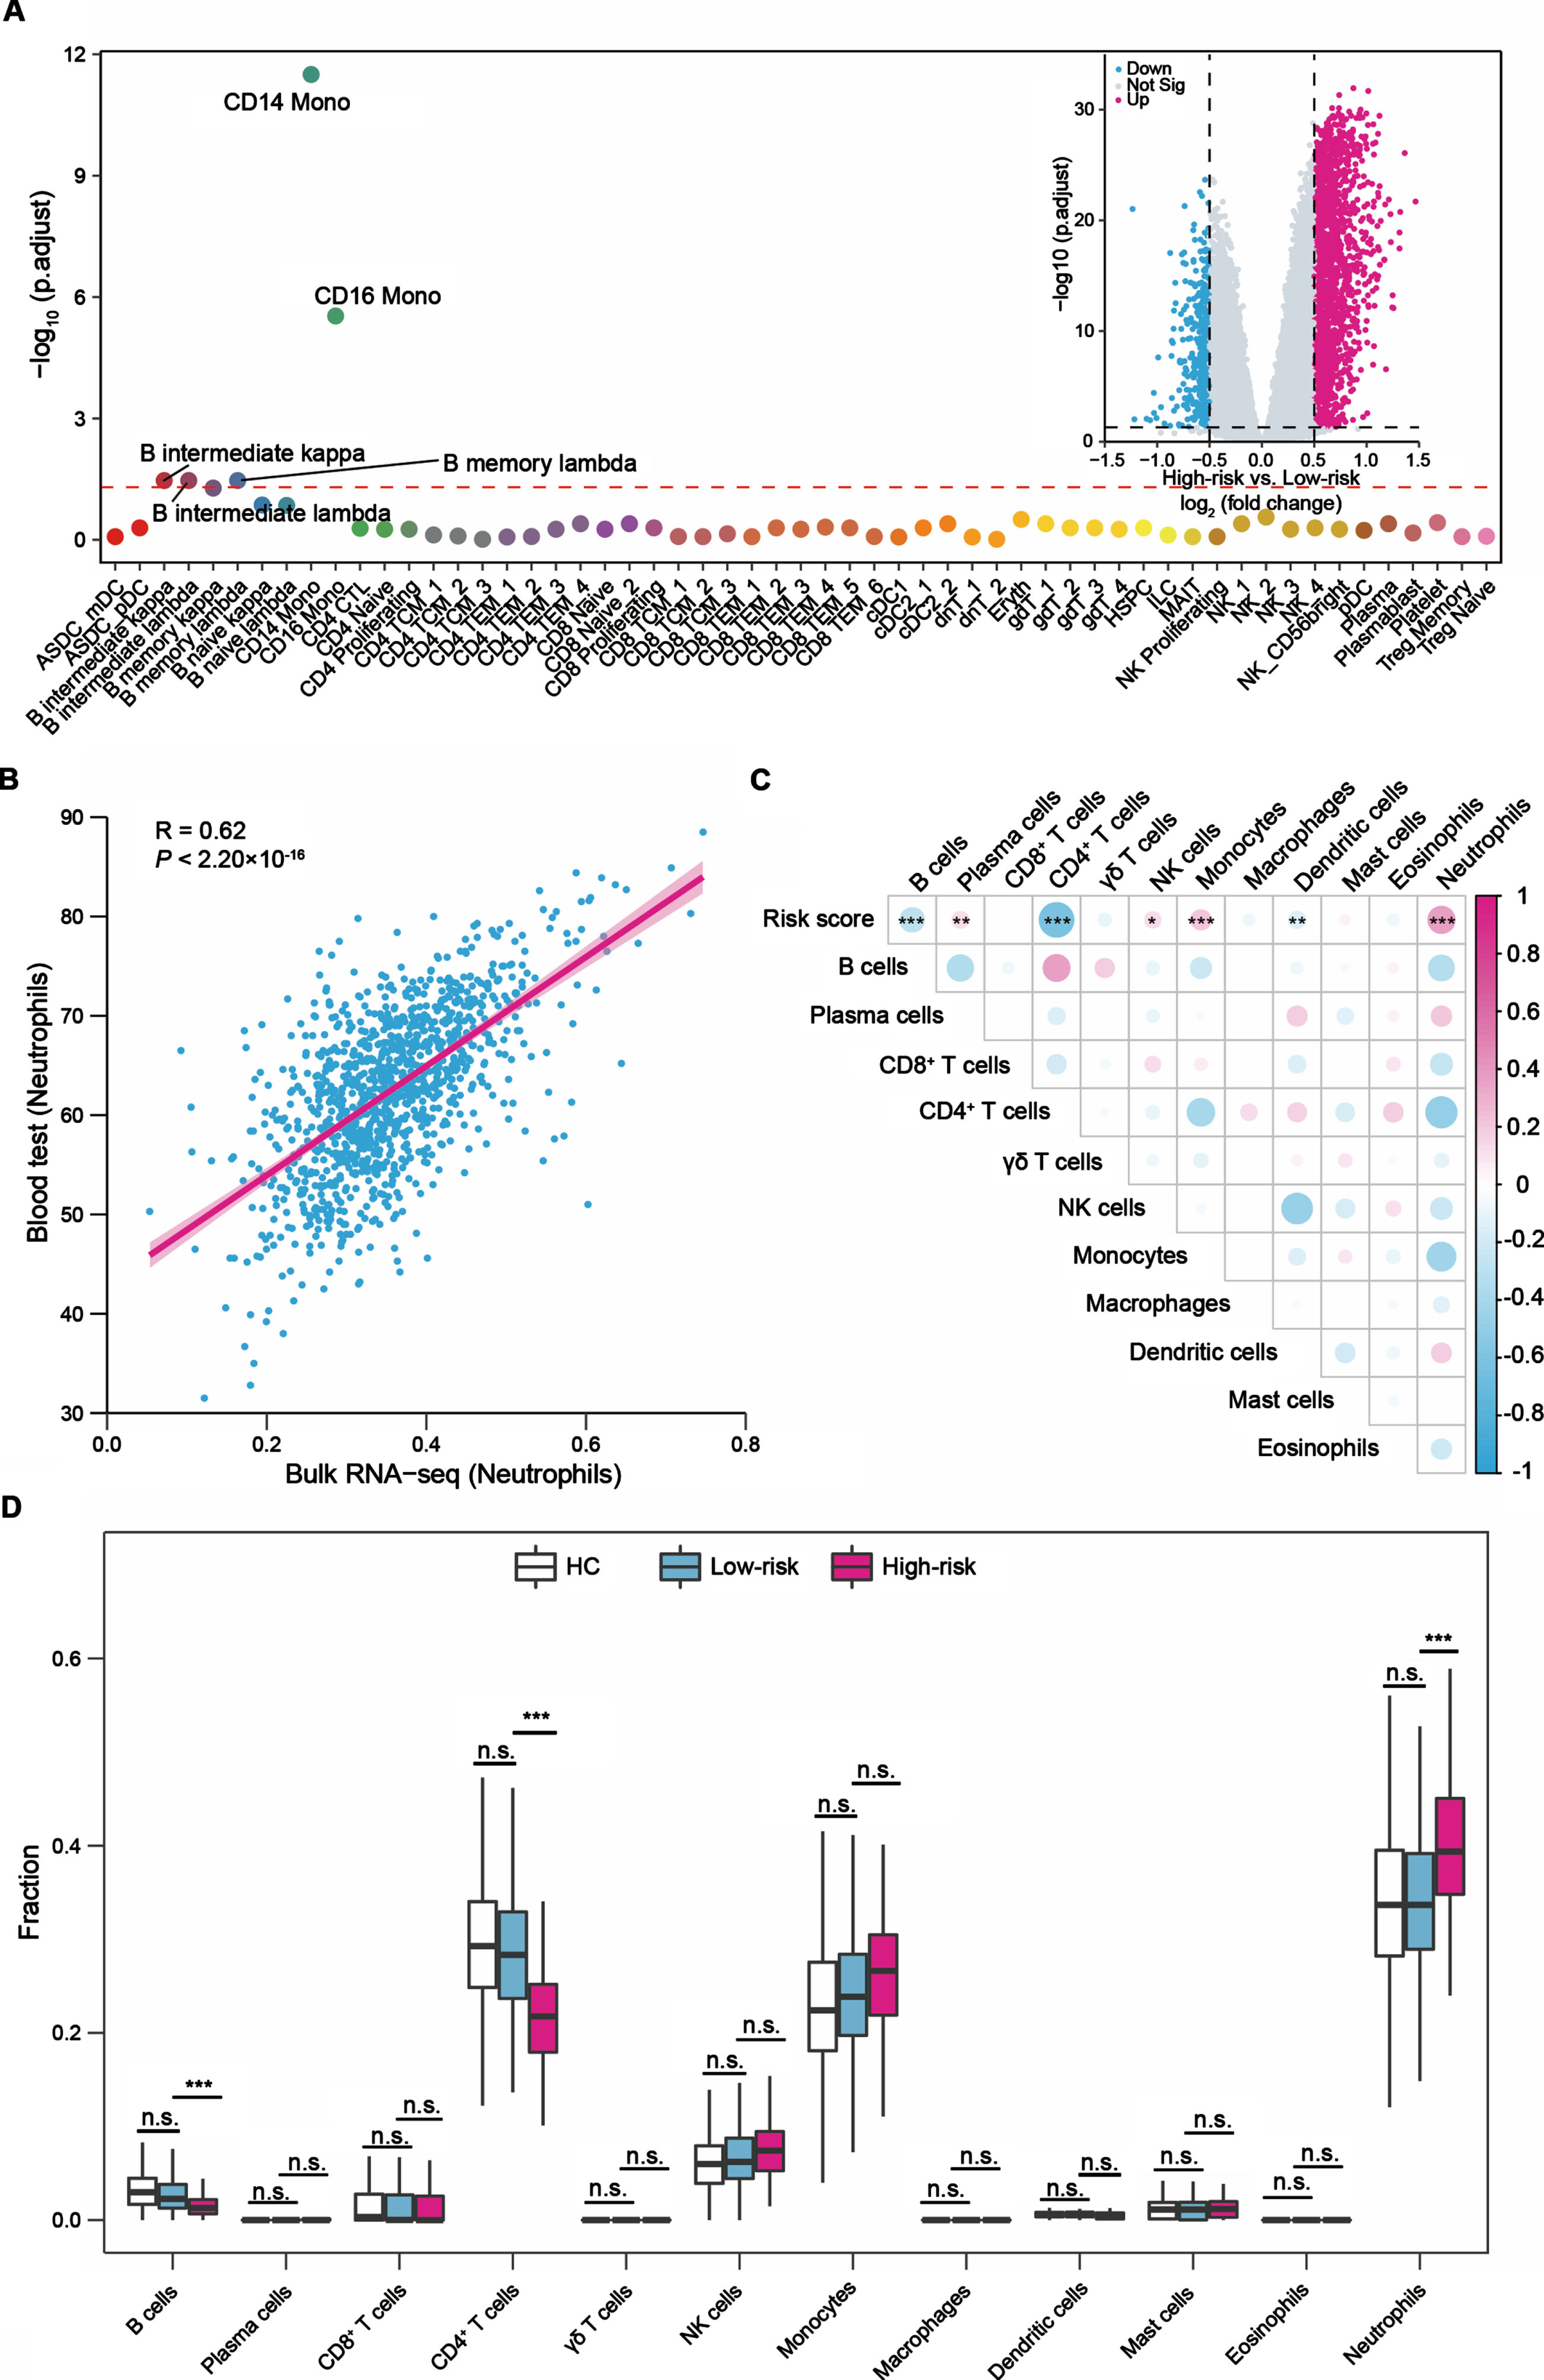
The above analyses indicated that the different gene expression patterns between the high- and low-risk score groups might be associated with immune cells. We next utilized the CIBERSORT algorithm to estimate the relative abundances of 12 major types of immune cells in peripheral blood for each participant in the PPMI cohort. The Pearson’s correlation analysis showed the estimation results were positively correlated with the fraction of immune cells obtained from the available clinical cell count data, like neutrophils (Pearson’s R = 0.62, p < 2.20×10⁻¹⁶, Fig. 3B). We further evaluated the relationship between the two-gene signature-derived risk score and the immune microenvironment. The risk score was negatively correlated with B cells, CD4+ T cells and dendritic cells, and positively correlated with plasma cells, NK cells, monocytes, and neutrophils (Fig. 3C).
We also observed differences in the fraction of cell types between the high- and low-risk score groups in peripheral blood. Compared to the low-risk score group, the fraction of neutrophils showed a 5% (95% CI: 3–7%, adjusted p = 7.62×10⁻⁷, Fig. 3D) increase in the high-risk group. While the fraction of CD4+ T cells was decreased 7% (95% CI: 5–8%, adjusted p = 5.44×10⁻¹³, Fig. 3D) in the high-risk group. The fraction of B cells (adjusted p = 1.29×10⁻⁴) was also decreased in the high-risk group, but the fraction was very low in all samples, and it is difficult to determine whether it was truly associated with the two-gene signature (Fig. 3D). Notably, we observed the fractions differences of neutrophils or CD4+ T cells in peripheral blood were consistent between the high- and low-risk score groups during the progression of PD (Supplementary Figure 7A, B). The independent PDBP cohort presented similar patterns between seven types of immune cells (B cells, plasma cells, CD4+ T cells, NK cells, monocytes, dendritic cells, neutrophils) and the risk score (Supplementary Figure 8A), the increase in the fraction of neutrophils, and the decrease in the CD4+ T cells and B cells fractions in the high-risk group (Supplementary Figure 8B). Collectively, we revealed neutrophils and CD4+ T cells may play key roles in the motor prognosis of PD.
Downregulated genes in iPSC-derived dopaminergic neurons of PD patients with high-risk scores compared to patients with low-risk scores were enriched in PD-associated pathways
Based on bulk RNA-seq data from peripheral blood, we observed a two-gene signature linked to the motor progression of PD and the alterations of immune cells between the high- and low-risk score groups. To further explore the molecular features of these two groups in the midbrain dopamine neurons, we carried out a single-cell RNA sequencing (scRNA-seq) analysis on the induced pluripotent stem cells (iPSC) derived dopaminergic neurons (DaNs) from six healthy controls, six PD patients with low-risk scores, and six PD patients with high-risk scores. There were no significant differences in age, sex, and years of education among the three groups (Supplementary Table 3). After quality-control filtering, a total of 91,887 cells were retained (Methods), of which 33,546 cells were from the healthy controls, 28,689 cells were from the low-risk group, and 29,652 cells from the high-risk group. Unbiased clustering of iPSC-derived DaNs generated 18 clusters, covering seven different cell types that were identified based on well-known markers (Supplementary Figure 9A, B). Major cell types, including early-neuron progenitors (ENP, 28,998 cells, 31.56% of total cells), late-neuro progenitors (LNP, 22,495 cells, 24.48% of total cells), dopaminergic neurons (DaNs, 17,524 cells, 19.07% of total cells), immature DaNs (15,232 cells, 16.58% of total cells), proliferating floor plate progenitors (PFPP, 3,815 cells, 4.15% of total cells), ependymal-like cells (Epe-like, 2,379 cells, 2.59% of total cells) and neuroepithelia-like cells (Neu-like, 1,444 cells, 1.57% of total cells), contained cells from most samples (Supplementary Figure 9C). We did not observe any difference in the proportion of DaNs between the high- and low-risk score groups.
To understand whether transcripts altered in DaNs of patients with high-risk scores, we analyzed gene expression levels of DaNs between the two risk groups. Compared to patients with low-risk scores, 127 genes were upregulated and 107 genes were downregulated in DaNs of patients with high-risk scores (Fig. 4A). These genes included PD-associated GWAS loci (e.g., RIT2, INPP5F, and NUCKS1), associated with mitochondrial function (e.g., MT-CO1, MT-CO2, ATP5F1E), oxidative phosphorylation (e.g., NDUFB6, NDUFB11, NDUFA11), glucose metabolism (e.g., GAPDH, RBM3) and involved in synaptic vesicle regulation by calcium signaling (e.g., SYT1, SYT4) (Fig. 4B).
Fig. 4
Downregulated genes in iPSC-derived dopaminergic neurons from PD patients with high-risk scores were enriched in PD-associated pathways. (A) Volcano plot showed the up- and downregulated genes in dopaminergic neurons (DaNs) between six PD patients with high-risk scores and six PD patients with low-risk scores. Red points represented significantly upregulated genes and blue points represented downregulated genes. (B) Heatmap presented the representative up- and downregulated genes in DaNs between the high- and low-risk score groups. (C) GO enrichment analysis of the upregulated and downregulated genes in DaNs. The lollipop plots displayed the top 15 enriched GO terms for upregulated and downregulated genes, respectively. (D) Gene set enrichment analysis (GSEA) uncovered genes enriched in PD-associated pathways that were downregulated in patients with high-risk scores. Genes were ranked by the value of log2 (fold change) generated by differential expression analysis between the high- and low-risk score patients. The p values were adjusted by the Benjamini-Hochberg method. NES, normalized enrichment score.
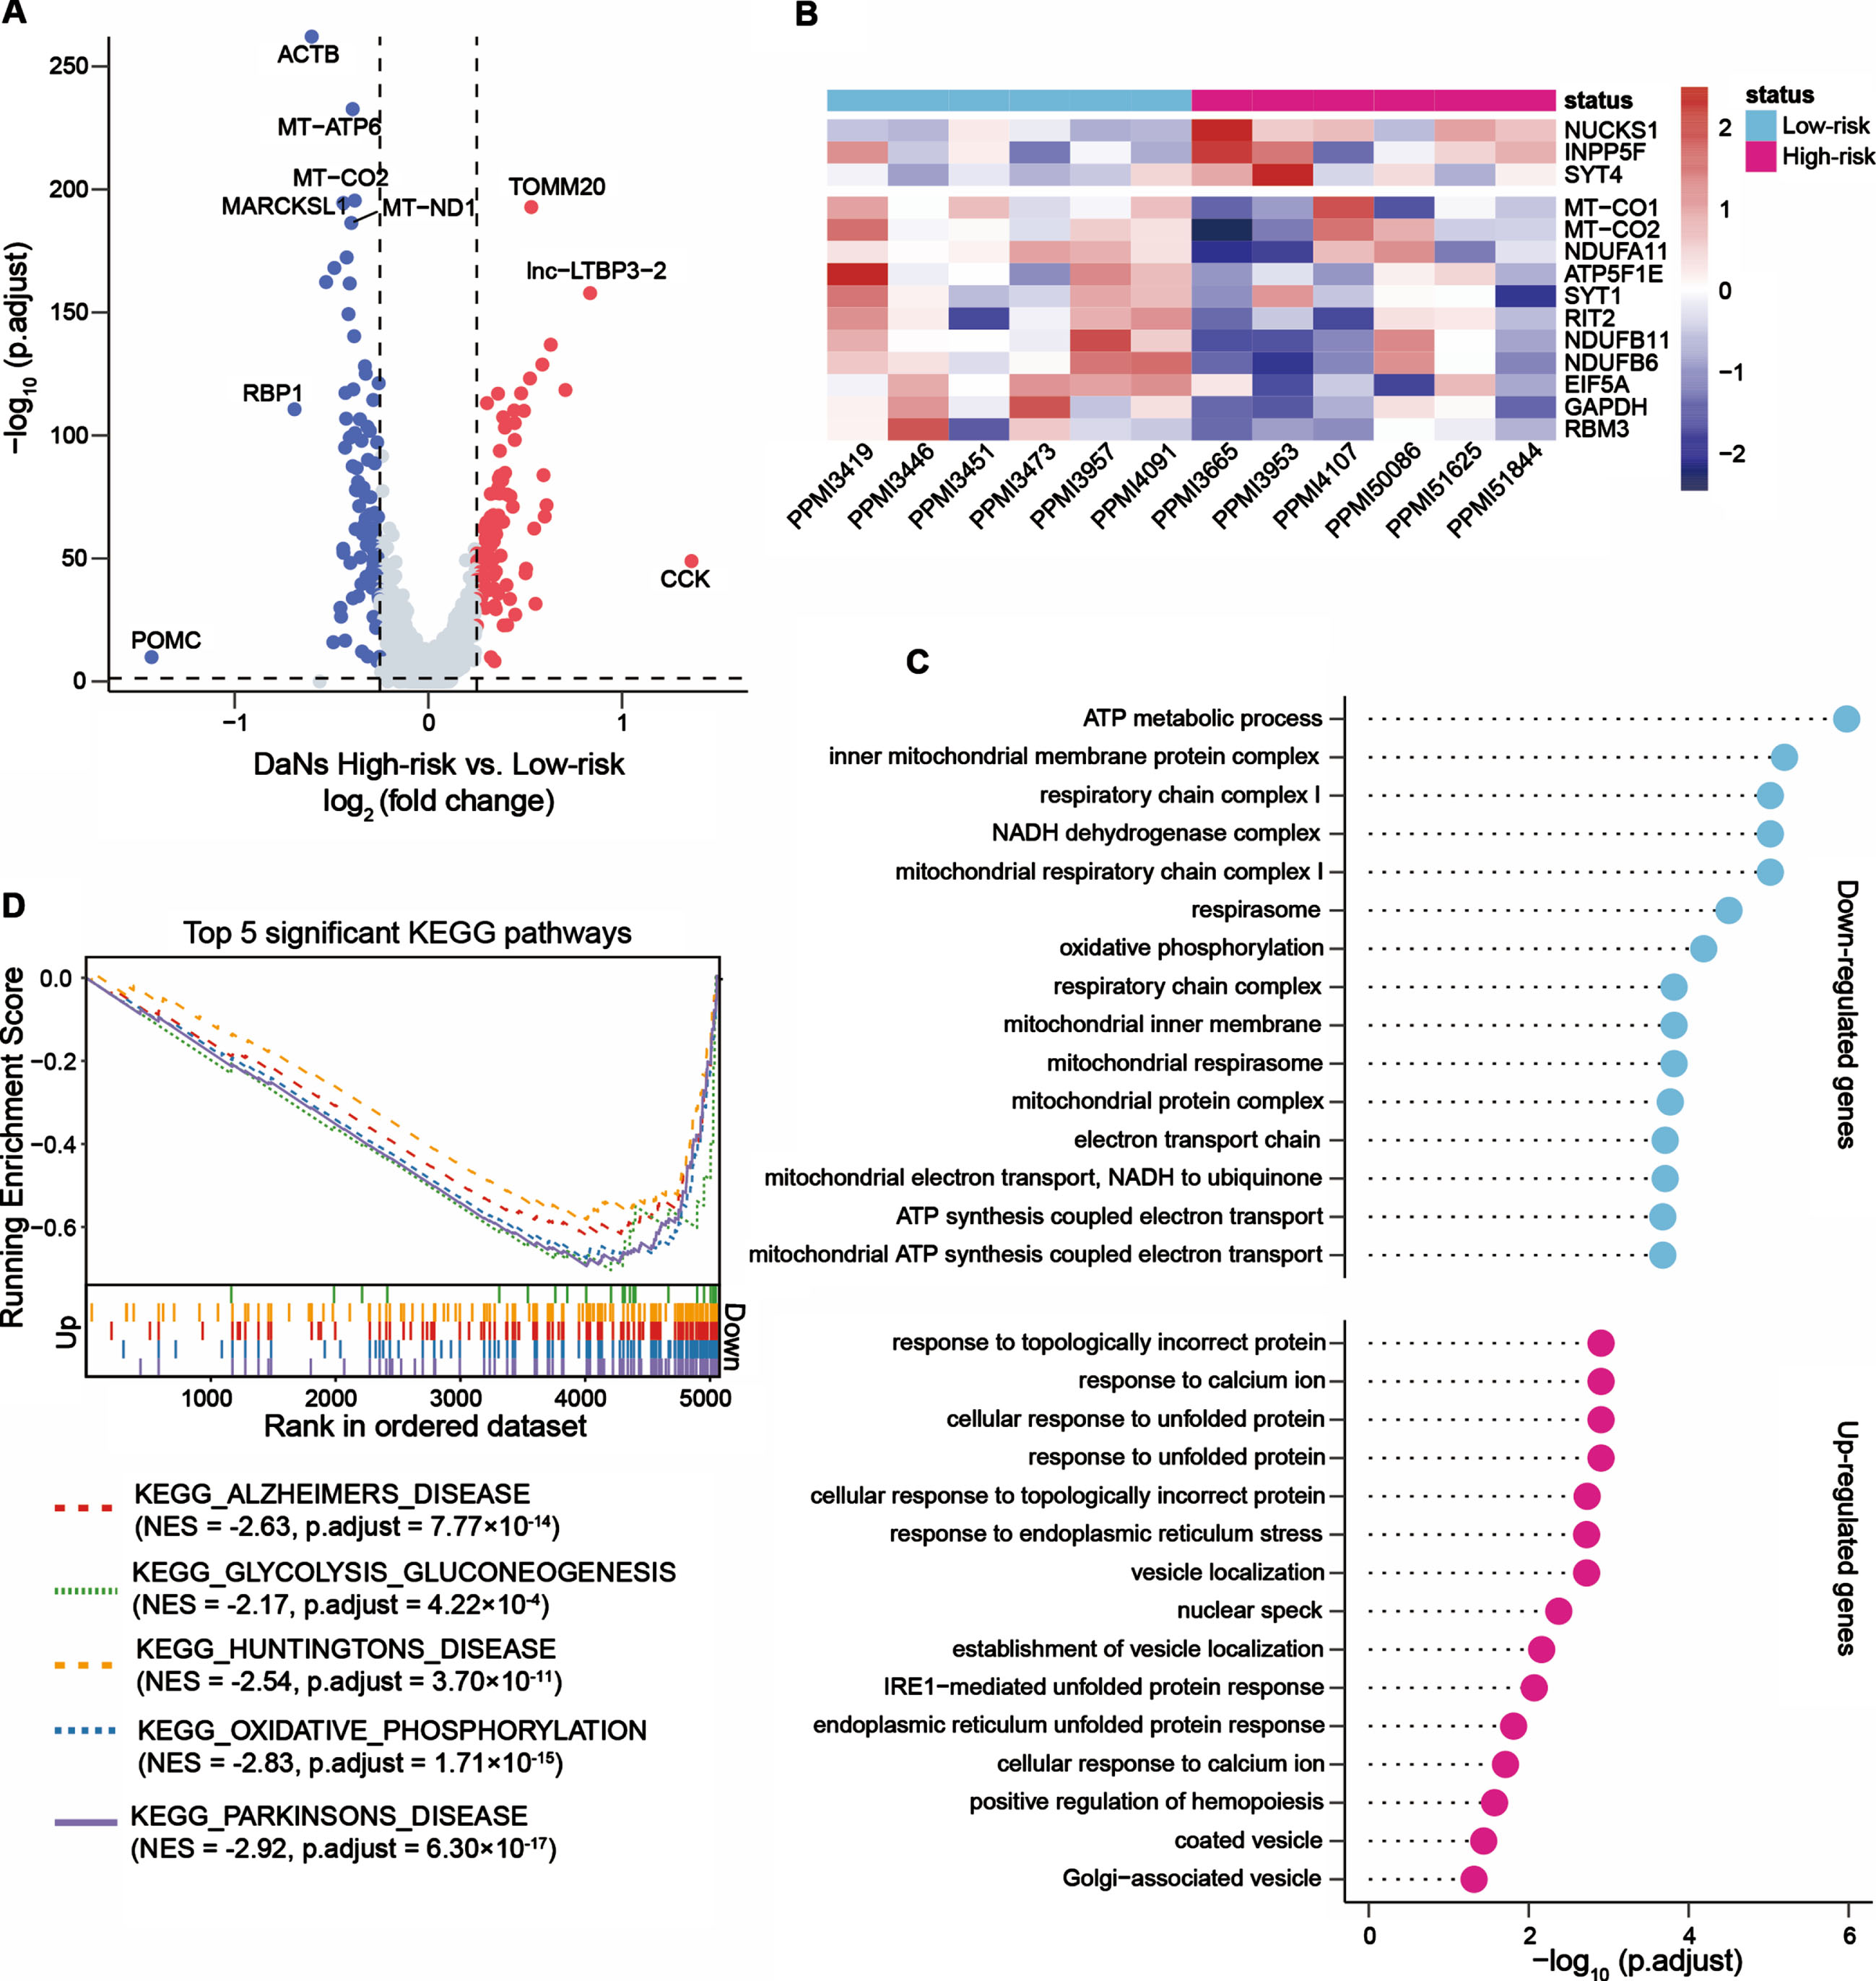
We further investigated the up- and downregulated genes in DaNs via functional enrichment analysis. The downregulated genes in patients with high-risk scores were enriched in 129 significant GO terms, including ATP metabolic process, mitochondrial respiratory chain complex I, oxidative phosphorylation, and canonical glycolysis (Fig. 4C) in addition to inflammatory-related pathways such as interleukin-12-mediated signaling pathway (adjusted p = 0.007), response to interleukin-12 (adjusted p = 0.008) and positive regulation of leukocyte chemotaxis (adjusted p = 0.04). Conversely, 15 upregulated biological processes such as response to topologically incorrect protein, response to calcium ion, and cellular response to unfolded protein were identified (Fig. 4C). We also estimated the affected KEGG pathways: the downregulated genes in DaNs from patients with high-risk scores were enriched in neurodegenerative disorder (Parkinson’s disease, Alzheimer’s disease, and Huntington’s disease) associated pathways, oxidative phosphorylation pathway, and glycolysis and gluconeogenesis pathway (Fig. 4D). These analyses suggested that transcripts significantly altered in DaNs between the high- and low-risk score groups. For the downregulated genes, we noted these genes were enriched in PD-associated pathways, indicating the two-gene signature provides an opportunity to reveal the molecular mechanisms associated with PD pathogenesis.
DISCUSSION
In this study, we identified a reliable two-gene signature that links to the motor progression in patients with PD from the whole blood gene expression profiles using well-study cohorts, and the prognostic ability of this two-gene signature was replicated in an independent cohort. The signature two genes, LILRB3 and LRRN3, were differentially expressed between patients with PD and HC in agreement with a previous study [17]. LILRB3, a member of the leukocyte immunoglobulin-like receptor (LIR) family, is expressed on immune cells where it binds to major histocompatibility complex (MHC) class I molecules and is involved in the regulation of immune responses, inflammatory responses, and cytotoxicity [38–41]. Moreover, a study of sepsis showed that LILRB3 was significantly upregulated in the peripheral blood mononuclear cells of patients compared to healthy controls and inhibited macrophage-mediated bacterial killing and antigen presentation [41]. LRRN3 is highly expressed in the brain, which plays a role in the development and maintenance of the nervous system [42]. Mutations in LRRN3 are strongly associated with autism spectrum disorder [43], and the sustained expression of LRRN3 has been reported to maintain normal T cell function during chronic antigenic simulation [44].
Based on the two-gene signature, we observed the high-risk score patients with poorer prognosis (fast progression to H&Y stage 3) contained a higher fraction of neutrophils and a lower fraction of CD4+ T cells in the blood than the low-risk score patients across all visits (Supplementary Figure 7A, B). Whereas, the fractions of these cell types were remarkably similar between the low-risk score patients and healthy controls (Fig. 3D). The immune cells in peripheral blood have been documented that contribute to the development of PD by infiltrating the central nervous system (CNS) through an impaired blood-brain barrier, which implies a critical role of the activation of the immune system in PD pathogenesis [45, 46]. Previous studies have shown that monocytes [47] and neutrophils [17] are increased, while CD4+ T cells [48] are decreased in the circulation of PD patients. The peripheral monocyte infiltration of the brain in animal models was demonstrated to be an important step in inflammation and neurodegeneration induced by α-synuclein, infiltrating monocytes promote disease progression [47, 49]. We observed the high-risk score patients with increased monocytes compared to the low-risk score patients (nominal p < 0.05, but no statistical significance after multiple testing correction) were correlated with the severity progression of motor symptoms in PD. Several studies have demonstrated that neutrophils or the neutrophil-to-lymphocyte ratio (NLR) were increased in patients with PD compared to healthy controls [50–52], and Solmaz et al. [53] found a positive correlation between the NLR and H&Y stage. Our study showed a significant increase in neutrophils with a concomitant decrease in B cells and CD4+ T cells in PD cases with high-risk scores, which is in line with previous reports [53, 54]. Accumulated evidence showed that CD4+ T cells can infiltrate the brain to induce dopaminergic toxicity and contribute to neurodegeneration in PD [55, 56]. Recent studies have illustrated that the elevated α-synuclein-specific CD4+ T cell reactivity was present in the preclinical phase (before the onset of motor symptoms) of PD then decreased after disease onset [57], and the number of CD4+ T cells was negatively correlated with H&Y stage [58], which are consistent with our findings. An additional study reported that three transcription factor genes (STAT1, NR4A2, STAT6) involved in CD4+ T cells development were associated with motor complications in PD [59], and STAT6 was confirmed in our analyses. Altogether, our two-gene signature endorses the association between the immune systemand PD [60].
We did not observe a significant loss of DaNs in patients with high-risk scores when assessing DaNs in the two risk groups using scRNA-seq data. Several reasons can contribute to the underrepresentation of DaNs. Firstly, as the disease progresses, dopamine neurons vulnerability combined with the immune system might create an environment for selective DaN loss in the high-risk score patients [61]. Secondly, iPSC-derived DaNs provided a valuable model of PD but lacked the complex composition and dynamics found in the human brain [62]. Moreover, the technical limitation may be another important factor causing the underrepresentation of DaNs in the transcriptomic data. Our differential expression analysis showed altered transcripts in iPSC-derived DaNs between the high- and low-risk groups. Further functional enrichment analysis indicated that the downregulated genes in DaNs of patients with high-risk scores were mainly enriched in PD-associated pathways, such as mitochondrial function, oxidative phosphorylation, glycolysis, and gluconeogenesis, as well as inflammatory-related pathways. These molecular pathways and the associated genes have been reported to be dysregulated in PD and are thought to involve in the acceleration of the progression of the disease. For example, defective mitochondrial can lead to the accumulation of α-synuclein or impair energy metabolism and cause oxidative stress [63]. Moreover, an imbalance of glucose metabolism has been linked to faster progression of motor symptoms in PD [64]. The interactions of affected pathways indicated that a cascade of several molecular events happens and then causes progressive neurodegeneration [65].
Our study has some limitations. Firstly, nearly all PD patients from PPMI were de novo at enrollment, while patients from PDBP who within 5 years of receiving a diagnosis regardless of treatment status. The mediocre performance of the two-gene signature in the PDBP cohort may be due to the distinct duration time of disease onset in these two cohorts. We suggested that future studies with different stages of PD cases from longitudinal cohorts are needed to validate our findings. Secondly, we explored the changes in iPSC-derived DaNs between the two risk groups, but we did not know detailed cell population changes and transcriptional changes of the interested immune cell types at the single-cell level in the two risk groups. We suggested further careful targeted analysis of immune cell populations and single-cell transcriptional changes are required.
This study identified a two-gene signature linked to the motor progression in Parkinson’s disease, and patients with PD in the two risk groups exhibited prominent changes in neutrophils and CD4+ cells in the blood. In addition, the downregulated genes in DaNs of patients with high-risk scores were mainly enriched in PD-associated pathways. We proposed that these results provide new insights into the motor prognosis for PD.
ACKNOWLEDGMENTS
We would like to thank members from the AMP PD, PPMI, PDBP and GEO knowledge platforms who have shared their data online. AMP PD: Data used in the preparation of this article were obtained from the Accelerating Medicine Partnership Parkinson’s Disease (AMP PD) Knowledge Platform. For up-to-date information on the study, visit https://www.amp-pd.org. The AMP PD program is a public-private partnership managed by the Foundation for the National Institutes of Health and funded by the National Institute of Neurological Disorders and Stroke (NINDS) in partnership with the Aligning Science Across Parkinson’s (ASAP) initiative; Celgene Corporation, a subsidiary of Bristol-Myers Squibb Company; GlaxoSmithKline plc (GSK); The Michael J. Fox Foundation for Parkinson’s Research; Pfizer Inc.; Sanofi US Services Inc.; and Verily Life Sciences.
PPMI: Data used in the preparation of this article were obtained from the Parkinson’s Progression Markers Initiative (PPMI) database (www.ppmi-info.org/data). For up-to-date information on the study, visit www.ppmi-info.org. PPMI, a public-private partnership, is funded by the Michael J. Fox Foundation for Parkinson’s Research and funding partners, including Abbvie, AcureX, Allergan, Amathus, Asap, Avid, Bial Biotech, Biogen Idec, BioLegend, Bristol-Myers Squibb, Calico, Celgene, DACAPO Brainscience, DENALI, 4D pharma plc, EDMOND J. SAFRA, GE Healthcare, Genentech, GlaxoSmithKline, GOLUB CAPITAL, Handl Therapeutics, Insitro, Janssen Neuroscience, Lilly, Lundbeck, Merck, Meso Scale Discovery, Neurocrine, Pfizer, Piramal, Prevail Therapeutics, Roche, SANOFI GENZYME, SERVIER, Takeda, TEVA, UCB, Verily and Voyager Therapeutics.
PDBP: The Parkinson’s Disease Biomarker Program (PDBP) consortium is supported by the National Institute of Neurological Disorders and Stroke (NINDS) at the National Institutes of Health. A full list of PDBP investigators can be found at https://pdbp.ninds.nih.gov/policy. The PDBP investigators have not participated in reviewing the data analysis or content of the manuscript.
G.L.’s work is supported by the National Natural Science Foundation of China (31900475, 32270701), Young Talent Recruitment Project of Guangdong (2019QN01Y139), Guangdong Basic and Applied Basic Research Foundation (2022A1515011440), Shenzhen Basic Research Project (JCYJ20190807161601692), and The Fundamental Research Funds for the Central Universities, Sun Yat-sen University (22ykqb07).
CONFLICT OF INTEREST
The authors declare there is no any commercial or financial relationships that represents a conflict of interest in connection with this study.
SUPPLEMENTARY MATERIAL
[1] The supplementary material is available in the electronic version of this article: https://dx.doi.org/10.3233/JPD-223454.
REFERENCES
[1] | Poewe W , Seppi K , Tanner CM , Halliday GM , Brundin P , Volkmann J , Schrag AE , Lang AE ((2017) ) Parkinson disease. Nat Rev Dis Primers 3: , 17013. |
[2] | Kalia LV , Lang AE ((2015) ) Parkinson’s disease. Lancet 386: , 896–912. |
[3] | Marek K , Chowdhury S , Siderowf A , Lasch S , Coffey CS , Caspell-Garcia C , Simuni T , Jennings D , Tanner CM , Trojanowski JQ , Shaw LM , Seibyl J , Schuff N , Singleton A , Kieburtz K , Toga AW , Mollenhauer B , Galasko D , Chahine LM , Weintraub D , Foroud T , Tosun-Turgut D , Poston K , Arnedo V , Frasier M , Sherer T , Parkinson’s Progression Markers I ((2018) ) The Parkinson’s progression markers initiative (PPMI) - establishing a PD biomarker cohort. Ann Clin Transl Neurol 5: , 1460–1477. |
[4] | Ren X , Lin J , Stebbins GT , Goetz CG , Luo S ((2021) ) Prognostic modeling of Parkinson’s disease progression using early longitudinal patterns of change. Mov Disord 36: , 2853–2861. |
[5] | Vu TC , Nutt JG , Holford NH ((2012) ) Disease progress and response to treatment as predictors of survival, disability, cognitive impairment and depression in Parkinson’s disease. Br J Clin Pharmacol 74: , 284–295. |
[6] | Latourelle JC , Beste MT , Hadzi TC , Miller RE , Oppenheim JN , ValkoMP , Wuest DM , Church BW , Khalil IG , Hayete B , Venuto CS ((2017) ) Large-scale identification of clinical and genetic predictors ofmotor progression in patients with newly diagnosed Parkinson’sdisease: A longitudinal cohort study and validation. Lancet Neurol 16: , 908–916. |
[7] | Mollenhauer B , Zimmermann J , Sixel-Doring F , Focke NK , Wicke T , Ebentheuer J , Schaumburg M , Lang E , Friede T , Trenkwalder C , DeNoPa Study Group ((2019) ) Baseline predictors for progression 4 years after Parkinson’s disease diagnosis in the De Novo Parkinson Cohort (DeNoPa). Mov Disord 34: , 67–77. |
[8] | Pu JL , Jin CY , Wang ZX , Fang Y , Li YL , Xue NJ , Zheng R , Lin ZH , Yan YQ , Si XL , Chen Y , Liu Y , Song Z , Yan YP , Tian J , Yin XZ , Zhang BR ((2022) ) Apolipoprotein E genotype contributes to motor progression in Parkinson’s disease. Mov Disord 37: , 196–200. |
[9] | Lin CH , Li CH , Yang KC , Lin FJ , Wu CC , Chieh JJ , Chiu MJ ((2019) ) Blood NfL: A biomarker for disease severity and progression in Parkinson disease. Neurology 93: , e1104–e1111. |
[10] | Burgos K , Malenica I , Metpally R , Courtright A , Rakela B , Beach T , Shill H , Adler C , Sabbagh M , Villa S , Tembe W , Craig D , Van Keuren-Jensen K ((2014) ) Profiles of extracellular miRNA in cerebrospinal fluid and serum from patients with Alzheimer’s and Parkinson’s diseases correlate with disease status and features of pathology. PLoS One 9: , e94839. |
[11] | Borrageiro G , Haylett W , Seedat S , Kuivaniemi H , Bardien S ((2018) ) A review of genome-wide transcriptomics studies in Parkinson’s disease. Eur J Neurosci 47: , 1–16. |
[12] | Calligaris R , Banica M , Roncaglia P , Robotti E , Finaurini S , Vlachouli C , Antonutti L , Iorio F , Carissimo A , Cattaruzza T , Ceiner A , Lazarevic D , Cucca A , Pangher N , Marengo E , di Bernardo D , Pizzolato G , Gustincich S ((2015) ) Blood transcriptomics of drug-naive sporadic Parkinson’s disease patients. BMC Genomics 16: , 876. |
[13] | Kern F , Fehlmann T , Violich I , Alsop E , Hutchins E , Kahraman M , Grammes NL , Guimarães P , Backes C , Poston KL , Casey B , Balling R , Geffers L , Krüger R , Galasko D , Mollenhauer B , Meese E , Wyss-Coray T , Craig DW , Van Keuren-Jensen K , Keller A ((2021) ) Deep sequencing of sncRNAs reveals hallmarks and regulatory modules of the transcriptome during Parkinson’s disease progression. Nat Aging 1: , 309–322. |
[14] | Shamir R , Klein C , Amar D , Vollstedt EJ , Bonin M , Usenovic M , Wong YC , Maver A , Poths S , Safer H , Corvol JC , Lesage S , Lavi O , Deuschl G , Kuhlenbaeumer G , Pawlack H , Ulitsky I , Kasten M , Riess O , Brice A , Peterlin B , Krainc D ((2017) ) Analysis of blood-based gene expression in idiopathic Parkinson disease. Neurology 89: , 1676–1683. |
[15] | Rosenthal LS , Drake D , Alcalay RN , Babcock D , Bowman FD , Chen-Plotkin A , Dawson TM , Dewey RB , Jr. , German DC , Huang X , Landin B , McAuliffe M , Petyuk VA , Scherzer CR , Hillaire-Clarke CS , Sieber BA , Sutherland M , Tarn C , West A , Vaillancourt D , Zhang J , Gwinn K , PDBP consortium ((2016) ) The NINDS Parkinson’s disease biomarkers program. Mov Disord 31: , 915–923. |
[16] | Marek K , Jennings D , Lasch S , Siderowf A , Tanner C , Simuni T , Coffey C , Kieburtz K , Flagg E , Chowdhury S , Poewe W , Mollenhauer B , Klinik P-E , Sherer T , Frasier M , Meunier C , Rudolph A , Casaceli C , Seibyl J , Mendick S , Schuff N , Zhang Y , Toga A , Crawford K , Ansbach A , De Blasio P , Piovella M , Trojanowski J , Shaw L , Singleton A , Hawkins K , Eberling J , Brooks D , Russell D , Leary L , Factor S , Sommerfeld B , Hogarth P , Pighetti E , Williams K , Standaert D , Guthrie S , Hauser R , Delgado H , Jankovic J , Hunter C , Stern M , Tran B , Leverenz J , Baca M , Frank S , Thomas C-A , Richard I , Deeley C , Rees L , Sprenger F , Lang E , Shill H , Obradov S , Fernandez H , Winters A , Berg D , Gauss K , Galasko D , Fontaine D , Mari Z , Gerstenhaber M , Brooks D , Malloy S , Barone P , Longo K , Comery T , Ravina B , Grachev I , Gallagher K , Collins M , Widnell KL , Ostrowizki S , Fontoura P , Ho T , Luthman J , Brug Mvd , Reith AD , Taylor P ((2011) ) The Parkinson Progression Marker Initiative (PPMI). Prog Neurobiol 95: , 629–635. |
[17] | Craig DW , Hutchins E , Violich I , Alsop E , Gibbs JR , Levy S , Robison M , Prasad N , Foroud T , Crawford KL , Toga AW , Whitsett TG , Kim S , Casey B , Reimer A , Hutten SJ , Frasier M , Kern F , Fehlman T , Keller A , Cookson MR , Van Keuren-Jensen K , Hutten S , Van Keuren-Jensen K ((2021) ) RNA sequencing of whole blood reveals early alterations in immune cells and gene expression in Parkinson’s disease. Nat Aging 1: , 734–747. |
[18] | Simuni T , Siderowf A , Lasch S , Coffey CS , Caspell-Garcia C , Jennings D , Tanner CM , Trojanowski JQ , Shaw LM , Seibyl J , Schuff N , Singleton A , Kieburtz K , Toga AW , Mollenhauer B , Galasko D , Chahine LM , Weintraub D , Foroud T , Tosun D , Poston K , Arnedo V , Frasier M , Sherer T , Chowdhury S , Marek K , Parkinson’s Progression Marker Initiative ((2018) ) Longitudinal change of clinical and biological measures in early Parkinson’s disease: Parkinson’s Progression Markers Initiative Cohort. Mov Disord 33: , 771–782. |
[19] | Edgar R , Domrachev M , Lash AE ((2002) ) Gene Expression Omnibus: NCBI gene expression and hybridization array data repository. Nucleic Acids Res 30: , 207–210. |
[20] | Law CW , Alhamdoosh M , Su S , Dong X , Tian L , Smyth GK , Ritchie ME ((2016) ) RNA-seq analysis is easy as 1-2-3 with limma, Glimma and edgeR. F1000Res 5: , ISCB Comm J1408. |
[21] | Friedman J , Hastie T , Tibshirani R ((2010) ) Regularization paths for generalized linear models via coordinate descent. J Stat Softw 33: , 1–22. |
[22] | Breen MS , Dobbyn A , Li Q , Roussos P , Hoffman GE , Stahl E , Chess A , Sklar P , Li JB , Devlin B , Buxbaum JD , CommonMind Consortium ((2019) ) Global landscape and genetic regulation of RNA editing in cortical samples from individuals with schizophrenia. Nat Neurosci 22: , 1402–1412. |
[23] | Zhang Z , Zhao Y , Canes A , Steinberg D , Lyashevska O , written on behalf of AMEB-DCTCG ((2019) ) Predictive analytics with gradient boosting in clinical medicine. Ann Transl Med 7: , 152. |
[24] | Robin X , Turck N , Hainard A , Tiberti N , Lisacek F , Sanchez JC , Muller M ((2011) ) pROC: An open-source package for R and}+ to analyze and compare ROC curves. BMC Bioinformatics 12: , 77. |
[25] | Zhao YJ , Wee HL , Chan YH , Seah SH , Au WL , Lau PN , Pica EC , Li SC , Luo N , Tan LC ((2010) ) Progression of Parkinson’s disease as evaluated by Hoehn and Yahr stage transition times. Mov Disord 25: , 710–716. |
[26] | Liu G , Peng J , Liao Z , Locascio JJ , Corvol JC , Zhu F , Dong X , Maple-Grodem J , Campbell MC , Elbaz A , Lesage S , Brice A , Mangone G , Growdon JH , Hung AY , Schwarzschild MA , Hayes MT , Wills AM , Herrington TM , Ravina B , Shoulson I , Taba P , Koks S , Beach TG , Cormier-Dequaire F , Alves G , Tysnes OB , Perlmutter JS , Heutink P , Amr SS , van Hilten JJ , Kasten M , Mollenhauer B , Trenkwalder C , Klein C , Barker RA , Williams-Gray CH , Marinus J , International Genetics of Parkinson Disease Progression (IGPP) Consortium, Scherzer CR ((2021) ) Genome-wide survival study identifies a novel synaptic locus and polygenic score for cognitive progression in Parkinson’s disease. Nat Genet 53: , 787–793. |
[27] | Therneau TM ((2014) ), A Package for Survival Analysis in R. |
[28] | Yu G , Wang LG , Han Y , He QY ((2012) ) clusterProfiler: An R package for comparing biological themes among gene clusters. OMICS 16: , 284–287. |
[29] | Ma W , Sharma S , Jin P , Gourley SL , Qin ZS ((2022) ) LRcell: Detecting the source of differential expression at the sub-cell-type level from bulk RNA-seq data. Brief Bioinform 23: , bbac063. |
[30] | Hao Y , Hao S , Andersen-Nissen E , Mauck WM , 3rd , Zheng S , Butler A , Lee MJ , Wilk AJ , Darby C , Zager M , Hoffman P , Stoeckius M , Papalexi E , Mimitou EP , Jain J , Srivastava A , Stuart T , Fleming LM , Yeung B , Rogers AJ , McElrath JM , Blish CA , Gottardo R , Smibert P , Satija R ((2021) ) Integrated analysis of multimodal single-cell data. Cell 184: , 3573–3587 e3529. |
[31] | Newman AM , Liu CL , Green MR , Gentles AJ , Feng W , Xu Y , Hoang CD , Diehn M , Alizadeh AA ((2015) ) Robust enumeration of cell subsets from tissue expression profiles. Nat Methods 12: , 453–457. |
[32] | Shigemizu D , Mori T , Akiyama S , Higaki S , Watanabe H , Sakurai T , Niida S , Ozaki K ((2020) ) Identification of potential blood biomarkers for early diagnosis of Alzheimer’s disease through RNA sequencing analysis. Alzheimers Res Ther 12: , 87. |
[33] | Butler A , Hoffman P , Smibert P , Papalexi E , Satija R ((2018) ) Integrating single-cell transcriptomic data across different conditions, technologies, and species. Nat Biotechnol 36: , 411–420. |
[34] | Bressan E , Reed X , Bansal V , Hutchins E , Cobb MM , Webb MG , Alsop E , Grenn FP , Illarionova A , Savytska N , Violich I , Broeer S , Fernandes N , Sivakumar R , Beilina A , Billingsley K , Berghausen J , Pantazis CB , Meechoovet B , Reiman R , Courtright-Lim A , Logemann A , Antone J , Barch M , Kitchen R , Li Y , Dalgard CL , Rizzu P , Hernandez DG , Hjelm BE , Nalls M , Gibbs JR , Finkbeiner S , Cookson MR , Keuren-Jensen KV , Craig DW , Singleton AB , Heutink P , Blauwendraat C ((2021) ) The Foundational data initiative for Parkinson’s disease (FOUNDIN-PD): Enabling efficient translation from genetic maps to mechanism. bioRxiv, doi: https://doi.org/10.1101/2021.06.03.446785. |
[35] | Becht E , McInnes L , Healy J , Dutertre CA , Kwok IWH , Ng LG , Ginhoux F , Newell EW ((2019) ) Dimensionality reduction for visualizing single-cell data using UMAP. Nat Biotechnol 37: , 38–44. |
[36] | Finak G , McDavid A , Yajima M , Deng J , Gersuk V , Shalek AK , Slichter CK , Miller HW , McElrath MJ , Prlic M , Linsley PS , Gottardo R ((2015) ) MAST: A flexible statistical framework for assessing transcriptional changes and characterizing heterogeneity in single-cell RNA sequencing data. Genome Biol 16: , 278. |
[37] | Polymeropoulos MH , Lavedan C , Leroy E , Ide SE , Dehejia A , Dutra A , Pike B , Root H , Rubenstein J , Boyer R , Stenroos ES , Chandrasekharappa S , Athanassiadou A , Papapetropoulos T , Johnson WG , Lazzarini AM , Duvoisin RC , Di Iorio G , Golbe LI , Nussbaum RL ((1997) ) Mutation in the alpha-synuclein gene identified in families with Parkinson’s disease. Science 276: , 2045–2047. |
[38] | Truong AD , Hong Y , Lee J , Lee K , Tran HTT , Dang HV , Nguyen VK , Lillehoj HS , Hong YH ((2019) ) Chicken novel leukocyte immunoglobulin-like receptor subfamilies B1 and B3 are transcriptional regulators of major histocompatibility complex class I genes and signaling pathways. Asian-Australas J Anim Sci 32: , 614–628. |
[39] | Huang J , Burke PS , Cung TD , Pereyra F , Toth I , Walker BD , Borges L , Lichterfeld M , Yu XG ((2010) ) Leukocyte immunoglobulin-like receptors maintain unique antigen-presenting properties of circulating myeloid dendritic cells in HIV-1-infected elite controllers. J Virol 84: , 9463–9471. |
[40] | Yeboah M , Papagregoriou C , Jones DC , Chan HTC , Hu G , McPartlan JS , Schiott T , Mattson U , Mockridge CI , Tornberg UC , Hambe B , Ljungars A , Mattsson M , Tews I , Glennie MJ , Thirdborough SM , Trowsdale J , Frendeus B , Chen J , Cragg MS , Roghanian A ((2020) ) LILRB3 (ILT5) is a myeloid cell checkpoint that elicits profound immunomodulation. JCI Insight 5: , e141593. |
[41] | Ming S , Li M , Wu M , Zhang J , Zhong H , Chen J , Huang Y , Bai J , Huang L , Chen J , Lin Q , Liu J , Tao J , He D , Huang X ((2019) ) Immunoglobulin-like transcript 5 inhibits macrophage-mediated bacterial killing and antigen presentation during sepsis. J Infect Dis 220: , 1688–1699. |
[42] | Haines BP , Gupta R , Jones CM , Summerbell D , Rigby PW ((2005) ) The NLRR gene family and mouse development: Modified differential display PCR identifies NLRR-1 as a gene expressed in early somitic myoblasts. Dev Biol 281: , 145–159. |
[43] | Sousa I , Clark TG , Holt R , Pagnamenta AT , Mulder EJ , Minderaa RB , Bailey AJ , Battaglia A , Klauck SM , Poustka F , Monaco AP , International Molecular Genetic Study of Autism Consortium (IMGSAC) ((2010) ) Polymorphisms in leucine-rich repeat genes are associated with autism spectrum disorder susceptibility in populations of European ancestry. Mol Autism 1: , 7. |
[44] | Chou JP , Ramirez CM , Wu JE , Effros RB ((2013) ) Accelerated aging in HIV/AIDS: Novel biomarkers of senescent human CD8+ T cells. PLoS One 8: , e64702. |
[45] | Tian J , Dai SB , Jiang SS , Yang WY , Yan YQ , Lin ZH , Dong JX , Liu Y , Zheng R , Chen Y , Zhang BR , Pu JL ((2022) ) Specific immune status in Parkinson’s disease at different ages of onset. NPJ Parkinsons Dis 8: , 5. |
[46] | Schonhoff AM , Williams GP , Wallen ZD , Standaert DG , Harms AS ((2020) ) Innate and adaptive immune responses in Parkinson’s disease. Prog Brain Res 252: , 169–216. |
[47] | Harms AS , Thome AD , Yan Z , Schonhoff AM , Williams GP , Li X , Liu Y , Qin H , Benveniste EN , Standaert DG ((2018) ) Peripheral monocyte entry is required for alpha-Synuclein induced inflammation and Neurodegeneration in a model of Parkinson disease. Exp Neurol 300: , 179–187. |
[48] | Baird JK , Bourdette D , Meshul CK , Quinn JF ((2019) ) The key role of T cells in Parkinson’s disease pathogenesis and therapy. Parkinsonism Relat Disord 60: , 25–31. |
[49] | Ajami B , Bennett JL , Krieger C , McNagny KM , Rossi FM ((2011) ) Infiltrating monocytes trigger EAE progression, but do not contribute to the resident microglia pool. Nat Neurosci 14: , 1142–1149. |
[50] | Akil E , Bulut A , Kaplan I , Ozdemir HH , Arslan D , Aluclu MU ((2015) ) The increase of carcinoembryonic antigen (CEA), high-sensitivity C-reactive protein, and neutrophil/lymphocyte ratio in Parkinson’s disease. Neurol Sci 36: , 423–428. |
[51] | Jin H , Gu HY , Mao CJ , Chen J , Liu CF ((2020) ) Association of inflammatory factors and aging in Parkinson’s disease. Neurosci Lett 736: , 135259. |
[52] | Munoz-Delgado L , Macias-Garcia D , Jesus S , Martin-Rodriguez JF , Labrador-Espinosa MA , Jimenez-Jaraba MV , Adarmes-Gomez A , Carrillo F , Mir P ((2021) ) Peripheral immune profile and neutrophil-to-lymphocyte ratio in Parkinson’s disease. Mov Disord 36: , 2426–2430. |
[53] | Solmaz V , Pekdaç Genç E , Aksoy D , Çevik B , Kurt SG , Benli İ ((2018) ) Parkinson hastalarında nötrofil/lenfosit oranları, C reaktif protein ve sedimantasyon hızlarınındeğerlendirilmesi. Cukurova Med J 43: , 305–311. |
[54] | Garretti F , Agalliu D , Lindestam Arlehamn CS , Sette A , Sulzer D ((2019) ) Autoimmunity in Parkinson’s disease: The role of alpha-synuclein-specific T cells. Front Immunol 10: , 303. |
[55] | Brochard V , Combadiere B , Prigent A , Laouar Y , Perrin A , Beray-Berthat V , Bonduelle O , Alvarez-Fischer D , Callebert J , Launay JM , Duyckaerts C , Flavell RA , Hirsch EC , Hunot S ((2009) ) Infiltration of CD4+ lymphocytes into the brain contributes to neurodegeneration in a mouse model of Parkinson disease. J Clin Invest 119: , 182–192. |
[56] | Gate D , Tapp E , Leventhal O , Shahid M , Nonninger TJ , Yang AC , Strempfl K , Unger MS , Fehlmann T , Oh H , Channappa D , Henderson VW , Keller A , Aigner L , Galasko DR , Davis MM , Poston KL , Wyss-Coray T ((2021) ) CD4(+) T cells contribute to neurodegeneration in Lewy body dementia. Science 374: , 868–874. |
[57] | Lindestam Arlehamn CS , Dhanwani R , Pham J , Kuan R , Frazier A , Rezende Dutra J , Phillips E , Mallal S , Roederer M , Marder KS , Amara AW , Standaert DG , Goldman JG , Litvan I , Peters B , Sulzer D , Sette A ((2020) ) alpha-Synuclein-specific T cell reactivity is associated with preclinical and early Parkinson’s disease. Nat Commun 11: , 1875. |
[58] | Stevens CH , Rowe D , Morel-Kopp MC , Orr C , Russell T , Ranola M , Ward C , Halliday GM ((2012) ) Reduced T helper and B lymphocytes in Parkinson’s disease. J Neuroimmunol 252: , 95–99. |
[59] | Contaldi E , Magistrelli L , Milner AV , Cosentino M , Marino F , Comi C ((2021) ) Expression of transcription factors in CD4 + T cells as potential biomarkers of motor complications in Parkinson’s disease. J Parkinsons Dis 11: , 507–514. |
[60] | Tan EK , Chao YX , West A , Chan LL , Poewe W , Jankovic J ((2020) ) Parkinson disease and the immune system - associations, mechanisms and therapeutics. Nat Rev Neurol 16: , 303–318. |
[61] | Kamath T , Abdulraouf A , Burris SJ , Langlieb J , Gazestani V , Nadaf NM , Balderrama K , Vanderburg C , Macosko EZ ((2022) ) Single-cell genomic profiling of human dopamine neurons identifies a population that selectively degenerates in Parkinson’s disease. Nat Neurosci 25: , 588–595. |
[62] | Smajic S , Prada-Medina CA , Landoulsi Z , Ghelfi J , Delcambre S , Dietrich C , Jarazo J , Henck J , Balachandran S , Pachchek S , Morris CM , Antony P , Timmermann B , Sauer S , Pereira SL , Schwamborn JC , May P , Grunewald A , Spielmann M ((2022) ) Single-cell sequencing of human midbrain reveals glial activation and a Parkinson-specific neuronal state. Brain 145: , 964–978. |
[63] | Lee J , Giordano S , Zhang J ((2012) ) Autophagy, mitochondria and oxidative stress: Cross-talk and redox signalling. Biochem J 441: , 523–540. |
[64] | Chohan H , Senkevich K , Patel RK , Bestwick JP , Jacobs BM , Bandres Ciga S , Gan-Or Z , Noyce AJ ((2021) ) Type 2 diabetes as a determinant of Parkinson’s disease risk and progression. Mov Disord 36: , 1420–1429. |
[65] | Dhanwani R , Lima-Junior JR , Sethi A , Pham J , Williams G , Frazier A , Xu Y , Amara AW , Standaert DG , Goldman JG , Litvan I , Alcalay RN , Peters B , Sulzer D , Arlehamn CSL , Sette A ((2022) ) Transcriptional analysis of peripheral memory T cells reveals Parkinson’s disease-specific gene signatures. NPJ Parkinsons Dis 8: , 30. |

